 Hao Zhang1
 Xinrong Su
- 1Key Laboratory for Thermal Science and Power Engineering of Ministry of Education, Department of Energy and Power Engineering, Tsinghua University, Beijing, China
- 2Science and Technology on Thermal Energy and Power Laboratory, Wuhan, China
The flow in the turbine endwall region consists of the complicated secondary flow structures driven by the lateral pressure gradient, which heavily affects the performance of film cooling. In this work, the film-cooling hole design optimization is performed considering the existence of the lateral pressure gradient in the real flow environment. Results have shown that the optimal film-cooling hole design is heavily influenced by the lateral pressure gradient in the endwall region, especially the compound angle design is clearly different from the flat plate flow environment. The optimization results are further validated with experiments using the pressure-sensitive paint (PSP) technique, and the film cooling performance is shown to be improved by 42.9%. This work demonstrates the importance of considering the real flow environment in the film-cooling hole design and also can provide guidance to the film-cooling hole design in the endwall region.
1 Introduction
Film cooling has been widely used to protect the high-temperature components of gas turbines (Bunker, 2005). A low-temperature coolant will be extracted from the compressor and ejected from the holes to form a cooling film on the surface of the turbine blade or the endwall in order to protect the components.
The film cooling performance is heavily influenced by the parameters of film cooling holes. The cylinder hole is among one of the most commonly and easily manufactured cooling holes that have been employed on turbine blades. The geometry of the cylinder holes (the diameter and length) and the hole direction (forward and backward) have been investigated (Leylek and Zerkle, 1994; Burd et al., 1998; Burd and Simon, 1999; Lutum and Johnson, 1999; Baldauf et al., 2002; Park et al., 2015). Compared with that of the cylinder hole, the geometry of the shaped film-cooling hole is much complicated and flexible, and the overall cooling performance is often better than the cylinder hole. Various shaped hole parameters have been studied in terms of film cooling performance, including the hole exit area ratio, hole length–diameter ratio, pitch, compound angle, and laidback angle (Gritsch et al., 1998; Gritsch et al., 2005). It is also indicated that cooling performance can be improved with the shaped hole due to the larger distance between the kidney vortex pair inside the hole (Haven and Kurosaka, 1996). There are also some parameters that are commonly shared regardless of the shape of the cooling hole. For example, the surface roughness (Goldstein et al., 1985) inside the hole also plays a role in cooling performance. In many scenarios, the film cooling holes are configured with large compound angles, mainly to increase the interaction region between the coolant and hot environment. It has been reported that a large compound angle helps improve the adiabatic film cooling performance, especially at high blowing ratios (Schmidt et al., 1996; Haydt and Lynch, 2019). The strong single asymmetric kidney vortex structure is also revealed using particle image velocimetry (PIV) (Aga et al., 2008). However, it should be noticed that most studies on the compound angle are conducted in an ideal flat plate environment, which is different from the real flow environment in turbine.
It is usually difficult to study the film cooling performance considering the real flow environment due to its high complexity. Therefore, most studies only consider a single influencing factor on the cooling performance from the real environment, as shown in Zhou et al. (2018), Chen et al. (2019), and Zhou et al. (2021). Among various turbine structures, the endwall of turbine blades suffers from high thermal load, and the flow environment is extremely complex (as depicted in Wang et al. (1997)), making the analysis of cooling performance more challenging. The endwall secondary flow and lateral pressure gradient have been studied in Friedrichs et al. (1996), and it has been shown that the cooling jets are affected significantly by the secondary flow structures and pressure gradients (Wen et al., 2021; Ding et al., 2022). The film cooling performance is further studied with the rotational endwall environment in Barigozzi et al. (2006) and Suryanarayanan et al. (2010).
Considering the significant influences of the cooling hole and cooling system design, it is important to find an optimal design using the state-of-the-art optimization approaches. Benefiting from the advancement of computational fluid dynamics (CFD), optimization of film cooling has been increasingly explored. Currently, most of the existing studies are based on the adjoint-based gradient method and the surrogate modeling-based method (Song et al., 2016), including the multi-fidelity surrogate model that merges various design principles (Zhang et al., 2019a; Zhang et al., 2019b), the robust optimization considering uncertainties (Lee et al., 2018), the efficient global optimization (Lee et al., 2016), and neural network-based surrogate models (Lee et al., 2012). Leveraging the optimization approaches, the film cooling design can be explored considering multiple optimization objectives, making the final design adaptive to more conditions (Song et al., 2014; Chi et al., 2017). It is also appealing to perform the cooling optimization by taking the real flow environment into consideration.
In this manuscript, we perform the optimization of a single-shaped film-cooling hole considering the influences of the lateral pressure gradient in the real turbine endwall environment. To this end, a curved tunnel is employed as the flow environment, rather than the commonly used flat plate. It should be noticed that there are also other complex fluid physics inside the real endwall environment, and these are left for our future research. The results have indicated that the optimized hole design is heavily influenced by the lateral pressure gradient. This highlights the importance to consider the real flow environment toward the optimized cooling hole design and provides guidance for the film-cooling hole design considering real flow environment.
The manuscript is structured as follows: in Section 2, the geometries of the film-cooling hole and the computation domain are introduced. The optimization framework is mainly discussed in Section 3. In Section 4, we present and analyze the numerical optimization results. The experimental validation results are further shown in Section 5. Conclusion is given in Section 6.
2 Research object
In this work, the shaped film-cooling hole design in the endwall region is of main interest. The baseline design of the shaped film-cooling hole is chosen as the seven-to-seven hole (Schroeder and Thole, 2014), as shown in Figure 1A. The hole design parameters are shown in Table 1.
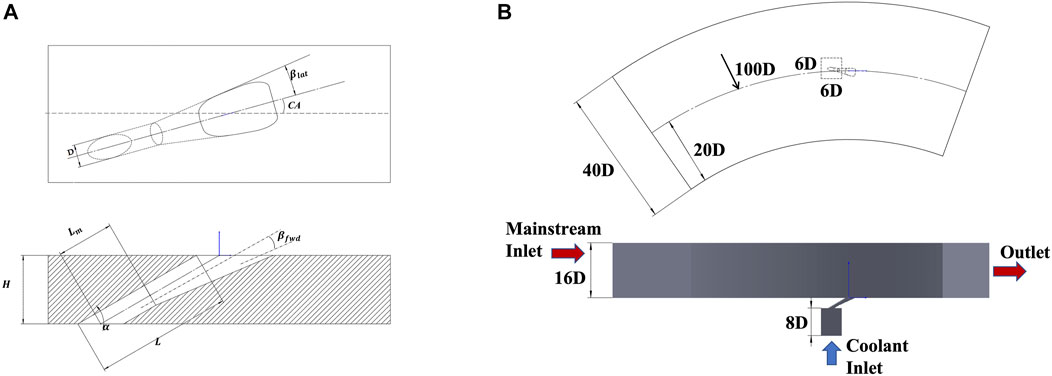
FIGURE 1. (A) Geometry of seven-to-seven film-cooling hole, and (B) the structure of the flow tunnel including the mainstream and coolant.
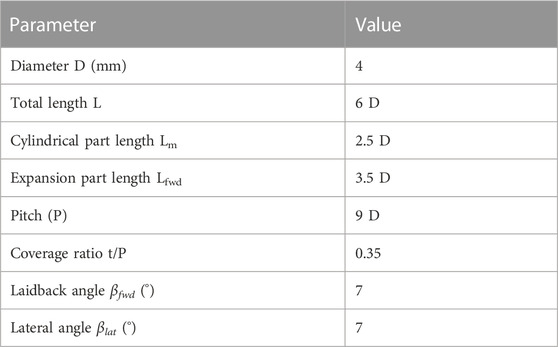
TABLE 1. Geometrical parameters of seven-to-seven film-cooling hole.
The extremely complicated flow environment in the endwall region, as shown in Figure 2 (Wang et al., 1997), has significant influences on the film cooling performance on the endwall. One of the typical flow features is the migration of the coolant caused by the lateral pressure gradient between the pressure side and suction side of the turbine blades. Compared with the ideal flat plate flow environment, the lateral pressure gradient and the horseshoe vortices in the endwall region are the major sources for the generation of the secondary flow and change in film cooling performance. However, due to the complexity of the real flow environment in turbine endwall regions, it is usually difficult to study the influences of these flow features on the film cooling performance separately. In order to address this difficulty, a curved tunnel is designed to solely provide the lateral pressure gradient for film cooling, as shown in Figure 1B. A curved tunnel with a constant width is adopted (Li et al., 2018; Wang et al., 2019), which is determined from the real dimension of the experimental facility. Compared with the ideal flat plate, the lateral pressure gradient is one of the most significant characteristics in the curve tunnel environment. By using the simplification of the curved channel, it is feasible to only study the influences of the lateral pressure gradient in the film-cooling hole design, and other complicated flow features can be isolated.
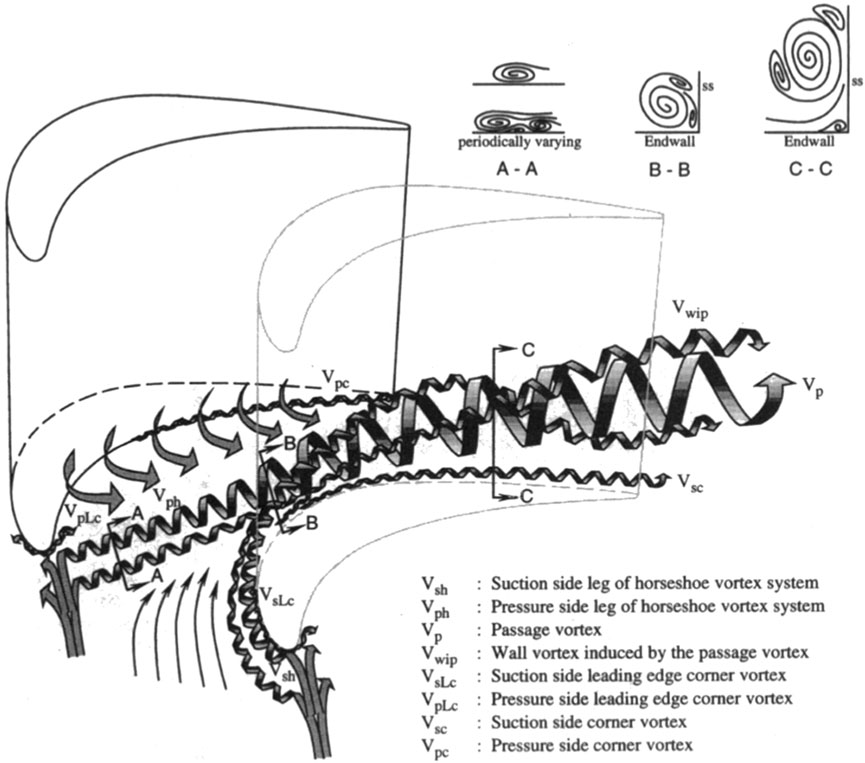
FIGURE 2. Flow structure in the endwall region (Wang et al., 1997).
3 Optimization setup and methods
In this section, first, the overall optimization framework is demonstrated. We further focus on the introduction of the surrogate model, that is, the Gaussian process model, and then on the sequential sampling approach aiming to improve the prediction accuracy of the surrogate model.
3.1 Optimization setup
The goal of this work is to find the optimal film-cooling hole design in terms of adiabatic film cooling performance. To this end, the Bayesian optimization framework is employed, where the Gaussian process model is employed as the surrogate model, and the generic algorithm and sequential quadratic programming (SQP) method are employed to find the design parameters with optimal film cooling performance. The overall optimization framework is shown in Figure 3.
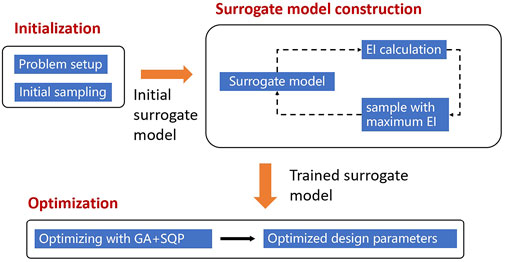
FIGURE 3. Demonstration of the optimization framework.
First, the optimization problem is defined, including the optimization objective, design variables, and the design space. Then, the initial sampling is conducted using the Latin hypercube sampling (LHS) method (Stein, 1987), and an initial surrogate model can be constructed based on these initial samples. In the second step, the initial surrogate model is refined using a sequentially adaptive sampling strategy. In this refining process, an acquisition function, that is, the expected improvement (EI) function, is defined to guide the search of the potential sample positions, with the expectation that the sample with the maximum EI value has the most potential position to find the global optimum. In each update step, the surrogate model is employed to find the sample with the maximum EI value, and then the new obtained sample is combined with the existing samples to construct a new surrogate model. Note that the generic algorithm is employed to find the maximum EI value. The EI-based sampling procedure will terminate when the maximum EI value reaches a threshold, which is set to 10–4. Once the surrogate model is constructed with enough sampling datasets, we proceed to the optimization step using the well-trained surrogate model. The optimization algorithm combines the generic algorithm for the global search and the SQP algorithm for the local search, which can guarantee that the final optimization result is close to the global optimum.
Three design variables are chosen in the optimization problem: compound angle CA, laidback angle βfwd, and lateral angle βlat. With the prior knowledge that larger expanded angles can help improve the film cooling performance in the flat plate flow environment, it is assumed that the film-cooling hole design also shares similar characteristics in the curved channel flow environment. Thus, the design space is constructed with the variables shown in Table 2. The three design variables are assumed to follow the uniform distribution within each interval.
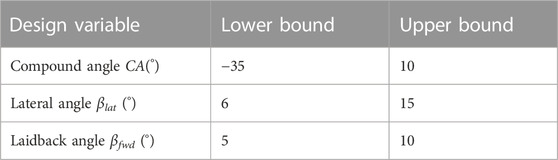
TABLE 2. Design space during the optimization.
The optimization objective is to maximize the spatially averaged adiabatic film cooling effectiveness:
The spatially averaged adiabatic film cooling effectiveness ηs is defined as follows:
where
3.2 Surrogate model
The Gaussian process model is employed as the surrogate model in the optimization framework. Let x = [x1, …, xn] denote the inputs (the design parameter samples), y = [y1, …, yn] denote the corresponding outputs (spatially averaged film cooling effectiveness) obtained from numerical simulation, x* denote the new input, and y* denote the output predicted. In the Gaussian process model, the output variables [y, y*] are assumed to follow the multivariate Gaussian distribution:
where K(x, x) is the n × n covariance matrix, K(x, x*) is the n × 1 covariance vector, K(x*, x) is the 1 × n covariance vector, and K(x*, x*) = σ2 is a scalar.
Furthermore, the kernel function is employed to define the covariance matrix:
where d = 3 denotes the dimension of the input x, and
Following the conditional Gaussian distribution, the output Y* follows the Gaussian distribution with the mean of μ(x*) and variance σ2 (x*):
where
Therefore, the Gaussian process model can provide both the predicted value of y* as the mean value μ(x*) and the prediction uncertainty as the variance σ2 (x*).
3.3 Sequentially adaptive sampling
In order to construct the surrogate model with higher accuracy to find the local optimum, a sequentially adaptive sampling approach is employed to refine the surrogate model. To this end, the EI function is defined to help maintain a balance between the exploration (sampling in the less sampled region) and exploitation (sampling near the local optimum region).
The improvement in the EI function is defined as
where ymin denotes the minimum value of the known output data {y1, …, yn} and Y(x*) denotes the prediction at point x* as a random variable that follows Gaussian distribution:
In order to demonstrate the definition of improvement, we further use a one-dimensional model for illustration. As shown in Figure 4A, the ground-truth function is selected as
We select seven samples to construct the surrogate model using the Gaussian process model. Based on the definition of improvement, we further define the expected improvement (EI) as follows:
where
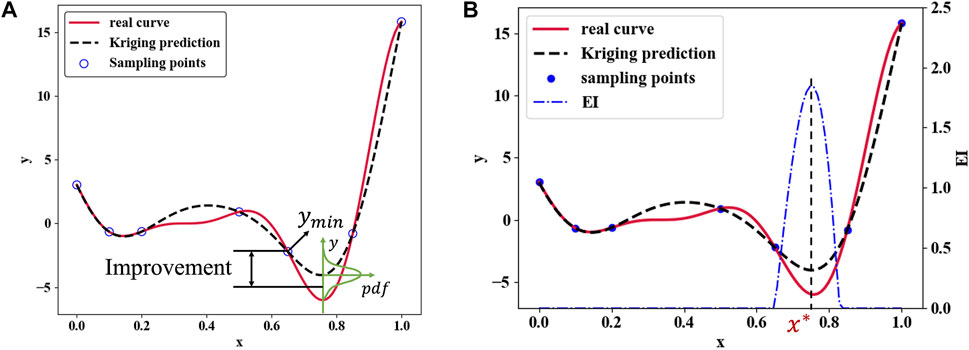
FIGURE 4. (A) Definition of improvement I(x) = max [ymin−Y(x), 0]. (B) EI distribution with seven sampling points; the next sampling point x* is selected with the largest EI value.
The EI distribution with the same test function in Eq. (9) is shown in Figure 4B. The sample at the position x* is selected with the largest EI value. It can be seen that the selected position x* is close to the local global minimum, which shows the effectiveness of the EI-based sampling strategy.
4 Optimization results and analysis
4.1 Numerical setup
The metrics to evaluate the film cooling performance are selected as the laterally averaged and spatially averaged film cooling effectiveness
where R is the radius of the centerline of the curved tunnel. After transformation, the integration area of ηs is shown in Figure 5.
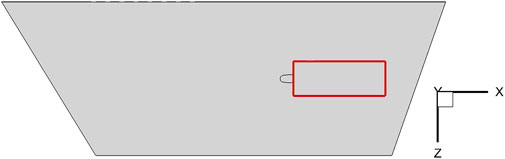
FIGURE 5. Computational domain after coordinate transformation and the integration area to calculate laterally averaged film cooling effectiveness (see the red rectangle).
The uniform total pressure is set to 102360 Pa as the inlet condition, and the atmospheric pressure is set as the outlet condition, which is 101325 Pa. In this setting, the inlet velocity is approximately 35 m/s. The temperature of the mainstream flow and coolant is set to 300 and 270 K, respectively. The constant blowing ratio is set to 2.0, which is defined in the following equation:
where ρjet and ρ∞ are the densities of the coolant and mainstream flow and ujet and uinfty are the flow velocities of the coolant and mainstream flow, respectively. The turbulence intensity is set to 5% for the inlet mainstream and coolant.
A hex-dominated unstructured mesh is generated, as shown in Figures 6A,B. In order to better capture the details of the coolant and mainstream flow structure, the mesh in the interaction region is refined. We set the dense mesh on the outer/inner wall, endwall surface, hole wall, and the coolant cavity walls to capture the boundary layer flow structure. The height of the first layer is set to 1 × 10⁻⁶ m, and the y+ value is under 1 to ensure the better performance of the turbulence model. The top wall of the mainstream cavity is set as a slippery wall, which will help reduce the size of the mesh. After the mesh independence test, finally the mesh contains around 3.2 million elements, as shown in Figure 6C.
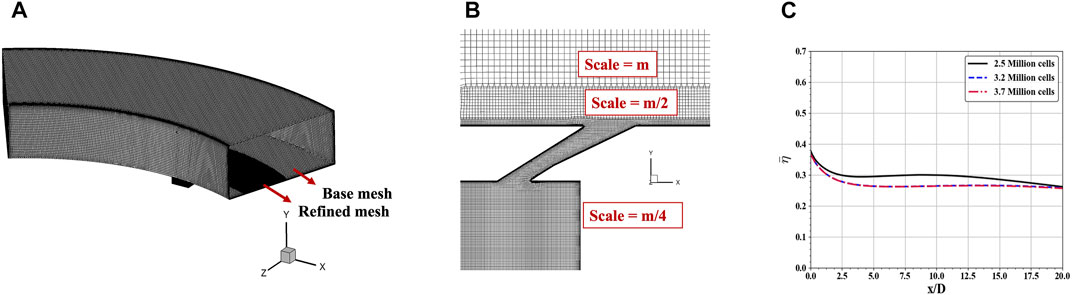
FIGURE 6. Hex-dominated unstructured mesh (A,B) and the grid independence test (C).
In order to select the appropriate turbulence model for the film cooling simulations, three different turbulence models: realizable k−ϵ model (Shih et al., 1995), shear stress transport (SST) model (Menter, 1994), and transitional SST model (Langtry and Menter, 2009), are initially selected and employed to obtain the numerical simulation results, respectively. The numerical simulation results of the laterally averaged film cooling effectiveness are further validated with the experimental results obtained from our previous works (Li et al., 2018; Wang et al., 2019), as shown in Figure 7. It can be seen that the realizable k−ϵ model performs the best compared with the experimental results and thus is selected as the turbulence model for the following numerical simulations.
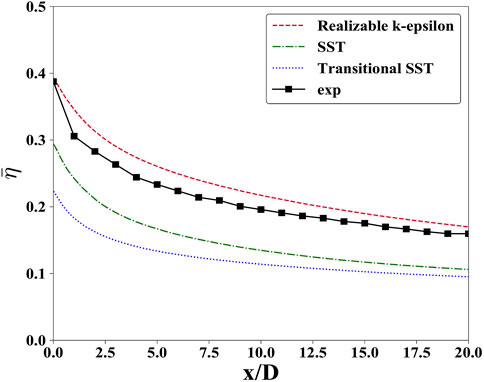
FIGURE 7. Numerical simulation results of the laterally averaged film cooling effectiveness curves obtained from three selected turbulence models, together with the experimental results obtained from Li et al. (2018) and Wang et al. (2019).
4.2 Results and analysis
The surrogate model is initially constructed with 18 samples, which are selected by the LHS method, and then the surrogate model is improved using the sequentially adaptive sampling strategy. The total number of samples is finally determined as 29. As shown in Table 3, after the optimization with the sequentially adaptive sampling strategy, the spatially averaged film cooling effectiveness ηs has been greatly improved from 0.2674 to 0.4050.Compared with the baseline design, both the laidback angle and the lateral angel are clearly expanded, and the compound angle is changed slightly with an angle of 7.8° to the inner wall direction.
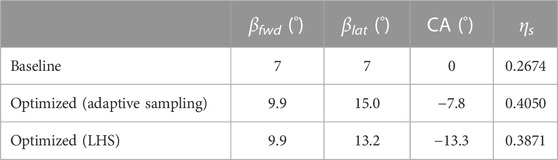
TABLE 3. Results for the baseline and optimized holes.
In order to validate the effectiveness of the constructed surrogate model, we further constructed another Gaussian process model with the same number (29) of samples, and all the samples are obtained using the LHS method. The same optimization algorithms (generic algorithm and SQP algorithm) were employed to find the optimal design. As shown in Table 3, the optimized spatially averaged film cooling performance using this surrogate model is 0.3871, which is lower than the surrogate model constructed with a sequentially adaptive sampling approach. This indicates that the surrogate model constructed with the adaptively selected samples provides higher prediction accuracy at the global optimum region.
The adiabatic film cooling effectiveness distributions of the baseline and optimized hole are shown in the upper row of Figure 8. It can be seen that due to the influences of the lateral pressure gradient, the coolant is migrated from the outer side to the inner side. Since the exit hole area is larger in the optimized hole design, the coolant is expanded much more widely in the optimized hole than the baseline hole. However, the film cooling effectiveness in the centerline region is reduced for the optimized hole, mainly because of less coolant in this region.
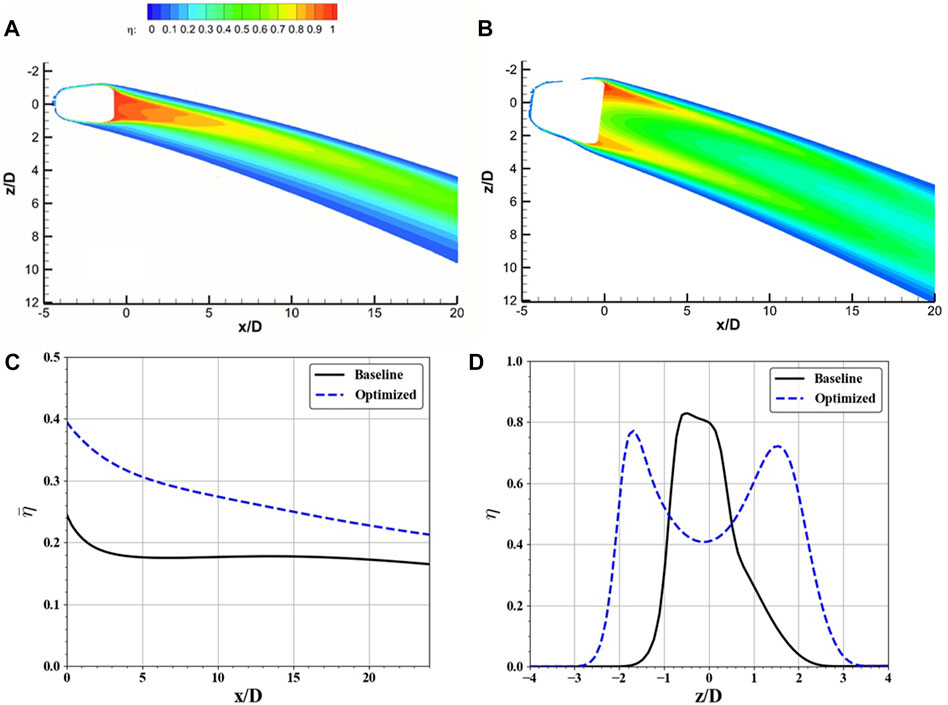
FIGURE 8. Upper row: Baseline (A) and optimized (B) adiabatic film cooling effectiveness distribution contour. Lower row: Laterally averaged film cooling effectiveness distribution (C) and the spanwise film cooling effectiveness distribution at position x/D = 5 (D).
The laterally averaged film cooling performance is shown in Figure 8C. It shows that the overall adiabatic film cooling performance of the optimized hole is improved over the downstream region, mainly due to the wider distribution of coolant in a spanwise direction. The spanwise film cooling effectiveness distribution at x/D = 5 is shown in Figure 8D. It can be seen that the coolant width of the optimized hole is approximately 6.0 D, which is 39.5% higher than the baseline hole with a width of 4.3 D. It also shows that the film cooling performance of the optimized hole in the middle region is dropped compared with the baseline hole, as the peak value of the film cooling effectiveness of the optimized design is 0.76, which is lower than the baseline design with a peak value of 0.84.
In order to explain the improved film cooling performance of the optimized hole, the flow field structures of the two different hole designs are analyzed in detail. Figure 9A shows the x-direction vorticity distribution at the position x/D = 0. Both the kidney vortices and the induced kidney vortices are visible in this figure.The kidney vortice structure of the baseline hole shows that the kidney vortices are no longer symmetrically distributed, mainly due to the interaction between the endwall cross-flow and the kidney vortices. Since the direction of the cross-flow is from the outer wall to the inner wall (see the vr denoted in Figure 9A), the kidney vortices with a positive rotation direction (red color) is much stronger than the kidney vortices with a negative rotation direction (blue color). Although the kidney vortices are also influenced by the cross-flow at the optimized hole’s flow field, it can be clearly seen that the overall vortice intensity is lower than the baseline hole. This is mainly due to the larger exit distance between the kidney vortice pair. This can be further demonstrated in Figure 9B, which shows the spatial distribution of kidney vortices using the Q criterion. It can be seen that there are two pairs of vortices in the baseline design. One is a pair of strong kidney vortices on two sides, and the other is a pair of weaker kidney vortices rotating in the counter direction. However, the kidney vortice structures are clear for the optimized hole due to the low vorticity. The pair of kidney vortices and the induced counter rotating kidney vortices at the hole exit are quite weak, and they develop only a small distance downstream.
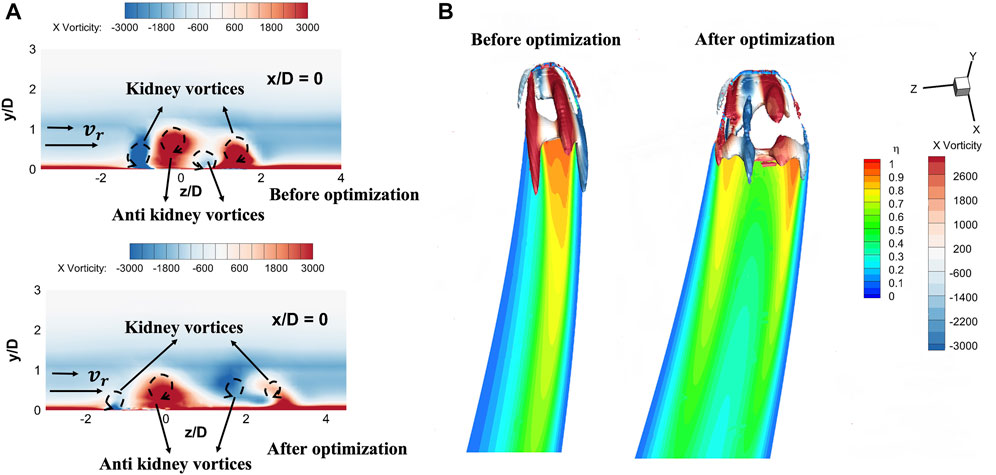
FIGURE 9. (A) Comparison of x-direction vorticity distribution at the hole exit before and after optimization. (B) Comparison of the vortex structure by Q criteria with Q = 1.7 Å ∼ 106 before and after optimization.
The influences of the vortice structures on coolant jet development are further studied. As shown in Figure 10, the spatial distribution of cooling effectiveness is demonstrated at three different downstream distances, including x/D = 5, 10, and 15, respectively. It can be seen that the cross-flow is stronger near the bottom region.Due to the existence of the cross-flow, the coolant is migrated from the outer wall side to the inner wall side, and the coolant near the bottom region is more migrated than that in the higher region. In the flow field of the baseline hole, the strengthened vortices migrate to the inner side and merge with the strengthened induced vortex, making the coolant more difficult to spread on the endwall surface. As a comparison, in the flow field of the optimized hole, since the distance between the outer and inner strengthened vortices is larger, it is more difficult for the two vertices to merge with each other. More importantly, due to the existence of the compound angle in the optimized hole, the flow direction of the coolant jet is deflected to the inner side, which is more aligned with the cross-flow direction. This effect decreases the migration strength of the coolant, and the coolant is developed in a closer distance with the endwall surface. As a result, both the wider outlet distance and the compound angle of the optimized hole contribute to the better cooling performance than the baseline hole design.
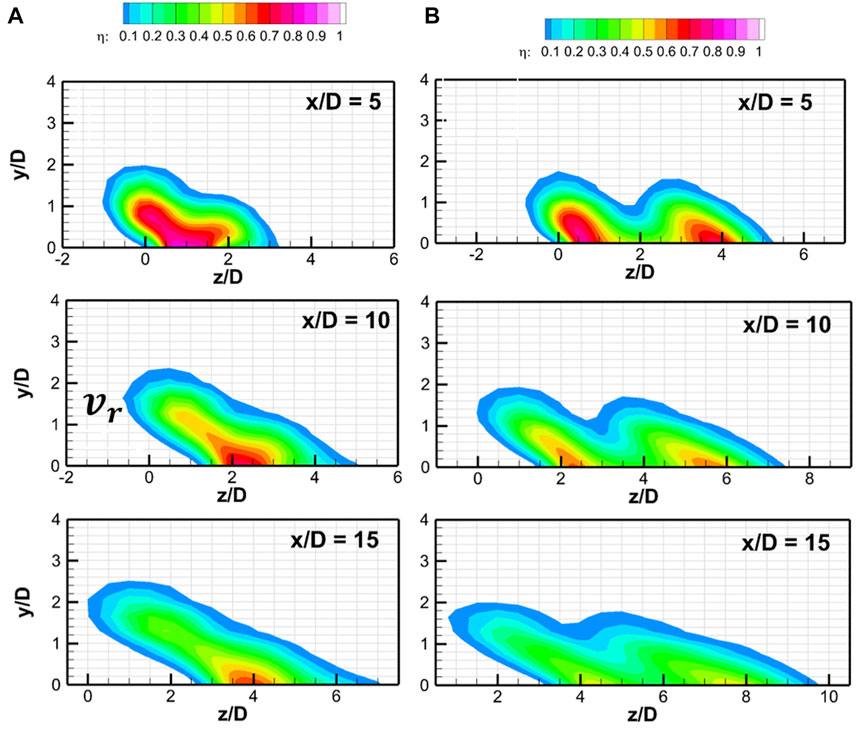
FIGURE 10. Comparison of spatial coolant distribution at x/D = 5, 10, and 15: (A) baseline hole and (B) optimized hole.
Although the aforementioned analysis indicates that the optimal compound angle is more aligned with the mainstream flow direction in the endwall flow environment, it is still unclear whether the optimal angle can be larger as suggested in the flat plate flow environment (see Schmidt et al., 1996; Haydt and Lynch, 2019, for example). In order to further study the influences of the compound angle on the film cooling performance in the endwall flow environment, we performed more numerical simulations with the compound angles ranging from −30° to 40°, where the negative angle indicates that the hole is more toward the outer side of the wall, while the positive angle indicates that the hole is more toward the inner side of the wall. All other settings remain the same with the previous simulations, and the standard baseline hole is employed. The simulation results are shown in Figure 11. It can be seen that, under the endwall flow environment with the lateral pressure gradient, the optimal compound angle is neither −30° nor 40°. Instead, it is close to the value of −20° and is still approximately aligned with the mainstream flow direction. This further validates the optimization result (see Table 3) and further indicates that the design and optimization of the film-cooling hole should consider the local flow environment characteristics, such as the lateral pressure gradient, in the endwall region.
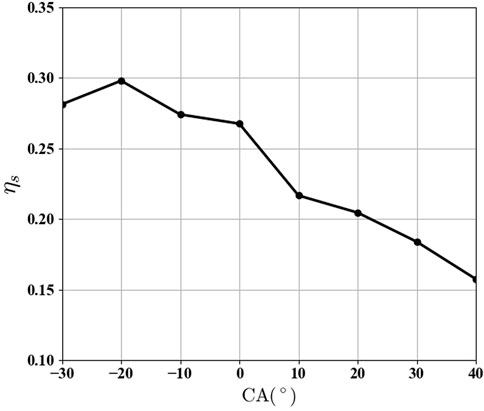
FIGURE 11. Distribution of spatially averaged film cooling effectiveness with different compound angles.
5 Experiment validation of the optimized design
5.1 Experimental setup
In this section, the numerical optimization performance is further validated with experiments. A three-dimensional (3D) printing technology with the precision of 0.05 mm is used to manufacture the curved channel and the test section of the film-cooling hole, as shown in Figure 12A.
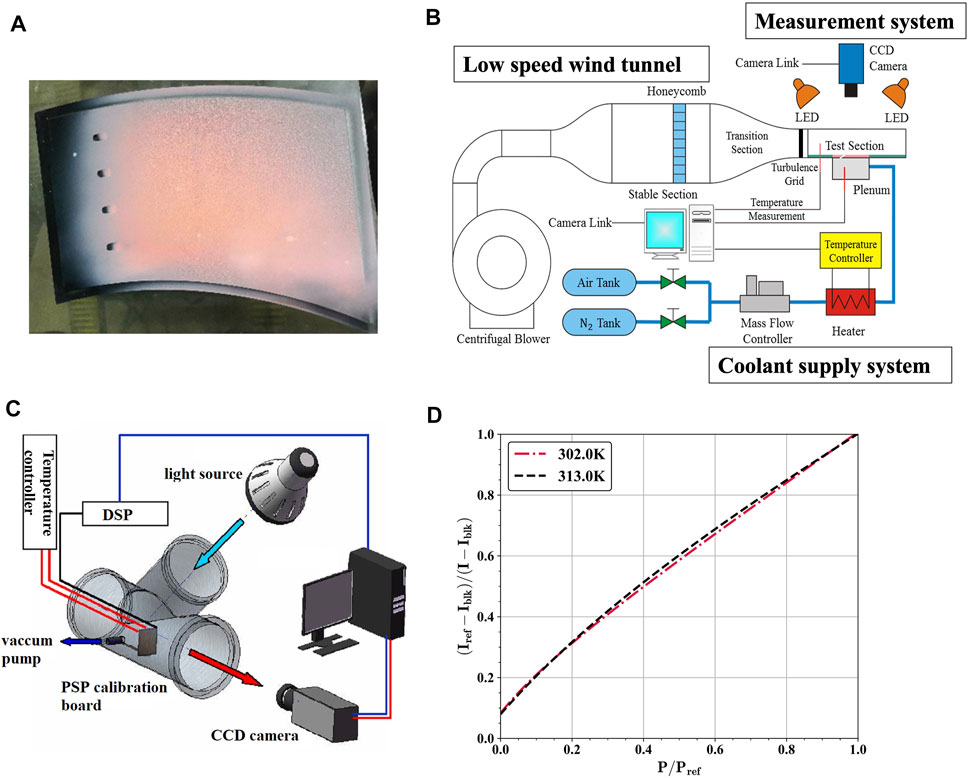
FIGURE 12. Overall experimental configuration consists of (A) test section with PSP, (B) low-speed wind tunnel used to perform the film cooling performance, (C) calibration facility for the PSP experiment, and (D) calibration curves for the PSP measurement.
The low-speed wind tunnel of Tsinghua University is employed in this study, and it is shown in Figure 12B. It is powered by a 95-kW centrifugal blower, and the inlet velocity of mainstream is around 35 m/s.
The pressure-sensitive paint (PSP) technology is employed to get the adiabatic film cooling effectiveness on the endwall. The principle of PSP technology is the heat and mass transfer (Shadid and Eckert, 1991), which means that the local cooling performance is proportional to the local coolant amount. The PSP material has the characteristic that when it is excited by the blue light with a wavelength of 450 nm, the reflected light intensity depends on the local partial pressure of the coolant. Hence, in order to measure the local adiabatic film cooling effectiveness by PSP, we need to calibrate the relationship between the reflected light intensity and the local partial pressure of the coolant. The calibration facility is shown in Figure 12C, together with the calibration curve at two different temperatures shown in Figure 12D. Actually, these two curves are so close that we finally choose the curve with the temperature of 313 K.
The Reynolds number of the mainstream at the test section inlet is around 18,400 at a blowing ratio of 2.0. The turbulence intensity of the mainstream at the inlet of the test section of approximately 5% is also consistent with the numerical setting. A high-precision CCD (charge-coupled device) camera is used in the measurement system to capture the reflected light intensity by the pressure-sensitive paint. N2 is employed as the coolant, which can be seen in the coolant supply system. With previous measurement data, it is found that with the confidence interval of 95%, the uncertainty for PSP measurement is about 15% at lower effectiveness such as 0.05, while the uncertainty is as small as 5% at higher effectiveness such as 0.5. The overall uncertainty level is around 8% for the current measurement. In addition, the uncertainty for the temperature of the mainstream and the flow rate of the coolant gas is about ±0.5 K and ±3%, respectively.
5.2 Experimental analysis
The cooling effectiveness contour result is shown in Figure 13. The film cooling effectiveness distribution of the optimized hole is much wider than that of the baseline hole, and also the cooling performance in the centerline area is not as good as the baseline hole.
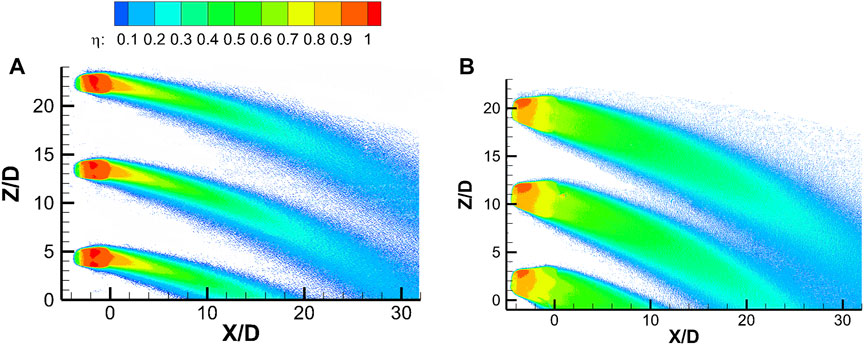
FIGURE 13. Adiabatic film cooling effectiveness contour under blowing ratio of 2.0: (A) baseline hole and (B) optimized hole.
Figure 14 shows the experimental results of the laterally averaged film cooling effectiveness distribution of the baseline and optimized holes. The experimental results of spatially averaged film cooling effectiveness of the baseline hole and optimized hole are 0.149 and 0.213, respectively, and the cooling performance is improved by 42.9% after optimization. It should also be noticed that, compared with the experimental result, the numerical simulation of the laterally averaged film cooling performance (see Figure 8C) is higher for both the baseline hole and optimized hole, which can be mainly caused by the inaccuracy of the turbulence models together with the uncertainties in experimental settings.
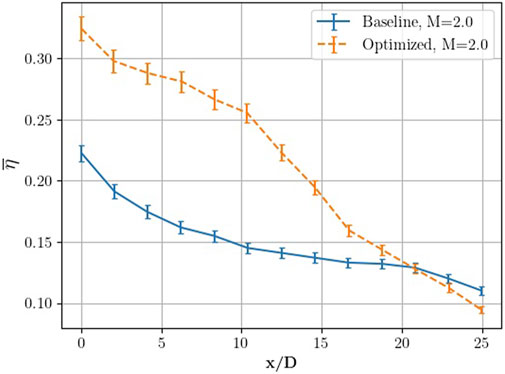
FIGURE 14. Laterally averaged film cooling effectiveness distribution profile with the blowing ratio set to M = 2.0.
From the distribution of laterally averaged film cooling effectiveness, the experiment and simulation results have some deviation in values, but both show the same trend. For the optimized film-cooling hole, the improvement in cooling performance is significant from 0 to 10 times the hole diameter downstream, while the improvement decreased further downstream.
6 Conclusion
The shaped film-cooling hole design optimization is performed considering the lateral pressure gradient in the real turbine endwall environment. In particular, a curved tunnel is used to simulate the endwall flow environment and generate the lateral pressure gradient. Numerical optimization is conducted using a Bayesian optimization framework, and the surrogate model is constructed using a sequentially adaptive sampling approach, which helps improve the film cooling prediction accuracy. The optimization result is further validated with the experiments using PSP techniques, and it shows that the adiabatic spatially averaged film cooling performance has been improved by 42.9%. Compared with the baseline hole design, in the optimized hole design, both the lateral and forward expanded angle are enlarged, and the compound angle is changed toward the inner wall direction. It has been shown that with the larger hole exit area, the lateral spread of the coolant is improved and the exit coolant momentum is lower, which contribute to better cooling performance. More importantly, it has been found that the optimal compound angle is slightly changed, and the coolant direction is more aligned with the local mainstream flow direction. It is noticed that such a compound angle design is different from the flat plate environment, and this can be explained by the interaction mechanisms between the lateral pressure gradient and the kidney vortices. Based on the optimization results, it is suggested that designers should carefully consider the influences of the local lateral pressure gradient in the endwall film-cooling hole design process.
Data availability statement
The raw data supporting the conclusion of this article will be made available by the authors, without undue reservation.
Author contributions
HZ conducted the optimization and experimental validation, also wrote the first draft of the manuscript. JG helped simulation calculation and post-processing, revisions of draft before and after submission. PY’s work includes post-processing and refinement of the manuscript. XS is the corresponding author of the article, and contributes to the conception and design of this study. XY reviewed this work and also helped to improve the manuscript. All authors contributed to manuscript revision, read, and approved the submitted version.
Funding
This work was supported by the National Natural Science Foundation of China (Grant No. 51876098) and National Science and Technology Major Project (J2019-III-0007-0050). This work was also sponsored by the Tsinghua University Initiative Scientific Research Program.
Conflict of interest
The authors declare that the research was conducted in the absence of any commercial or financial relationships that could be construed as a potential conflict of interest.
Publisher’s note
All claims expressed in this article are solely those of the authors and do not necessarily represent those of their affiliated organizations, or those of the publisher, the editors, and the reviewers. Any product that may be evaluated in this article, or claim that may be made by its manufacturer, is not guaranteed or endorsed by the publisher.
References
Aga, V., Rose, M. G., and Abhari, R. S. (2008). Experimental flow structure investigation of compound angled film cooling. J. Turbomach. 130, 031005. doi:10.1115/1.2775491
Baldauf, S., Scheurlen, M., Schulz, A., and Wittig, S. (2002). “Correlation of film cooling effectiveness from thermographic measurements at engine like conditions,” in Turbo Expo 2002, Parts A and B of Turbo Expo: Power for Land, Sea, and Air, Amsterdam, Netherlands, 3-6 June 2002 (International Gas Turbine Institute), 149–162. doi:10.1115/GT2002-30180
Barigozzi, G., Benzoni, G., Franchini, G., and Perdichizzi, A. (2006). Fan-shaped hole effects on the aero-thermal performance of a film-cooled endwall. J. Turbomach. 128, 43–52. doi:10.1115/1.2098788
Bunker, R. S. (2005). Gas turbine handbook: Turbine cooling design analysis. United States: U.S. Department of Energy.
Burd, S. T., Kaszeta, R. W., and Simon, T. W. (1998). Measurements in film cooling flows: Hole L/D and turbulence intensity effects. J. Turbomach. 120, 791–798. doi:10.1115/1.2841791
Burd, S. W., and Simon, T. W. (1999). Turbulence spectra and length scales measured in film coolant flows emerging from discrete holes. J. Turbomach. 121, 551–557. doi:10.1115/1.2841350
Chen, Z., Zhang, Z., Li, Y., Su, X., and Yuan, X. (2019). Vortex dynamics based analysis of internal crossflow effect on film cooling performance. Int. J. Heat Mass Transf. 145, 118757. doi:10.1016/j.ijheatmasstransfer.2019.118757
Chi, Z., Liu, H., and Zang, S. (2017). Multi-objective optimization of the impingement-film cooling structure of a gas turbine endwall using conjugate heat transfer simulations. J. Therm. Sci. Eng. Appl. 10, 021004–021011. doi:10.1115/1.4037131
Ding, S., Chen, S., Wang, S., and Wang, Z. (2022). Multi-objective optimization of circumferential groove casing treatment in an ultra-highly loaded low-reaction transonic compressor rotor. Front. Energy Res. 10, 853360. doi:10.3389/fenrg.2022.853360
Friedrichs, S., Hodson, H. P., and Dawes, W. N. (1996). Distribution of film-cooling effectiveness on a turbine endwall measured using the Ammonia and Diazo technique. J. Turbomach. 118, 613–621. doi:10.1115/95-GT-001
Goldstein, R. J., Eckert, E. R. G., Chiang, H. D., and Elovic, E. (1985). Effect of surface roughness on film cooling performance. J. Eng. Gas Turbines Power 107, 111–116. doi:10.1115/1.3239669
Gritsch, M., Colban, W., Schar, H., and Dobbeling, K. (2005). Effect of hole geometry on the thermal performance of fan-shaped film cooling holes. J. Turbomach. 127, 718–725. doi:10.1115/1.2019315
Gritsch, M., Schulz, A., and Wittig, S. (1998). Adiabatic wall effectiveness measurements of film-cooling holes with expanded exits. J. Turbomach. 120, 549–556. doi:10.1115/1.2841752
Haven, B., and Kurosaka, M. (1996). “The effect of hole geometry on lift-off behavior of coolant jets,” in 34th Aerospace Sciences Meeting and Exhibit, Reno, NV, USA, 15-18 January 1996 (American Institute of Aeronautics and Astronautics), 96–0618. doi:10.2514/6.1996-618
Haydt, S., and Lynch, S. (2019). Cooling effectiveness for a shaped film cooling hole at a range of compound angles. J. Turbomach. 141, 041005. doi:10.1115/1.4041603
Langtry, R. B., and Menter, F. R. (2009). Correlation-based transition modeling for unstructured parallelized computational fluid dynamics codes. AIAA J. 47, 2894–2906. doi:10.2514/1.42362
Lee, K.-D., Kim, S.-M., and Kim, K.-Y. (2012). “Numerical analysis of film-cooling performance and optimization for a novel shaped film-cooling hole,” in Heat Transfer, Parts A and B of Turbo Expo: Power for Land, Sea, and Air, Copenhagen, Denmark, 11-15 June 2012 (International Gas Turbine Institute), 1345–1355. doi:10.1115/GT2012-68529
Lee, S., Hwang, W., and Yee, K. (2018). “Robust film cooling hole shape optimization considering surface roughness and partial hole blockage,” in Heat Transfer of Turbo Expo: Power for Land, Sea, and Air, Copenhagen, Denmark, 10 June 2018 (International Gas Turbine Institute), V05CT20A004. doi:10.1115/GT2018-76424
Lee, S., Rhee, D.-H., Cha, B. J., and Yee, K. (2016). “Film cooling performance improvement with optimized hole arrangement on pressure side surface of nozzle guide vane: Part I - optimization and numerical investigation,” in Heat Transfer of Turbo Expo: Power for Land, Sea, and Air, Seoul, Korea, 13-17 June 2016 (International Gas Turbine Institute), V05CT12A010. doi:10.1115/GT2016-57975
Leylek, J. H., and Zerkle, R. D. (1994). Discrete-jet film cooling: A comparison of computational results with experiments. J. Turbomach. 116, 358–368. doi:10.1115/1.2929422
Li, Y., Zhang, Y., Su, X., and Yuan, X. (2018). Experimental and numerical investigations of shaped hole film cooling with the influence of endwall cross flow. Int. J. Heat Mass Transf. 120, 42–55. doi:10.1016/j.ijheatmasstransfer.2017.11.150
Lutum, E., and Johnson, B. V. (1999). Influence of the hole length-to-diameter ratio on film cooling with cylindrical holes. J. Turbomach. 121, 209–216. doi:10.1115/1.2841303
Menter, F. R. (1994). Two-equation eddy-viscosity turbulence models for engineering applications. AIAA J. 32, 1598–1605. doi:10.2514/3.12149
Park, S., Jung, E. Y., Kim, S. H., Sohn, H.-S., and Cho, H. H. (2015). Enhancement of film cooling effectiveness using backward injection holes. Int. J. Therm. Sci. 110, 314–324. doi:10.1115/GT2015-43853
Schmidt, D. L., Sen, B., and Bogard, D. G. (1996). Film cooling with compound angle holes: Adiabatic effectiveness. J. Turbomach. 118, 807–813. doi:10.1115/1.2840938
Schroeder, R. P., and Thole, K. A. (2014). “Adiabatic effectiveness measurements for a baseline shaped film cooling hole,” in ASME Turbo Expo 2014: Turbine Technical Conference and Exposition, Dusseldorf, Germany, 16-20 June 2014 (International Gas Turbine Institute), V05BT13A036. doi:10.1115/GT2014-25992
Shadid, J. N., and Eckert, E. R. G. (1991). The mass transfer analogy to heat transfer in fluids with temperature-dependent properties. J. Turbomach. 113, 27–33. doi:10.1115/1.2927734
Shih, T.-H., Liou, W. W., Shabbir, A., Yang, Z., and Zhu, J. (1995). A new k−ϵ eddy viscosity model for high Reynolds number turbulent flows. Comput. fluids 24, 227–238. doi:10.1016/0045-7930(94)00032-T
Song, L., Guo, Z., Li, J., and Feng, Z. (2016). Research on metamodel-based global design optimization and data mining methods. J. Eng. Gas Turbines Power 138, 092604. doi:10.1115/1.4032653
Song, Y., Guo, Z., Song, L., Li, J., and Feng, Z. (2014). “Multi-objective and multi-disciplinary optimization of gas turbine blade profile and cooling system using conjugate heat transfer analysis,” in Turbomachinery of Turbo Expo: Power for Land, Sea, and Air, Dusseldorf, Germany, 16-20 June 2014 (International Gas Turbine Institute), V02BT45A005. doi:10.1115/GT2014-25495
Stein, M. (1987). Large sample properties of simulations using Latin hypercube sampling. Technometrics 29, 143–151. doi:10.1080/00401706.1987.10488205
Suryanarayanan, A., Ozturk, B., Schobeiri, M. T., and Han, J. C. (2010). Film-cooling effectiveness on a rotating turbine platform using pressure sensitive paint technique. J. Turbomach. 132, 041001–041013. doi:10.1115/1.3142860
Wang, H., Olson, S. J., Goldstein, R. J., and Eckert, E. R. G. (1997). Flow visualization in a linear turbine cascade of high performance turbine blades. J. Turbomach. 119, 1–8. doi:10.1115/1.2841006
Wang, Q., Su, X., and Yuan, X. (2019). “Large-eddy simulation of shaped hole film cooling with the influence of cross flow,” in Proceedings of ASME Turbo Expo 2019, Phoenix, Arizona, USA, 17-21 June 2019 (International Gas Turbine Institute), V05AT12A005. doi:10.1115/GT2019-90180
Wen, F., Luo, Y., Wang, S., Wang, S., and Wang, Z. (2021). Numerical study on the biomimetic trailing edge of a turbine blade under a wide range of outlet mach numbers. Front. Energy Res. 9. doi:10.3389/fenrg.2021.789246
Williams, C. K., and Rasmussen, C. E. (2006). Gaussian processes for machine learning. Cambridge, MA: MIT press.
Zhang, H., Li, Y., Chen, Z., Su, X., and Yuan, X. (2019a). “Multi-fidelity based optimization of shaped film cooling hole and experimental validation,” in Proceedings of ASME Turbo Expo 2019, Phoenix, Arizona, USA, 17-21 June 2019 (International Gas Turbine Institute), V02DT46A001. doi:10.1115/GT2019-90088
Zhang, H., Li, Y., Chen, Z., Su, X., and Yuan, X. (2019b). Multi-fidelity model based optimization of shaped film cooling hole and experimental validation. Int. J. Heat Mass Transf. 132, 118–129. doi:10.1016/j.ijheatmasstransfer.2018.11.156
Zhou, X., Qin, R., and Cai, L. (2021). Research on the hole length ratio of fan-shaped holes in flat plate film cooling. Front. Energy Res. 9, 784654. doi:10.3389/fenrg.2021.784654
Keywords: film cooling, lateral pressure gradient, optimization, surrogate model, experimental validation
Citation: Zhang H, Gou J, Yin P, Su X and Yuan X (2023) Film-cooling hole optimization and experimental validation considering the lateral pressure gradient. Front. Mech. Eng 8:973293. doi: 10.3389/fmech.2022.973293
Received: 20 June 2022; Accepted: 21 December 2022;
Published: 09 January 2023.
Edited by:
Florent Duchaine, Centre Europeen De Recherche Et De Formation Avancee En Calcul Scientifique, FranceReviewed by:
Davide Lengani, University of Genoa, ItalyLiming Song, Xi’an Jiaotong University, China
Copyright © 2023 Zhang, Gou, Yin, Su and Yuan. This is an open-access article distributed under the terms of the Creative Commons Attribution License (CC BY). The use, distribution or reproduction in other forums is permitted, provided the original author(s) and the copyright owner(s) are credited and that the original publication in this journal is cited, in accordance with accepted academic practice. No use, distribution or reproduction is permitted which does not comply with these terms.
*Correspondence: Xinrong Su, c3V4ckBtYWlsLnRzaW5naHVhLmVkdS5jbg==