 I. Carvajal-Mariscal
 J. E. De León-Ruiz
 J. M. Belman-Flores
 E. Martínez-Espinosa
 O. José-Pineda1
- 1Instituto Politécnico Nacional, ESIME-UPALM, CDMX, Mexico city, Mexico
- 2Centro de Investigación en Materiales Avanzados S.C, CIMAV, Chih, Chihuahua, Mexico
- 3Department of Mechanical Engineering, DICIS, Universidad de Guanajuato, Guanajuato, Mexico
- 4Instituto de Ingeniería, Universidad Nacional Autónoma de México, Ciudad Universitaria, Madrid, Mexico
Present work focuses on frost accretion in a spine-finned inverted-V tube array evaporator. An experimental evaluation was performed using a standard issue, vertical top-mount, 18 cubic feet, 0.5 m3, refrigerator. Evaporator temperature distribution, inner airflow velocity, and relative humidity were measured to account for convective phenomena influencing frost distribution. Frost formation and accretion on the surface of the evaporator were visualized using thermal and microscopic imagery. The images were processed using a machine vision algorithm to measure frost thickness. Complementarily, frost density and vapor mass transfer were computed using available correlations. An estimation function was derived from the compiled data using a semi empirical approach, i.e., direct measurements and thermophysical substance properties. The resulting mathematical expression estimated the frost accretion rate within an error expectancy, RMSE, of 0.1479 and displayed a goodness-of-fit, R-Squared, of 0.9029. Based on these results, semi empirical estimation, is proposed as a viable approach to construct adequate limits for new predictions, vis-à-vis evaporator performance, ultimately reducing appliance energy consumption via implementing more effective control strategies regarding internal defrosting.
1 Introduction
Currently, vapour-compression refrigeration remains the most employed heat pumping system worldwide; from domestic to commercial/industrial applications. The utilization of these devices entails a large energy consumption, since cooling is, inherently, a more energy-intensive task than heating. Furthermore, given the intricacies associated with their operation, as well as new service schemes, several additional energy requirements arise, such as i) icemaking; ii) water chiller/heater; iii) intelligent lighting and; iv) defroster, among others. From these sources, automatic defrosting has been acknowledged as the one with the most contribution to energy expenditure, outside the inherent thermal conveyance of the vapour compression cycle; requiring the use of an additional heating element, usually an electrical resistance, to ensure proper performance of the refrigerator.
Heat removal within a confined space, separates the water contained within the air, given the difference in thermophysical properties of both fluids. This humidity ratio is considerably increased given the inherent humidity within the contained products, particularly when applied towards food storage. The resulting amount of water vapour, when coming in contact with inside surfaces, i.e., exposed area of the evaporator, forms a thin layer of ice, since evaporator surface remains at a lower temperature.
As this layer of ice thickens, i.e., frost accretion, thermal resistance increases and air flow is constricted, hindering the thermal performance of the heat exchanger (Song and Dang, 2018). Several factors are involved in frost formation; i) environmental, such as air temperature, relative humidity and speed; as well as ii) design/structural, such as heat exchanger temperature, geometry and operation scheme (Suresh Patil et al., 2017; Badri et al., 2021).
1.1 Frost growth measurement and estimation
Within the reviewed literature, several studies apply advanced techniques to measure frost growth, and/or thickness in domestic refrigerators. Xiao et al. (2009), use a photoelectric sensor to measure frost thickness on a flat-plate finned-tube heat exchanger. They found that these sensors can detect the frost height directly and accurately, thus proposed as suitable options for defrost-control applications. Similarly, Andrade-Ambríz et al. (2022a) use an acoustic dampening technique. Using an active speaker and conventional microphone, they estimate frost accumulation on the surface of a spine-finned evaporator. They devised two reduced-size, smart models, which could be trained quickly, instantly estimating the amount of frost, obtaining an overall accuracy of 94%. Wang et al. (2010) used a digital image processing technique to measure the thickness of growing frost in a fin-and-tube heat exchanger (Lee and Kwon, 2021). The images were taken using a CCD camera, obtaining an uncertainty within ∼0.18 mm.
Alternatively, several low-cost alternatives have been developed. In (Andrade-Ambriz et al., 2022b), an RGB sensor is used, coupled with an intelligent model to process, and classify, visual information of frost accumulation on the surface of an evaporator. It is reported that this implementation is a low-cost scheme, with accuracy reaching as high as 99.75%. Similarly, capacitive sensors (Shen et al., 2018; Shen and Wang, 2019) have been known to be an adequate alternative. In (Shen and Wang, 2019) a technique using these devices was developed and used to detect frost growth in real-time. It was found that the frost porosity, measured by the proposed technique, agrees well with the averaged measurement approach, yielding maximum differences of 3.4%.
On the other hand, the development of estimation functions is considered a convenient, low-cost alternative to system performance prediction/evaluation. However, despite their ease of implementation, estimation functions do have an inherent degree of uncertainty, or fit deviation, associated with the assumptions made during their construction. Albeit not as precise as the previously reviewed systems/setups, estimation functions help characterize the thermal behaviour of the selected heat exchanger. In this case, by properly determining required defrosting times, overall system performance is increased without hindering the efficiency of the evaporator heat exchange rate. However, in most cases, developed estimation functions pertain exclusively to the studied fin-surface configuration/geometry. Therefore, it is implicitly remarked that frost accretion must to be determined, and evaluated, for every instance.
Published works relate, mostly, to studies conducted in flat-plate surfaces (Léoni et al., 2016), where it has been determined, through model development and experimentally, that surface temperature, frost density and thermal conductivity are fundamental parameters to estimate the rate of frost growth (Hermes, 2012; Negrelli et al., 2016). However, commonly used industrial refrigeration systems tend to favour fin-and-tube surfaces (Aljuwayhel et al., 2008; Knabben et al., 2011; Xue et al., 2017); with domestic applications favouring annular or spiral finned tubes (Senshu and Yasuda, 1990; Kondepudi and O'Neal, 1993; Yan et al., 2003). Furthermore, studies have been published regarding frost formation on heat exchangers with louvered fins (Dogan et al., 2015; Kim et al., 2016), triangular spine and pin fins (Kondepudi and O'Neal, 1988; Kondepudi and O'Neal, 1992) as well as other less frequent fin configurations/geometries (Timmermann et al., 2018; Wu et al., 2016; Kondepudi and O'Neal, 1991).
1.2 Frost in spine-finned heat exchangers
From the conducted literature review, it was found that information concerning spine-shaped extended surfaces is rather scarce, given their particular geometry, as well as the specific applications for which these are mostly employed. Lee et al. (2002) studied heat transfer of a spine-finned inline tube heat exchanger. It was found that when compared, to dry conditions against discrete and continuous flat-plate-finned tubes, spines enhance heat transfer due to higher intensity on convective heat flow.
Additionally, Kempiak and Junge (2014) proposed a pitch offset in spine distribution, which resulted in a 30% increase of convective heat transfer when compared to a traditional spine-fin array. However, this study measures heat transfer and pressure drop, solely, over a single pipe. Therefore, it is not possible to ascertain, accurately, the effect said fin-tube combination has on overall heat exchanger performance in terms of its physical configuration, i.e., tube array.
Complementarily, José Pineda et al. (2017) studied, at dry conditions, heat transfer and pressure drop of a heat exchanger with an inverted-V tube array and spines as extended surfaces. This configuration resulted in heat transfer enhancement, particularly at lower air flow speeds, i.e., < 1 m/s, when compared against heat exchangers with a traditional inline tube array (Lee et al., 2002).
1.3 Aim and scope
This research expands on the data/information presented in (José Pineda et al., 2017). A case study involving a spine-finned inverted-V tube array evaporator is presented. Conducted assessments include:
• The utilization of thermal imagery to determine the homogeneity of frost deposition across the surface of the evaporator and to ascertain its effect on appliance operation.
• The implementation of a machine vision scheme to measure average frost accretion, and its effective thickness, as well as to determine its crystalline structure.
• The construction of an estimation function through a semi empirical approach; using known correlations and mathematical expressions, available in reviewed literature, to estimate frost accretion, based on direct measurement of involved experimental units.
The presented modelling approach is capable of predicting, and evaluating, frost accretion over the surface of the showcased evaporator, thanks to the comprehensive experimental scheme. However, this case study is presented as an integral approach, i.e., efficiency enhancement of the entire appliance. Thus, its reach is limited to this appliance capacity and operation conditions.
Non-etheless, based on the data here presented, this modelling approach is proposed, as a relatively accurate alternative to construct, and implement, efficient control strategies which would enhance the performance of domestic refrigeration systems, via characterization of effective worktime as a function of defrosting cycles.
2 Materials and methods
2.1 Case study
To effectively characterize frost accretion under nominal operation conditions, a standard issue, vertical top-mount, 18 cubic feet, 0.5 m3, refrigerator is employed. The experimental setup was designed around the structural limitation of the appliance, and to avoid changing its physical configuration. Overall, the appliance uses R134a as working fluid, a 280 W compressor and a copper capillary tube as expansion device. The condenser is a forced convection wire-on-tube heat exchanger. The evaporator, shown in Figure 1A, is comprised of an aluminium pipe bent to form 2 rows of 6 sections, in an inverted-V pattern in air flow direction, as seen in Figures 1B, C. The evaporator body has aluminium spines rolled over its surface acting as fins. The configuration and dimensions of these surfaces are seen in Figure 2. Analogically, based on their geometric shape, the spine fins are considered small-scale flat plates, with a design pitch of 7 fins per inch. Primary geometric features of the complete evaporator assembly, are presented in Table 1.
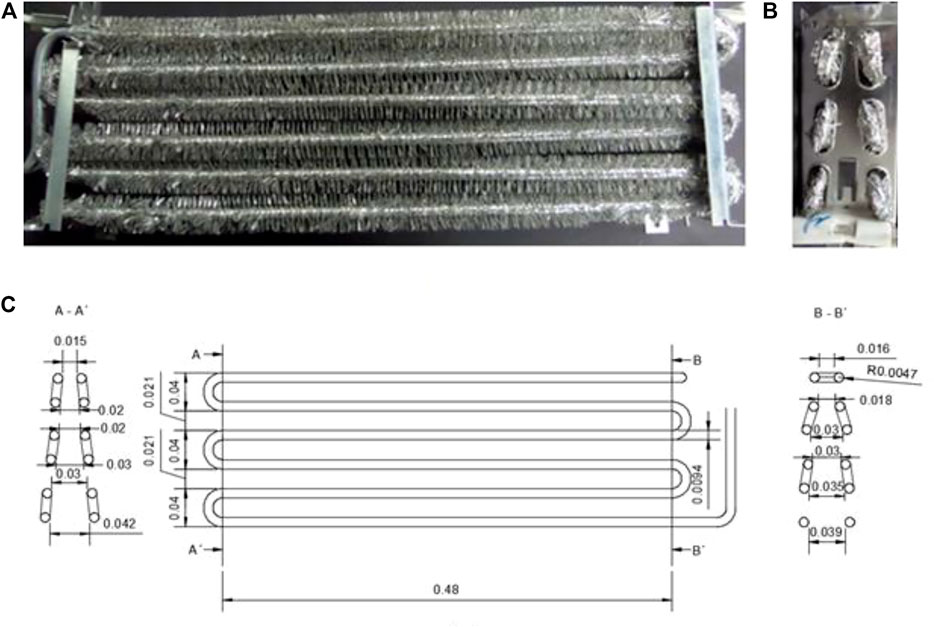
FIGURE 1. Spine-finned, inverted-V evaporator (José Pineda et al., 2017). (A) Frontal view (serpentine bundle); (B) side view (inverted-V tube array); (C) evaporator dimensions.
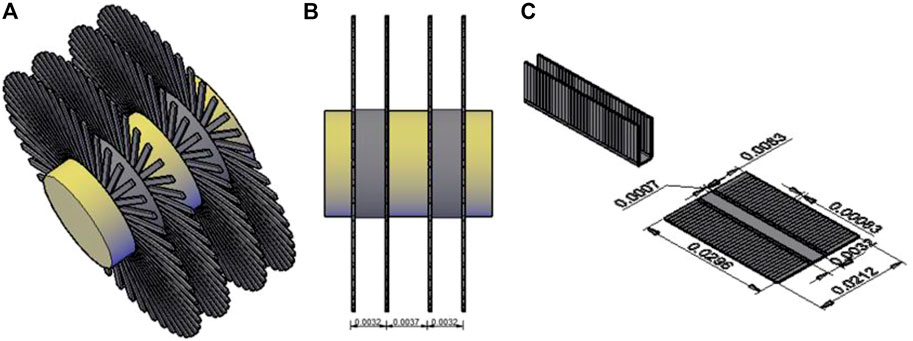
FIGURE 2. Spine fins configuration. (A) Isometric view and fin distribution; (B) side view and fin spacing; (C) rolled out contact surface and fin dimensions.
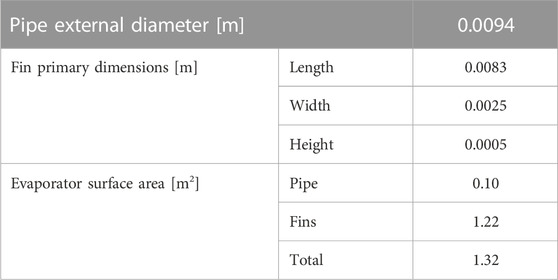
TABLE 1. Primary dimensions of the evaporator.
It is worth noting that, after being fitted over the evaporator surface, fin arrangement results in a random pattern, as seen in Figure 1A, which is attributed to the involved manufacturing process; the mechanical action of rolling/bonding the fin strip shown in Figure 2C.
To visualize frost formation and accretion, a 520 mm × 250 mm rectangular cut-out was made on the backside of the refrigerator. This cut-out was covered with two 6 mm thick silicate glass panels. The air between the glass panels was removed with a vacuum pump to: i) reduce external heat infiltration and; ii) avoid windowpane frost; mitigating visualization nuisances. Additionally, two more 110 mm × 140 mm cut-outs were performed inside the refrigerator. These were covered with 3 mm thick clear acrylic, to visualize frost formation on the sides of the evaporator. Described modifications are shown in Figures 3B, C, respectively.
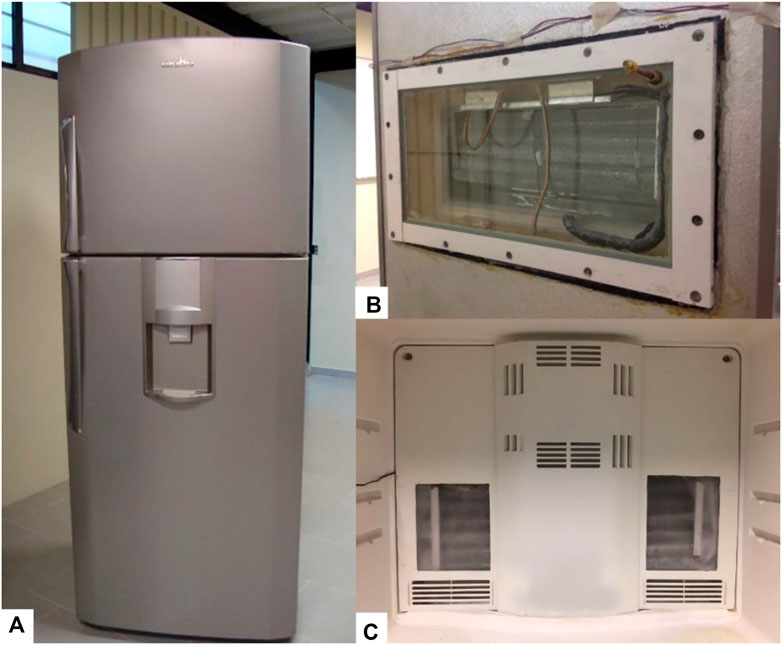
FIGURE 3. Modifications to the experimental setup. (A) Top-mount refrigerator; (B) backside cut-out; (C) inside cut-outs.
2.2 Instrumentation
To determine the operation temperatures corresponding to maximum frost accretion, thermal imagery was employed. A FLUKE-TiR3FT thermal camera was utilized; adjusting its temperature range between −30°C and 100°C. The imagery was captured at a 1 m from visualization cut-out/window, without the glass panel and whilst the refrigerator was working; from compressor start to moments before auto defrost. To ascertain the type of frost and analyse its local accretion rate over the surface of the fins, a 2 MP STEREN digital microscope was utilized for image augmentation/enhancement, specifically, a magnification interval of 50–500X.
Operation cycles were determined indirectly, by measuring compressor power consumption, utilizing a ELNET LT powermeter, with a power factor ± 1 and a range of 0 V–550 V and 45 Hz–65 Hz.
Additional temperature measurements were performed at the surface of the inner and outer facing rows of the evaporator, with type T thermocouples, with a precision of ± 0.1°C and calibrated within a range of −30°C and 40°C. These were fitted on both fin and pipe surfaces; distributed as shown in Figure 4.
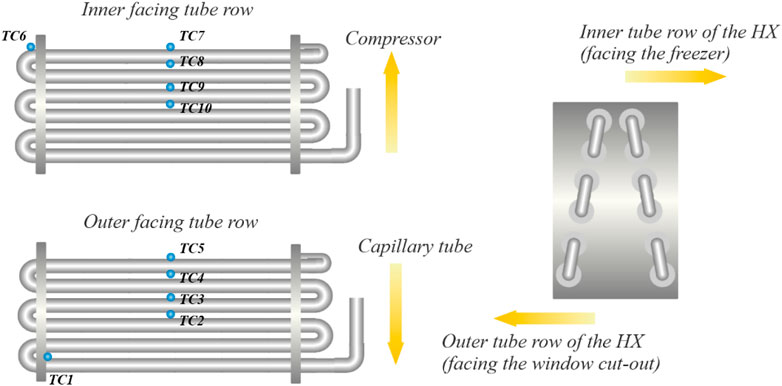
FIGURE 4. Instrumentation schematic.
To measure the relative humidity, two CAREL DPDC210000 hygrometers were used. Air flow speed was measured using a DWYER 641-LED-NIST hot wire anemometer, positioned at evaporator inlet. Temperature data acquisition was performed using a Pacific Instruments PI 600DAS scanner, whilst the remaining factors were compiled with a National Instruments card and a LabVIEW interface. All data was recorded in ten-second intervals during refrigerator nominal worktime.
Uncertainty analysis was conducted employing the methodology proposed by Coleman and Steel (Coleman and Steele, 2009) and employing a 95% confidence interval. Computation resulted in the following values: i) ± 9% for air flow speed; ii) ± 8% for air flow pressure drop and; iii) ± 5% for heat flow yielded by the extended surface. The high uncertainty associated to air flow speed, is ascribed to a lower number of measurements; however, since all remain below 10% these values are considered acceptable for the presented procedure.
2.3 Experimental procedure
The refrigeration system was initially tested, in continuous operation, during 15 power cycles or, approximately, 24 h–27 h, determined from the characteristic behaviour based on electric consumption fluctuation. This preliminary assessment was conducted to ascertain the inherent defrosting routine and further experimental work was limited to operation between the end of one defrosting cycle and the beginning of the next.
Treatments were performed within a semi-controlled enclosure, with an average relative humidity of 50% ± 1% and temperature of 22°C ± 0.5°C. When operating without stored product, collected frost mass amounted to quantities below 10 g of water. Therefore, to foster significative frost formation, inside the refrigerator were stored 15 receptacles, of various sizes, containing 8 L of water. After several defrosting cycles, water mass was collected, amounting, on average, to 0.172 kg, with a maximum difference between treatments of 0.004 kg. This procedure revealed the cycle stability, as well as the consistency of the devised procedure.
2.4 Frost modelling
To determine the rate at which frost grows on the surface of an evaporator, reviewed literature presented several expressions to calculate its change in thickness,
For the presented work, Eq. 1a, proposed by Aljuwayhel (Aljuwayhel et al., 2007), was used as starting point to measure frost growth. The author considered frost growth as a continuous process; hence, this work accounts for relative humidity only during the time, both, compressor and evaporator fan are on. To compute water vapor mass flow, (Malhammar, 1988; Aljuwayhel et al., 2007), make use of a mass balance, Eq. 1b, and to estimate frost density, this work makes use of the semi-empirical correlation presented by Hermes et al. (2014), Eq. 1c.
Albeit, originally derived for flat fins/extended surfaces, these equations are used to estimate frost growth over the evaporator. This approach stems from the geometrical disposition of the spine fins evaporator which, analogically, could be considered as small-scale flat extended surfaces with a particularly high aspect ratio.
Where
3 Results and discussion
3.1 Refrigeration system characterization
Figure 5 shows the characterization of the refrigeration system, during continuous operation, in terms of relative humidity. This approach allows to single out, both, ON/OFF cycles, as well as, the automatic defrost routine. The figure shows that defrosting ensued after 357 min and 1,426 min, i.e., ∼6 h and ∼24 h, respectively. Furthermore, within this time-lapse, the refrigerator presented 15 ON/OFF cycles, with the average relative humidity ranging between 42% and 84%. This data was used to construct an adequate threshold for treatment duration and image capture intervals, to ascertain the representativeness of the measurements in terms of the relative humidity variation during continuous operation.
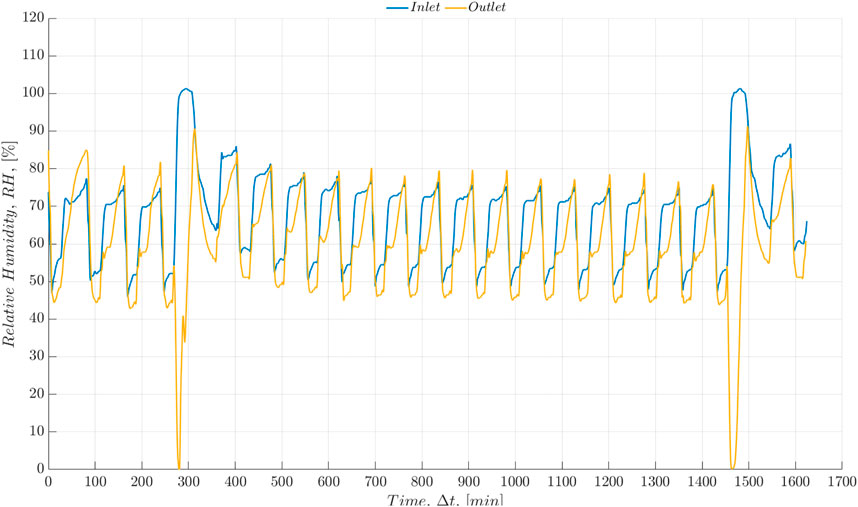
FIGURE 5. Refrigeration system characterization.
3.2 Frost visualization
Regions where frost formation and accretion reach the maximum, can be observed in Figure 6. The presented thermal imagery displays the temperature distribution, associated with the thickening of said ice layer. Figure 6A shows the evaporator surface, moments after the first defrosting cycle, whilst, Figure 6B shows the evaporator surface after ∼18 h of continuous operation, just before the second defrosting cycle.
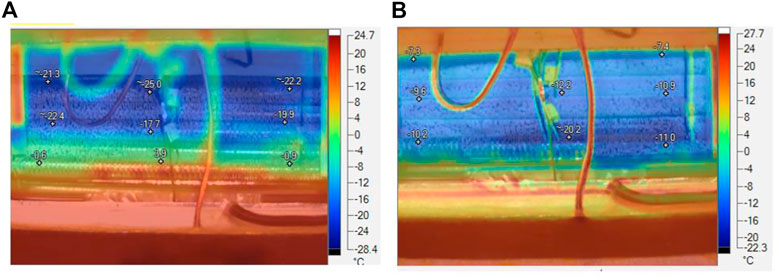
FIGURE 6. Thermal imagery of the heat exchanger. (A) After initial defrost cycle; (B) before second defrost cycle.
As seen in Figure 6A, operation temperatures range between −25°C and 3.9°C, whilst, in Figure 6B, minimum temperature increases to −20°C, and overall temperature difference, i.e., cooling effect, decreases, reaching a maximum temperature of −7.3°C; an 8.4°C reduction. This disadvantageous operation condition is attributed to the thickness of the frost adhered to the surface of the evaporator; acting as an additional thermal resistance, thus hindering convective heat transfer. This observation can be corroborated by the information in Figure 6B, in which lowest temperatures correspond to the extreme side of the top rows of the serpentine bundle, where frost accretion is higher, given non-homogeneous frost distribution.
To determine frost thickness, microscopic imagery was captured from the moment it begins to form over the surface of the fins, until it reaches its maximum value, i.e., before subsequent defrosting cycle. To measure said thickness, digital image processing was used. Based on the contrast ratio displayed in captured imagery, a previously developed computational implementation (De León-Ruiz et al., 2022) was employed. The processing array was slightly modified to accommodate, the reference length and pixel saturation, both specific to this case. The employed machine vision scheme is based on image convolution and density-based spatial clustering; identifying and measuring radial length of each frost-fin cluster; feature seen in Figure 7A.
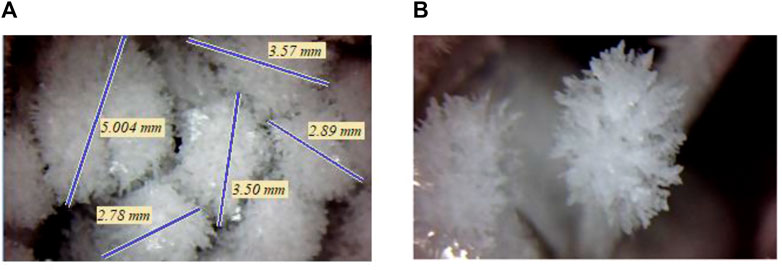
FIGURE 7. Microscopic imagery of frost accretion. (A) Sample measurement of a random cluster; (B) frost structure visualization.
This procedure was replicated 16 times, after the 18 h between defrosting cycles, over randomly selected fins along the zone with highest frost accretion. Sample size, i.e., replication, was determined based on the inherent limitations of the visualization technique (De León-Ruiz et al., 2022), requiring a minimum of 14 images to achieve, within a 95% confidence interval, an extended measurement uncertainty,
Average thickness, radially, was 3.55 mm with a statistical tolerance of 0.789 mm and an average range, across replications, of 2.21 mm. Maximum overall thickness, for all tests, was 5.004 mm, which, albeit an outlier, is deemed the upper bound threshold for operation limit construction. This entails that, for this setup, and although non-homogeneously and uncommon, frost thickness can reach a maximum of 0.005 m, which would implicitly determine, both, maximum power or worktime, required by the resistive heater, rendering this as a potential critical operation condition.
Considering uniform mass deposition over the evaporator, and spine fins equivalent to small-scale flat plates with a width of 2.5 mm (José Pineda et al., 2017), from the previously measured frost thickness, the computed effective frost accretion amounts, on average, to 1.37 mm. Complementarily, frost structure was determined from the captured images and considering the temperature range obtained from the thermal imagery, i.e., −10°C and −20°C. The resulting formation corresponds to a dendritic structure, as found by Fletcher map (Fletcher, 2009) and seen in Figure 7B.
3.3 Effective frost accretion rate estimation
From temperature and relative humidity measurements, and through Eqs 1a–1c, frost thickness can be estimated. This parameter is shown for both pipe rows of the heat exchanger, Figures 7A, B respectively, and displayed data is arranged according to thermocouple distribution outlined in Figure 4. Computed values were verified against the observations performed through the visualization window/cut-out, shown in Figure 3A. An average adjustment variation of 16% was found, deemed relatively representative, considering the limitations associated to the employed methodology. The relatively low variability obtained, ascertains the applicability of expressions in Eqs 1a, 1b, 1c, 1d, vis-a-vis spine fins. Thus, despite the high aspect ratio, it is corroborated that geometrical disposition does exert a particularly strong effect on frost accretion.
Figure 8A, shows that frost accretion is higher at the positions corresponding to thermocouples 1 to 5. This occurrence is attributed to the position of the evaporator fan, which provides an upward air flow through the central section of the heat exchanger. Because of the inverted-V tube configuration of the heat exchanger, the obtained bell-shaped frost distribution has a modified form, as was observed in (Negrelli et al., 2016). For the same reason, at position of thermocouple 5 there is the lower value of frost accretion, since free flow area is almost closed by the fins and frost at the exit section. Therefore, flow decreases its speed, and lower coefficients for heat and mass transfer are achieved (José Pineda et al., 2017). The flow is forced to leave through the nearest open channel, i.e., position of thermocouple 3, hence, the second higher value of frost accretion.
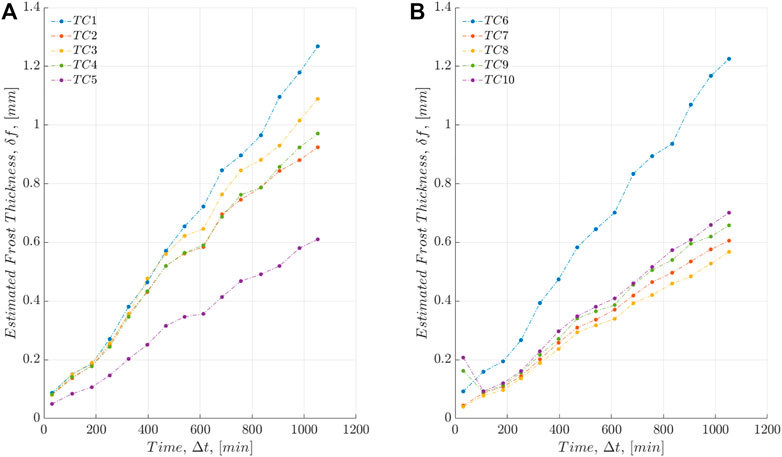
FIGURE 8. Estimated frost thickness. (A) HX outer facing row; (B) HX inner facing row.
Contrarily, Figure 8B shows that estimated frost accretion rate, associated with thermocouples 6–10, i.e., central section of the inner facing tube row, remains particularly constant and stable, whilst measurements corresponding to thermocouple 6, yield the maximum frost deposition during operation. This behaviour is attributed to: i) the previously mentioned frost distribution; ii) the effect of the inverted-V tube array and; iii) the location of the freezer exhaust grills.
From these figures, maximum frost thickness can be determined for every refrigeration cycle. This data can be grouped, based on the clear lineal tendency it displayed and frost accretion can be determined as a function of worktime.
From the non-homogeneous frost accretion, both, observed and computed, Figures 5, 7 respectively, it was determined that, for the outer facing tube row of the evaporator, its heat transfer capabilities are notoriously stratified, depending on the position where measurement was performed. Therefore, to accurately estimate the degree of frost accretion, three linear correlations are presented, corresponding to each major section, i.e., inferior, central and superior, Eqs 2–4, respectively.
Eq. 2 aims to model the behaviour of the lower section of the evaporator outer facing row, i.e., where frost accretion its higher. This correlation yields a deviation of 12.1% against the data corresponding to thermocouple 3. Eq. 3 pertains to the middle section, associated with thermocouples 2–4, which yield estimations with a deviation of 6.4%. For the remaining superior section, Eq. 4 is constructed based on the data measured by thermocouple 5, where frost accretion is lower, achieving a deviation of 12.07%.
Contrarily, for the inner-facing tube row of the evaporator it is seen that frost accretion is comparatively more uniform. This phenomenon enables the construction of a single expression, Eq. 5, that estimates said parameter, based on the measurements of thermocouples 6–10, with a deviation of 6.79%.
Through Eqs 2–5, maximum frost accretion, during the 15 on/off cycles analysed, is estimated to be 0.00125m, as seen in Figure 7. However, albeit an outlier, maximum frost accretion, measured after the same time step, amounts to 0.0021 m, as shown in Figure 6A. Considering constant operation of the refrigerator, and a consistent frost deposition rate over the fin surface, proposed equations could estimate the time required to reach this critical value over the total surface of the evaporator. This modification to nominal operation scheme, would entail an increase of the ON/OFF cycles before requiring defrosting. Non-etheless, this routine extension should be evaluated, beforehand, to ascertain effective energy consumption based on the ratio between resulting increased uninterrupted operation and associated extended defrosting times.
The applicability of the aforementioned regression functions is limited to the operational thresholds described by the presented case study, i.e., operation/surrounding conditions, appliance capacity and heat exchanger design/configuration. However, these are presented as a mean to ascertain the creation of time-based corelations that are capable of accurately estimating frost growth, in order to develop defrosting devices/schemes based solely on this rate, rather simplifying the implementation of successful control strategies.
3.4 Frost accretion estimation function
From the experimental measurements obtained through the machine vision scheme implemented, as well as through the correlations and mathematical expressions proposed in (Malhammar, 1988; Aljuwayhel et al., 2007; Hermes et al., 2014), an alternative proposal is derived to estimate effective frost accretion through a semi-empirical approach. Estimation function construction focuses on: i) heat exchanger size, capacity and worktime and; ii) surrounding air temperature, moisture content and thermophysical properties. This approach becomes rather convenient, since it uses directly measured quantities, as well as available technical specifications/properties. This particular approach would enable the user/designer to estimate, within expected confidence interval, maximum frost accretion over the evaporator surface. Furthermore, albeit requiring being tailored for every instance, this construction methodology, could provide a foundation to analyse the behaviour of different evaporator configurations. By characterizing the employed extended surface, and measuring operation and surrounding variables, this semi empirical approach could be capable of providing a relatively accurate time-based estimation of frost accretion which could then be refined, by including the particulars of the case study in question.
Supplementary Appendix S1A shows how the proposed estimation function was derived from: i) an energy balance of cycle heat conveyance and; ii) available equations for frost density and thickness. The resulting expression is given by Eq. 6.
To validate the proposed estimation function, Figure 9 is presented. Estimated frost accretion is compared to observed thickness increase, particularly, measurements from thermocouple 1, shown in Figure 8A, were chosen since it was the highest estimated thickness, based on recorded temperature. As seen in Figure 9, proposed approach can predict, rather accurately, the rate of frost accretion over the surface of the evaporator. It is worth to state that the growth rate presented in Figure 9, is limited to the duration of the performed test, and based on the, already defined, defrosting cycles. This becomes relevant since, if left indefinitely, frost growth rate eventually would decrease; as thickness increases, conduction becomes the dominant resistance, resulting in a sublinear behaviour.
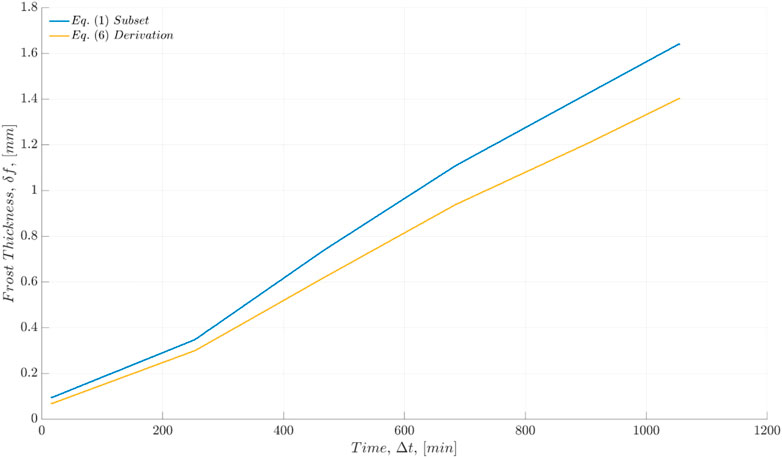
FIGURE 9. Estimation function output comparison; Eqs 1a, 1b, 1c, 1d subset against Eq. 6 derivation.
Concerning the adjustment of both approaches, the maximum discrepancy between datasets amounts to 15%, increasing as frost accretion increases. This value difference is mainly attributed to the initial assumption that heat transfer remains unhindered despite the frost. This is partially correct, particularly during the first 4 h of operation, ∼240 min. However, as frost accretion increases, heat/mass transfer mechanisms, undoubtedly, are affected. Non-etheless, since datasets deviations remain below the initially designated 20% error margin, with a RMSE of 0.1479 and a R-squared of 0.9029, the derived estimation function can be successfully implemented to construct proper limits for new predictions. This would help establish complementary control strategies for extended operation times before defrosting is required, which would balance energy expenditure between compressor and electric resistance consumption.
Conclusion
The presented work develops an alternative for frost accretion estimation, using a semi empirical approach. The presented case study involves testing the derived estimation function, over an inverted-V spine-finned heat exchanger. The resulting estimation function was constructed based on the experimental measurement of average frost thickness across the evaporator surface, through the implementation of a previously devised machine vision scheme. The following conclusions are drawn:
• Frost formation and accretion visualization revealed that despite exhibiting a linear growth rate, fin geometry and heat exchanger tube array exert a significant effect on frost overall distribution; with non-uniform/homogeneous mass deposition zones, mainly attributed to the physical constriction of the inverted-V shape and the higher air flow at the central zone due to fan location.
• An estimation function is constructed using well-established correlations and equations, to compute frost density and water vapour mass transfer from air to evaporator surface. The presented methodology is complemented with observed temperature and relative humidity magnitudes, which helped construct an expression capable of determining frost accretion through direct experimental measurements.
• The resulting estimation function presented a maximum error of 15%, i.e., RMSE of 0.1479 and R-Squared of 0.9029; hence it is deemed an appropriate tool for diagnostics, constructing relatively accurate limits for new estimations. Consequently, the derived estimation function can be implemented, as a reference, to enhance refrigerator operation, vis-à-vis efficient defrosting. By exerting a more precise control strategy over the resistance heater, its ON/OFF cycles can be adjusted accordingly, thus extending operation/work times and offsetting energy expenditure based on effective heat conveyance.
• Given how the experimental approach is implemented, the presented methodology is enhanced by the construction of an estimation function. This procedural array would lead to a particularly solid artificial intelligence implementation. The compiled visual database would enhance postprocessing stages, by inherently recognizing frost physical presence and features. Meanwhile, the derived estimation function would serve as benchmark for the algorithm; estimating frost accretion rate and effective thickness and; feeding goodness-of-fit self-adjustments to maintain its accuracy.
Data availability statement
The datasets presented in this article are not readily available because the data generated and/or analysed during the current study are not publicly available for legal/ethical reasons but are available from the lead researcher on reasonable request. Requests to access the datasets should be directed to icarvajal@ipn.mx.
Author contributions
Conceptualization, IC-M and OJ-P; Data curation, JL-R and OJ-P; Formal analysis, IC-M, JL-R, and OJ-P.; Funding acquisition, IC-M and OJ-P; Investigation, IC-M and OJ-P; Methodology, IC-M and JL-R; Project administration, IC-M and EM-E; Resources, IC-M and EM-E; Software, IC-M and JL-R; Supervision, IC-M and JB-F; Validation, IC-M and OJ-P; Visualization, JL-R and JB-F; Writing—original draft, IC-M and OJ-P; Writing–review and editing, IC-M, JL-R, JB-F, and EM-E.
Funding
The research work described in this paper was fully supported by grants from the National Council of Science and Technology of Mexico, CONACyT. The resources and materials employed in this research were provided by the Applied Thermal and Hydraulic Engineering Laboratory of the National Polytechnic Institute of Mexico, LABINTHAP–IPN, in collaboration with MABE.
Acknowledgments
The authors of this paper are particularly grateful to M. Sc. César Gutiérrez-Pérez and M. Sc. Manuel Pérez-García from MABE T&P, for the contributions made and the information provided.
Conflict of interest
The authors declare that the research was conducted in the absence of any commercial or financial relationships that could be construed as a potential conflict of interest.
Publisher’s note
All claims expressed in this article are solely those of the authors and do not necessarily represent those of their affiliated organizations, or those of the publisher, the editors and the reviewers. Any product that may be evaluated in this article, or claim that may be made by its manufacturer, is not guaranteed or endorsed by the publisher.
Supplementary material
The Supplementary Material for this article can be found online at: https://www.frontiersin.org/articles/10.3389/fmech.2023.1101425/full#supplementary-material
References
Aljuwayhel, F., Reindl, D. T., Klein, S. A., and Nellis, G. F. (2008). Experimental investigation of the performance of industrial evaporator coils operating under frosting conditions. Int. J. Refrig. 31, 98–106. doi:10.1016/j.ijrefrig.2007.05.010
Aljuwayhel, N., Reindl, D., Klein, S., and Nellis, G. (2007). Comparison of parallel- and counter-flow circuiting in an industrial evaporator under frosting conditions. Int. J. Refrig. 30 (8), 1347–1357. doi:10.1016/j.ijrefrig.2007.04.009
Andrade-Ambriz, Y. A., Ledesma, S., Belman-Flores, J. M., Carvajal-Mariscal, I., and Almanza-Ojeda, D-L. (2022). Frost thickness estimation in a domestic refrigerator using acoustic signals and artificial intelligence. Expert Syst. Appl. 201, 117071. doi:10.1016/j.eswa.2022.117071
Andrade-Ambriz, Y. A., Ledesma, S., Almanza-Ojeda, D-L., and Belman-Flores, J. M. (2022). Accurate classification of frost thickness using visual information in a domestic refrigerator. Int. J. Refrig. 145, 256–263. doi:10.1016/j.ijrefrig.2022.08.019
Badri, D., Toublanc, C., Olivier, R., and Havet, M. (2021). Review on frosting, defrosting and frost management techniques in industrial food freezers. Renew. Sustain. Energy Rev. 151, 111545. doi:10.1016/j.rser.2021.111545
Coleman, H. W., and Steele, W. G. (2009). Experimentation, validation and uncertainty analysis for engineers. 3a Edition. USA: John Wiley and Sons.
De León-Ruiz, J. E., Carvajal-Mariscal, I., De La Cruz-Ávila, M., Klapp, J., and Guzman, J. E. V. (2022). Image convolution-based experimental technique for flame front detection and dimension estimation: A case study on laminar-to-transition jet diffusion flame height measurement. Meas. Sci. Technol. 33, 075406. doi:10.1088/1361-6501/ac65db
Dogan, B., Altun, Ö., Ugurlubilek, N., Tosun, M., Sarıçay, T., and Berrin Erbay, L. (2015). An experimental comparison of two multi-louvered fin heat exchangers with different numbers of fin rows. Appl. Therm. Eng. 91, 270–278. doi:10.1016/j.applthermaleng.2015.07.059
Hermes, C. J. L. (2012). An analytical solution to the problem of frost growth and densification on flat surfaces. Int. J. Heat Mass Transf. 55, 7346–7351. doi:10.1016/j.ijheatmasstransfer.2012.06.070
Hermes, C., Loyola, F., and Nascimento, V. (2014). A semi-empirical correlation for the frost density. Int. J. Refrig. 46, 100–104. doi:10.1016/j.ijrefrig.2014.02.008
José Pineda, O., Carvajal Mariscal, I., Sánchez-Silva, F., Martinez, E., and Zacarias, A. (2017). Caracterización experimental de una superficie extendida con aletas tipo espina Y configuración de tubos en V invertida. DYNA 92, 696–701. doi:10.6036/8316
Kempiak, M. J., and Junge, B. (2014). Enhanced heat exchanger with an offset spine fin design”. International refrigeration and air conditioning conference. USA: Purdue e-pubs.
Kim, M-H., Kim, H., Kim, R. D., and Lee, K. S. (2016). A novel louvered fin design to enhance thermal and drainage performances during periodic frosting/defrosting conditions. Energy Convers. Manag. 110, 494–500. doi:10.1016/j.enconman.2015.11.028
Knabben, F. T., Hermes, C. J. L., and Melo, C. (2011). In-situ study of frosting and defrosting processes in tube-fin evaporators of household refrigerating appliances. Int. J. Refrig. 34, 2031–2041. doi:10.1016/j.ijrefrig.2011.07.006
Kondepudi, S. N., and O'Neal, D. L. (1993). Performance of finned-tube heat exchangers under frosting conditions: I. Simulation model. Int. J. Refrig. 16, 175–180. doi:10.1016/0140-7007(93)90045-A
Kondepudi, S. N., and O'Neal, D. L. (1991). Frosting performance of tube fin heat exchangers with wavy and corrugated fins. Exp. Therm. Fluid Sci. 4, 613–618. doi:10.1016/0894-1777(91)90040-X
Kondepudi, S. N., and O'Ne al, L. D. (1992). A simplified model of pin fin heat exchangers under frosting conditions. ASHRAE Trans. 99, 1–8.
Kondepudi, S. N., and O'Neal, L. D. (1988). Performance of triangular spine fins under frosting conditions. Heat Recovery Syst. CHP 8, 1–7. doi:10.1016/0890-4332(88)90036-1
Lee, T., Lee, J., Oh, S., and Lee, M. (2002). “Comparison of air-side heat transfer coefficients of several types of evaporators of household freezer/refrigerators,” in International Refrigeration And Air Conditioning Conference, United States, 16-07-2002.
Lee, W-J., and Kwon, O. K. (2021). Image processing for frost thickness measurement in fin-and-tube heat exchangers. Therm. Sci. Eng. Prog. 24 (2021), 100937. doi:10.1016/j.tsep.2021.100937
Lemmon, E. W., Bell, I. H., Huber, M. L., and McLinden, M. O. (2018). NIST standard reference database 23: Reference fluid thermodynamic and transport properties-REFPROP, version 10.0. Gaithersburg: National Institute of Standards and Technology, Standard Reference Data Program.
Léoni, A., Mondot, M., Durier, F., Revellin, R., and Haberschill, P. (2016). State-of-the-art review of frost deposition on flat surfaces. Int. J. Refrig. 68, 198–217. doi:10.1016/j.ijrefrig.2016.04.004
Malhammar, A. (1988). Monitoring frost growth in evaporators is a complex process, Australian Refrigeration. Air Cond. Heat.
Negrelli, S., Nascimento, V. S., Christian, J., and Hermes, L. (2016). A study of the effective thermal conductivity of frost formed on parallel plate channels. Exp. Therm. Fluid Sci. 78, 301–308. doi:10.1016/j.expthermflusci.2016.06.019
Senshu, T., and Yasuda, H. (1990). Heat pump performance under frosting conditions: Part I––heat and mass transfer on cross-finned tube heat exchangers under frosting conditions. ASHRAE Trans. 96 (1), 324–329.
Shen, Y., Jin, H., and Wang, X. (2018). “Frost growth detection using capacitive sensor,” in International Refrigeration And Air Conditioning Conference, USA, 9-12 July 2018.
Shen, Y., and Wang, X. (2019). Real-time frost porosity detection using capacitance sensing approach. Int. J. Heat Mass Transf. 134, 1171–1179. doi:10.1016/j.ijheatmasstransfer.2019.02.060
Song, M., and Dang, C. (2018). Review on the measurement and calculation of frost characteristics. Int. J. Heat Mass Transf. 124, 586–614. doi:10.1016/j.ijheatmasstransfer.2018.03.094
Suresh Patil, M., Seo, J-H., and Lee, M. Y. (2017). Heat transfer characteristics of the heat exchangers for refrigeration, air conditioning and heat pump systems under frosting, defrosting and dry/wet conditions—a review. Appl. Therm. Eng. 113, 1071–1087. doi:10.1016/j.applthermaleng.2016.11.107
Timmermann, M. A. S., Kaviany, M., and Barbosa, J. R. (2018). Thermal performance of peripheral-finned tube evaporators under frosting. Int. J. Heat Mass Transf. 116, 194–207. doi:10.1016/j.ijheatmasstransfer.2017.09.008
Wang, D., Tao, T., Kang, S., and Xu, G. (2010). “Non-contact frost thickness measurement by using a micro-camera and image processing technology,” in 2010 IEEE International Conference on Mechatronics and Automation, China, 04-07 August 2010.
Wu, X., Hu, S., and Chu, F. (2016). Experimental study of frost formation on cold surfaces with various fin layouts. Appl. Therm. Eng. 95, 95–105. doi:10.1016/j.applthermaleng.2015.11.045
Xiao, J., Wang, W., Zhao, Y. H., and Zhang, F. R. (2009). An analysis of the feasibility and characteristics of photoelectric technique applied in defrost-control. Int. J. Refrig. 32, 1350–1357. doi:10.1016/j.ijrefrig.2009.02.014
Xue, L., Guo, X., and Xing, Z. (2017). Experimental study of frost growth characteristics on surface of fin-tube heat exchanger. Energy Procedia 105, 5114–5121. doi:10.1016/j.egypro.2017.03.1039
Yan, W-M., Li, H-Y., Wu, Y-J., Lin, J-Y., and Chang, W-R. (2003). Performance of finned tube heat exchangers operating under frosting conditions. Int. J. Heat Mass Transf. 46, 871–877. doi:10.1016/S0017-9310(02)00346-0
Nomenclature
Keywords: frost accretion, refrigeration, evaporator, estimation function, machine vision
Citation: Carvajal-Mariscal I, De León-Ruiz JE, Belman-Flores JM, Martínez-Espinosa E and José-Pineda O (2023) Experimental assessment and semi empirical estimation of frost accretion—A case study on a spine-finned inverted-V tube array evaporator. Front. Mech. Eng 9:1101425. doi: 10.3389/fmech.2023.1101425
Received: 17 November 2022; Accepted: 13 February 2023;
Published: 24 February 2023.
Edited by:
Seyyed Hossein Hosseini, University of Ilam, IranReviewed by:
Dariusz Butrymowicz, Bialystok University of Technology, PolandAlexander S. Rattner, The Pennsylvania State University (PSU), United States
Copyright © 2023 Carvajal-Mariscal, De León-Ruiz, Belman-Flores, Martínez-Espinosa and José-Pineda. This is an open-access article distributed under the terms of the Creative Commons Attribution License (CC BY). The use, distribution or reproduction in other forums is permitted, provided the original author(s) and the copyright owner(s) are credited and that the original publication in this journal is cited, in accordance with accepted academic practice. No use, distribution or reproduction is permitted which does not comply with these terms.
*Correspondence: J. E. De León-Ruiz, amVkZWxlb25yQGdtYWlsLmNvbQ==