 C. Devi1
 Robert Cep
 Muniyandy Elangovan
- 1Department of Mechanical Engineering, Vel Tech Rangarajan Dr. Sagunthala R&D Institute of Science and Technology, Avadi, India
- 2Department of Machining, Assembly and Engineering Metrology, Faculty of Mechanical Engineering, VSB-Technical University of Ostrava, Ostrava, Czechia
- 3Department of Biosciences, Saveetha School of Engineering. Saveetha Institute of Medical and Technical Sciences, Chennai, India
- 4Department of R&D, Bond Marine Consultancy, London, United Kingdom
The current research examines the effectiveness of cryogenically treated (CT) tungsten carbide cutting inserts on Custom450 stainless steel using multi-objective soft computing approaches. The Taguchi-based L27 orthogonal array was employed in the experiments. During milling operations, cutting force, surface roughness, and cutting temperature were measured at different spindle speeds (rpm), feed rates (mm/min), and constant depths of cut (mm). The surface roughness and chip morphology of the Custom 450 stainless steel machined by cryo-treated (CT) and untreated (UT) cutting tool inserts were compared across various responses to cutting temperature and force. This paper also carried out multi-objective optimization, employing algorithm techniques such as Grasshopper Optimization Algorithm (GHO), Grey Wolf Optimization(GWO), Harmony Search Algorithm(HAS), and Ant line Optimization (ALO). The Multi-objective Taguchi approach and TOPSIS were first used to optimize the machining process parameters (spindle speed, feed rate, and cryogenic treatment) with different performance characteristics. Second, to relate the machining process parameters with the performance characteristics (cutting force, cutting temperature, and surface roughness), a mathematical model was developed using response surface analysis. The created mathematical response model was validated using ANOVA. The results showed that in IGD values of GHO, GWO, HSA and ALO module had 2.5765, 2.4706, 2.3647 and 2.5882 respectively, ALO has the best performance indicator. A Friedman’s test was also conducted, revealing higher resolution with the ALO method than with the HSA, GWO, and GHO methods. The results of the scanning test show that the ALO approach is workable.
Introduction
Stainless steels are widely used in springs, nuts, bolts, screws, and other fasteners, as well as in the health, maritime, defence, and nuclear power plants industries. This is because of their exceptional strength and robust resistance to oxidation and corrosion. Their superior mechanical characteristics, low heat conduction coefficient, and remarkable resistance to corrosion are the reasons behind this. Nevertheless, stainless steel alloys are usually used because of their many beneficial properties, such as their high flexibility, high tensile strength, high fracture toughness, and high work hardening rate. Aviation fittings, aerospace parts such as bushings, shafts, valves, and certain screws, fuel tanks, exhaust components, high-temperature engine parts, structural elements and cabin components, landing gears, and other items are among the many applications for custom 450 stainless steel. In the past work, using a cryo-treated cutting tool, custom 450 stainless steel is cut in different ways depending on temperature, and cutting force. Additionally, it aims to examine the workpiece’s surface morphology, chip anatomy, surface abrasion, and tool morphology. Now the work is extended, the objective of this study is to investigate how process parameters influence the performance of a cryo-treated cutting tool during the milling of Custom 450 stainless steel. This investigation employs soft computing techniques, including the GHO, GWO, HSA, and ALO algorithms. Additionally, the study evaluates the effectiveness of these algorithms using TOPSIS multi-criteria decision analysis methods.
CNC milling processes are widely used than the conventional machining in the manufacturing sector due to the accuracy. They are frequently employed to create complex shapes like pockets and slots. In industrial settings, hard materials are often milled using tungsten carbide end mill cutting tools, which are characterized by their higher hardness and wear resistance. This high hardness enables the processing of materials with high strength-to-weight ratios. During machining, cutting tools are subjected to high heat and variable loads. The cutting tools used for machining should not deform or wear excessively due to these conditions. Excessive softening of the cutting tool material, caused by high heat production during machining, leads to increased tool wear and cutting forces. This is problematic as tool failure is a common constraint, driving up component costs due to the need for tool replacement. Numerous efforts have been made in the past to enhance tool life and reduce surface roughness. However, optimizing cutting forces and cutting temperature with cryogenically treated tools in end milling of Custom450 stainless steel has not received significant attention in the literature to date.
Cryogenic treatment of metal leads to the transformation of the austenite phase into the martensite phase, characterized by a well-structured grain structure and a body-centred tetragonal crystal structure (Sert and Celik, 2019). The superior, tougher structure of martensite provides high wear resistance. Cryo-treatment of cutting tools has been identified as an effective method for reducing cutting force, extending tool life, and improving wear resistance (Reddy et al., 2009; Ozbek et al., 2016). (Korade et al., 2017) observed that combining various types of cryogenic treatment with increasing tempering temperatures and levels led to decreased hardness and increased wear volume. Literature reviews indicate that cryogenically treated coated carbide inserts have enhanced machining capabilities and tool wear resistance (Kumar and Singh, 2015; Singla et al., 2018; Panchagnula et al., 2023a; Panchagnula et al., 2023b). High spindle speed operations benefit from increased tool life with cryo-treated tungsten carbide inserts. Tool life and surface finishing are significant factors in the machining process. Coatings and cryogenic treatment have been shown to improve surface polishing and increase wear resistance (Gill et al., 2012; Sahoo et al., 2020). (Jadhav et al., 2020) performed turning operations on P20 tool steel using cryo-treated cutting inserts, with experiments conducted using Taguchi’s L27 orthogonal array and results analysed using MATLAB surface plots and ANNs. Mukkoti et al. (Mukkoti et al., 2018) conducted end milling on P20 steel using cryo-treated tungsten carbide cutting inserts, with a focus on optimizing parameters affecting cutting forces and power consumption, using regression analysis to relate process factors to these outcomes.
Evolutionary algorithms have been utilized to optimize the various machining processes (Kalita et al., 2020; Kalita et al., 2022; Kalita et al., 2023a; Kalita et al., 2023b). Adhesive wear on the studied surface was characterized by deformation lips, surface cracks, and fractured ridges, with Particle Swarm Optimization showing promising results for increased efficiency (Katoch et al., 2019). (Manjunath and kumar, 2017) demonstrated that face milling with cryo-treated tools can reduce surface roughness. The work in this paper was theoretically validated by creating a prototype using the BONN technique and real-time experimental data. The optimization was conducted using a MATLAB Genetic algorithm solver. The analysis of the direct and indirect effects of process parameters on temperature rise assisted in selecting parameters to minimize temperature increase, indicating the stability of the end milling process. The study’s predictive models for temperature rise are expected to align within a 95% confidence interval of the experimental results (Kaushik et al., 2018). Drilling on polymer composite material varied three process constraints at four discrete levels: spindle speed, feed rate, and weight percentage of graphite. The Taguchi-Grey Theory-Based Harmony Search Algorithm (GR-HSA) was used for multi-objective optimization and predictive modelling. The results showed that the machining interface temperature increased with GR-HSA spindle speed (2,500 rpm), softening the polymeric material in the machining zone (Kumar et al., 2021). In multi-pass face milling processes, parameters were optimized using HSA and compared against HA and GA algorithms (Zarei et al., 2009). The application of ant lion optimization in spacecraft attitude controllers demonstrated the ability of the suggested control action to prevent unnecessary long manoeuvring paths, enhancing resistance to unwinding (Amrr et al., 2019). The forms of two ship propellers were optimized using ALO, presenting superior optimal designs in 3-bar truss design, cantilever beam design, and gear train design. The ideal forms for ship propellers illustrate the potential application of the proposed approach to solve real-world problems with unpredictable search areas (Gao and Zhao, 2019). An enhanced grey wolf optimization technique was compared against algorithms like ALO, PSO, BA, regular GWO, and others, showing superior performance in high-dimensional situations (Khalilpourazari and Khalilpourazary, 2018). (Khalilpourazari and Khalilpourazary, 2018) suggested the GWO for optimizing multi-pass milling process parameters, using the Taguchi technique to find optimal values for the algorithm’s essential parameters (Shunmugesh and Panneerselvam, 2017). The results showed that the GWO outperforms other solutions by reducing total production time and offering the most workable solution for different cutting strategies (Niu et al., 2019).
Previous research has focused on identifying the ideal level of machining parameters for CNC milling operations, often employing artificial intelligence approaches like genetic algorithms (GA), artificial neural networks, and fuzzy logic. Commonly enhanced input parameters include feed rate, depth of cut, and spindle speed (Jia et al., 2012). However, limited research has been conducted on using the length of the cryogenic treatment soaking as a process parameter to achieve optimal machining parameters. Only a few studies briefly mention the use of deep cryogenic treatment (DCT) to enhance tool life, often focusing on single objectives like tool wear and flank wear. Additionally, little work has examined the impact of cryogenic treatment on the material of cutting tools. Thus, providing a robust technological model to enhance the process’s productivity is crucial. To address this gap, experimental tests were conducted to investigate the impact of cryogenic treatment on end mill cutters on the cutting force and temperature of Custom 450 stainless steel using a CNC end milling process. These steels are particularly useful in industries such as medical, food, nuclear power, and chemicals, where precise machining into complex aeronautical fittings, aerospace components like shafts, valves, and specific screws, cabin components, and landing gears is essential (Kuntoğlu et al., 2020; Kuntoğlu and Sağlam, 2021; Korkmaz et al., 2023a; Binali et al., 2023; Korkmaz et al., 2023b). CNC end milling was carried out on a vertical milling machine. Various soaking times (between 24 and 36 h) of CT were applied to tungsten carbide end milling cutters. A scanning electron microscope (SEM) was used to investigate the chip and surface morphology of the cryo-treated and untreated tools. SEM (Vickram et al., 2021; Palanivelu et al., 2022; Raj Deena et al., 2022) imaging finds widespread utility in various fields.
Custom 450 is a martensitic stainless-steel grade that has good resistance to corrosion up to about 650 °C and may be heat-treated to significantly enhance its mechanical properties. There are few articles regarding Custom 450 stainless steel in the literature, despite the fact that there are various studies on the machinability of stainless steels. Furthermore, publications do not contain information on end milling on Custom 450 stainless steel. The extensive use of Custom 450 stainless steel makes this experiment essential. Despite the established use of cryo-treated cutting tools in drilling, turning, and milling operations, the full potential of milling processes on Custom450 stainless steel has not been completely explored. While cryo-treated cutting tools are well-recognized in various machining operations, the specific application of end milling on Custom 450 stainless steel remains under-investigated. Furthermore, in-depth studies focusing on the end milling of Custom 450 stainless steel are still lacking. Consequently, the objective of this study is to investigate how process parameters influence the performance of a cryo-treated cutting tool during the milling of Custom 450 stainless steel. This investigation employs soft computing techniques, including the GHO, GWO, HSA, and ALO algorithms. Additionally, the study evaluates the effectiveness of these algorithms using TOPSIS multi-criteria decision analysis methods.
Materials and methods
Materials and experimental details
The experiment involved end milling Custom 450 stainless steel in a dry, room-temperature environment using cutting inserts that were either untreated (UT), cryo-treated with 24 h of soaking (CT 24 h), or cryo-treated with 36 h of soaking (CT 36 h). This was conducted on a CNC vertical machining centre as shown in Figure 1A. The dimensions of 160 mm × 75 mm × 20 mm (4 numbers) were prepared. The chemical composition and mechanical properties of Custom 450 stainless steel were determined (31). The tool holder used was a standard indexable type (Diameter: 16 mm, Length: 150 mm), and the cutting tool insert was a TiAlN-coated tungsten carbide insert (APMT1135PDR YBG205). The primary cutting parameters employed in this study were spindle speed, feed rate, and depth of cut. (31).
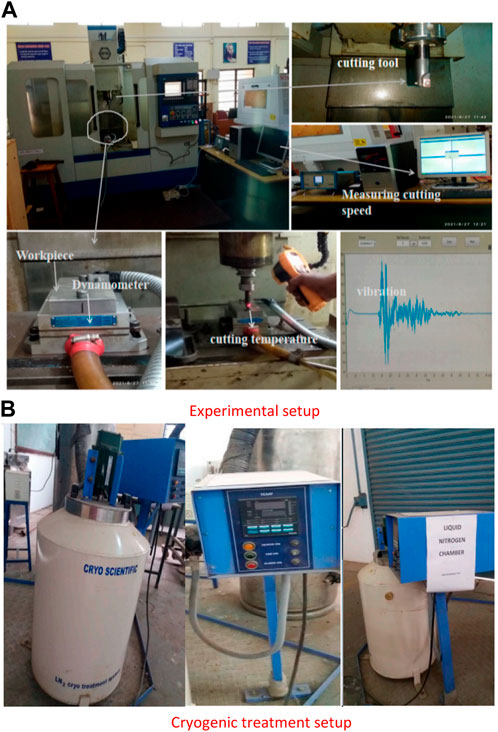
FIGURE 1. (A) Experimental setup (B) Cryogenic treatment setup.
Cryogenic treatment
The tungsten carbide inserts underwent cryogenic treatment in a specially designed cryogenic chamber (KRYO 550-16), capable of cooling samples down to deep cryogenic temperatures (-196 °C). The chamber’s temperature was gradually reduced from room temperature (RT) to the cryogenic temperature (CT, approximately -196 °C) at a rate of 2 °C/min as shown in Figure 1B. After being maintained at this temperature (-196 °C) for 24 and 36 h, the temperature was gradually raised back to room temperature (Devi and Mahalingam, 2023). Additionally, the current experiment was conducted to thoroughly examine the performance of cryo-treated cutting tools on Custom 450 stainless steel. The objective was to determine the optimal parameters at various spindle speeds (1,500 rpm, 2,300 rpm, 3,100 rpm), feed rates (0.1, 0.15, 0.2 mm/min), and a constant depth of cut (0.5 mm).
Design of experiments
The effectiveness of the system is evaluated using Design of Experiments (DOE), which considers several factors (Shanmugasundar et al., 2019a). DOE is an essential data collection and analysis methodology used across various experimental scenarios. It involves a planned experiment analyzing three aspects: factors, levels of these factors, and responses. The primary goal of DOE is to compare multiple solutions and identify the necessary factors to yield the best output response. It facilitates the examination of the impact of various input factors on a desired response. DOE is capable of identifying significant interactions that might be overlooked when examining a component at a time or dealing with multiple inputs simultaneously.
The foundation of the experiment design is the Taguchi-based orthogonal array, which includes three parameters and corresponding levels. This array can be used to develop optimal parameters, minimize treatments, reduce material costs, and determine the contributing factor of each process parameter in machining. The L27 orthogonal array consists of 13 columns, which can be assigned to test factors and their interactions. For a 3-factor 3-level configuration, the total number of tests required is given by
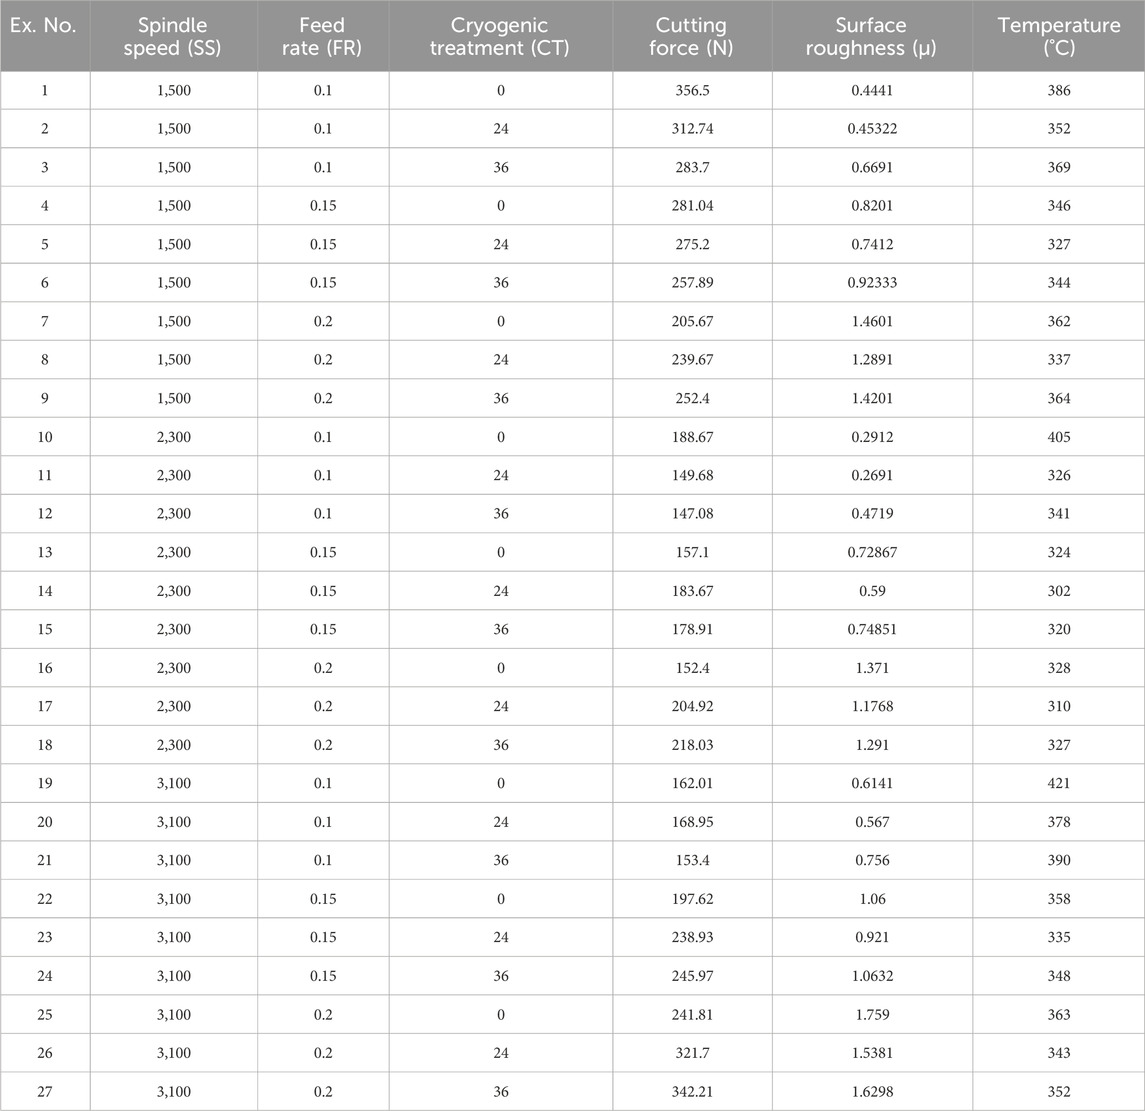
TABLE 1. Experimental design and output response.
Regression models
The Multiple Linear Regression Model (MLRM) can be employed in mathematics to calculate the response value (the output) in terms of several parameters (the inputs) (Shanmugasundar et al., 2021a). This study establishes three variants of the MLRM equations—linear, quadratic, and interaction—using experimental data and MATLAB’s “regress” function. These three models are represented in their standard forms as Eq. 1, Eq. 2, and Eq. 3:
Here,
Optimization methods
Metaheuristics are a popular set of algorithms that have been used in diverse optimization applications (Shanmugasundar et al., 2019b; Shanmugasundar et al., 2021b; Shanmugasundar et al., 2022a; Shanmugasundar et al., 2023a; Shanmugasundar et al., 2023b). In this study, Grasshopper Optimization Algorithm (Meraihi et al., 2021), Grey Wolf Optimization (Mirjalili et al., 2014), Harmony Search Algorithm (Yang, 2009) and Ant Lion Optimization (Mirjalili, 2015) have been used.
Grasshopper optimization
Grasshopper Optimization Algorithm (GHO) is inspired by the nymph and adult stages of grasshopper life (Meraihi et al., 2021). The nymph stage involves short, leisurely steps, while the adult stage features long, rapid movements. These behaviors underlie GHO’s intensification and diversification phases. In the exploration phase, GHO updates the position value of each grasshopper in the swarm and evaluates fitness, symbolizing the search for food sources. During the exploitation phase, it identifies the optimal solution among all options, akin to seeking better food sources.
In GHO, each grasshopper represents a solution, and its position (
where
Algorithm 1.Pseudocode for Grasshopper Optimization Algorithm.
1. Initialize the grasshopper positions
2. Initialize
3. Calculate the fitness
4. Store the best grasshopper
5. While
• Update
• For each search agent:
o Normalize the distance between grasshoppers
o Update the position of current grasshoppers
o Return grasshoppers to boundaries if they go outside
• End For
• Update pareto optimal solutions
• Update
• Increment
6. End While
7. Convert
8. Sort
It should be noted that TOPSIS (Hwang and Yoon, 1981), a commonly used multi-criteria decision-making (Shanmugasundar et al., 2022b; Shanmugasundar et al., 2022c) tool is used to convert the
Grey wolf optimization
Grey Wolf Optimization (GWO) excels in unfamiliar, challenging search areas and demonstrates strong convergence and local optima avoidance (Mirjalili et al., 2014). It simulates the Grey wolf pack’s predation process, which involves encircling, hunting, and attacking. GWO reflects the strict social hierarchy of grey wolves with alphas leading the pack, followed by betas, deltas, and omegas. In GWO, agents
Algorithm 2.Pseudocode for Grey Wolf Optimization Algorithm.
1. Initialize the number of grey wolves and their positions
2. While
• Determine the fitness function
• Calculate Pareto optimal distance
• Sort
• Using sorted data, assign
• Compute
• For each wolf:
o Update position using calculated values
o Check
• End For
3. End While
4. Convert
5. Sort
Harmony search algorithm
Harmony Search Algorithm (HSA) (Yang, 2009) operates with minimal mathematical constraints and does not require a predefined dataset for parameter selection. It draws an analogy to artists seeking harmonious music, with engineers seeking global solutions determined by an objective function. The process involves adjusting pitch and considering evolutionary algorithm modifications to achieve optimal conditions. The main principles of Harmony Search Process are: choose initial information from search memory (memory-related concerns), select the closest value from the harmony search memory (pitch modifications) and randomly select values from the range of potential values. The HSA algorithm is shown in Algorithm 3.
Algorithm 3.Pseudocode for Harmony Search Algorithm.
1. Initialize the population of parameters/harmony.
2. While
• For each harmony
o Calculate the fitness function (
• End For
• Update pareto optimal solutions
• Store the best one with its parameters and fitness value
• For each harmony
o Improvise harmony based on
o Ensure new harmony stays within bounds
• End For
3. End While
4. Convert
5. Sort
Ant lion optimization
Ant line Optimization (ALO) (Mirjalili, 2015), is another popular metaheuristic which models the hunting behavior of ant lions using traps. The algorithm represents an ant’s walk as stochastic. The ALO algorithm is shown in Algorithm 4.
Algorithm 4.Pseudocode for Antlion Optimization Algorithm.
1. Initialize the population of ant and antlion positions.
2. Calculate the fitness value (
3. Save the best antlion and its position (elite antlion).
4. While
• For each ant:
o Select an antlion using the roulette wheel method.
o Slide randomly walking ants into a trap.
o Generate ant’s random walk route around the elite antlion and the selected antlion.
o Normalize random walks.
o Calculate the position of ant.
• End For
• Calculate the fitness values (
• Update pareto optimal solutions.
• Combine ants and antlions.
• Sort according to fitness values and take the first population size.
• Update the elite antlion.
5. End While
6. Convert
7. Sort
The various parameter and their values for GHO, GWO, HSA and ALO optimization are shown in Table 2.

TABLE 2. Tuning parameters and their values for each algorithm.
Result and discussion
This section provides an analysis and comparison of results from several optimization approaches, including Grasshopper Optimization (GHO), Grey Wolf Optimization (GWO), Harmony Search Algorithm (HSA), and Ant Lion Optimization (ALO). The metaheuristic efficiency is assessed with an inertia weight of 100, archive size of 100, and population size of 100.
Effects of variables on cutting force, surface roughness and temperature
In mathematics, the response value (the output) can be determined in terms of many parameters (the inputs) by using the many Linear Regression Model (MLRM). This study uses experimental data and the “regress” tool in MATLAB to establish three variations of the MLRM equations: linear Equation of cutting force, surface roughness and cutting temperature (Eqs 5, 6, 7) respactively.
In mathematics, the Multiple Linear Regression Model (MLRM) can be used to compute the response value (the output) in relation to multiple parameters (the inputs). Using experimental data and MATLAB’s “regress” function, this study establishes three variations of the MLRM equations: interaction Equations 8, (9), and (10) respectively.
Equations (11)–(13) depict mathematical models for cutting force, surface roughness, and temperature respectively. The developed mathematical models were verified using ANOVA shown in Table 3.
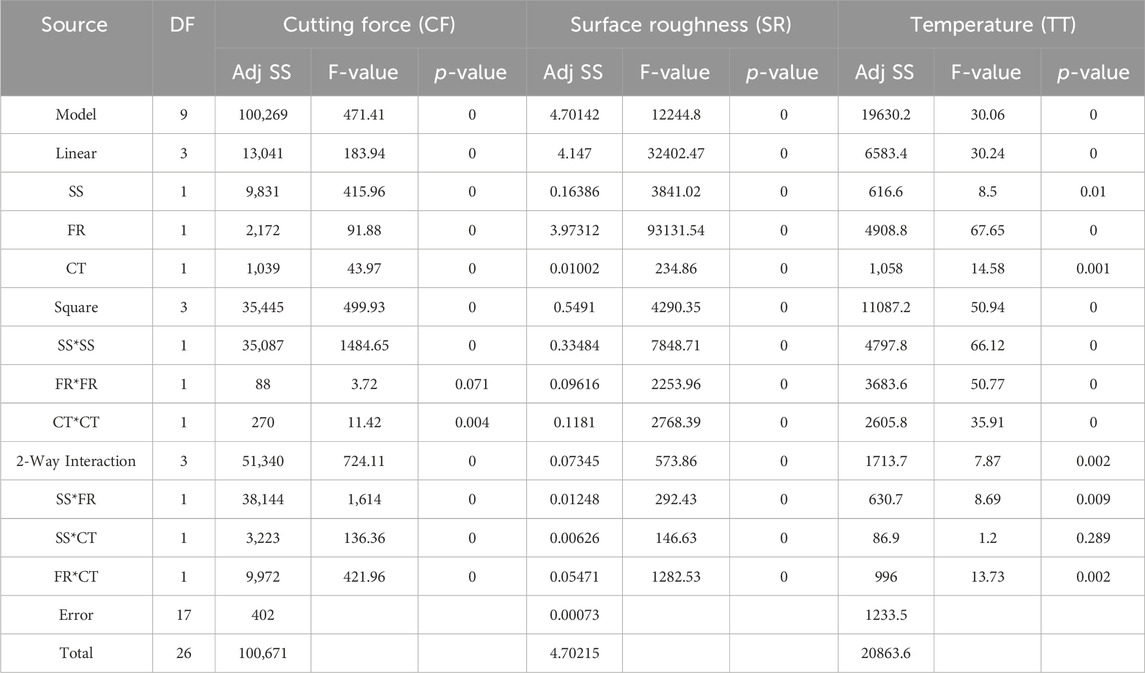
TABLE 3. ANOVA tables for the responses.
Figure 2 illustrates the relationship between milling operation factors and cutting forces. Increased spindle speed and feed rate correlate with decreased cutting forces, indicating potential areas for parameter optimization. Feed rate significantly influences cutting forces, affecting tool life.
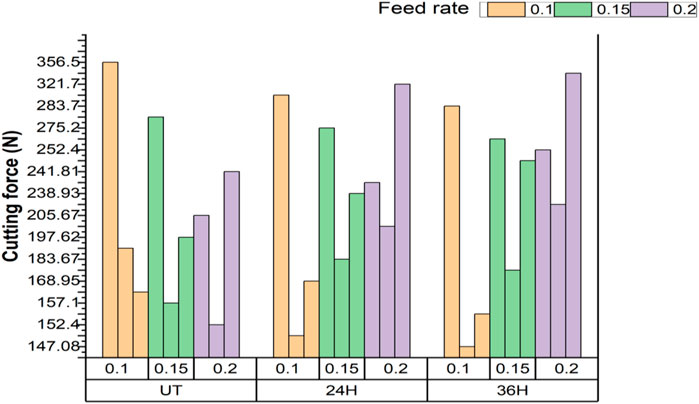
FIGURE 2. Feed rate vs. cutting force at various spindle speeds.
Surface roughness is impacted by feed rate, cryogenic treatment, and spindle speed. Eq. (12) mathematically represents surface roughness:
Figure 3 shows that cryo-treated inserts exhibit better surface roughness than untreated inserts. Surface roughness decreases with increased spindle speed and increases with feed rate from 0.1 to 0.15 mm/min and further with 0.2 mm/min.
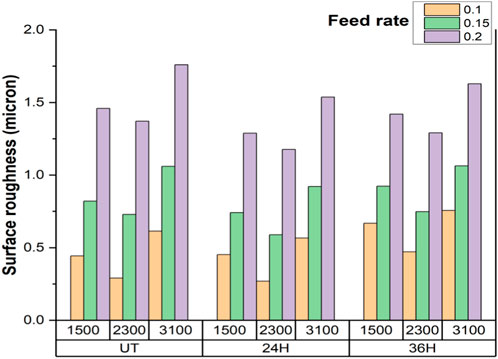
FIGURE 3. Feed rate vs. surface roughness at various spindle speeds.
The mathematical model for temperature (Eq. (13)) includes spindle speed, feed rate, and cryogenic treatment as independent variables:
Figure 4 demonstrates that cryo-treated cutting tools outperform untreated inserts in terms of cutting temperature.
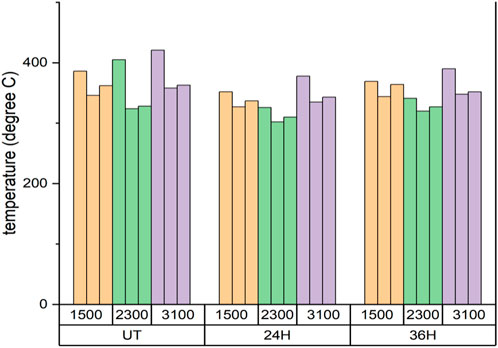
FIGURE 4. Feed rate vs. cutting temperature at various spindle speeds.
The MLRS Linear, Interaction, and Quadratic performance of CF, TT, and SR are shown in Figure 5. The CF and TT quadratic equations respond more favorably than the linear interaction. Compared to the linear interaction, Figure 5 illustrates how well the performs on the SR quadratic equation.
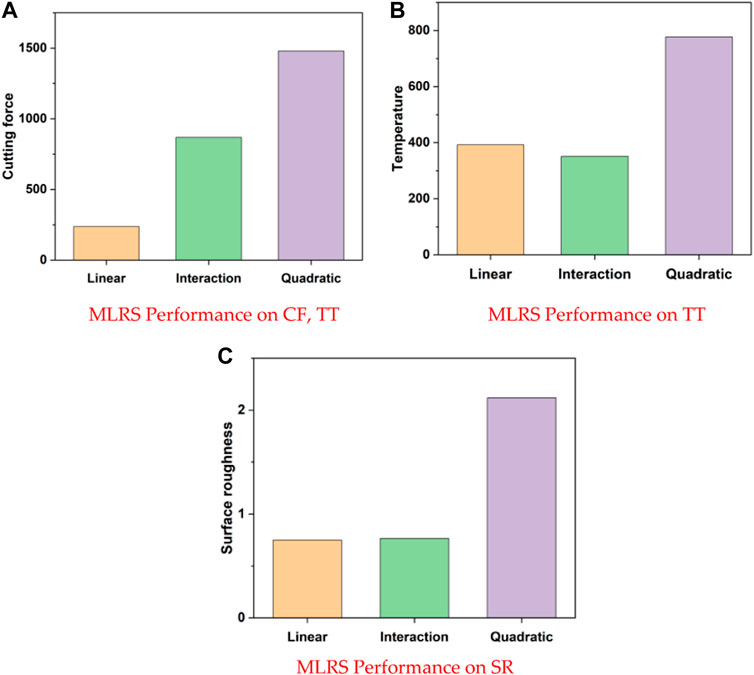
FIGURE 5. MLRS Performance comparison of CF, TT&SR. (A) Surface plot of CF vs CT, SS. (B) Surface plot of CF vs CT, FR. (C) Surface plot of CF vs FR, SS.
The design factors that most affect the three quality attributes—manufacturing cost, tool life, and workpiece quality—are found using ANOVA. A high F-value indicates a high efficiency level for the parameter. Another important factor is the p-value, which allows statistical analysis to be completed within a 95% confidence interval. Consequently, the parameter affects the response if the computed value is less than 5%. According to Table 3. Cutting force, surface roughness, and temperature all had p values less than 0.05, indicating significant effects from each parameter on the output responses. Similarly, input parameters have a considerable impact on the output responses (square of FR, CT excluded), but no significant influence is seen on cutting force from square of FR, CT and no significant impact is seen on surface roughness from any of the interactions.
Cutting force analysis
The graphical representations of the association between response and cutting variables occur under specific cutting settings that were indicated in the experimental design table. Therefore, it is essential to comprehend how cutting conditions affect cutting variables in order to better clarify these interactions. Figure 6 displayed the combined effect of feed rate and cutting speed on CF fluctuations on three-dimensional graphs. The cutting force reduced as the feed rate and cutting speed increased. The cutting force reduced as the SS increased in the surface plot of CT and SS. Pareto chart (Figure 7) indicates the least significant impact of feed rate repetition on force in the X-direction. The primary effect plot shows reduced cutting force with increased spindle speed. The statistical analysis confirms the significant impact of milling parameters on CF during titanium alloy milling. The response surface plots demonstrate these effects, highlighting improved thermal conductivity due to cryogenic treatment, influencing the heat transfer from the tool’s tip and affecting cutting forces.
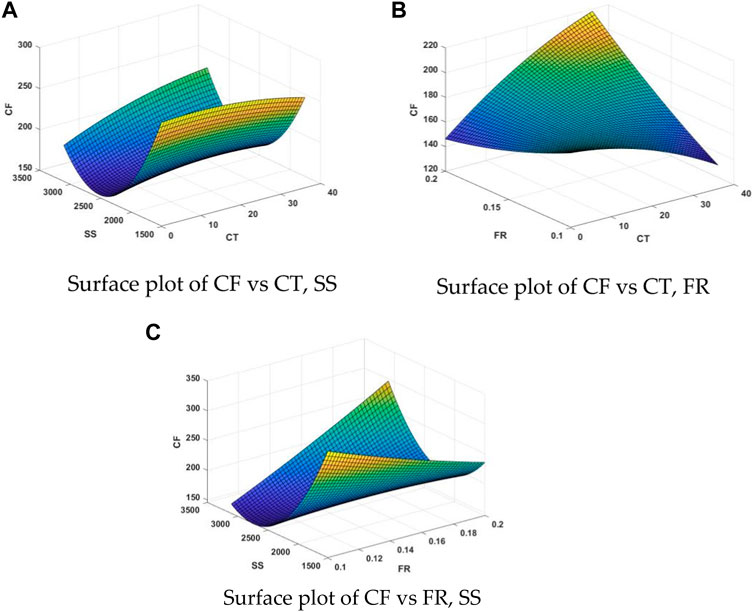
FIGURE 6. Surface plot for influence of parameters on cutting force. (A) Surface plot of CF vs CT, SS. (B) Surface plot of CF vs CT, FR. (C) Surface plot of CF vs FR, SS.
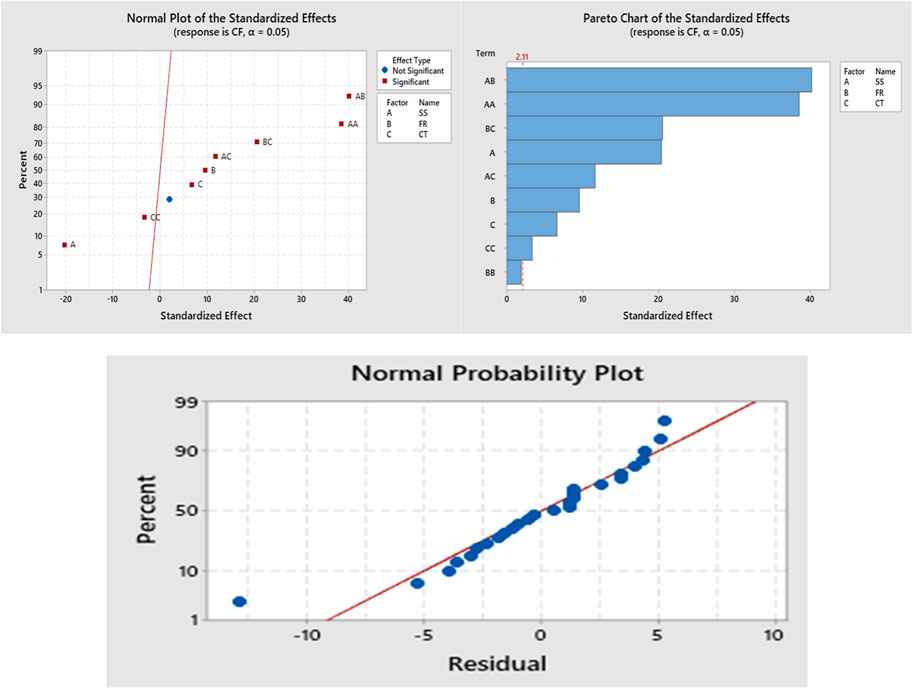
FIGURE 7. (A) Normal probability plot (B) Pareto chart (C) Residual plot for cutting force.
When attempting to determine the best pairings between two sets of data, it can be helpful. By drawing an analogy with a topographic map, the color and patterns in Surface Charts show the places that fall within the same range of values. Three variables are often used to generate a 3D Surface Plot: X, Y, and Z. Surface plot for CF.
Surface roughness analysis
The surface plot of SR vs FR, SS in Figure 8 illustrates the effect of process parameters on surface roughness. Initially, the surface roughness was higher, but as the cutting speed increased, it decreased and then increased again. Surface roughness rises in dependence on the FR. According to the Pareto chart in Figure 9, spindle speed and feed rate significantly influence surface roughness. The production of built-up edges (BUE) at specific spindle speeds reduces Ra. The SEM image in Figure 10 shows imperfections and micro-voids on machined surfaces caused by carbide particles and BUE. Cryo-treated inserts perform better, reducing heat generation and improving surface finishing. (39).
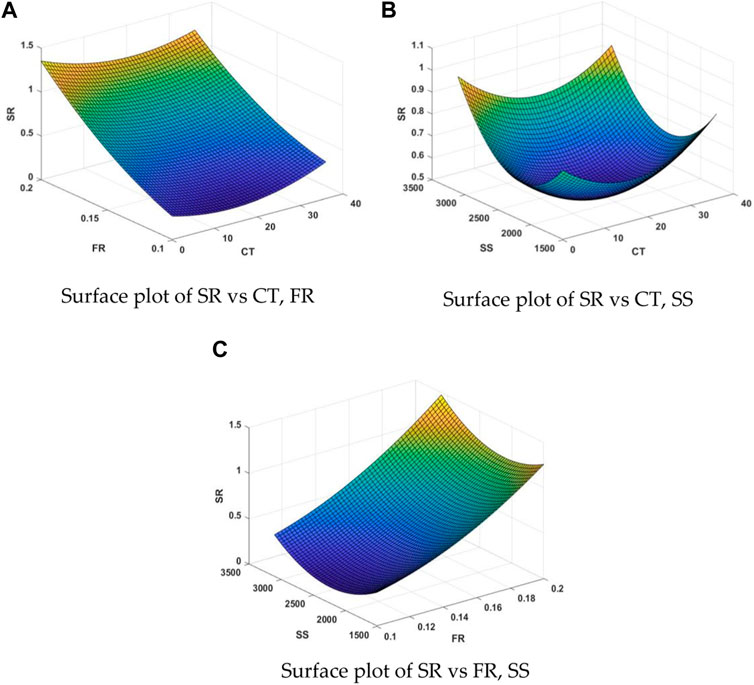
FIGURE 8. Surface plot for influence of parameters on surface roughness. (A) Surface plot of SR vs CT, FR. (B) Surface plot of SR vs CT, SS. (C) Surface plot of SR vs FR, SS.
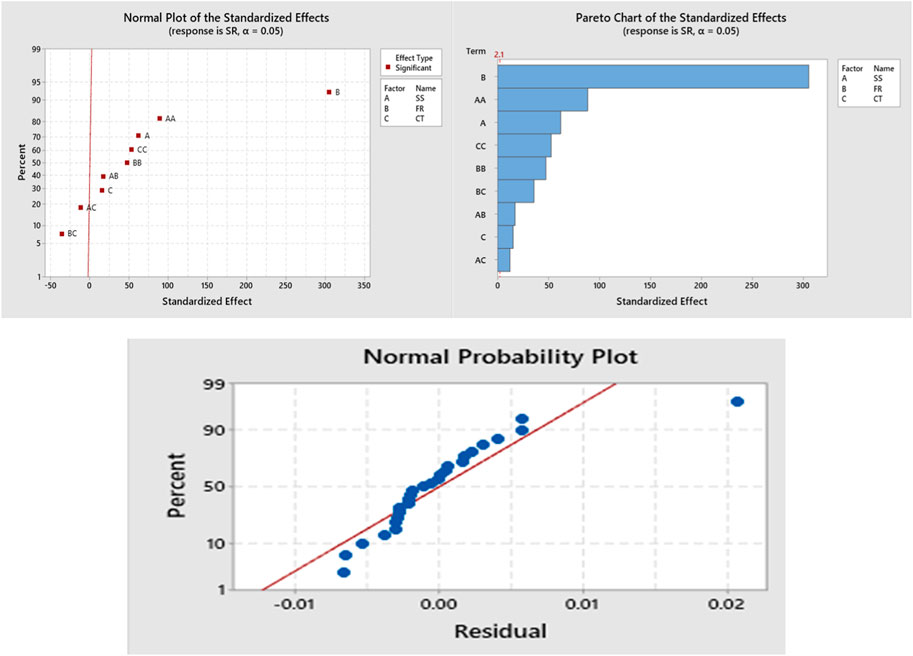
FIGURE 9. (A) Normal probability plot (B) Pareto chart (C) Residual plot for surface roughness.
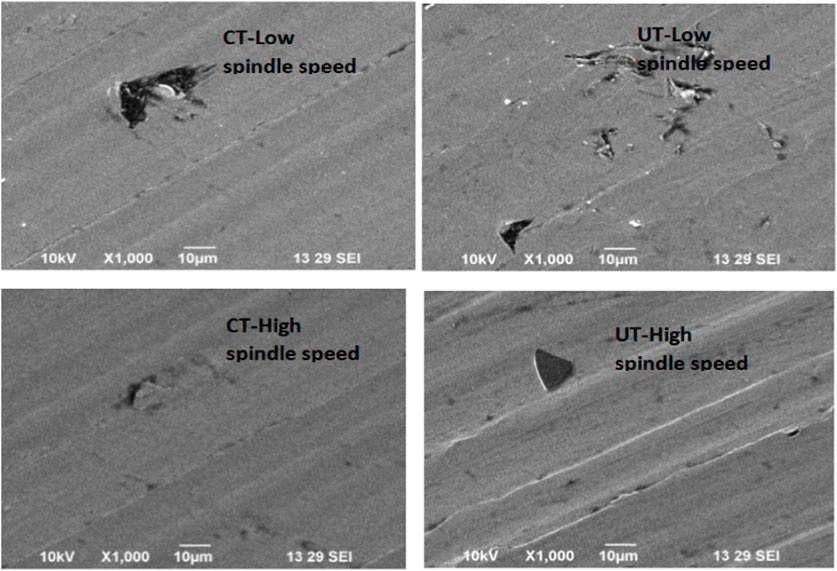
FIGURE 10. Surface morphology.
Temperature analysis
Effect of process parameters on temperature is shown in Figure 11. Cutting temperature not decreases much. The Pareto diagram (Figure 12) suggests a uniform impact of feed rate and spindle speed on temperature. Residual analysis confirms a consistent pattern across milling operations without specific residue patterns, indicating the reliability of the experimental setup. The results validate the model’s suitability for analyzing cryo-treated cutting tool residues across various milling performance variables. The residual plots demonstrate the significant impact of input parameters on TT during machining.
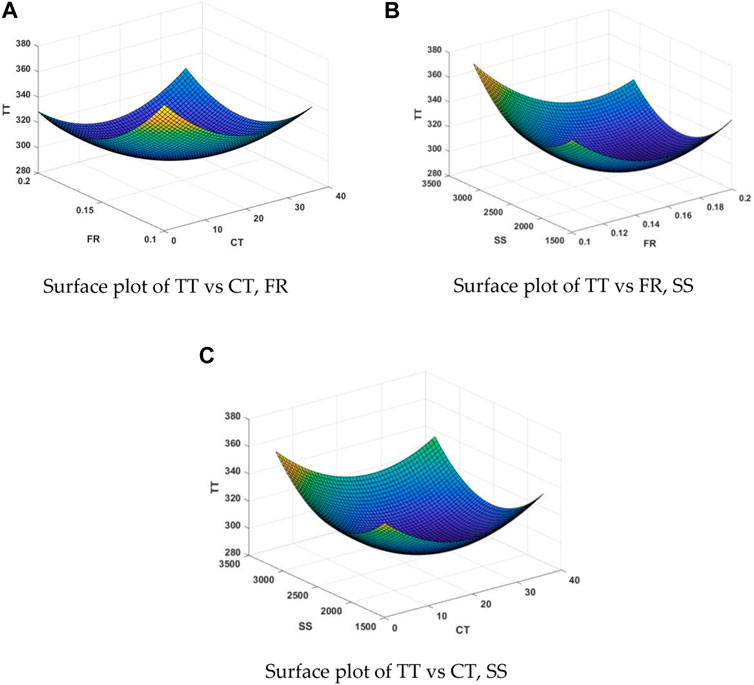
FIGURE 11. Surface plot for influence of parameters on cutting temperature. (A) Surface plot of TT vs CT, FR. (B) Surface plot of TT vs FR, SS. (C) Surface plot of TT vs CT, SS.
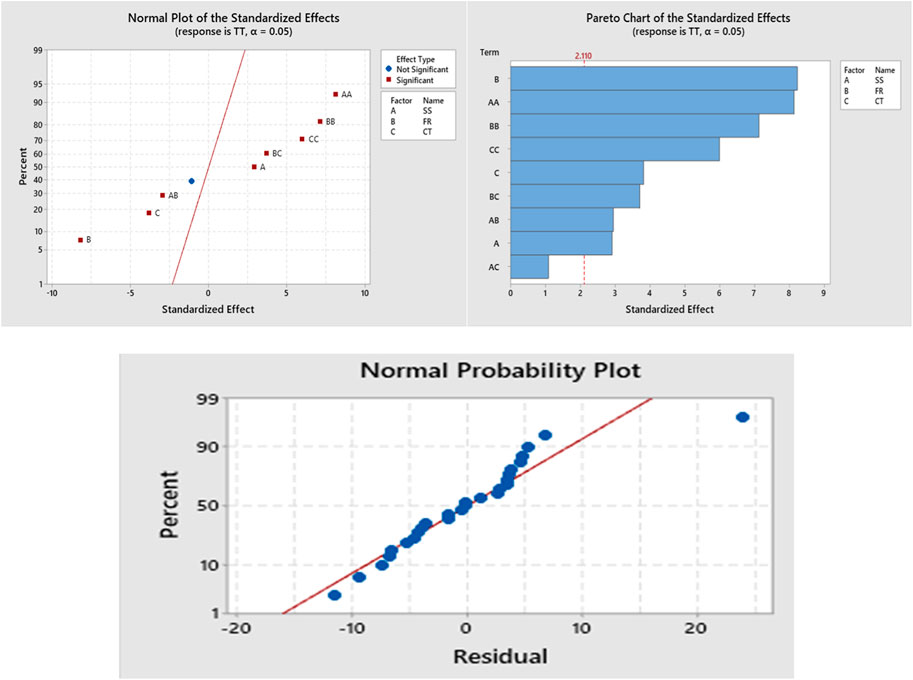
FIGURE 12. (A) Normal probability plot (B) Pareto chart (C) Residual plot for cutting temperature.
Performance comparison of GHO, GWO, HSA and ALO algorithms
The efficiency of ALO is compared with GHO, GWO, and HSA. ALO shows superior performance in end milling applications, achieving optimal parameter settings at a lower iteration, as illustrated in the convergence plot (Figure 13). The TOPSIS approach integrated the output responses from 22 runs into a single objective, confirming the normal distribution of output data from all algorithms. The
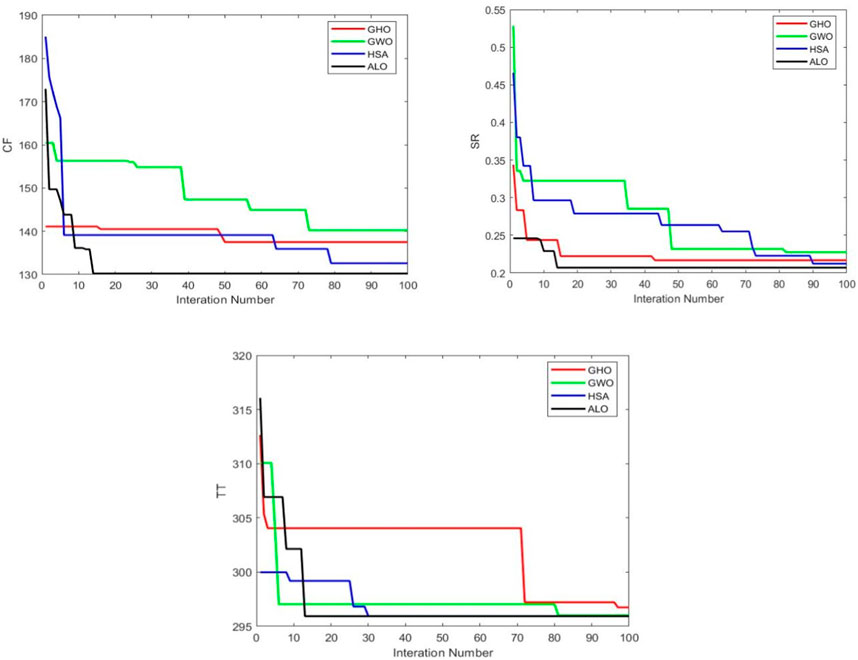
FIGURE 13. Convergence plot for (A) cutting force (B) surface roughness (C) temperature.
Figure 14 reveals the impact of high heat loads and cutting zone temperature on chip morphology, with thermal softening facilitating machining at high temperatures. Increasing the feed rate results in more serrated chip teeth, especially with cryo-treated cutting tool inserts at high spindle speeds and feed rates. (36,41).
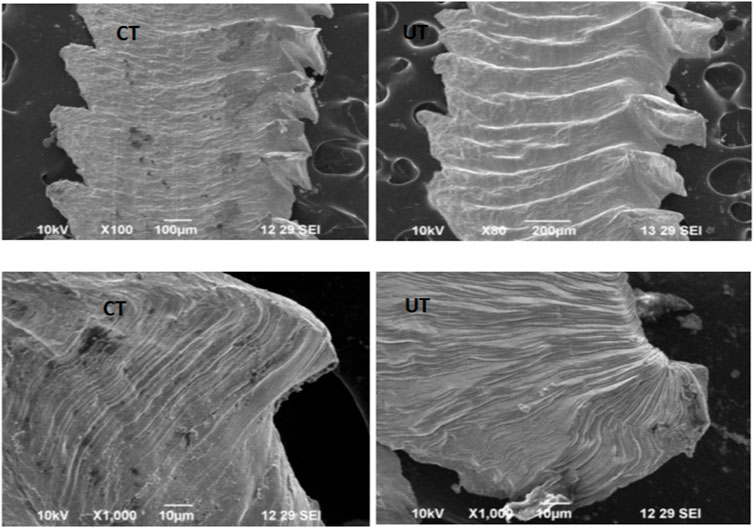
FIGURE 14. Chip morphology.
Table 4 presents the optimal process parameters and response values obtained from 22 runs with a population size of 100 and 100 iterations for all algorithms. Table 5 shows the statistical significance of these algorithms.
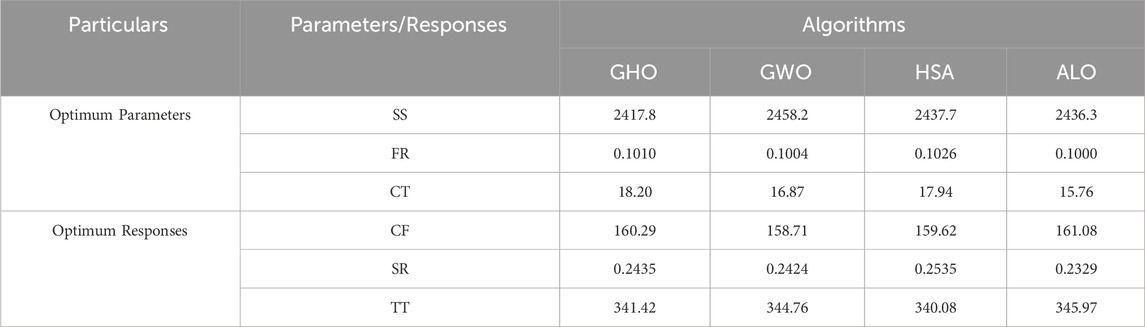
TABLE 4. Optimum process parameters and responses.
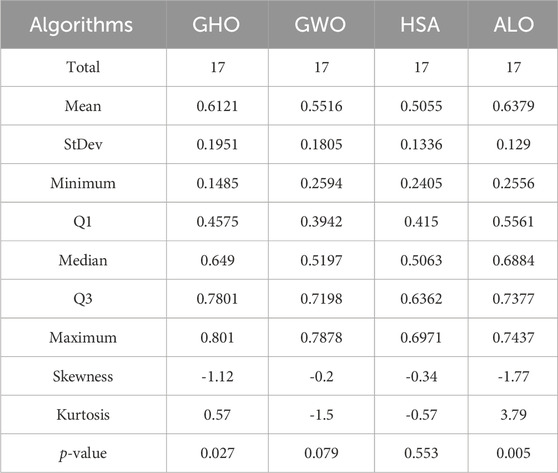
TABLE 5. Statistical analysis of relative closeness value.
Inverted generational distance (IGD)
The IGD metric is utilized to compare the effectiveness of Grasshopper Optimization (GHO), Grey Wolf Optimization (GWO), Harmony Search Algorithm (HSA), and Ant Lion Optimization (ALO) Algorithms. This measure indicates the computational complexity of the algorithms, as detailed in Khalilpourazari et al. (Khalilpourazari et al., 2020). The IGD is calculated using the Euclidean distance formula:
where
In this formula,
Table 6 shows the IGD values for the selected algorithms. It is evident from the IGD values that the ALO algorithm outperforms GHO, GWO, and HSA.

TABLE 6. Performance indicators.
Friedman test
The Friedman test, a non-parametric alternative to the parametric two-way analysis of variance, is used to identify significant differences in the behavior of the algorithms. This test assumes the null hypothesis of equality of medians between the populations.
The test statistic value is calculated using the method described in (Derrac et al., 2011; Zhang et al., 2023). The Friedman statistic (
Here,
The process for calculating the ranks involves:
1. Compiling the observed results for each algorithm/problem pair.
2. Sorting the values for each problem starting with 1 (best outcome) to
3. Calculating the ultimate rank
The Friedman statistic
According to Table 6, the IGD value for ALO is lower than for the other algorithms, indicating superior performance. The convergence graphs for Cutting Force (CF), Surface Roughness (SR), and Temperature (TT) in Figure 12 further demonstrate the effectiveness of the ALO algorithm compared to GHO, GWO, and HSA. Therefore, it is concluded that ALO outperforms GHO, GWO, and HSA.
Conclusion
The study aimed to optimize milling parameters such as spindle speed and feed rate to minimize cutting force (CF) and surface roughness (SR) using Grasshopper Optimization (GHO), Grey Wolf Optimization (GWO), Harmony Search Algorithm (HSA), and Ant Lion Optimization (ALO) algorithms. Key findings, based on the Multi-Criteria Decision Making (MCDM) method, are summarized below:
• Analyses indicate that spindle speed, feed rate, and cryogenic treatment are critical in milling. Increases in these parameters correspond to higher CF and Temperature (TT).
• Utilizing cryo-treated (CT) inserts resulted in a 13% reduction in surface roughness compared to untreated (UT) inserts, particularly at high cutting parameters.
• Scanning Electron Microscope (SEM) examination of surfaces milled with UT inserts at high speeds and feed rates revealed significant grooves and ridges.
• Comparisons of CF, TT, and SR across various algorithms showed that ALO achieved the most optimal parameter settings.
• TOPSIS, a multi-criteria decision analysis method, was used to evaluate the effectiveness of GHO, GWO, HSA, and ALO, with ALO demonstrating superior performance.
• The quadratic Multiple Linear Regression Model (MLRM) equation proved to be the most accurate for end milling, surpassing interaction and linear models.
• ALO showed higher efficiency in achieving closer-to-ideal values in end milling, with an overall performance index of 1.133. The optimal parameters included a spindle speed of 2436.3 rpm, feed rate of 0.1 mm/min, and a cryogenic treatment soaking period of approximately 15.76 h.
• ALO outperformed GHO, GWO, and HSA, as evidenced by the lowest IGD value. The Friedman Test further highlighted significant differences in the performance of these algorithms.
For future research, exploring various levels of process factors is planned. Implementing and comparing other well-known metaheuristic approaches like Particle Swarm Optimization (PSO), Artificial Neural Networks (ANN), Genetic Algorithms (GA), Differential Evolution (DE), Jaya, Cuckoo, and Stochastic Fractal Search with ALO will be considered. This comparative study aims to identify the most effective metaheuristic approach for optimizing end milling processes, thereby achieving precise parameter settings.
Data availability statement
The original contributions presented in the study are included in the article/Supplementary material, further inquiries can be directed to the corresponding author.
Author contributions
CD: Conceptualization, Data curation, Formal Analysis, Investigation, Methodology, Validation, Visualization, Writing–original draft. SM: Conceptualization, Methodology, Supervision, Writing–review and editing. RC: Conceptualization, Funding acquisition, Methodology, Resources, Software, Writing–review and editing. ME: Conceptualization, Funding acquisition, Methodology, Resources, Software, Writing–review and editing.
Funding
The author(s) declare that no financial support was received for the research, authorship, and/or publication of this article.
Conflict of interest
ME was employed by Bond Marine Consultancy.
The remaining authors declare that the research was conducted in the absence of any commercial or financial relationships that could be construed as a potential conflict of interest.
Publisher’s note
All claims expressed in this article are solely those of the authors and do not necessarily represent those of their affiliated organizations, or those of the publisher, the editors and the reviewers. Any product that may be evaluated in this article, or claim that may be made by its manufacturer, is not guaranteed or endorsed by the publisher.
References
Amrr, S. M., Sarkar, R., Banerjee, A., and Nabi, M. (2019). “Parameter optimization of spacecraft attitude controller using ant lion optimizer,” in Proceedings of the Parameter optimization of spacecraft attitude controller using ant lion optimizer, Aligarh, India, November 2019. doi:10.1109/UPCON47278.2019.8980008
Binali, R., Demirpolat, H., Kuntoğlu, M., and Salur, E. (2023). Different aspects of machinability in turning of AISI 304 stainless steel: a sustainable approach with MQL technology. Metals 13 (6), 1088. doi:10.3390/met13061088
Derrac, J., García, S., Molina, D., and Herrera, F. (2011). A practical tutorial on the use of non parametric statistical tests as a methodology for comparing evolutionary and swarm intelligence algorithms. Swarm Evol. Comput. 1 (1), 3–18. doi:10.1016/j.swevo.2011.02.002
Devi, C., and Mahalingam, S. K. (2023). Robert cep, and Karel Kouril, effect of cryo-treated cutting tool end milling on Custom 450 stainless steel. J. Mater 16, 0. doi:10.3390/ma16130000
Gao, Z. M., and Zhao, J. (2019). An improved grey wolf optimization algorithm with variable weights. Comp. Intell. Neurosci. 2019, 1–13. doi:10.1155/2019/2981282
Gill, S. S., Singh, J., Singh, R., and Singh, H. (2012). Effect of cryogenic treatment on AISI M2 high speed steel: metallurgical and Mechanical Characterization. J. Mater Eng. Perform. 21 (7), 1320–1326. doi:10.1007/s11665-011-0032-z
Hwang, C. L., and Yoon, K. (1981). Multiple attribute decision making: methods and applications. New York: Springer-Verlag. doi:10.1007/978-3-642-48318-9
Jadhav, P., Kumar, S., and Bongale, A. (2020). Optimization of cutting forces by cryogenic treatment on tungsten carbide inserts during dry turning of the P 20 tool steel. Mater Today Proc. 28, 2485–2493. doi:10.1016/j.matpr.2020.04.798
Jia, X. J., Deng, X. Z., and Su, J. X. (2012). Machining parameters optimization for form milling the gear using improved harmony search algorithm. Adv. Mater Res. 472-475, 1809–1812. doi:10.4028/www.scientific.net/AMR.472-475.1809
Kalita, K., Ghadai, R. K., Cepova, L., Shivakoti, I., and Bhoi, A. K. (2020). Memetic cuckoo-search-based optimization in machining galvanized iron. Mater. (Basel) 13 (14), 3047. doi:10.3390/ma13143047
Kalita, K., Ghadai, R. K., and Chakraborty, S. (2023b). A comparative study on multi-objective pareto optimization of WEDM process using nature-inspired metaheuristic algorithms. Int. J. Interact. Des. Manuf. 17 (2), 499–516. doi:10.1007/s12008-022-01007-8
Kalita, K., Kumar, V., and Chakraborty, S. (2023a). A novel MOALO-MODA ensemble approach for multi-objective optimization of machining parameters for metal matrix composites. Multiscale Multidiscip. Model Exp. Des. 6 (1), 179–197. doi:10.1007/s41939-022-00138-5
Kalita, K., Pal, S., Haldar, S., and Chakraborty, S. (2022). A hybrid TOPSIS-PR-GWO approach for multi-objective process parameter optimization. Process Integr. Optim. Sustain 6 (4), 1011–1026. doi:10.1007/s41660-022-00256-0
Katoch, S., Sehgal, R., Singh, V., Gupta, M. K., Mia, M., and Pruncu, C. I. (2019). Improvement of tribological behavior of H-13 steel by optimizing the cryogenic-treatment process using evolutionary algorithms. Tribol. Int. 140, 105895. doi:10.1016/j.triboint.2019.105895
Kaushik, V. S., Subramanian, M., and Sakthivel, M. (2018). Optimization of processes parameters on temperature rise in CNC end milling of al 7068 using hybrid techniques. Mater Today Proc. 5 (2), 7037–7046. doi:10.1016/j.matpr.2017.11.367
Khalilpourazari, S., and Khalilpourazary, S. (2018). Optimization of production time in the multi-pass milling process via a robust grey wolf optimizer. Neural Comput. Appl. 29 (12), 1321–1336. doi:10.1007/s00521-016-2644-6
Khalilpourazari, S., Naderi, B., and Khalilpourazary, S. (2020). Multi-objective stochastic fractal search: a powerful algorithm for solving complex multi-objective optimization problems. Soft Comput. 24 (4), 3037–3066. doi:10.1007/s00500-019-04080-6
Korade, D. N., Ramana, K. V., Jagtap, K. R., and Dhokey, N. B. (2017). Effect of deep cryogenic treatment on tribological behaviour of D2 tool steel-an experimental investigation. Mater Today Proc. 4 (8), 7665–7673. doi:10.1016/j.matpr.2017.07.100
Korkmaz, M. E., Gupta, M. K., Kuntoğlu, M., Patange, A. D., Ross, N. S., Yılmaz, H., et al. (2023a). Prediction and classification of tool wear and its state in sustainable machining of Bohler steel with different machine learning models. Measurement 223, 113825. doi:10.1016/j.measurement.2023.113825
Korkmaz, M. E., Gupta, M. K., Singh, G., Kuntoğlu, M., Patange, A., Demirsoz, R., et al. (2023b). Machine learning models for online detection of wear and friction behaviour of biomedical graded stainless steel 316L under lubricating conditions. Int. J. Adv. Manuf. Technol. 128 (5-6), 2671–2688. doi:10.1007/s00170-023-12108-3
Kumar, J., Verma, R. K., and Mondal, A. K. (2021). Taguchi-grey theory based harmony search algorithm (GR-HSA) for predictive modeling and multi-objective optimization in drilling of polymer composites. Exp. Tech. 45, 531–548. doi:10.1007/s40799-020-00428-y
Kumar, S., and Singh, M. (2015). Cryogenic treatment as performance enhancing process for cutting tools-A review. Int. Res. J. Eng. Technol. (IRJET). 02 (9), 1902–1905.
Kuntoğlu, M., Aslan, A., Sağlam, H., Pimenov, D. Y., Giasin, K., and Mikolajczyk, T. (2020). Optimization and analysis of surface roughness, flank wear and 5 different sensorial data via tool condition monitoring system in turning of AISI 5140. Sensors (Basel) 20 (16), 4377. doi:10.3390/s20164377
Kuntoğlu, M., and Sağlam, H. (2021). Investigation of signal behaviors for sensor fusion with tool condition monitoring system in turning. Measurement 173, 108582. doi:10.1016/j.measurement.2020.108582
Manjunath, S., and kumar, A. (2017). Analysis the effectiveness of cryogenic treatment through roughness and temperature prediction using Bonn technique. J. Mech. Eng. 14 (2), 16–35.
Meraihi, Y., Gabis, A. B., Mirjalili, S., and Ramdane-Cherif, A. (2021). Grasshopper optimization algorithm: theory, variants, and applications. IEEE Access 9, 50001–50024. doi:10.1109/ACCESS.2021.3067597
Mirjalili, S. (2015). The ant lion optimizer. Adv. Eng. Softw. 83, 80–98. doi:10.1016/j.advengsoft.2015.01.010
Mirjalili, S., Mirjalili, S. M., and Lewis, A. (2014). Grey wolf optimizer. Adv. Eng. Softw. 69, 46–61. doi:10.1016/j.advengsoft.2013.12.007
Mukkoti, V. V., Sankaraiah, G., and Yohan, M. (2018). Effect of cryogenic treatment of tungsten carbide tools on cutting force and power consumption in CNC milling process. Prod. Manuf. Res. 6 (1), 149–170. doi:10.1080/21693277.2018.1436011
Niu, P., Niu, S., liu, N., and Chang, L. (2019). The defect of the grey wolf optimization algorithm and its verification method. Knowl. Based Syst. 171, 37–43. doi:10.1016/j.knosys.2019.01.018
Ozbek, N. A., Gulesin, M., and Ozbek, O. (2016). Application of deep cryogenic treatment to uncoated tungsten carbide inserts in the turning of AISI 304 stainless steel. Metall. Mater Trans. A 47 (12), 6270–6280. doi:10.1007/s11661-016-3767-1
Palanivelu, J., Thanigaivel, S., Vickram, S., Dey, N., Mihaylova, D., and Desseva, I. (2022). Probiotics in functional foods: survival assessment and approaches for improved viability. Appl. Sci. 12 (1), 455. doi:10.3390/app12010455
Panchagnula, K. K., Jayaprakash, P., Čep, R., Vamsi, N., Kalita, K., and Chakraborty, S. (2023b). Regression model-based parametric analysis of drilling of multi-walled carbon nanotubes-added glass fiber composite laminates. Mater Res. Express. doi:10.1088/2053-1591/ad1129
Panchagnula, K. K., Sharma, J. P., Kalita, K., and Chakraborty, S. (2023a). CoCoSo method-based optimization of cryogenic drilling on multi-walled carbon nanotubes reinforced composites. Int. J. Interact. Des. Manuf. 17 (1), 279–297. doi:10.1007/s12008-022-00894-1
Raj Deena, S., Kumar, G., Vickram, A. S., Rani Singhania, R., Dong, C. D., Rohini, K., et al. (2022). Efficiency of various biofilm carriers and microbial interactions with substrate in moving bed-biofilm reactor for environmental wastewater treatment. Bioresour. Technol. 359, 127421. doi:10.1016/j.biortech.2022.127421
Reddy, T. V. S., Sornakumar, T., Reddy, M. V., Venkatram, R., and Senthilkumar, A. (2009). Turning studies of deep cryogenic treated P-40 tungsten carbide cutting tool inserts – TECHNICAL COMMUNICATION. Mach. Sci. Technol. 13 (2), 269–281. doi:10.1080/10910340902979754
Sahoo, M., Gangopadhyay, V. K., and Gangopadhyay, S. (2020). An insight into microstructure and machining performance of deep cryogenically treated cemented carbide inserts. J. Manuf. Process. 58, 819–831. doi:10.1016/j.jmapro.2020.09.001
Sert, A., and Celik, O. N. (2019). Characterization of the mechanism of cryogenic treatment on the microstructural changes in tungsten carbide cutting tools. Mater Char 150 (1-7), 1–7. doi:10.1016/j.matchar.2019.02.006
Shanmugasundar, G., Dharanidharan, M., Vishwa, D., and Sanjeev Kumar, A. P. (2021b). Design, analysis and topology optimization of connecting rod. Mater Today Proc. 46, 3430–3438. doi:10.1016/j.matpr.2020.11.778
Shanmugasundar, G., Fegade, V., Mahdal, M., and Kalita, K. (2022a). Optimization of variable stiffness joint in robot manipulator using a novel NSWOA-Marcos approach. Processes 10 (6), 1074. doi:10.3390/pr10061074
Shanmugasundar, G., Karthikeyan, B., Ponvell, P. S., and Vignesh, V. (2019a). Optimization of process parameters in TIG welded joints of AISI 304L-austenitic stainless steel using Taguchi’s experimental design method. Mater Today Proc. 16, 1188–1195. doi:10.1016/j.matpr.2019.05.213
Shanmugasundar, G., Mahanta, T. K., Čep, R., and Kalita, K. (2022c). Novel fuzzy measurement alternatives and ranking according to the compromise solution-based green machining optimization. Processes 10 (12), 2645. doi:10.3390/pr10122645
Shanmugasundar, G., Pal, S., Chohan, J. S., and Kalita, K. (2023a). “Pareto optimization of laminated composite plates with non-dominated sorting whale optimization algorithm (NSWOA) ensemble,” in International conference on intelligent computing & optimization (Cham: Springer Nature Switzerland), 350–357.
Shanmugasundar, G., Pal, S., Chohan, J. S., and Kalita, K. (2023b). “Ensemble approach for optimizing variable rigidity joints in robotic manipulators using MOALO-MODA,” in International conference on intelligent computing & optimization (Cham: Springer Nature Switzerland), 216–224.
Shanmugasundar, G., Sapkota, G., Čep, R., and Kalita, K. (2022b). Application of MEREC in multi-criteria selection of optimal spray-painting robot. Processes 10 (6), 1172. doi:10.3390/pr10061172
Shanmugasundar, G., Sivaramakrishnan, R., Meganathan, S., and Balasubramani, S. (2019b). Structural optimization of an five degrees of freedom (T-3R-T) robot manipultor using finite element analysis. Mater Today Proc. 16, 1325–1332. doi:10.1016/j.matpr.2019.05.231
Shanmugasundar, G., Vanitha, M., Čep, R., Kumar, V., Kalita, K., and Ramachandran, M. (2021a). A comparative study of linear, random forest and adaboost regressions for modeling non-traditional machining. Processes 9 (11), 2015. doi:10.3390/pr9112015
Shunmugesh, K., and Panneerselvam, K. (2017). Optimization of machining process parameters in drilling of CFRP using multi-objective Taguchi technique, TOPSIS and RSA techniques. Polym. Polym. Compos 25 (3), 185–192. doi:10.1177/096739111702500301
Singla, A. K., Singh, J., and Sharma, V. S. (2018). Processing of materials at cryogenic temperature and its implications in manufacturing: a review. Mater Manuf. Process. 33 (15), 1603–1640. doi:10.1080/10426914.2018.1424908
Vickram, A. S., Srikumar, P. S., Srinivasan, S., Jeyanthi, P., Anbarasu, K., Thanigaivel, S., et al. (2021). Seminal exosomes–an important biological marker for various disorders and syndrome in human reproduction. Saudi J. Biol. Sci. 28 (6), 3607–3615. doi:10.1016/j.sjbs.2021.03.038
Yang, X. S. (2009). “Harmony search as a metaheuristic algorithm,” in Music-inspired harmony search algorithm: theory and applications (Berlin, Germany: Springer), 1–14. doi:10.1007/978-3-642-00185-7_1
Zarei, O., Fesanghary, M., Farshi, B., Saffar, R. J., and Razfar, M. R. (2009). Optimization of multi-pass face-milling via harmony search algorithm. J. Mater Process Technol. 209 (5), 2386–2392. doi:10.1016/j.jmatprotec.2008.05.029
Keywords: end milling optimization, custom 450 stainless steel, ant lion optimization, multi-objective TOPSIS, parametric analysis
Citation: Devi C, Mahalingam SK, Cep R and Elangovan M (2024) Optimizing end milling parameters for custom 450 stainless steel using ant lion optimization and TOPSIS analysis. Front. Mech. Eng 10:1353544. doi: 10.3389/fmech.2024.1353544
Received: 10 December 2023; Accepted: 10 January 2024;
Published: 25 January 2024.
Edited by:
Jiapeng Sun, Hohai University, ChinaReviewed by:
Leijie Fu, Xi’an Technological University, ChinaMustafa Kuntoğlu, Selcuk University, Türkiye
Copyright © 2024 Devi, Mahalingam, Cep and Elangovan. This is an open-access article distributed under the terms of the Creative Commons Attribution License (CC BY). The use, distribution or reproduction in other forums is permitted, provided the original author(s) and the copyright owner(s) are credited and that the original publication in this journal is cited, in accordance with accepted academic practice. No use, distribution or reproduction is permitted which does not comply with these terms.
*Correspondence: Siva Kumar Mahalingam, ZHJtc2l2YWt1bWFyQHZlbHRlY2guZWR1Lmlu