 Sonja Koppenhöfer
 Hui Wang
 Maren Scharfe
 Volkhard Kaever
 Irene Wagner-Döbler
 Jürgen Tomasch
- 1Group Microbial Communication, Technical University of Braunschweig, Braunschweig, Germany
- 2Institute for Chemistry and Biology of the Marine Environment, University of Oldenburg, Oldenburg, Germany
- 3Group Genomic Analytics, Helmholtz Centre for Infection Research, Helmholtz Association of German Research Centers, Braunschweig, Germany
- 4Research Core Unit Metabolomics, Institute of Pharmacology, Hannover Medical School, Hanover, Germany
Quorum sensing (QS) coordinates population wide gene expression of bacterial species. Highly adaptive traits like gene transfer agents (GTA), morphological heterogeneity, type 4 secretion systems (T4SS), and flagella are QS controlled in Dinoroseobacter shibae, a Roseobacter model organism. Its QS regulatory network is integrated with the CtrA phosphorelay that controls cell division in alphaproteobacteria. To elucidate the network topology, we analyzed the transcriptional response of the QS-negative D. shibae strain ΔluxI1 toward externally added autoinducer (AI) over a time period of 3 h. The signaling cascade is initiated by the CtrA phosphorelay, followed by the QS genes and other target genes, including the second messenger c-di-GMP, competence, flagella and pili. Identification of transcription factor binding sites in promoters of QS induced genes revealed the integration of QS, CtrA phosphorelay and the SOS stress response mediated by LexA. The concentration of regulatory genes located close to the origin or terminus of replication suggests that gene regulation and replication are tightly coupled. Indeed, addition of AI first stimulates and then represses replication. The restart of replication comes along with increased c-di-GMP levels. We propose a model in which QS induces replication followed by differentiation into GTA producing and non-producing cells. CtrA-activity is controlled by the c-di-GMP level, allowing some of the daughter cells to replicate again. The size of the GTA producing subpopulation is tightly controlled by QS via the AI Synthase LuxI2. Finally, induction of the SOS response allows for integration of GTA DNA into the host chromosome.
Introduction
Microbial communication based on quorum sensing (QS) is a process whereby bacteria adjust their behavior depending on the cell density (Miller and Bassler, 2001). A QS system consists of one or more synthases that produce small diffusible molecules termed autoinducers (AI) which are released to the exterior of the cell. A minimum threshold of AI is sensed by corresponding receptors that thereupon adjust the gene expression directly or via signaling cascades. Multiple AI have been found, although oligopeptides and N-acyl-L-homoserine lactones (AHL) make up the majority of AI in Gram-positive and Gram-negative bacteria, respectively (Miller and Bassler, 2001; Papenfort and Bassler, 2016). Sensing of population density and integration of this information with environmental and intracellular signals allows for a coordinated decision-making process important for the production of public goods like antibiotics and exoenzymes, biofilm formation and dispersal, metabolic diversification of an isogenic population and self-destructive cooperation (Nadell et al., 2008).
A putative example for the latter process currently under debate (Redfield and Soucy, 2018) is horizontal gene transfer mediated by small virus-like particles. These so-called gene transfer agents (GTAs) are ubiquitous in Rhodobacterales and especially well-studied in Rhodobacter capsulatus. GTAs are considered to be descendants of a prophage that was integrated into an alphaproteobacterial ancestor and was brought under the control of the QS gene regulatory system of the bacterial host (Lang and Beatty, 2007).
Rhodobacter capsulatus and Dinoroseobacter shibae are the only two organisms known in which QS controls expression of the CtrA phosphorelay and its targets such as GTAs. This relay consists of a histidine kinase CckA, phosphotransferase ChpT and transcriptional regulator CtrA and is best known for its role in controlling the asymmetric cell division of Caulobacter crescentus (Laub et al., 2002) into dimorphic cells being either swarmer or stalked with pilus and flagellum or stalk and holdfast, respectively (Mignolet et al., 2018). In R. capsulatus CtrA regulates expression of genes for GTA synthesis, competence family proteins and motility (Leung et al., 2012, 2013; Mercer et al., 2012; Brimacombe et al., 2014). A physiological clue that is integrated in the downstream decision making process is DNA strand stress via the SOS response master regulator LexA (Kuchinski et al., 2016). The LexA repressor undergoes autoproteolysis upon interaction with a complex of RecA and single stranded DNA (ssDNA). In R. capsulatus LexA autoproteolysis releases the promoter of cckA and thereby affects the phosphorylation of CtrA and its regulated traits (Westbye et al., 2017b, 2018).
Quorum sensing systems are especially common in the diverse and widely distributed Roseobacter group of marine Rhodobacteraceae (Simon et al., 2017). Members of this group represent the predominant part of the prokaryotic community in algae blooms (Gonzalez and Moran, 1997; Segev et al., 2016) and Dinoroseobacter sp. have been found to dominate the bacterial community associated with the dinoflagellate Ostreopsis cf. ovata (Guidi et al., 2018). QS in the Roseobacter group is of special interest as algal blooms and biofilms are environments that are better suited for communication via diffusible molecules than the open ocean (Cude and Buchan, 2013).
The QS system of D. shibae is one of the best studied among the Roseobacters. It consists of three AHL synthases, two of them located on the chromosome (LuxI1,2) and one on the 86-kb plasmid (LuxI3), each of them in an operon with a putative LuxR-type transcriptional regulator (Patzelt et al., 2013). D. shibae produces long chain AHLs with varying side chain lengths (C14–C18) and modifications (Neumann et al., 2013; Wang et al., 2014b). While LuxI1 was identified to mainly synthesize AHLs with side chain length of 18 carbon atoms (C18en and C18dien HSL), LuxI2 and LuxI3 synthesize mainly AHLs with side chains of 14 carbon atoms (C14en and 3-oxo C14 HSL) (Neumann et al., 2013; Patzelt et al., 2013; Wang et al., 2014b). The exact structure of the AHLs synthesized in the original host D. shibae differs from that of the enzymes cloned in E. coli; experiments with purified AI synthases showed that this is caused by the type of fatty acids available (Ziesche et al., 2018).
The D. shibae QS system is organized hierarchically, as revealed by gene deletion analyses: Deletion of luxI1 results in a QS null mutant which does not produce detectable levels of AHLs (Patzelt et al., 2013). The product of the LuxI1 synthase induces expression of the CtrA phosphorelay which induces expression of the luxI2 and luxI3 operons as well as QS target genes, including those for biosynthesis of flagella and GTAs. In contrast, the plasmid located type IV secretion systems (T4SS) are induced by QS but not as a part of the CtrA phosphorelay (Wang et al., 2014b). QS activation of the CtrA phosphorelay has been shown to affect the chromosome content of cells and their morphological differentiation (Patzelt et al., 2013; Wang et al., 2014b). The effects of the luxI1 knockout could be complemented by external addition of a wide variety of long chain AHLs (Patzelt et al., 2013, 2016). While knockout of luxI1 and CtrA phosphorelay genes resulted in the decrease of the expression of GTA genes, knockout of luxI2 resulted in their overexpression (Tomasch et al., 2018).
In this study, we aimed to unravel the temporal sequence of gene regulation of the QS system in D. shibae by examination of the time series transcriptome of a QS null mutant (ΔluxI1) to external AI addition. By determining transcription factor binding sites in silico we further analyzed if in D. shibae the SOS response is incorporated via LexA into the decision making as it has been found for R. capsulatus. To understand the consequences of transcriptional activation on a physiological level we analyzed the influence of the added AI on the chromosome content on the single cell level by flow cytometry and determined the GTA major capsid protein (MCP) as well as the second messenger c-di-GMP. Since replication and QS have been shown to interact via the CtrA phosphorelay, we analyzed the chromosomal localization of the major transcriptional regulators in both D. shibae and R. capsulatus and found that most of them have conserved positions relative to the origin and terminus of replication. Based on this study we were able to develop a hypothetical model for the integration of QS, replication control, and SOS response in D. shibae.
Materials and Methods
Bacterial Strains, Growth Conditions, and AHLs
D. shibae strains DFL12T (DSM16493) ΔluxI2 and ΔluxI1 (Patzelt et al., 2013) were cultivated in the dark at 30°C and 160 rpm in half concentrated Marine Broth (MB) or the chemically defined artificial sea water media (SWM) supplemented with 5 mM succinate (Tomasch et al., 2011). To prepare 1 mM stock solutions of 3-oxo C14 HSL (Cayman Chemicals, Ann Arbor, MI, United States) this compound was dissolved in dimethylsulfoxid (DMSO) while the stock of 1 mM C18 dien HSL (Institute of Organic Chemistry, TU Braunschweig, Germany) was dissolved in dichloromethane (DCM). 3-oxo C14 HSL was chosen as inducing AHL for transcriptomics, as it is commercially available, while C18 dien HSL had to be synthesized by cooperation partners and was not available on a regular basis.
Induction Conditions
Precultures were prepared by spreading glycerol stocks on ½ MB plates and used to inoculate 20 mL liquid media (SWM with 5 mM succinate) with a loopful of bacteria and incubated overnight. Main cultures were inoculated to an optical density at 600 nm (OD600) of ∼0.01 and grown to an OD600 of ∼0.22 before treatment with 500 nM 3-oxo-C14-HSL (Supplementary Figure S1, induced) or an equal volume of DMSO (non-induced control). The concentration of 500 nM has been shown to be the lowest concentration that fully restores the transcriptome of the ΔluxI1 mutant for all tested AHLs (Patzelt et al., 2016). The onset of the logarithmic phase is reached at an OD600 of ∼0.2 (Supplementary Figure S2), at which point QS regulated traits have previously been shown to be already expressed (Patzelt et al., 2013). The influence of AHLs and DMSO on the growth rate of the cultures was determined in a separate experiment. It differed only slightly, thus no major differences for the effect of growth between AHL and DMSO treated cultures were expected (Supplementary Figure S3).
Time Course Experiment and RNA Isolation
Three 120 mL main cultures of D. shibaeΔluxI1 were inoculated from precultures as described above. After reaching the desired OD600 cultures were split into two cultures (induced and non-induced control) and incubated as described above. Before the split and at time points 10, 20, 40, 60, 120, and 180 min post-induction, two samples of 2 mL per treatment were withdrawn for transcriptomics and processed immediately. Additionally, 1 mL samples were withdrawn for flow cytometric analysis. The transcriptome samples were centrifuged (13,000 rpm, 1 min, room temperature), the supernatant was removed, and 500 μL Trizol reagent (Ambion, Life Technologies, Carlsbad, CA, United States) was added. Samples were snap frozen using liquid nitrogen and stored at -70°C. Isolation of RNA was performed as described (Wang et al., 2014a). RNA amount was determined using the NanoDrop spectrophotometer (Peqlab, Erlangen, Germany). The following samples were sequenced in three biological replicates: pre-induction, 10, 20, 40, 60, 120, and 180 min post-induction with AHL, 60 and 180 min after addition of the solvent DMSO (control).
RNA Sequencing and Data Processing
Total RNA was treated with the RiboZero kit (Illumina, San Diego, CA, United States) to remove ribosomal RNA following the manufacturer’s protocol. Single end, strand specific cDNA libraries were prepared using the Scriptseq v2 RNA-Seq Library Preparation Kit (Illumina, San Diego, CA, United States) following the manufacturers protocol. For sequencing equal volumes of libraries (12 pM) were multiplexed on a single lane. Sequencing was done on the HiSeq 2500 (Illumina, San Diego, CA, United States) using TruSeq SBS Kit v3 – HS (Illumina, San Diego, CA, United States) for 50 cycles resulting in 50 bp reads. Image analysis and base calling were performed using the Illumina pipeline v 1.8 (Illumina, San Diego, CA, United States). The demultiplexed raw fastq-files were quality-controlled using the FASTQ-mcf suite1. Low quality bases (Phred-score <30) and Illumina adaptors were clipped. Reads were mapped to the reference genome using bowtie2 (Langmead and Salzberg, 2012) with default parameters for single end reads.
Ambiguously mapping reads were randomly distributed between all regions to which they could be assigned. The plasmids of D. shibae contain highly syntenic regions with strong sequence conservation. These include large parts of the 191 kb and 126 kb plasmids (Wagner-Döbler et al., 2010) as well as a transposable element with the thiC gene in center duplicated on three plasmids (Tomasch et al., 2018) As reads could not be assigned unambiguously we would otherwise loose information on the expression of these regions. None of these syntenic regions showed a change in expression in the conducted experiments.
The resulting sam-files were converted to indexed binary format and pile-up format using samtools (Li et al., 2009). The program featureCounts (Liao et al., 2014) was used to count the reads mapping to genes. Accession numbers of the reference genome of D. shibae: chromosome, 3.79 Mb (NC_009952.1); pDSHI01, 191 kb (NC_009955.1); pDSHI02, 153 kb (NC_009956.1); pDSHI03, 126 kb (NC_009957.1); pDSHI04, 86 kb (NC_009958.1); pDSHI05, 72 kb (NC_009959.1).
Data Availability
Raw and processed RNA-sequencing data have been deposited at the gene expression omnibus database under accession number GSE1221112.
Statistical Analysis
The quality of replicate samples was assessed by manual inspection of scatter plots and by calculating the Pearson correlation coefficient (Supplementary Figure S4). The R-package edgeR (Robinson et al., 2010) was used to identify genes with a significant change in expression. Differential expression was assessed separately for the AHL and DMSO treated samples. Only genes with a false discovery rate <0.05 and an absolute log2 fold-change >1 compared to time point t = 0 were considered. Additionally, genes that had an absolute log fold-change difference >1 between AHL treatment and DMSO treatment (control) at 60 min or 180 min were removed from the dataset (approximately 130 genes), as these genes likely had changed either due to addition of DMSO or as a result of cultivation time. The dataset was further manually checked for genes slightly below the chosen cut-off but likely not part of the QS response because they were part of an operon or gene cluster that also changed in expression during the control treatment. The strong down-regulation of photosynthesis-related genes in the later AHL-treated and DMSO-treated samples was most probably caused by light-exposure of the samples during sampling. We previously demonstrated the repressing effect of light on these genes (Tomasch et al., 2011). Differential expression of all 4,192 protein coding genes for all treatments can be found in Supplementary Table S1. The 243 genes considered as responding to the addition of AHLs and further analyzed can be found in Supplementary Table S2.
Flow Cytometry
SybrGreen stains DNA stoichiometrically and is therefore suited for determination of the chromosome content of cells. In particular the two peaks often observed for slow growing bacteria allow to differentiate between pre- and post-replication cells (Marie et al., 1997). Samples of 1 mL were fixed using 80 μL 2% glutaraldehyde (Heidelberg, Germany) and analyzed using a BD FACS Canto flow cytometer (BD Biosciences, San Jose, CA, United States). Samples were diluted if necessary using PBS (8 g NaCl, 0.2 g KCl, 1.44 g Na2HPO4, 0.24 g KH2PO4, dissolved in 1 L distilled water, autoclaved and sterile filtered) and stained with 10 μL mL-1 SybrGreen I (Molecular Probes, Leiden, Netherlands). The signal was monitored using the FITC filter (excitation 488 nm, emission 519 nm).
In silico Determination of Transcription Factor Binding Sites
CtrA transcription factor binding sites (TFBS) were determined using the matchPWM function of the R-package Biostrings as described before (Wang et al., 2014b). We used the position weight matrix (PWM) determined for several alphaproteobacteria (Brilli et al., 2010), but tested three different minimum matching scores of 85, 82.5, and 80% (Supplementary Table S3). After manual inspection of the obtained sequences we decided to use a cut-off of 82.5%. To determine LexA TFBS in D. shibae 80 alphaproteobacterial sequences with in silico determined LexA binding site were downloaded (Erill et al., 2004). These sequences had been obtained by comparison of alphaproteobacterial whole genome sequences with the known E. coli LexA binding sequence. Based on these sequences a position weight matrix (PWM) was generated and searched for in the D. shibae genome. Genes with a minimum matching score of 82.5% were kept and ordered to two groups, the GTTC consensus and GAAC consensus motifs (Supplementary Table S3). The sequence logo was obtained using the Weblogo service of the Computational Genomics Research Group (Crooks et al., 2004).
Determination of the Origin and Terminus of Replication
Both origin (Ori) and terminus (Ter) of replication were obtained from the DoriC database (Luo et al., 2018) and confirmed using the GC skew. The GC skew describes the preference of guanine and thymine on the leading and adenine and cytosine on the lagging strand. Thereby, a switch between nucleotide preferences at the Ori and Ter has been observed (Lobry, 1996).
Western Blots
Western blotting was performed to detect the MCP of GTAs. Main cultures of ΔluxI1 and ΔluxI2 had been prepared as described above. Strain ΔluxI2 was included as positive control as it is a GTA overproducing strain (Tomasch et al., 2018). ΔluxI1 was treated with 3-oxo C14, C18dien HSL or DMSO as negative control. A final concentration of 500 nM was used unless indicated otherwise. Samples of 400 μL were withdrawn, pelleted by centrifugation (17,000 × g, 2 min) and resuspended in 400 μL TE buffer. 5 μL of each sample was mixed with 6× Laemmli sample buffer. Before Western blotting, samples were heated (98°C, 5 min) and centrifuged (3,000 rpm and 2 min). SDS-PAGE and immunoblotting were performed as described before (Fu et al., 2010). However, instead of 10% polyacrylamide gels, 12% gels were used for protein separation and the antibodies were added at concentrations of 1:1000. The primary antibody (AS08365, Agrisera AB), detecting the GTA MCP (Dshi_2174) was incubated at 4°C overnight and the AP conjugated secondary antibody (AS09607, Agrisera AB) was incubated for 1 h. For chemiluminescent detection, the membrane was incubated in 1% alkali-soluble casein (Merck Millipore) utilized as blocking substance until visualization. For luminescence induction the membrane was then covered with CDP-Star AP Substrate (Merck Millipore) and signals visualized using the imaging system Las-3000 (FujiFilm Europe GmbH).
Extraction and Quantification of C-di-GMP
Cultures were grown to the desired OD600, 5 mL were withdrawn, and samples were centrifuged (20 min, 4°C, 2,500 × g). The supernatant was discarded, and the pellet resuspended in 500 μL SWM. The sample was centrifuged again but the remaining pellet was resuspended in 300 μL solvent (acetonitrile/methanol/water 2:2:1). Incubation on ice for 15 min and heating at 95°C for 10 min were followed by cooling down on ice. After further centrifugation (10 min, 4°C, 20,800 × g) the pellet was resuspended in 200 μL solvent and the supernatant stored at -20°C overnight for allowing optimal protein precipitation. The pellet was resolved in 200 μL solvent (acetonitrile/methanol/water 2:2:1) (without heating to 95°C again), and this step was repeated twice. The final pellet was used for determination of total protein concentration applying the bicinchoninic acid (BCA) method as described below. The supernatant of overnight protein precipitation was centrifuged for 10 min at 4°C, 20,800 × g and the resulting supernatant stored at -70°C. C-di-GMP was quantified in this supernatant using mass spectrometry as described before (Bähre and Kaever, 2017).
Determination of Protein Concentration
The total protein concentration was determined using the BCA assay kit (Lot P120456, Serva) according to the manufacturer’s protocol. Pellets from 1 mL cell culture were resuspended in 800 μL 0.1 M NaOH and heated for 15 min at 95°C. Successful lysis of the cells was controlled by microscopy. Cell debris was removed by centrifugation (10 min, 4°C, 20,800 × g) and 100 μL supernatant was transferred to 2 mL BCA working solution and incubated at 60°C for 15 min. After cooling to room temperature, the OD was determined at 562 nm photometrically (Ultrospec 3100 pro).
Results
We followed the transcriptional response of the QS null mutant D. shibaeΔluxI1 toward an externally added AHL for 3 h. In order to discriminate between fast and slow responding genes, the first hour post-induction was densely sampled. To induce QS, we spiked the culture with 500 nM 3-oxo C14 HSL. This AHL is the second most abundant AHL synthesized by D. shibae (Ziesche et al., 2018) and it is the product of the synthases LuxI2 or LuxI3 which are under the control of LuxI1 (Patzelt et al., 2013). Previously we showed that various long chain AHLs of D. shibae, including the most abundant AHL, C18 dien HSL, as well as 3-oxo C14 HSL fully restore the effects of the luxI1 deletion on the transcriptional and physiological level (Patzelt et al., 2016).
Time Series Transcriptomic Response Toward AHL Addition
The time series analysis of the transcriptome up to 3 h post induction (Supplementary Table S1), revealed 243 genes with significant change of expression compared to t = 0 (before induction), of which 235 were located on the chromosome (Supplementary Table S2). Only 49 genes were downregulated, most strongly the putative transcription factor Dshi_2775. The alginate-biosynthesis operon provided a rare example of transient activation within the first hour post induction. Below we focus on potential targets activated by the CtrA phosphorelay and genetic modules to which we could assign clear functions using comparative genomics (Supplementary Table S4). The expression profiles of these 107 selected genes are displayed in Figure 1.
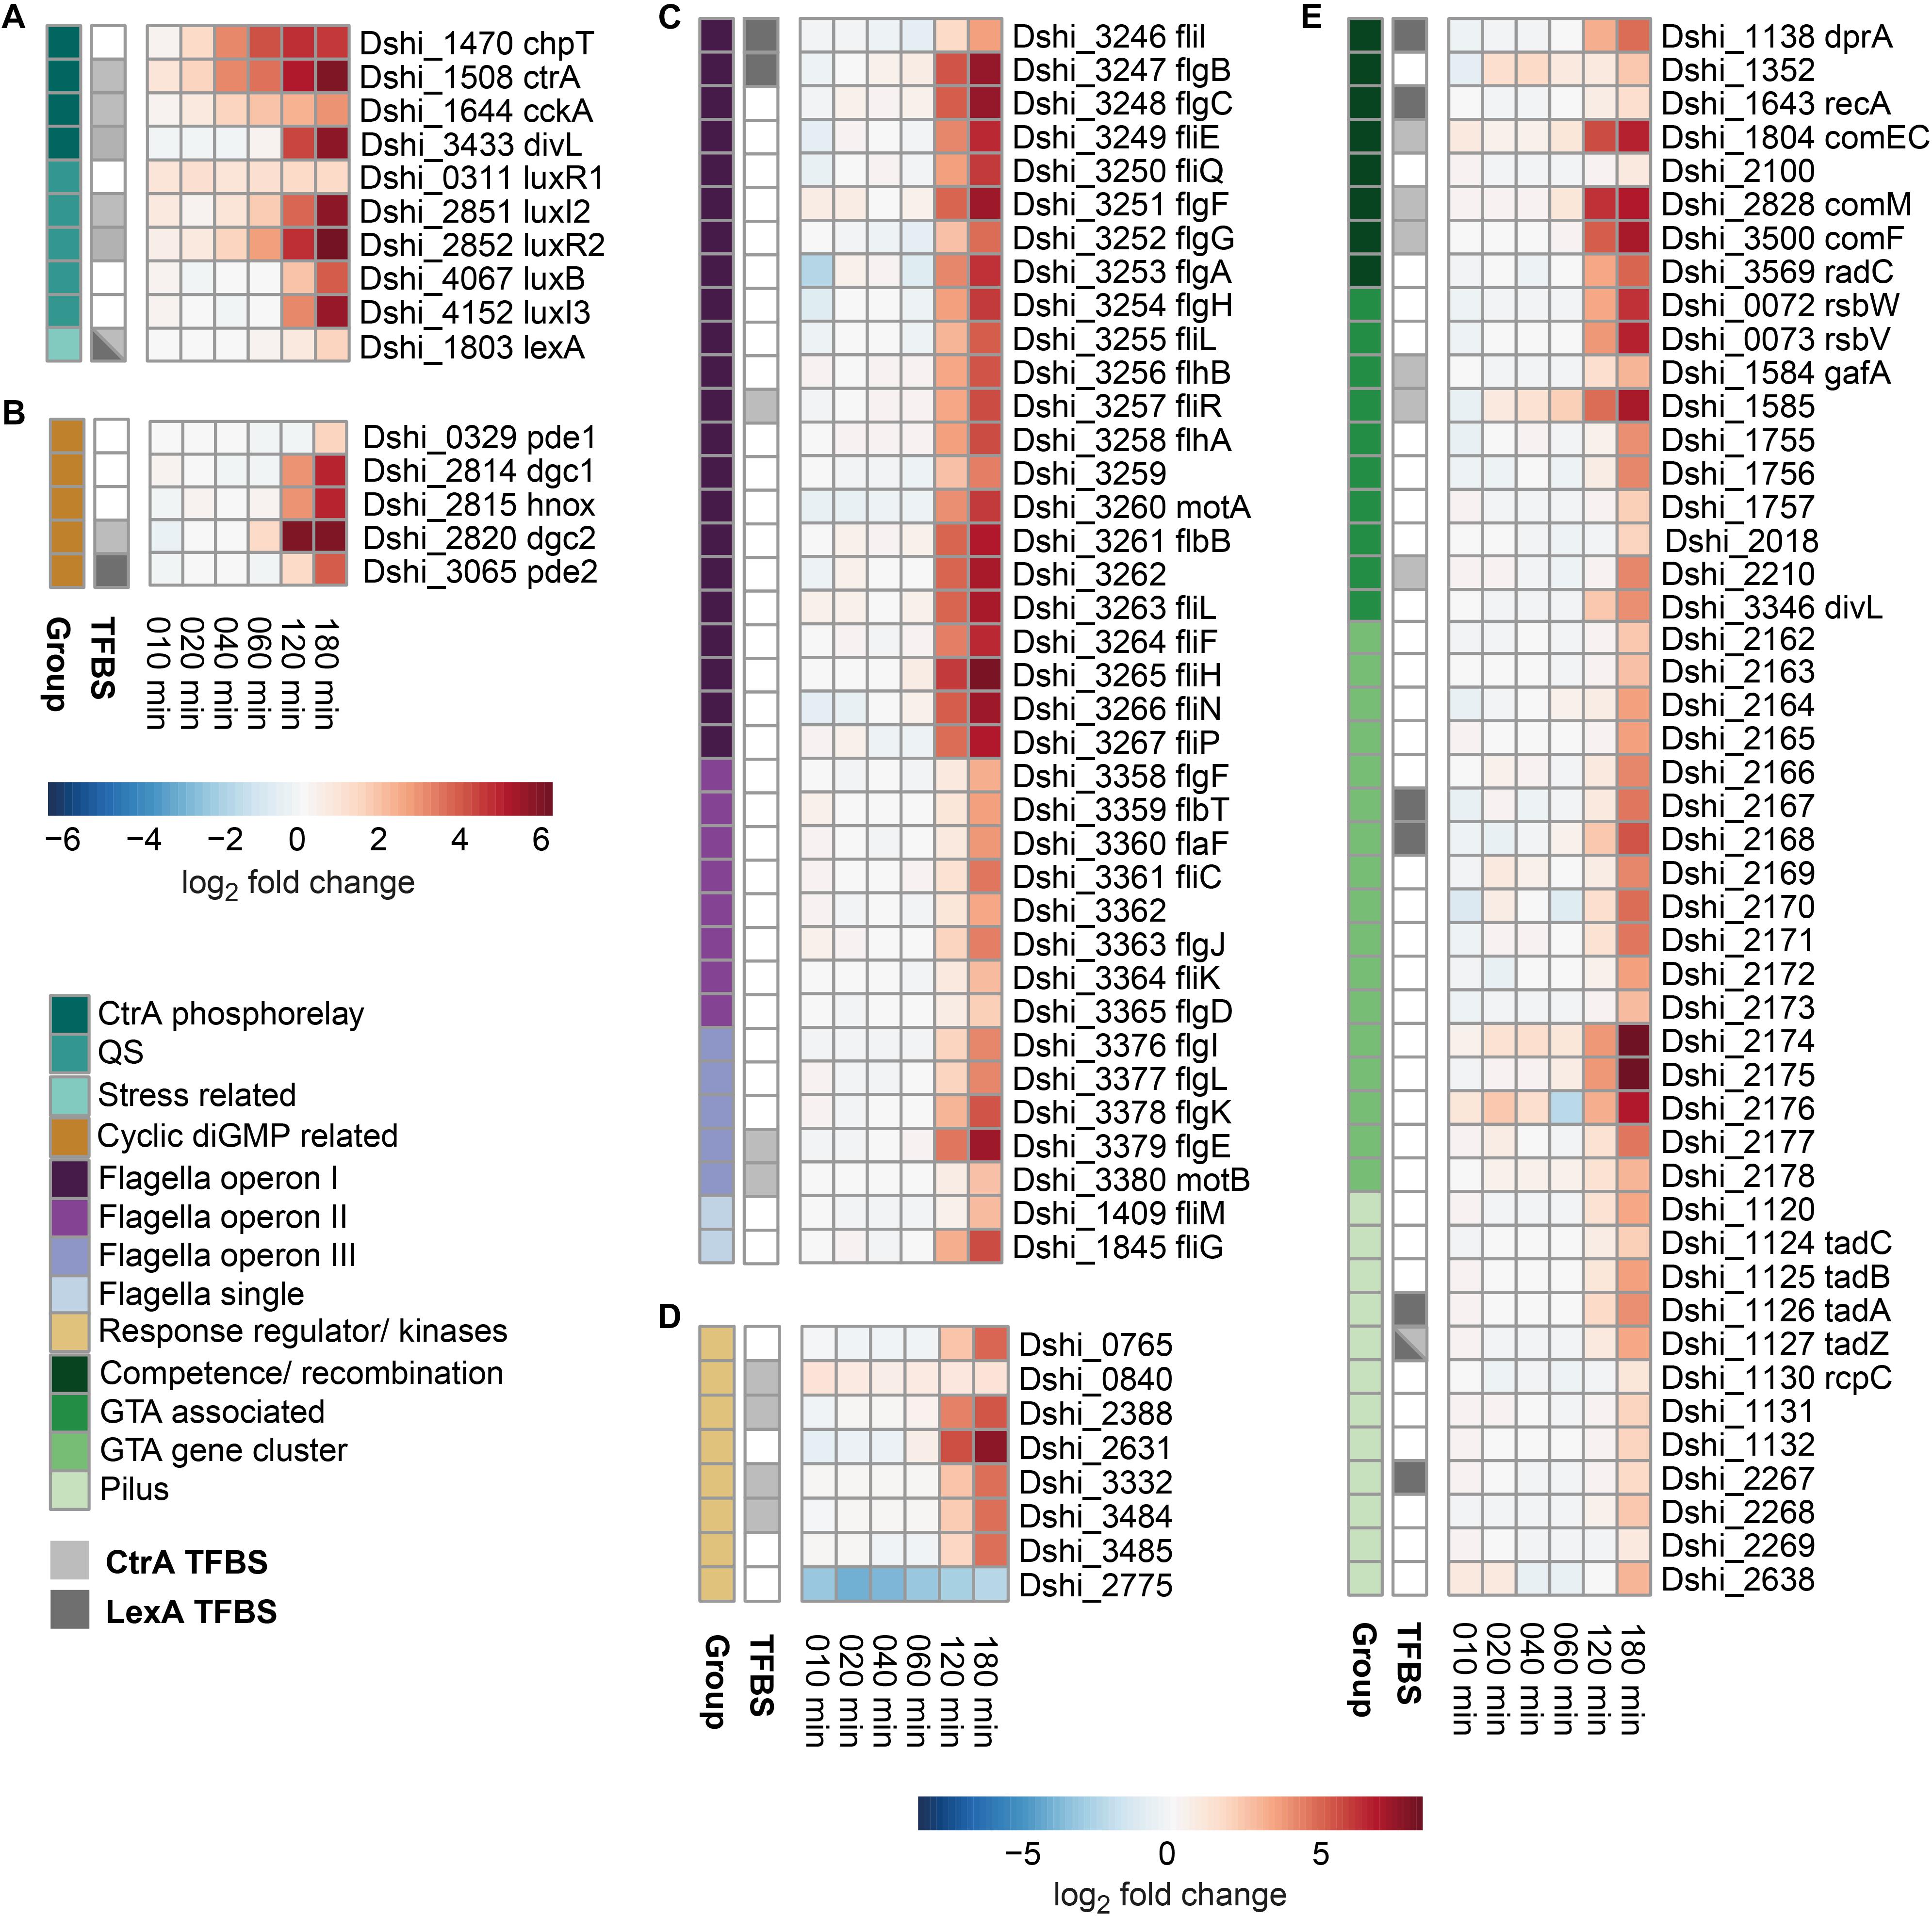
Figure 1. Time resolved transcriptomic analysis of a D. shibae quorum sensing null mutant response toward 3-oxo C14 HSL addition. D. shibae ΔluxI1 cells were induced by addition of either 500 nM AHL or DMSO. At multiple time points samples were withdrawn and the differential gene expression evaluated and displayed in this heatmap. Regulated genes were organized into the color indicated categories displayed in multiple heatmaps (A–E). Transcription factor binding sites (TFBS) for CtrA and LexA were obtained by matching a position weight matrix based on known binding sites in other alphaproteobacteria on the D. shibae genome.
Quorum Sensing and CtrA Phosphorelay
In Figure 1A genes of the CtrA phosphorelay (ctrA, chpT, cckA), AHL synthases (luxI2, luxI3), the corresponding transcriptional regulators (luxR1 and luxR2, luxB), the cell division protein divL (included due to its CckA modulating effect in Caulobacter) and the response regulator lexA are shown. A clear timing of transcription initiation could be observed (Supplementary Figure S5): CtrA and chpT showed an immediate sharp increase in expression while cckA expression increased with a less steep slope. While chpT reached a maximum after 60 min, transcriptional activation of the other two genes slowed down after 40 min but continued to increase. The QS genes luxI2/luxR2 started to increase 20 min after AHL addition, and luxI3/luxB transcription increased more than 60 min after stimulation with AI. Interestingly, the regulator LuxR1, located adjacent to the deleted master synthase LuxI1, was induced already 10 min after AHL-addition and remained at this level throughout the experiment. The genes divL and lexA increased in expression at 2 and 3 h, respectively (Figure 1A).
Enzymes Involved in C-di-GMP Turnover
We found all recently characterized enzymes involved in c-di-GMP turnover of D. shibae (Bedrunka et al., 2018) to be induced by AHL addition (Figure 1B). C-di-GMP is synthesized through condensation by diguanylate cyclases (DGC) and hydrolyzed by phosphodiesterases (PDE). Most organisms possess multiple DGC/PDEs that play a role in various processes (Hengge et al., 2015). D. shibae has two PDE, two DGC and one H-NOX gene which inhibits the adjacent dgc1. Our data revealed a precise timing in the induction of these genes by QS: dgc2 is expressed first from 1 h onward. Dgc1 and hnox expression increased at 2 h post-induction while the hydrolyzing enzymes pde2 and pde1 are activated from 2 and 3 h onward, respectively (Figure 1B). The actual metabolite formation was proven (see below).
Flagella Gene Cluster
The D. shibae flagellum is built from three gene clusters (gene cluster I–III) and two single genes (Figure 1C and Supplementary Table S5). Gene cluster I comprises 22 genes of the flagella basal body, biosynthesis and motor proteins. Gene cluster II comprises eight genes of the flagella regulatory system, flagellin and flagella hook protein. Gene cluster III comprises five genes of hook proteins and chemotaxis system. FliM and FliG are separately located and are known for their roles in the rotor behavior of flagella. Here, we found cluster I to increase in expression at 2 h post-induction while gene cluster II is activated at 3 h. Gene cluster III and the single genes are showing both patterns, activation at 2 or 3 h, depending on the gene. Interestingly the timing of transcriptional activation corresponds to the order of flagella construction, from the components located at the inner membrane to the extracellular parts. A similar expression pattern, dividing the flagella genes in early, middle, and late expressed genes depending on their location, has been described for multiple organism including Escherichia coli and Salmonella enterica (Chilcott and Hughes, 2000).
Other Regulators and Kinases
During the annotation process multiple regulators and kinases potentially involved in signal transduction cascades were identified (Supplementary Table S4). These genes could not be assigned to specific regulatory networks but showed strong differential expression (Figure 1D). Notably, some of these regulatory genes are located near the origin of replication (see below).
Genes Associated With Competence, GTA, and Tad Pilus
DprA, RecA, and the Com family proteins are generally known for their role in competence (DNA uptake from the environment). In R. capsulatus their role in GTA uptake by recipient cells has been shown by gene deletion experiments (Brimacombe et al., 2015). Here, the Com proteins showed already strong activation 120 min post-induction with AHLs.
While Dshi_1585 expression showed an increase already after 40 min, the neighboring gene Dshi_1584, the homolog of the recently identified R. capsulatus direct activator of GTA gene cluster, gafA (Fogg, 2019) started slightly to increase in expression 2 h post-induction. Part of the GTA gene cluster (including Dshi_2174, encoding the MCP) as well as the anti-sigma factor/antagonist pair rsbW/V started to increase in expression at 120 min while the remaining genes of the GTA gene cluster increased in expression 180 min post-induction (Figure 1E). We were further able to annotate multiple GTA associated genes that are involved in GTA synthesis but are not located in the GTA gene cluster (Supplementary Table S4). Notably, the genes in the more upstream part of the GTA gene cluster showed a weak but significant transient increase in expression 20 min post-induction.
Genes originally annotated as type II secretion system were found to be closely related to the Tad pilus secretion system (Supplementary Table S4). This system is encoded by two gene clusters (Dshi_1117-1132, 2267-2269) and a single gene (Dshi_2638). Some of these genes were not identified in the processed transcriptomic data but still showed similar activation behavior, however, below the cut off criteria. The pilus subgroup is the last to be upregulated, at 180 min at a low, but increasing level which might be the reason for the elimination of genes of this cluster from the processed data.
Putative Transcription Factor Binding Sites for CtrA and LexA
Now we asked how CtrA was involved in the regulation of the examined traits. Therefore we determined transcription factor binding sites (TFBS) in silico with a minimum score of 82.5% identity of the PWM (Supplementary Figure S6) and indicated them next to the transcriptomic data of each gene (Figure 1). We predicted TFBS in the promoter regions of ctrA and cckA. This indicates a feedback loop as CtrA switches into its active version after receiving a phosphate residue from CckA. The phosphorylated CtrA then increases transcription of ctrA and cckA, resulting in an even higher concentration of active CtrA. Furthermore luxI2/R2 and the flagella (Dshi_3257/3379/3380) show CtrA binding sites. The integration of the QS system and CtrA phosphorelay has been known before as well as the regulation of the flagella by QS (Wang et al., 2014b). Additionally, we found putative TFBS in the promoters of the response regulator lexA, as well as in the promoter of dgc2 coding for a c-di-GMP synthesizing enzyme. All three Com-family proteins, possibly involved in uptake of GTA DNA, as well as GTA associated genes (gafA, Dshi_1585/2210), the Tad pilus (Dshi_1127) and four regulator/kinase genes (Dshi_0840/2388/3332/3484) had TFBS for CtrA.
To determine if the SOS response mediated by LexA is integrated into this network, we identified TFBS for LexA in silico. We found putative binding sites in the promoters of lexA itself, in pde2 encoding the c-di-GMP hydrolyzing enzyme, flagella genes (Dshi_3246/3247), the recombination genes dprA and recA, the GTA gene cluster (Dshi_2167/2168) and the pilus (Dshi_1126/1127/2267). In contrast to R. capsulatus, a binding site in the promoter of cckA could not be found. Additionally, the in silico determined LexA binding sites show no binding of any promoters of QS operons. However, LexA regulated traits overlap with CtrA regulated traits in multiple cases. TFBS for both regulators were found in the promotors of lexA itself and Dshi_1127 (Tad pilus), flagella, and c-di-GMP.
Chromosomal Location of QS Regulators
Next, we determined the chromosomal localization of genes and regulators of the D. shibae QS system, especially relative to the Ori and Ter regions (Figure 2A) and compared them to the chromosomal location of homologous regulators in R. capsulatus (Figure 2B).
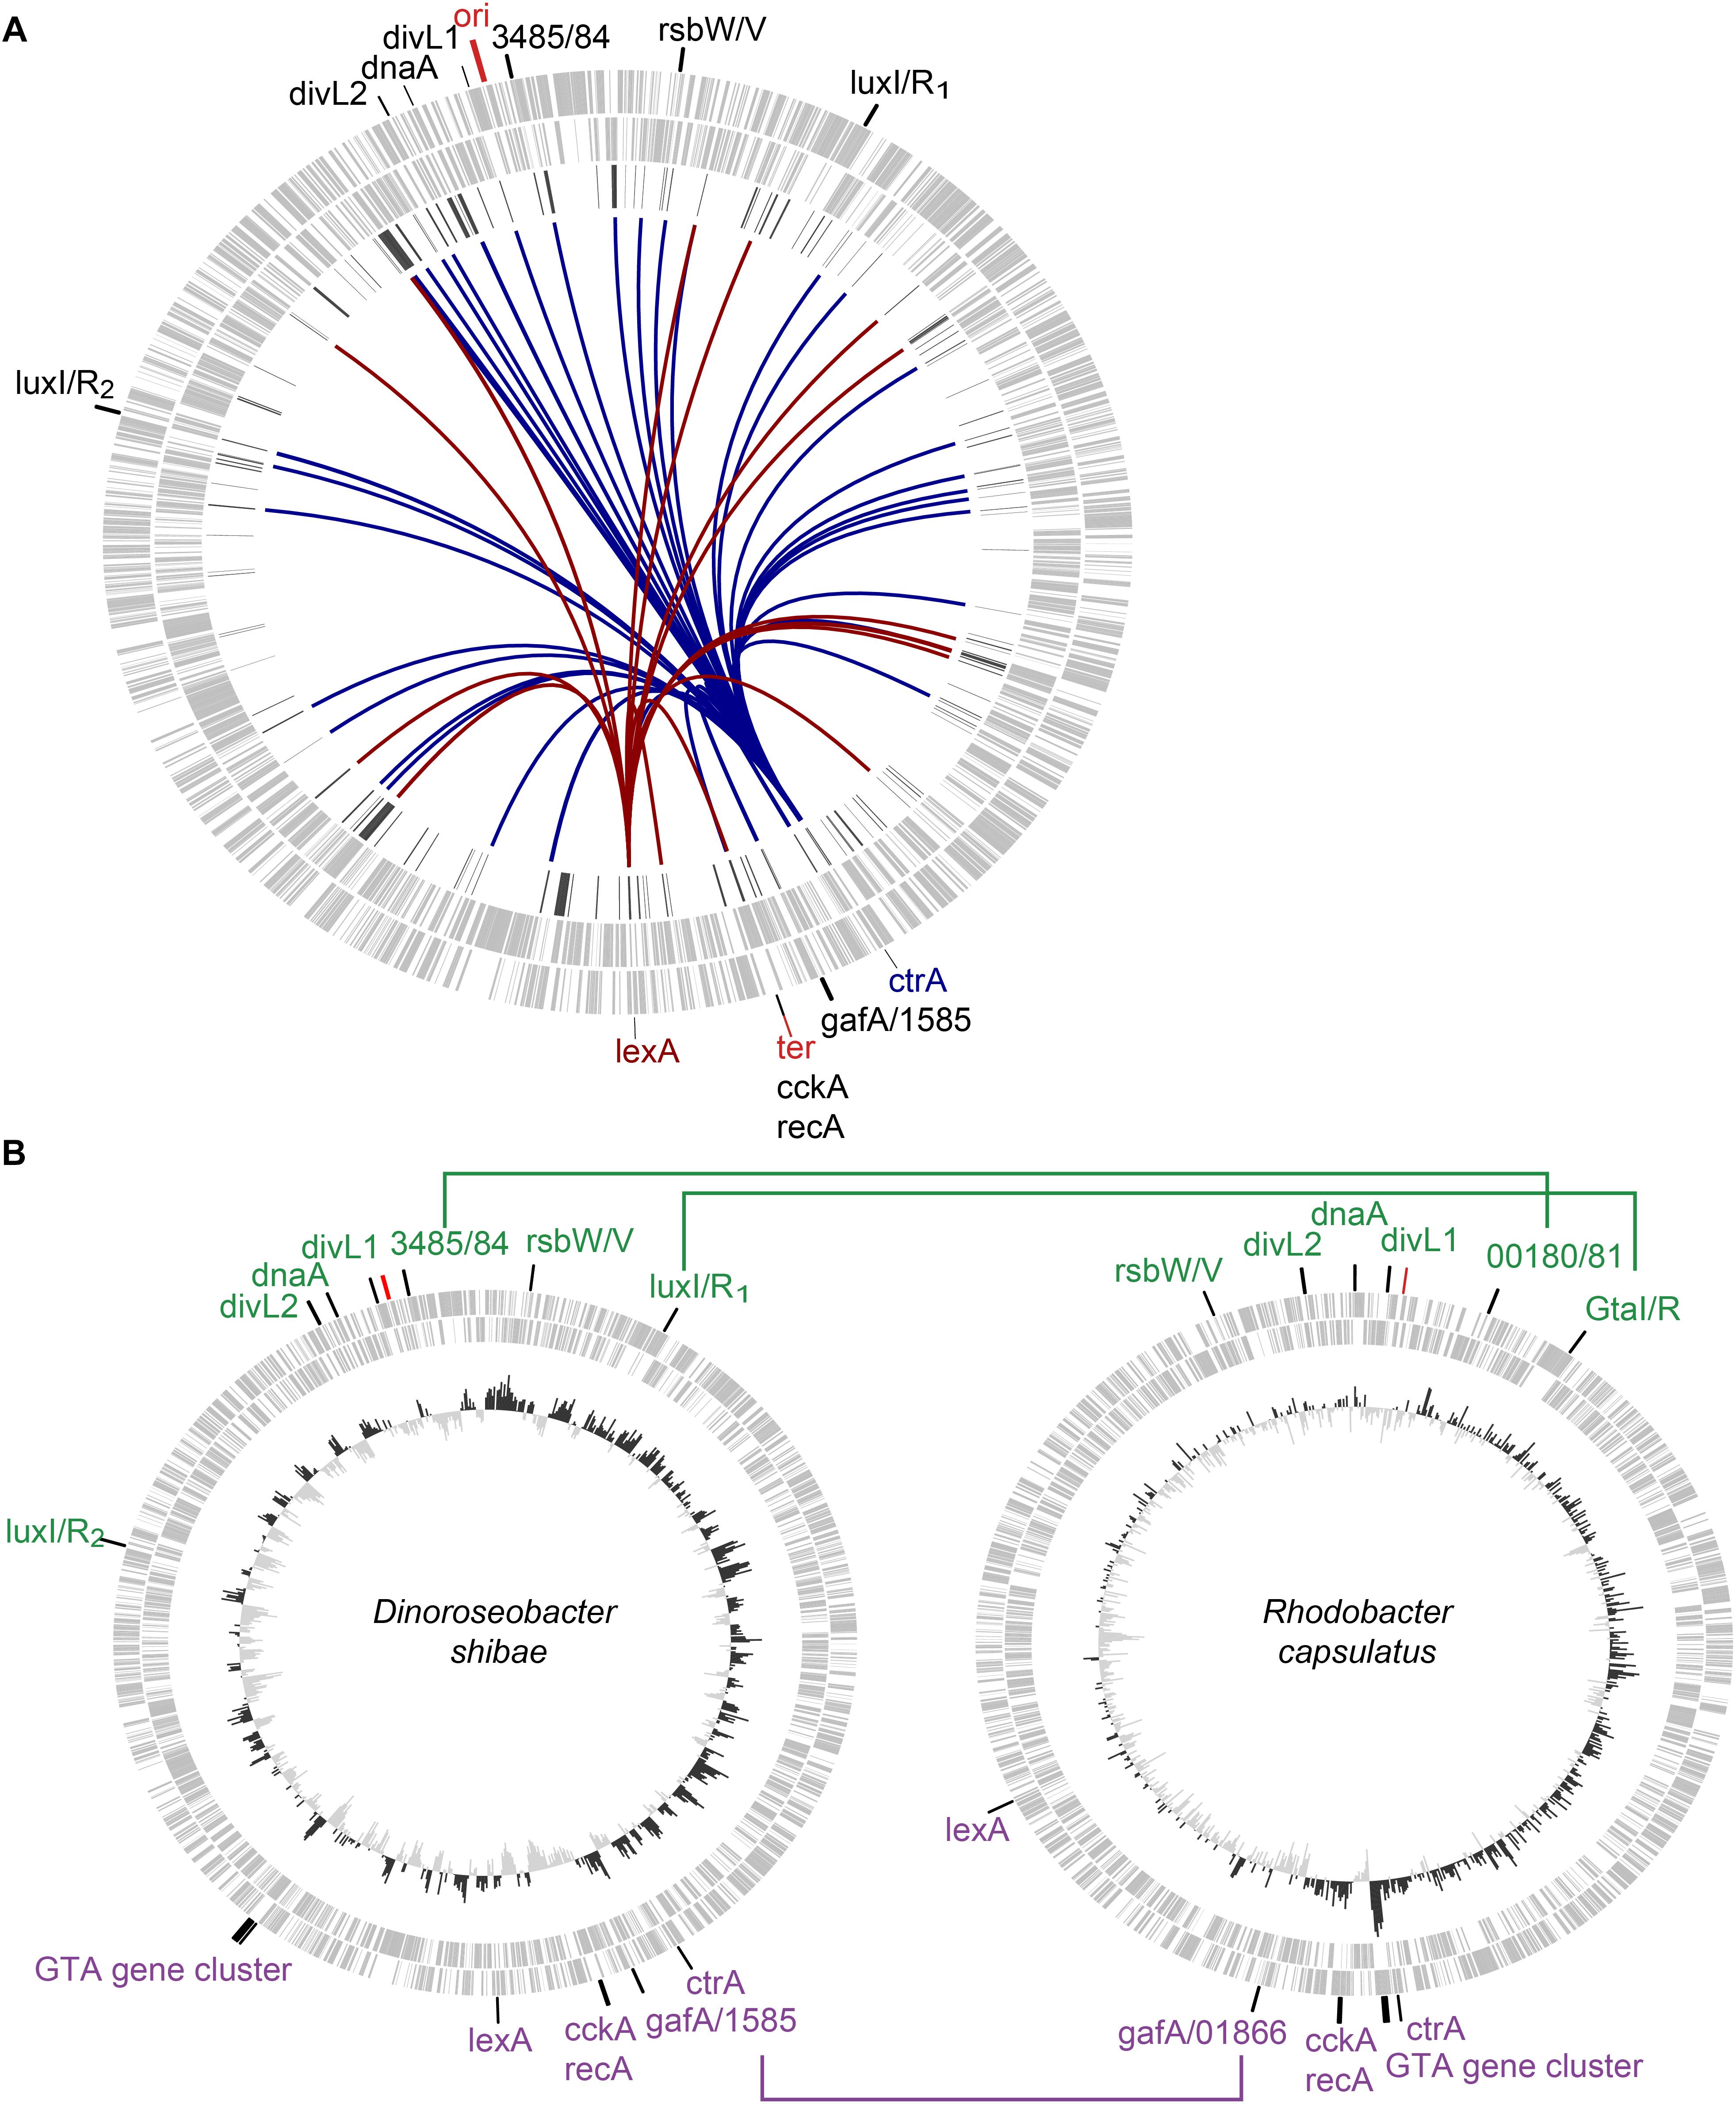
Figure 2. Location of selected regulatory genes on the chromosome of D. shibae (A) and Rhodobacter capsulatus (B). Light gray circles indicate the chromosome strands (out = plus, in = minus). Position of origin of replication (ori) and terminus (ter), determined with website Dori are indicated. Chromosomal locations of genes with a potential or proven role in QS regulation are indicated. (A) The dark gray circle represents the QS regulated genes. Position transcriptional regulators lexA and ctrA are labeled and color indicated. The arcs connect LexA (red) and CtrA (blue) to their binding sites at respective locations. (B) Ori- and ter-located genes in both organisms are highlighted in green and purple, respectively. Orthologs genes with locus tag annotation are connected by lines. The inner circle shows the GC skew.
The genes encoding the two synthases LuxI1 and LuxI2 and their corresponding receptors LuxR1 and LuxR2 (Dshi_0311/0312/2851/2852) are located symmetrically close to the ori.
By contrast, the major transcriptional regulators CtrA and LexA are symmetrically positioned around the terminus (Ter) (Figure 2A). The analysis of TFBS had already shown that they most likely regulate a multitude of QS genes directly. Here, blue and red lines visualize the even distribution of their regulated genes throughout the chromosome. CckA/recA are located directly at the Ter (Supplementary Figure S11). Adjacent to ctrA, the GTA regulators gafA/Dshi_1585 are located. RsbW and rsbV (Dshi_0073/0072) are homologs of the R. capsulatus sigma-factor antagonist and its repressor which control GTA gene expression (Mercer and Lang, 2014) and they are located between luxI1 and the ori. Directly next to the ori the genes Dshi_3485/3484 are located. Dshi_3485 encodes a serine phosphatase domain that is similar to that of stage II sporulation protein E known for its role in septum formation during sporulation in Bacillus (Carniol et al., 2005). It further contains a signal receiver REC-domain to detect signals from the sensor domain of a two component system. Dshi_3484 has a Hpt (histidine phosphotransferase) domain and is possibly interacting with Dshi_3485 in a two component system but has not been assigned to a regulatory context in D. shibae here.
Two other genes, Dshi_3346 and 3433, are also located close to the ori. Both genes are considered DivL proteins after InterPro domain search that revealed the location of two PAS-domains in the CDS of Dshi_3433. Dshi_3346 was identified to contain one PAS domain, a histidine kinase and a signal transduction response regulator receiver domain of the CheY-like superfamily. For comparison, R. capsulatus SB 1003 divL (RCAP_rcc00042) contains one PAS-domain and Caulobacter vibrioides NA1000 divL (CCNA_03598) encodes two PAS-domains and a non-functional histidine kinase domain as identified by InterPro and Westbye et al. (2018). In R. capsulatus DivL regulates CtrA and GTA and in C. crescentus it affects cell cycle regulation via CtrA (Purcell et al., 2008; Westbye et al., 2018). Between the divL genes dnaA (Dshi_3373) was identified.
The location of homologous genes in R. capsulatus shows a very similar pattern (Figure 2B). R. capsulatus has one QS operon, the gtaI/R system, which is found in a similar chromosomal position as luxI/R1. Also, divL1, divL2, dnaA and ctrA can be found at the respective similar positions. The distance to the ori/ter is similar for rsbW/V and rcc01866/rcc01865. Only rcc_00180/1, lexA and cckA/recA are located further away from ori/ter compared to the location of the corresponding homologs in D. shibae.
AHL Induced Physiological Changes
Using SybrGreen staining of DNA, it was previously shown that QS signaling in D. shibae results in a subpopulation of elongated cells with increased chromosome content (Patzelt et al., 2013, 2016). This method allows for differentiation of cells according to their chromosome content (one or two chromosomes shown as peaks with replicating cells in between). Here, we monitored changes in chromosome content over a period of 10 h post-induction by flow cytometry (Figure 3A and Supplementary Figures S7–S10). At t = 0 the chromosome content showed two peaks reflecting populations before (one chromosome, C1) and after replication (two chromosomes, C2). Between the two peaks a population of cells undergoing replication (R) was found. Under these experimental conditions, our data consistently did not indicate accumulation of more than two chromosome equivalents in a sub-population, and population heterogeneity was not observed (see section “Discussion”).
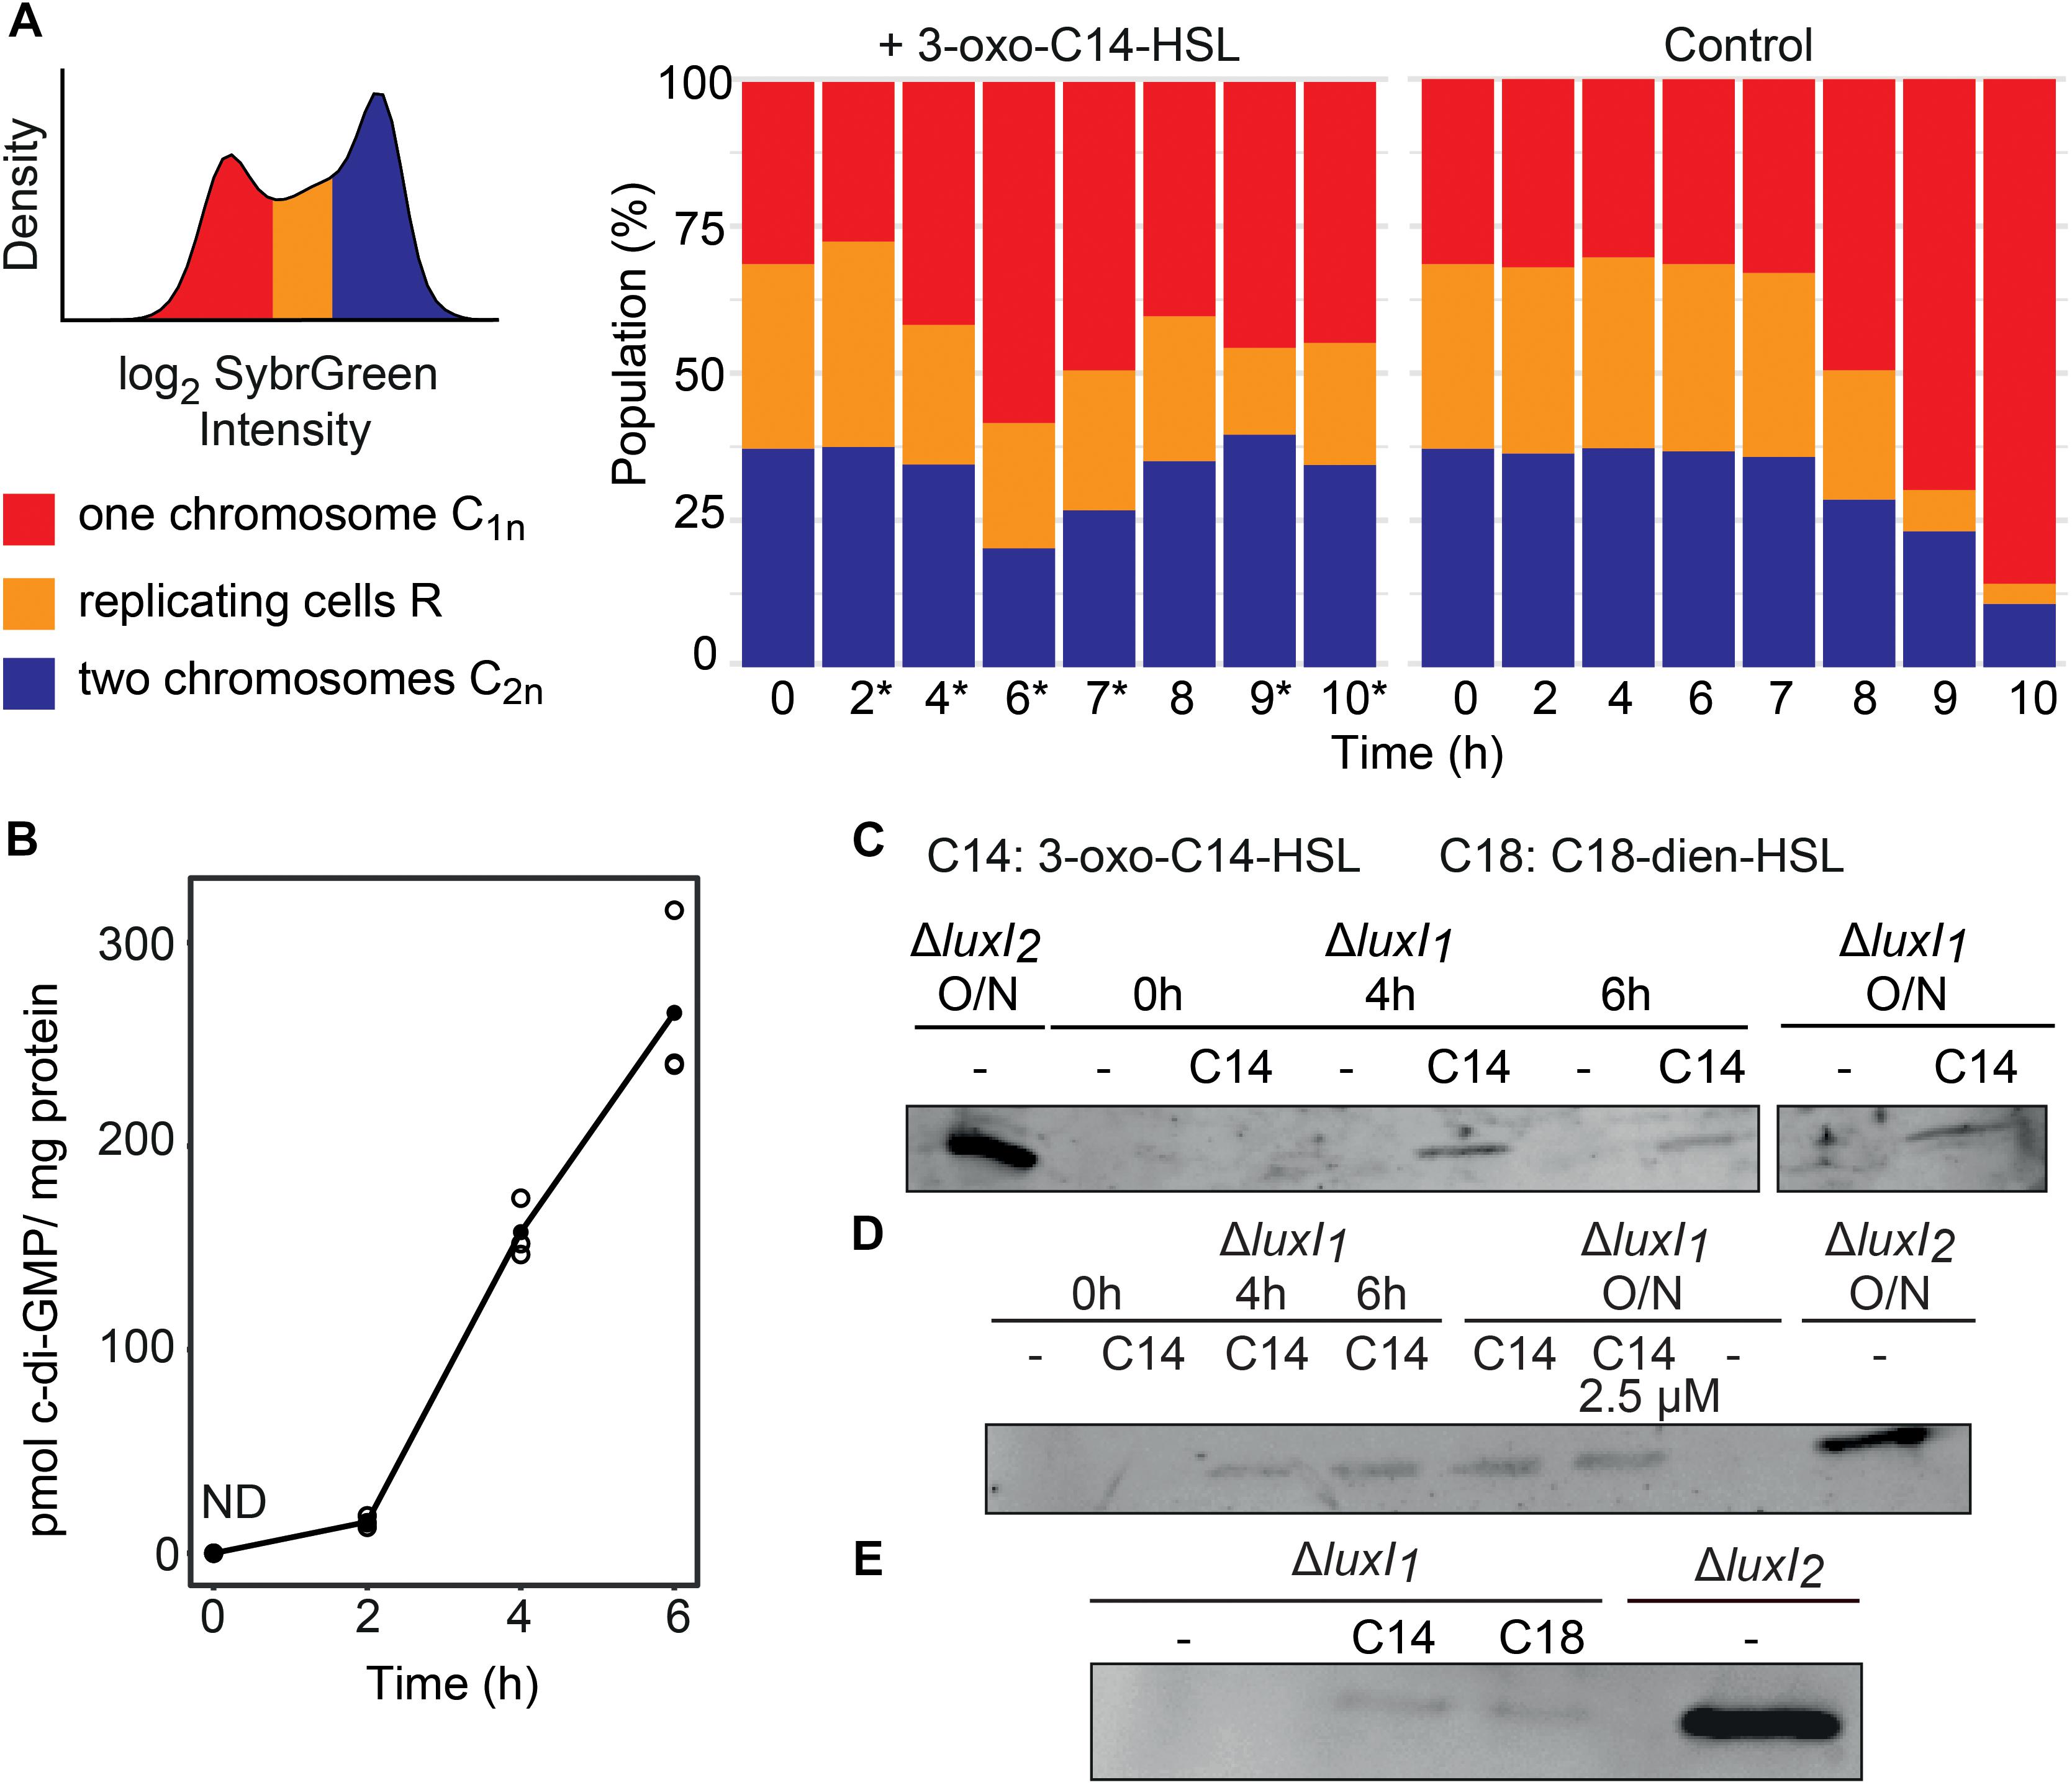
Figure 3. Changes in physiological traits expressed by D. shibae ΔluxI1 in response to external AHL addition. (A) Flow cytometrical determination of the chromosome content by measuring fluorescence intensities of SybrGreen stained cells. The distribution of log2 SybrGreen intensity in the cells (A, left side) shows two peaks C1n (red) and C2n (blue) that represent one and two chromosome equivalents, respectively. Cells undergoing replication (yellow) are located in between. The distribution of the relative chromosome content in the population until 10 h post-induction is displayed for cultures induced by 3-oxo C14 HSL and the control cultures (A, right side). Asterisks indicate significant differences in the proportion of replicating cells between AHL and DMSO treated samples determined with a two-sided t-test. The experiment has been reproduced four times with three replicates each (Supplementary Figures S7–S10). (B) Second messenger c-di-GMP concentration post-induction with 500 nM 3-oxo C14 HSL. Concentrations in pmol c-di-GMP per mg protein were determined for 6 h post-induction by HPLC. ND, not detectable. (C–E) Western blot detection of the GTA major capsid protein in cell extracts of ΔluxI1 induced with 3-oxo C14 (C14) or C18 dien HSL (C18) or non-induced as indicated. (C) Cell extracts at 0, 4, 6 h post-induction and after overnight (O/N) cultivation with 3-oxo C14 HSL and of ΔluxI2 as positive control. (D) Major capsid detection in cell extracts of cultures induced with 500 nM or 2.5 μM AHL and incubated overnight. (E) Induction with 3-oxo C14 or C18 dien HSL.
All replicates of the control showed a similar relative abundance of all three populations (C1, R, C2) until 7 h. Then, a strong reduction of the replicating and post-replication populations (R, C2) was observed, indicating the onset of stationary phase. In contrast, AHL treated cultures increased the replicating fraction at 2 h post-induction significantly. Then the replicating and post-replication populations were reduced from 3 h until 6 h and increased again until the end of the experiment without indication of the onset of the stationary phase. The data show that the AHL directly influenced the pattern of chromosomal replication while we observed balanced growth in the control.
As we found all enzymes involved in c-di-GMP turnover significantly expressed in our time series transcriptomic data (Figure 1C), we were interested in how the expression of these enzymes affected the synthesis of the actual metabolite. Therefore, we determined the metabolite concentration in relation to the total protein concentration during a 6-h period post-induction with AHL (Figure 3B). No c-di-GMP was detected before induction. Between 2 and 6 h the concentration increased from 14.98 to 240.76 pmol c-di-GMP/mg protein. A decrease or plateau formation due to the onset of expression of c-di-GMP hydrolyzing enzymes (pde) was not observed.
Next, we analyzed actual GTA production on the protein level. The MCP was already detected by Western blotting at 4 h post-induction with 500 nM 3-oxo C14 HSL. The obtained band was much weaker than that of the ΔluxI2-strain used as a control (Figure 3C). We then tested if we could increase GTA production by modifying experimental conditions. First, we prolonged the incubation time with AI (overnight) (Figure 3C), second, we increased the AI concentration to 2.5 μM (Figure 3D) and finally we applied C18-dien-HSL, the main AI of D. shibae (Figure 3E), but the amount of MCP remained low. We have recently shown that GTA synthesis is suppressed by LuxI2 (Tomasch et al., 2018), which is confirmed by these experiments. Our data suggest that only a small fraction of the population synthesizes GTA upon AI induction.
Discussion
The Expanded QS Regulon of D. shibae
To study the QS response of D. shibae we used time series transcriptomics and in silico determination of transcription factor binding sites (TFBS). Multiple QS controlled traits had been identified before. Among these are GTAs, flagella, LuxI2 and LuxI3 synthases (Wang et al., 2014b), the T4SS and chromosome replication (Patzelt et al., 2016). While previous analyses relied on the comparison of single gene knock-outs during the mid-exponential phase of growth, here we analyzed the global transcriptomic response of the culture during the first 3 h after stimulation with an externally added AI to unravel the timing of events and the integration between the different signaling circuits. Up-regulation of T4SS was not observed in our experimental set-up, suggesting that it occurs at the late exponential phase of growth.
Our analyses of CtrA, LexA, and QS in D. shibae lead to the model shown in Figure 4A. Based on comparative genomics we were able to add novel traits to the known QS regulatory network, namely synthesis of c-di-GMP, Tad pilus, and competence related proteins, which are discussed in more detail below. Detection of the AI occurs most likely at the cell surface, by an unknown receptor, resulting in simultaneous up-regulation of the intracellular transcriptional regulators CtrA and LuxR1 already 10 min after addition of the AI. Downstream regulation occurs by overlapping TFBS for CtrA and QS resulting in synthesis of flagella, Tad pilus and competence, while c-di-GMP is regulated by CtrA and LexA. The SOS response regulator LexA is controlled directly by CtrA, and it modulates expression of Tad, flagella, c-di-GMP breakdown and LuxR2. Population heterogeneity is likely for all of these traits.
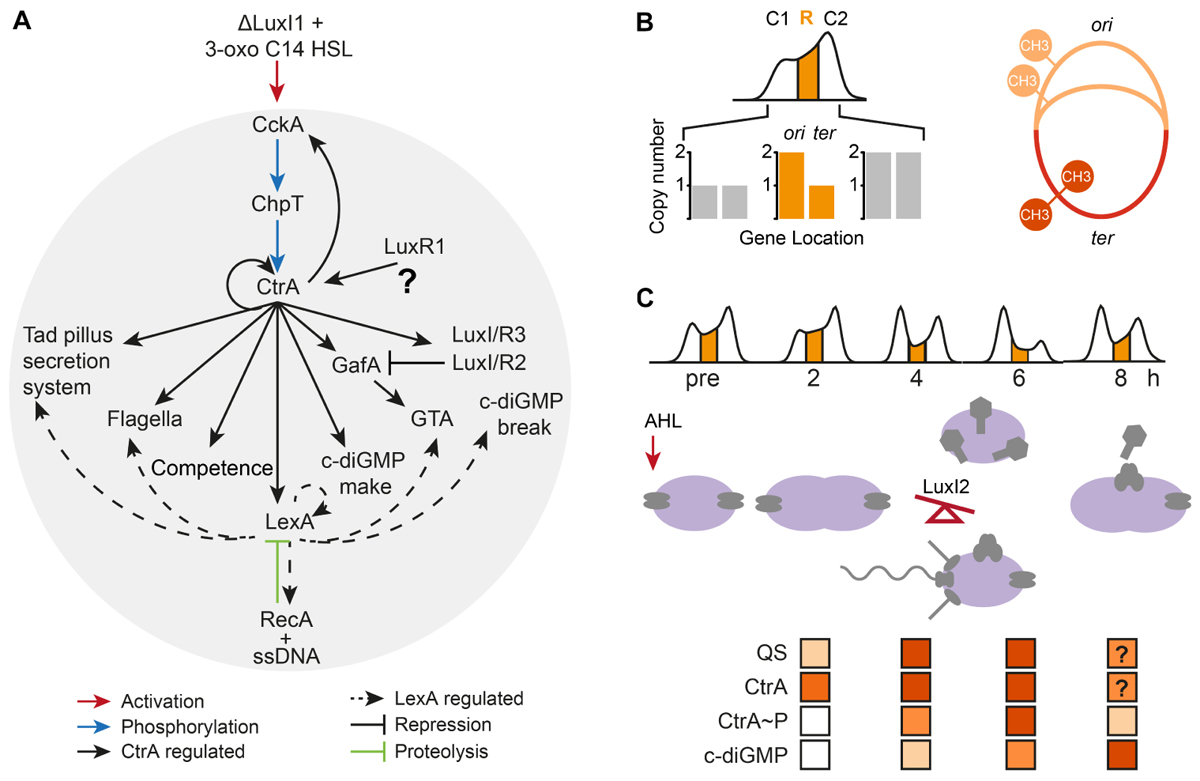
Figure 4. Quorum sensing regulatory system in D. shibae. (A) 3-oxo C14 HSL might be detected by the histidine kinase CckA or another sensor protein (red arrow) resulting in a phosphorylation cascade activating CtrA (blue) and subsequently its target genes (continuous arrows). LuxI2 might restrict GTA expression to a subpopulation (inhibiting arrow). The SOS stress response regulator LexA and CtrA (dashed arrows) regulate overlapping traits. The activation of LexA by RecA binding to ssDNA induces autoproteolysis of the stress regulator (green). (B) Possible impact of QS induced replication within the first 2 h post-induction on ori and ter located genes. Copy-number differences might alter the transcriptional balance of QS regulators close to origin and terminus of replication (left panel). Hemi-methylation during replication might impact transcription of CtrA-target genes (right panel). (C) Proposed model for the early response of D. shibae toward QS signaling: AHL detection results in fast activation of CtrA followed by an induction of replication as well as QS and c-di-GMP synthesizing genes. The increase in CtrA and its phosphorylation by CckA leads to repression of replication and initiates cell division and differentiation. The autoinducer synthase LuxI2 is the key factor in the decision making between GTA producing self-sacrificing cells and cells which form flagella, pili, and become competent for uptake of GTA-DNA between 2 and 4 h after induction. Following the stop of replication for 6 h, increasing c-di-GMP levels induce CckA mediated dephosphorylation of CtrA in some cells that start replicating again. The late induction of the SOS response could stimulate recombination of transferred DNA.
Enzymes that synthesize and hydrolyse the second messenger c-di-GMP were found to be QS controlled and to be regulated by CtrA and LexA, respectively. The c-di-GMP level in the cell is modulated in response to multiple environmental signals (QS, light, ppGpp) and influences expression and activity of traits such as T4SS, Tad pili, flagella, GTA, chromosome replication and cell morphogenesis in Bartonella sp., V. cholerae, R. capsulatus and C. crescentus (Boutte et al., 2012; Laverde-gomez et al., 2014; Lori et al., 2015; Québatte et al., 2017; Singh et al., 2017). In particular, effects of c-di-GMP on flagella motility have been described (Armitage and Berry, 2010; Koushik et al., 2010). Regulating flagella activity by c-di-GMP would be in accordance with the simultaneous upregulation of flagella transcription and c-di-GMP levels at 2 h after induction. However, homologs of the involved regulators of other species (YcgR or DgrA) or any other gene with c-di-GMP binding PilZ domain could not be identified. The average swimming velocity of D. shibae on SWM liquid medium with succinate as a carbon source has been determined to be 1.59 μm/s (Mann et al., 2016). Only a subpopulation of the cells carries flagella (Patzelt et al., 2013). Flagella might additionally have a role in virulence factor secretion and biofilm formation (Soutourina and Bertin, 2003).
Moreover, we found the competence (comEC/comM/comF) and recombination (dprA/recA) systems to be regulated by CtrA and LexA, respectively. These genes are especially interesting in relation to the transfer of dsDNA of GTAs into the recipient cell and integration into its genome. In Rhodobacter GTAs inject dsDNA through the outer membrane into the periplasm and the dsDNA is transferred from the periplasm into the cytoplasm via the Com proteins ComEC, ComF, and ComM, and recombination is assumed to be conducted by DprA and RecA (Brimacombe et al., 2015). A similar uptake mechanism is probably also working in D. shibae. The Com protein family is also used by naturally competent strains for incorporation of naked DNA from the environment. Even though binding by DprA in the cytoplasm generally occurs on ssDNA, additional binding to dsDNA has been determined as well. It has been argued that organisms expressing ComM are expressing a DprA domain that allows binding of dsDNA (Brimacombe et al., 2015).
We also found most of the homologs to the R. capsulatus “multilocus genome”(Hynes et al., 2016) to be induced by QS. Among them is the sigma factor antagonist and its repressor (Dshi_0072/0073, rsbW/rsbV) which are involved in R. capsulatus GTA regulation (Mercer and Lang, 2014). Dshi_1584 is the homolog of gafA that has been recently identified as the direct activator of GTAs (Fogg, 2019) and Dshi_1585 is a homolog of rcc01866, a gene involved in the lytic release of GTAs (Westbye et al., 2017b). Also involved in GTA release are Dshi_1756/1757 which represent an endolysin/holin system (Westbye et al., 2013). The homologs of Dshi_2018/2162 in R. capsulatus belong to tail fibers (Brimacombe et al., 2013) and Dshi_3346 corresponds to divL which regulates CtrA in Rhodobacter (Supplementary Table S4) (Westbye et al., 2018).
We further identified genes of the tad pilus secretion system that revealed the sequence tad Z/A/B/C which have been annotated as cpaE/F/G/H in C. crescentus (Mignolet et al., 2018). This is in accordance with genome comparisons which discovered a corresponding, common, strongly conserved locus within the Roseobacter group (cpaBC-ompA-cpaEF-tadBC) (Slightom and Buchan, 2009).
The Tad (tight adherence) secretion system has first been described in Actinobacillus (Motherway et al., 2011) and is widely distributed in Archaea, Proteobacteria and Actinobacteria. For Bifidobacterium sp. colonizing the gastrointestinal tract it was found that these pili attach to carbohydrates of glycoreceptors at the host surface during the first steps of colonization and therefore sequence differences of tad genes might determine host specificity (Motherway et al., 2011). D. shibae was isolated from Prorocentrum lima and Alexandrium ostenfeldii (Biebl et al., 2005) and interactions with various microalgae have been observed (Wagner-Döbler et al., 2010; Wang et al., 2014a). Genes of the QS response including c-di-GMP and tad genes transiently increase in expression during later phases of co-cultivation (Wang et al., 2015). Thus, these traits might contribute to the interaction with the algal host.
Integration of the LexA Based Stress Response Into the CtrA and QS Network
We found that CtrA regulates LexA due to the presence of in silico determined TFBS and saw a differential lexA expression upon AHL stimulation. Furthermore, LexA most likely interferes with almost all CtrA regulated traits. We found putative LexA TFBS in promoters of the newly identified Tad pilus, DNA uptake and recombination machinery, flagella, lexA itself, and c-di-GMP (Figure 4A). A regulation of LexA by itself through a feedback loop is common and has been found, e.g., in S. meliloti and C. crescentus (Erill et al., 2004). In E. coli LexA plays a key role in heterogeneity by transcriptional regulation of DNA repair, type III secretion system, prophages and toxins (Mellies et al., 2007; Kamenšek et al., 2010). A similar regulation has been suggested for Pseudomonas aeruginosa, Salmonella and Bacillus subtilis (Kamenšek et al., 2010).
The stress response regulon in alpha- and gammaproteobacteria was found to include sets of core proteins among which are LexA, RecA and ComM, e.g., in C. crescentus and S. meliloti (Erill et al., 2004). The DNA uptake machinery which has been suggested to take up GTA delivered DNA from the periplasm (Westbye et al., 2017a) contains LexA and CtrA regulated genes (Figure 1E). While Com family protein mediated uptake of DNA through the inner membrane is controlled by CtrA, recombination by dprA and recA is LexA regulated. Similarly, c-di-GMP synthesis is controlled by CtrA and break down via LexA. In both cases, CtrA and LexA control genes needed during successive stages of the mentioned processes. In contrast to R. capsulatus (Kuchinski et al., 2016), in D. shibae the promoter of cckA has no LexA binding site while a CtrA TFBS was identified in silico. These data show that regulation by CtrA and LexA is highly similar between R. capsulatus and D. shibae. Nonetheless, the missing LexA binding site in the promoter of cckA – one of the key genes of the CtrA phosphorelay – might cause significant regulatory differences.
Timing of QS Activation and Replication
We monitored the chromosome dynamics in response to AI addition using flow cytometry. Four independent experiments revealed an increased number of replicating cells 2 h post-induction, followed by a cell division stop, where cells with one chromosome accumulated and the number of replicating cells and cells with two chromosome equivalents was reduced. After 3 h, the replicating subpopulation increased again (Figure 3A and Supplementary Figures S7–S10).
We had previously shown that QS causes morphological heterogeneity in D. shibae with a subpopulation of enlarged cells whose division is inhibited and which contain several chromosomes per cell (Patzelt et al., 2013). This response is mediated by the CtrA phosphorelay (Wang et al., 2014b). Here, we did not see cells with more than two chromosomes or morphological population heterogeneity. Instead we saw shifts in the fraction of replicating cells. Differences in the experimental setup help to explain these apparent discrepancies. In previous experiments, the AHL was added at the beginning of growth and cells were harvested in the mid-exponential phase, thus they grew for approximately 10 h after AI induction (Patzelt et al., 2013, 2016; Wang et al., 2014b). Furthermore, the OD600 at AHL induction was 0.01, thus only 5% of the OD600 at which the culture was induced in the current experiment. Consequently, in the previously published experiments the population was exposed to higher concentrations of AHL per cell and for a much longer time which might lead to a much stronger physiological response or even an overshooting of the QS system which might lock the cells in the early replicative state (2 h post-induction in the current experiment).
The observed successive increase and decrease of the fraction of replicating cells in response to the AI might affect the regulation of gene expression in multiple ways: Replication can influence the transcript number of regulatory genes located at the ori and ter, respectively (Figure 4B). As exemplified in the left panel, genes close to ori are present in higher copy number in replicating cells, their number doubles with each replication initiation (Schmid and Roth, 1987; Sousa et al., 1997). For example, in B. subtilis spore formation is regulated by a two-component system, in which the histidine kinase KinA is located close to ter, while the cognate response regulator Spo0F is situated at the ori; this leads to pulsing increasing levels of Spo0F with every cell cycle and only if a certain KinA level is reached after several rounds of cell division, spore formation is initiated in a subpopulation. In such a way spore formation is inhibited if replication has not been completed (Lazazzera and Hughes, 2015; Narula et al., 2015). In our study we found that QS controlled regulators (DivL1/2, RsbW/RsbV, DnaA, CckA, LexA, CtrA, GafA/Dshi_1585, Dshi_3484/85) are located both at the ori and ter regions which could similarly couple expression of QS regulated traits to chromosome replication. The divL genes code for a histidine kinase and response regulator. Thus, a gradient of phosphorylation of CtrA during replication might be present which could be important for gene regulatory control.
As shown in the right panel, DNA is in a hemi-methylated state during replication, as the newly synthesized strain is not methylated yet. The conserved alphaproteobacterial DNA methyltransferase CcrM and transcription-factor GcrA (Brilli et al., 2010) have been shown to regulate expression of ctrA and other genes in C. crescentus in a methylation-state dependent way (Brilli et al., 2010; Fioravanti et al., 2013; Gonzalez et al., 2014). The ori and ter regions of D. shibae as well as the conjugative plasmids are enriched in the CcrM methylation-motif GANTC (Tomasch et al., 2018) which might influence replication based expression timing of genes located there.
Control of replication by CtrA has been covered by numerous articles (reviewed by Panis et al., 2015). When phosphorylated by CckA, C. crescentus CtrA represses replication and activates gene expression. Consequently, its phosphorylation state is tightly controlled throughout the cell cycle. Recently, c-di-GMP has been shown to switch the activity of CckA from kinase to phosphatase, releasing the ori for replication (Narayanan et al., 2018). If this regulatory connection is conserved in D. shibae, it might help to explain the observed shift in the proportion of replicating cells (Figure 4C). In response to the QS signal, more cells start to replicate and synthesize CtrA-phosphorelay components. When CckA accumulates at the cell poles its kinase activity is stimulated, as it has been observed in C. crescentus. The resulting increase in CtrA∼P inhibits the initiation of replication, consistent with the observed flow cytometry pattern change after 2 h. Simultaneously, CtrA∼P activates its target genes, resulting in differentiation into motile cells, GTA producing cells and cells that are able to replicate again. The possible CtrA dephosphorylating synthesis of c-di-GMP started after 2 h and increased to 300 pg/mg protein after 6 hurs when it still had not reached a plateau. The timing is consistent with the onset of replication in a larger subset of cells after the minimum has been reached at 6 h. LexA is upregulated last, probably due to the uptake of GTA DNA and probably enables the cell to integrate the acquired DNA into the chromosome and might also modulate expression of CtrA target genes.
The described timing of replication and trait expression controlled by CtrA∼P might also help to ensure that GTA packaging is prohibited in replicating cells. This would prevent a packaging bias toward the origin of replication. Expression dynamics of the GTA cluster showed two peaks, a fast but weak upregulation after 20–40 min, followed by a strong transcription of the complete gene cluster from 120 min onward (Figure 1E). This indicates that a GTA activating signal is already present in the early stage post AI induction and might be the AI itself or the CtrA phosphorelay activated by the AI, since at this stage, the fraction of replicating cells is increased. However, the threshold to fully activate GTA gene expression is reached after 2 h, when chromosome replication has almost stopped. A biphasic transcription pattern has also been detected for Bartonella GTAs (Québatte et al., 2017). In contrast to D. shibae, a strong early peak at the mid-exponential phase is followed by a weaker peak at the entry to stationary phase in Bartonella. However, uptake of GTA DNA and a simultaneous drop of population size due to the lysis of the GTA producing cells only takes place during the strong early peak in mid-exponential phase in Bartonella. In this group, the signal for the weaker peak at the entry to stationary phase is not known.
Synthase LuxI2 Controls the Size of GTA Producing Subpopulation
We recently showed that GTA production in D. shibae is suppressed by LuxI2 (Tomasch et al., 2018). Here, we now used a combination of transcriptomics and Western blot examination to refine our understanding of GTA regulation. No GTA expression was observed in the QS null mutant ΔluxI1 while a knockout of luxI2 resulted in high GTA production as observed previously (Tomasch et al., 2018). A small amount of capsids was, however, produced in the ΔluxI1 culture if it was stimulated by AI, and this was found for both concentrations of C14-oxo-HSL tested (500 nM and 2.5 μM), independent of the incubation time, and also for another AI, C18-dien-HSL, the main product of LuxI1. These data support our hypothesis, that the variability of GTA activation by QS is tightly controlled.
Recently, the direct activator of the GTA gene cluster, GafA, has been identified in R. capsulatus (Fogg, 2019). This gene is in turn directly activated by phosphorylated CtrA. Furthermore, the gafA promoter is bound by the AI-binding regulator GtaR. Therefore the author proposed that in R. capsulatus noise in the QS signal could control the size of the GTA producing subpopulation. GafA is conserved throughout the Rhodobacteraceae (Hynes et al., 2016) and present in D. shibae (Dshi_1584). As overexpression of GafA in Ruegeria also led to GTA overexpression, its regulatory role might be conserved, too. The proposed control of gafA and thereby GTAs through an AI-binding LuxR-type regulator is in accordance with our proposed QS-mediated limitation of GTA subpopulation size in D. Shibae (Figures 4A,C).
Conclusion
Our proposed model helps to explain the observed timing of replication and gene expression. It remains to be elucidated how CtrA and c-di-GMP interact. The most interesting question remains how exactly AI synthase LuxI2 influences the size of the GTA producing subpopulation. A certain AI concentration or mixtures of different AIs might repress or activate GafA which then induces GTA gene cluster expression. Finally, our data suggest that key features of replication control, like gene localization or the role of c-di-GMP might be conserved among alphaproteobacteria.
Author Contributions
JT and IW-D designed the study. SK performed experiments with help from HW. MS performed RNA sequencing. VK quantified c-di-GMP. SK and JT analyzed the data. SK wrote the manuscript with help from JT and IW-D.
Funding
This work was funded by the Deutsche Forschungsgemeinschaft (DFG) within the Transregional Collaborative Research Centre “Roseobacter” (TRR 51/2 TB04).
Conflict of Interest Statement
The authors declare that the research was conducted in the absence of any commercial or financial relationships that could be construed as a potential conflict of interest.
Acknowledgments
The authors thank the reviewers for the critical and constructive assessment of the manuscript.
Supplementary Material
The Supplementary Material for this article can be found online at: https://www.frontiersin.org/articles/10.3389/fmicb.2019.00803/full#supplementary-material
Footnotes
- ^ https://github.com/ExpressionAnalysis/ea-utils
- ^ https://www.ncbi.nlm.nih.gov/geo/query/acc.cgi?acc=GSE122111
References
Armitage, J. P., and Berry, R. M. (2010). Time for bacteria to slow down. Cell 141, 24–26. doi: 10.1016/j.cell.2010.03.023
Bähre, H., and Kaever, V. (2017). Identification and quantification of cyclic di-guanosine monophosphate and its linear metabolites by reversed-phase LC-MS/MS. Methods Mol. Biol. 1657, 45–58. doi: 10.1007/978-1-4939-7240-1_5
Bedrunka, P., Olbrisch, F., Rüger, M., Zehner, S., and Frankenberg-Dinkel, N. (2018). Nitric oxide controls c-di-GMP turnover in Dinoroseobacter shibae. Microbiology 164, 1405–1415. doi: 10.1099/mic.0.000714
Biebl, H., Allgaier, M., Tindall, B. J., Koblizek, M., Lünsdorf, H., Pukall, R., et al. (2005). Dinoroseobacter shibae gen. nov., sp. nov., a new aerobic phototrophic bacterium isolated from dinoflagellates. Int. J. Syst. Evol. Microbiol. 55(Pt 3), 1089–1096. doi: 10.1099/ijs.0.63511-0
Boutte, C. C., Henry, J. T., and Crosson, S. (2012). ppGpp and polyphosphate modulate cell cycle progression in Caulobacter crescentus. J. Bacteriol. 194, 28–35. doi: 10.1128/JB.0593211
Brilli, M., Fondi, M., Fani, R., Mengoni, A., Ferri, L., Bazzicalupo, M., et al. (2010). The diversity and evolution of cell cycle regulation in alpha-proteobacteria: a comparative genomic analysis. BMC Syst. Biol. 4:52. doi: 10.1186/1752-0509-4-52
Brimacombe, C. A., Ding, H., and Beatty, J. T. (2014). Rhodobacter capsulatus DprA is essential for RecA-mediated gene transfer agent (RcGTA) recipient capability regulated by quorum-sensing and the CtrA response regulator. Mol. Microbiol. 92, 1260–1278. doi: 10.1111/mmi.12628
Brimacombe, C. A., Ding, H., Johnson, J. A., and Thomas Beatty, J. (2015). Homologues of genetic transformation DNA import genes are required for Rhodobacter capsulatus gene transfer agent recipient capability regulated by the response regulator CtrA. J. Bacteriol. 197, 2653–2663. doi: 10.1128/JB.00332-15
Brimacombe, C. A., Stevens, A., Jun, D., Mercer, R., Lang, A. S., and Beatty, J. T. (2013). Quorum-sensing regulation of a capsular polysaccharide receptor for the Rhodobacter capsulatus gene transfer agent (RcGTA). Mol. Microbiol. 87, 802–817. doi: 10.1111/mmi.12132
Carniol, K., Ben-yehuda, S., King, N., and Losick, R. (2005). Genetic dissection of the sporulation protein SpoIIE and its role in asymmetric division in Bacillus subtilis. J. Bacteriol. 187, 3511–3520. doi: 10.1128/JB.187.10.3511
Chilcott, G. S., and Hughes, K. T. (2000). Coupling of flagellar gene expression to flagellar assembly in Salmonella enterica Serovar typhimurium and Escherichia coli. Microbiol. Mol. Biol. Rev. 64, 694–708. doi: 10.1128/mmbr.64.4.694-708.2000
Crooks, G. E., Hon, G., Chandonia, J.-M., and Brenner, S. E. (2004). WebLogo: a sequence logo generator. Genome Res. 14, 1188–1190. doi: 10.1101/gr.849004
Cude, W. N., and Buchan, A. (2013). Acyl-homoserine lactone-based quorum sensing in the Roseobacter clade: complex cell-to-cell communication controls multiple physiologies. Front. Microbiol. 4:336. doi: 10.3389/fmicb.2013.00336
Erill, I., Jara, M., Salvador, N., Escribano, M., Campoy, S., and Barbé, J. (2004). Differences in LexA regulon structure among Proteobacteria through in vivo assisted comparative genomics. Nucleic Acids Res. 32, 6617–6626. doi: 10.1093/nar/gkh996
Fioravanti, A., Fumeaux, C., Mohapatra, S. S., Bompard, C., Brilli, M., Frandi, A., et al. (2013). DNA binding of the cell cycle transcriptional regulator GcrA depends on N6-adenosine methylation in Caulobacter crescentus and other Alphaproteobacteria. PLoS Genet. 9:e1003541. doi: 10.1371/journal.pgen.1003541
Fogg, P. C. M. (2019). Identification and characterization of a direct activator of a gene transfer agent. Nat. Commun. 10:595. doi: 10.1038/s41467-019-08526-1
Fu, Y., Macleod, D. M., Rivkin, R. B., Chen, F., Buchan, A., and Lang, A. S. (2010). High diversity of rhodobacterales in the subarctic north atlantic ocean and gene transfer agent protein expression in isolated strains. Aquat. Microb. Ecol. 59, 283–293. doi: 10.3354/ame01398
Gonzalez, D., Kozdon, J., Mcadams, H. H., Shapiro, L., and Collier, J. (2014). The functions of DNA methylation by CcrM in Caulobacter crescentus: a global approach. Nucleic Acids Res. 42, 3720–3735. doi: 10.1093/nar/gkt1352
Gonzalez, J. M., and Moran, M. A. (1997). Numerical dominance of a group of marine bacteria in the alpha-subclass of the clas Proteobacteria in coastal seawater. Appl. Environ. Microbiol. 63, 4237–4242.
Guidi, F., Pezzolesi, L., and Vanucci, S. (2018). Microbial dynamics during harmful dinoflagellate Ostreopsis cf. Ovata growth: bacterial succession and viral abundance pattern. Microbiologyopen 7:e00584. doi: 10.1002/mbo3.584
Hengge, R., Galperin, M. Y., Ghigo, J.-M., Gomelsky, M., Green, J., Hughes, K. T., et al. (2015). Systematic nomenclature for GGDEF and EAL domain-containing cyclic Di-GMP turnover proteins of Escherichia coli. J. Bacteriol. 198, 7–11. doi: 10.1128/JB.00424-15
Hynes, A. P., Shakya, M., Mercer, R. G., Grüll, M. P., Bown, L., Davidson, F., et al. (2016). Functional and evolutionary characterization of a gene transfer Agent’s Multilocus “Genome.”. Mol. Biol. Evol. 33, 2530–2543. doi: 10.1093/molbev/msw125
Kamenšek, S., Podlesek, Z., Gillor, O., and Žgur-Bertok, D. (2010). Genes regulated by the Escherichia coli SOS repressor LexA exhibit heterogenous expression. BMC Microbiol. 10:283. doi: 10.1186/1471-2180-10-283
Koushik, P., Nieto, V., Carlquist, W. C., Blair, D. F., and Harshey, R. M. (2010). The c-di-GMP binding protein YcgR controls flagellar motor direction and speed to affect chemotaxis by a “‘Backstop Brake”’. Mech. Mol. Cell 38, 128–139. doi: 10.1016/j.molcel.2010.03.001
Kuchinski, K. S., Brimacombe, C. A., Westbye, A. B., Ding, H., and Beatty, J. T. (2016). The SOS response master regulator LexA regulates the gene transfer agent of Rhodobacter capsulatus and represses transcription of the signal transduction protein CckA. J. Bacteriol. 198, 1137–1148. doi: 10.1128/JB.00839-15
Lang, A. S., and Beatty, J. T. (2007). Importance of widespread gene transfer agent genes in alpha-proteobacteria. Trends Microbiol. 15, 54–62. doi: 10.1016/j.tim.2006.12.001
Langmead, B., and Salzberg, S. L. (2012). Fast gapped-read alignment with Bowtie 2. Nat. Methods 9, 357–359. doi: 10.1038/nmeth.1923
Laub, M. T., Chen, S. L., Shapiro, L., and Mcadams, H. H. (2002). Genes directly controlled by CtrA, a master regulator of the Caulobacter cell cycle. Proc. Natl. Acad. Sci. U.S.A. 99, 4632–4637. doi: 10.1073/pnas.062065699
Laverde-Gomez, J. A., Sarkar, M., and Christie, P. J. (2013). “Regulation of bacterial type IV secretion,” in Regulation of Bacterial Virulence, eds M. L. Vasil and A. J. Darwin (Washington, DC: ASM Press), 335–362. doi: 10.1128/9781555818524.ch18
Lazazzera, B. A., and Hughes, D. (2015). Location affects sporulation. Nature 525, 42–43. doi: 10.1038/nature15207
Leung, M. M., Brimacombe, C. A., Beatty, J. T., and Beatty, C. J. T. (2013). Transcriptional regulation of the Rhodobacter capsulatus response regulator CtrA. Microbiology 159(Pt 1), 96–106. doi: 10.1099/mic.0.062349-0
Leung, M. M., Brimacombe, C. A., Spiegelman, G. B., and Beatty, J. T. (2012). The GtaR protein negatively regulates transcription of the gtaRI operon and modulates gene transfer agent (RcGTA) expression in Rhodobacter capsulatus. Mol. Microbiol. 83, 759–774. doi: 10.1111/j.1365-2958.2011.07963.x
Li, J., Carlson, B. E., and Lacis, A. A. (2009). A study on the temporal and spatial variability of absorbing aerosols using Total Ozone Mapping Spectrometer and Ozone Monitoring Instrument Aerosol Index data. J. Geophys. Res. 114:D09213. doi: 10.1029/2008JD011278
Liao, Y., Smyth, G. K., and Shi, W. (2014). featureCounts: an efficient general purpose program for assigning sequence reads to genomic features. Bioinformatics 30, 923–930. doi: 10.1093/bioinformatics/btt656
Lobry, J. R. (1996). Asymmetric substitution patterns in the two DNA strands of bacteria. Mol. Biol. Evol. 13, 660–665. doi: 10.1093/oxfordjournals.molbev.a025626
Lori, C., Ozaki, S., Steiner, S., Böhm, R., Abel, S., Dubey, B. N., et al. (2015). Cyclic di-GMP acts as a cell cycle oscillator to drive chromosome replication. Nature 523, 236–239. doi: 10.1038/nature14473
Luo, A., Ling, C., Ho, S. Y. W., and Zhu, C.-D. (2018). Comparison of methods for molecular species delimitation across a range of speciation scenarios. Syst. Biol. 67, 830–846. doi: 10.1093/sysbio/syy011
Mann, T. H., Childers, W. S., Blair, J. A., Eckart, M. R., and Shapiro, L. (2016). A cell cycle kinase with tandem sensory PAS domains integrates cell fate cues. Nat. Commun. 7:11454. doi: 10.1038/ncomms11454
Marie, D., Partensky, F., Jacquet, S., and Vaulot, D. (1997). Enumeration and cell cycle analysis of natural populations of marine picoplankton by flow cytometry using the nucleic acid stain SYBR green I. Appl. Environ. Microbiol. 63, 186–193.
Mellies, J., Haack, K., and Galligan, D. (2007). SOS regulation of the type III secretion system of enteropathogenic Escherichia coli. J. Bacteriol. 189, 2863–2872. doi: 10.1128/JB.01859-06
Mercer, R. G., and Lang, A. S. (2014). Identification of a predicted partner-switching system that affects production of the gene transfer agent RcGTA and stationary phase viability in Rhodobacter capsulatus. BMC Microbiol. 14:71. doi: 10.1186/1471-2180-14-71
Mercer, R. G., Quinlan, M., Rose, A. R., Noll, S., Beatty, J. T., and Lang, A. S. (2012). Regulatory systems controlling motility and gene transfer agent production and release in Rhodobacter capsulatus. FEMS Microbiol. Lett. 331, 53–62. doi: 10.1111/j.1574-6968.2012.02553.x
Mignolet, J., Panis, G. L., and Viollier, P. H. (2018). More than a tad: spatiotemporal control of Caulobacter pili this review comes from a themed issue on cell regulation. Curr. Opin. Microbiol. 42, 79–86. doi: 10.1016/j.mib.2017.10.017
Miller, M. B., and Bassler, B. L. (2001). Quorum sensing in bacteria. Annu. Rev. Microbiol. 551, 165–199. doi: 10.1146/annurev.micro.55.1.165
Motherway, C., Zomer, A., Leahy, S. C., Reunanen, J., Bottacini, F., Claesson, M. J., et al. (2011). Functional genome analysis of Bifidobacterium breve UCC2003 reveals type IVb tight adherence (Tad) pili as an essential and conserved host-colonization factor. Proc. Natl. Acad. Sci. U.S.A. 108, 11217–11222. doi: 10.1073/pnas.1105380108
Nadell, C. D., Xavier, J. B., and Foster, K. R. (2008). The sociobiology of biofilms. FEMS Microbiol. Rev. 33, 206–224. doi: 10.1111/j.1574-6976.2008.00150.x
Narayanan, S., Kumar, L., and Kumar Radhakrishnan, S. (2018). Sensory domain of the cell cycle kinase CckA regulates the differential DNA binding of the master regulator CtrA in Caulobacter crescentus. Biochim. Biophys. Acta Gene Regul. Mech. 1861, 952–961. doi: 10.1016/j.bbagrm.2018.08.006
Narula, J., Kuchina, A., Lee, D. D., Fujita, M., Süel, G. M., and Igoshin, O. A. (2015). Chromosomal arrangement of phosphorelay genes couples sporulation and DNA replication. Cell 162, 328–337. doi: 10.1016/j.cell.2015.06.012
Neumann, A., Patzelt, D., Wagner-Döbler, I., and Schulz, S. (2013). Identification of new N-acylhomoserine lactone signalling compounds of Dinoroseobacter shibae DFL-12T by overexpression of luxI genes. Chembiochem 14, 2355–2361. doi: 10.1002/cbic.201300424
Panis, G. L., Murray, S. R., and Viollier, P. H. (2015). Versatility of global transcriptional regulators in alpha-Proteobacteria: from essential cell cycle control to ancillary functions. Microbiol. Rev. 39, 120–133. doi: 10.1093/femsre/fuu002
Papenfort, K., and Bassler, B. L. (2016). Quorum sensing signal–response systems in Gram-negative bacteria. Nat. Rev. Microbiol. 14, 576–588. doi: 10.1038/nrmicro.2016.89
Patzelt, D., Michael, V., Päuker, O., Ebert, M., Tielen, P., Jahn, D., et al. (2016). Gene flow across genus barriers – conjugation of Dinoroseobacter shibae ’ s 191-kb killer plasmid into Phaeobacter inhibens and AHL-mediated expression of type IV secretion systems. Front. Microbiol. 7:742. doi: 10.3389/fmicb.2016.00742
Patzelt, D., Wang, H., Buchholz, I., Rohde, M., Gröbe, L., Pradella, S., et al. (2013). You are what you talk: quorum sensing induces individual morphologies and cell division modes in Dinoroseobacter shibae. ISME J. 7, 2274–2286. doi: 10.1038/ismej.2013.107
Purcell, E. B., Boutte, C. C., and Crosson, S. (2008). Two-component signaling systems and cell cycle control in Caulobacter crescentus. Adv. Exp. Med. Biol. 631, 122–130. doi: 10.1007/978-0-387-78885-2-8
Québatte, M., Christen, M., Harms, A., Körner, J., Christen, B., and Dehio, C. (2017). Gene transfer agent promotes evolvability within the fittest subpopulation of a bacterial pathogen. Cell Syst. 4, 611–621.e6. doi: 10.1016/j.cels.2017.05.011
Redfield, R. J., and Soucy, S. (2018). Evolution of bacterial gene transfer agents. Front. Microbiol. 9:2527. doi: 10.3389/fmicb.2018.02527
Robinson, M. D., Mccarthy, D. J., and Smyth, G. K. (2010). edgeR: a Bioconductor package for differential expression analysis of digital gene expression data. Bioinformatics 26, 139–140. doi: 10.1093/bioinformatics/btp616
Schmid, M. B., and Roth, J. R. (1987). Gene location affects expression level in Salmonella typhimurium. J. Bacteriol. 169, 2872–2875. doi: 10.1128/jb.169.6.2872-2875.1987
Segev, E., Wyche, T. P., Kim, K. H., Petersen, J., and Ellebrandt, C. (2016). Dynamic metabolic exchange governs a marine algal-bacterial interaction. eLife 5:e17473. doi: 10.7554/eLife.17473
Simon, M., Scheuner, C., Meier-Kolthoff, J. P., Brinkhoff, T., Wagner-Döbler, I., Ulbrich, M., et al. (2017). Phylogenomics of Rhodobacteraceae reveals evolutionary adaptation to marine and non-marine habitats. ISME J. 11, 1–17. doi: 10.1038/ismej.2016.198
Singh, P. K., Bartalomej, S., Hartmann, R., Jeckel, H., Vidakovic, L., Nadell, C. D., et al. (2017). Vibrio cholerae combines individual and collective sensing to trigger biofilm dispersal. Curr. Biol. 27, 3359–3366.e7. doi: 10.1016/j.cub.2017.09.041
Slightom, R. N., and Buchan, A. (2009). MINIREVIEW surface colonization by marine roseobacters?: integrating genotype and phenotype. Appl. Environ. Microbiol. 75, 6027–6037. doi: 10.1128/AEM.01508-09
Sousa, C., De Lorenzo, V., and Cebollat, A. (1997). Modulation of gene expression through chromosomal positioning in Escherichia coli. Microbiology 143, 2071–2078. doi: 10.1099/00221287-143-6-2071
Soutourina, O. A., and Bertin, P. N. (2003). Regulation cascade of flagellar expression in Gram-negative bacteria. FEMS Microbiol. Rev. 27, 505–523. doi: 10.1016/S0168-6445(03)00064-0
Tomasch, J., Gohl, R., Bunk, B., Diez, M. S., Wagner-Döbler, I., Suarez Diez, M., et al. (2011). Transcriptional response of the photoheterotrophic marine bacterium Dinoroseobacter shibae to changing light regimes. ISME J. 5, 1957–1968. doi: 10.1038/ismej.2011.68
Tomasch, J., Wang, H., Hall, A. T. K., Patzelt, D., Preuße, M., Brinkmann, H., et al. (2018). Packaging of Dinoroseobacter shibae DNA into gene transfer agent particles is not random. Genome Biol. Evol. 10, 359–369. doi: 10.1093/gbe/evy005
Wagner-Döbler, I., Ballhausen, B., Berger, M., Brinkhoff, T., Buchholz, I., Bunk, B., et al. (2010). The complete genome sequence of the algal symbiont Dinoroseobacter shibae: a hitchhiker’s guide to life in the sea. ISME J. 4, 61–77. doi: 10.1038/ismej.2009.94
Wang, H., Tomasch, J., Jarek, M., and Wagner-Döbler, I. (2014a). A dual-species co-cultivation system to study the interactions between Roseobacters and dinoflagellates. Front. Microbiol. 5:311. doi: 10.3389/fmicb.2014.00311
Wang, H., Ziesche, L., Frank, O., Michael, V., Martin, M., Petersen, J., et al. (2014b). The CtrA phosphorelay integrates differentiation and communication in the marine alphaproteobacterium Dinoroseobacter shibae. BMC Genomics 15:130. doi: 10.1186/1471-2164-15-130
Wang, H., Tomasch, J., Michael, V., Bhuju, S., Jarek, M., Petersen, J., et al. (2015). Identification of genetic modules mediating the jekyll and hyde interaction of Dinoroseobacter shibae with the dinoflagellate Prorocentrum minimum. Front. Microbiol. 6:1262. doi: 10.3389/fmicb.2015.01262
Westbye, A. B., Kater, L., Wiesmann, C., Ding, H., Yip, C., and Beatty, J. (2018). The protease ClpXP and the PAS-domain protein DivL regulate CtrA and gene transfer agent production in Rhodobacter capsulatus. Appl. Environ. Microbiol. 84:e0275–18. doi: 10.1128/AEM.00275-18
Westbye, A. B., Beatty, J. T., Lang, A. S., Lang, A., and Rice, P. (2017a). Guaranteeing a captive audience: coordinated regulation of gene transfer agent (GTA) production and recipient capability by cellular regulators. Curr. Opin. Microbiol. 38, 122–129. doi: 10.1016/j.mib.2017.05.003
Westbye, A. B., O’Neill, Z., Schellenberg-Beaver, T., and Thomas Beatty, J. (2017b). The Rhodobacter capsulatus gene transfer agent is induced by nutrient depletion and the RNAP omega subunit. Microbiology 163, 1355–1363. doi: 10.1099/mic.0.000519
Westbye, A. B., Leung, M. M., Florizone, S. M., Taylor, T. A., Johnson, J. A., Fogg, P. C., et al. (2013). Phosphate concentration and the putative sensor kinase protein CckA modulate cell lysis and release of the Rhodobacter capsulatus gene transfer agent. J. Bacteriol. 195, 5025–5040. doi: 10.1128/JB.00669-13
Keywords: Roseobacter, quorum sensing, CtrA, LexA, gene transfer agent, c-di-GMP, chromosome location, replication
Citation: Koppenhöfer S, Wang H, Scharfe M, Kaever V, Wagner-Döbler I and Tomasch J (2019) Integrated Transcriptional Regulatory Network of Quorum Sensing, Replication Control, and SOS Response in Dinoroseobacter shibae. Front. Microbiol. 10:803. doi: 10.3389/fmicb.2019.00803
Received: 26 November 2018; Accepted: 28 March 2019;
Published: 12 April 2019.
Edited by:
Biswarup Mukhopadhyay, Virginia Tech, United StatesReviewed by:
Daniel Yero, Institute of Biotechnology and Biomedicine (IBB), SpainAjai Dandekar, University of Washington, United States
Copyright © 2019 Koppenhöfer, Wang, Scharfe, Kaever, Wagner-Döbler and Tomasch. This is an open-access article distributed under the terms of the Creative Commons Attribution License (CC BY). The use, distribution or reproduction in other forums is permitted, provided the original author(s) and the copyright owner(s) are credited and that the original publication in this journal is cited, in accordance with accepted academic practice. No use, distribution or reproduction is permitted which does not comply with these terms.
*Correspondence: Sonja Koppenhöfer, c2tvcHBlbmhvZmVyQG11bi5jYQ== Jürgen Tomasch, SnVlcmdlbi5Ub21hc2NoQGhlbG1ob2x0ei1oemkuZGU=
†Present address: Sonja Koppenhöfer, Department of Biology, Memorial University of Newfoundland, St. John’s, NL, Canada
Jürgen Tomasch, Department of Molecular Bacteriology, Helmholtz-Centre for Infection Research, Braunschweig, Germany