 Prem Lal Kashyap*
 Sudheer Kumar*
 Ravi Shekhar Kumar
 Anju Sharma
 Annie Khanna*
 Kajal
Kajal Shubham Raj
 Poonam Jasrotia
 Gyanendra Singh
- ICAR-Indian Institute of Wheat and Barley Research (IIWBR), Karnal, India
Karnal bunt (KB; Tilletia indica) is the prime quarantine concern for quality wheat production throughout the world. The most effective approach to dealing with this biotic stress is to breed KB-resistant wheat varieties, which warrants a better understanding of T. indica genome architecture. In India, the North Western Plain Zone is the prime hot spot for KB disease, but only limited efforts have been made to decipher T. indica diversity at the genomic level. Microsatellites offer a powerful and robust typing system for the characterization and genetic diversity assessment of plant pathogens. At present, inadequate information is available with respect to the development of genome-derived markers for revealing genetic variability in T. indica populations. In current research, nine complete genome sequences of T. indica (PSWKBGH_1, PSWKBGH_2, PSWKBGD_1_3, RAKB_UP_1, TiK_1, Tik, DAOMC236408, DAOMC236414, and DAOMC236416) that exist in the public domain were explored to know the dynamic distribution of microsatellites. Comparative genome analysis revealed a high level of relative abundance and relative density of microsatellites in the PSWKBGH_1 genome in contrast to other genomes. No significant correlation between microsatellite distribution for GC content and genome size was established. All the genomes showed the dominance of tri-nucleotide motifs, followed by mono-, di-, tetra-, hexa-, and penta-nucleotide motifs. Out of 50 tested markers, 36 showed successful amplification in T. indica isolates and produced 52 different alleles. A PCR assay along with analysis of the polymorphic information content (PIC) revealed 10 markers as neutral and polymorphic loci (PIC 0.37). The identified polymorphic SSR loci grouped a geographically distinct T. indica population of 50 isolates representing seven Indian regions (Jammu, Himachal Pradesh, Punjab, Haryana, Uttarakhand, Uttar Pradesh, and Rajasthan) into four distinct clusters. The results of the analysis of molecular variance identified 94% genetic variation within the population and 6% among the population. Structure analysis also confirmed the existence of four genetically diverse groups containing admixtures of T. indica isolates across populations. In nutshell, the current study was successful in identifying novel, neutral and polymorphic microsatellite markers that will be valuable in offering deep insight into the evolutionary relationship and dynamics of the T. indica population for devising effective KB management strategies in wheat.
Introduction
Tilletia indica, which causes Karnal bunt (KB) disease, is an important quarantine fungus that negatively influences the quality of wheat produce throughout the globe (Emebiri et al., 2021). The pathogen was first recorded in April 1931 from Karnal town in India (Mitra, 1931) and later reported from different countries, including the United States, Brazil, Pakistan, Mexico, Nepal, South Africa, Afghanistan, Syria, and Iran (Duhan et al., 2022). At present, more than 86 countries have banned wheat imports by executing strong quarantine policies and following a zero tolerance policy on wheat trade from KB-affected countries (Rush et al., 2005; Sansford et al., 2008; Bishnoi et al., 2020; Gurjar et al., 2021). In India, KB has been observed regularly in the North-Western plains and Tarai region of Himachal Pradesh, Jammu, Punjab, Uttrakhand, and Uttar Pradesh regions of India (Parveen et al., 2015; Kashyap et al., 2022). T. indica is a soil-, seed-, and air-borne fungus and has the potential to reside for several years in soil, wheat straw, and farmyard manure (Kashyap et al., 2011). After wheat sowing, T. indica fungus enters the seed via the germinal point and produces a brownish-black mass of teliospores with a decaying fish-like smell by producing trimethylamine (Kumar et al., 2004). Further, infected wheat seeds showed partial colonization and resulted in bunted grain (Riccioni et al., 2008; Bala et al., 2022). It has been noticed that the deterioration in the quality of wheat grain varies with the severity of T. indica infection during the spike growth stage (boot leaf stage or Zadok’s stage 49) in wheat (Kaur and Kaur, 2005; Goates and Jackson, 2006). Kashyap et al. (2018) documented that more than 3% KB infection in wheat grains had a negative impact on the appearance and taste of chapattis, cookies, and bread. However, >5% infection in wheat grains was unsuitable as a food source for humans (Sekhon et al., 1980; Warham, 1986; Ullah et al., 2012; Kumar et al., 2017; Kashyap et al., 2019a). Published literature also indicated that the wheat export from KB-affected areas resulted in production losses of 0.2–0.5% (Sharma et al., 2022). However, losses up to 40% have been observed in those areas where KB-susceptible varieties were grown by farmers (Bishnoi et al., 2021). In India, Shakoor et al. (2015) documented a yield loss due to KB of nearly 0.5%. However, yield losses up to 1% have been reported from Mexico (Iquebal et al., 2021). Unfortunately, effective and timely control of KB has become a difficult task because of several factors, including T. indica dispersal mode, the non-availability of KB-resistant wheat cultivars, and the survival of T. indica spores in the soil for several years (Parveen et al., 2013). Further, cultural and fungicide-based management strategies are not offering desirable results in managing KB because of the heterothallic nature and sporadic occurrence of T. indica (Parveen et al., 2015; Kashyap et al., 2019a). Besides this, hybridization in T. indica spores also stimulates recombination and further helps in the rising genetic diversity spectrum of the fungus (Singh and Gogoi, 2011). In such a situation, virulence data alone is inadequate to offer a suitable and better insight into the existing diversity in the field population of T. indica. Hence, a deep and comprehensive understanding of genetic diversity at the genomic scale becomes obligatory for efficient utilization of resistance sources and to discover new changes in the pathotype distribution or structure of the evolving T. indica population.
Over the past several decades, a series of traditional approaches, for instance, cultural distinctiveness, phenology, virulence, monosporidia, wheat-T. indica interaction at physiological and biochemical levels, etc., have been explored for resolving the mystery related to T. indica variability (Bonde et al., 1996; Pannu and Chahal, 2000; Sharma et al., 2002; Kumar et al., 2004; Thirumalaisamy and Singh, 2012; Gupta et al., 2015, 2017; Pandey et al., 2018, 2019; Kashyap et al., 2020). However, the laborious, time-consuming, and environmentally prejudiced nature of the aforementioned methods is their prime demerits. These methods also lack precision and accuracy. There are a flood of research reports that illustrate the potential of nucleic acid-derived markers for unzipping the variation among fungal pathogens at the genome level (Kumar et al., 2013; Kashyap et al., 2015,2019b; Goswami et al., 2017; Choudhary et al., 2018; Jiménez-Becerril et al., 2018; Prasad et al., 2018). For instance, genetic markers such as inter simple sequence repeats (ISSR) and random amplified polymorphic DNA (RAPD) have been extensively utilized to understand the genetic diversity of T. indica isolates (Avinash et al., 2000; Seneviratne et al., 2009; Aggarwal et al., 2010; Parveen et al., 2015; Aasma et al., 2022). Unfortunately, the aforementioned markers are dominant and unable to determine analogous reproducibility across populations, thereby being of little significance, especially for comparative genotyping studies (Agarwal et al., 2008; Rao et al., 2018). Alternatively, microsatellites [Syn = simple sequence repeats (SSR)] have been recognized as one of the most popular and ideal technologies for unfolding genetic variation among fungal pathogens because of their ubiquitous nature, high polymorphism, co-dominance inheritance, and high level of allelic variation within the genome (Kumar et al., 2012; Singh et al., 2014; Kashyap et al., 2015; Rai et al., 2016; Savadi et al., 2020). Several research studies indicated the potential of microsatellites in dissecting the population genetic structure and defining the evolutionary relationships among myriads of fungi responsible for causing smut and bunt diseases in plants (Zhou et al., 2008; Zhang et al., 2015; Sharma et al., 2018; Kashyap et al., 2019b). Currently, few reports exist regarding the application of microsatellites in exploring genetic variation in T. indica (Kaur et al., 2015; Sharma et al., 2018; Gurjar et al., 2022). Moreover, no database has been developed that can provide information related to the distribution and dynamics of microsatellite markers in the T. indica genome. In recent time, the genomes of nine isolates of T. indica (PSWKBGH_1, PSWKBGH_2, PSWKBGD_1_3, RAKB_UP_1, TiK_1, Tik, DAOMC236408, DAOMC236414, and DAOMC236416) have been decoded, and information about them is available in the public domain.1 Keeping the aforementioned points in mind, current research has been initiated to mine the multiple genomic resources of T. indica for the discovery and characterization of microsatellite-based markers. The prime objectives of the study include (i) the investigation of nine different genomes of T. indica for finding out the distribution pattern and dynamics of microsatellites at inter-and intra-genome levels, (ii) the identification and validation of microsatellite-derived markers for dissecting genetic variation in T. indica isolates, and (iii) the assessment of diversity and structure of the T. indica population by polymorphic microsatellite markers.
Materials and methods
Tilletia indica isolates and culture conditions
The study was made on a set of fifty isolates of T. indica representing different geographical regions of North India (Table 1). T. indica isolates were isolated from KB-infected grain samples collected during 2019–2020 from grain mandies in seven different regions of North India (Haryana, Rajasthan, Punjab, Uttar Pradesh, Uttarakhand, Jammu, and Himachal Pradesh). Teliospores of each isolate were extracted by puncturing a sorus of T. indica-infected seed, and spores were processed for germination at 121°C in a Petri-plate amended with 2% water agar (HiMedia, India). It is important to mention that a single germinating teliospore was chosen in random fashion from a Petri-plate containing water agar with the help of a sterilized needle. The selected spore was further placed on a Petri-plate amended with potato dextrose agar (PDA; HiMedia, India) and incubated at 18 ± 2°C for 2 weeks under alternate cycles of dark and light conditions before executing further experiments.

Table 1. Description of Tilletia indica isolates collected from different states of North India.
Aggressiveness and virulence assessment
The aggressive nature of T. indica isolates was studied by inoculating each isolate independently on three susceptible wheat cultivars (WL711, WH542, and PBW343). The seeds were grown in one-meter-long strips with a strip-to-strip distance of 25 cm during the rabi cropping season (2021–2022) at the experimental field of the ICAR-Indian Institute of Wheat and Barley Research (IIWBR), Karnal, India. Three replicates of each genotype were maintained. The wheat sowing operation was performed during the second week of November and was similar to the period of normal sowing of wheat in North India. Bulk inocula of each T. indica isolate producing secondary sporidia (allantoids) were raised on PDA containing Petri-plates. The load of the liquid suspension of secondary sporidia (6 × 10⁶ mL−1) was optimized with a hemocytometer. During evening hours, two milliliter of standardized liquid suspension of each isolate in the ear-head was inserted with the help of a hypodermal syringe (Aujla et al., 1989) in ten main tillers of each cultivar (i.e., WL711, WH 542 and PBW343) at Zadock’s growth stage (ZGS 49, i.e., boot leaf stage) (Zadocks et al., 1974) (Supplementary Figure S1). A single sterilized syringe per isolate was employed to avoid the cross-contamination of KB isolates among each other. After inoculation, each inoculated tiller was tagged. An environment of high humidity (>70%) was regularly maintained by performing mist sprays at regular intervals of 4 h. At crop maturity, inoculated ear heads were handpicked and threshed. Every seed of the inoculated tiller was visually examined. In the case of point infections in the seeds, a magnifying lens or a microscope was used to confirm the presence of KB teliospores. Data pertaining to the number of KB-infected grains per inoculated ear as well as their level of infection per grain was also recorded. The numerical values of 0, 0.25, 0.50, 0.75, and 1.0 were used to indicate the infection severity (infection grade) of 0, 1, 2, 3, and 4, respectively. The percent coefficient of infection (CI) was computed by employing the below-mentioned formula.
Where, CI = Per cent coefficient of infection; N = Numbers of total grains analyzed; i = infection severity grade (i = 0 to 4); X = Numerical value of ith grade of infection severity; and Y = Total number of grains of ith grade of infection severity.
The obtained CI values were further used to categorize aggressivity of each isolate inoculated on susceptible cultivars (WL711, WH542 and PBW343). All the T. indica isolates under study were further classified into three major groups. These includes: highly aggressive (HA) isolates (CI >20%), moderately aggressive (MA) isolates (CI ranged between 10–20%) and least or weakly aggressive (LA) isolates (CI <10%).
Tilletia indica genomic resources and computational analysis
The sequence data used in the current study was collected from nine different whole genome sequences (PSWKBGH_1, PSWKBGH_2, PSWKBGD_1_3, RAKB_UP_1, TiK_1, Tik, DAOMC236408, DAOMC236414, and DAOMC236416) available in the public domain (NCBI; https://www.ncbi.nlm.nih.gov/genome/browse/#!/eukaryotes/8345/) for the exploration of microsatellite rpeat motifs. The retrieved data was assessed on different parameters such as motif occurrence frequency, relative density (RD) of repeat motifs, and relative abundance (RA) of repeat motifs with the help of Krait software (Du et al., 2018). The numerical value setting criteria used to discover different microsatellite loci were fixed at 12 for mono-repeat motifs, followed by 7 for di-repeat motifs, 5 for tri-repeat motifs, and 4 for the remaining tetra-, penta-, and hexa-repeat motifs. A random selection of fifty SSR primers from all nine genomes of T. indica was performed before amplified product validation using a polymerase chain reaction (PCR) assay. PRIMER3 online software2 was used to develop and select primers for PCR assays.
PCR amplification and SSR genotyping
The genomic DNA of all 50 isolates of T. indica was isolated using the cetyl trimethylammonium bromide (CTAB)-based protocol of Kumar et al. (2013). The quality and quantity of extracted genomic DNA from each isolate were determined using Scandrop2 spectrophotometers (Analytik Jena, Germany). A PCR assay was conducted in a total of 25 μL of reaction and executed in a Q Cycler 96 (Hain Lifescience, United Kingdom) machine for amplification of each SSR locus marker. The PCR master reaction was prepared by incorporating T. indica DNA (50 ng μ1), GoTaq green master mix (12.5 μL; Promega, United States), and 1 μL of each primer (10 M) in a thin-walled PCR tube (Genaxy, India). The final reaction volume (25 μL) was fixed with the help of sterilized distilled water. The thermocycling program runs after setting the preliminary denaturation temperature at 95°C for 2 min, followed by six touch-down PCR cycles comprising 95°C for 20 s, 57/53°C for 15 s, and 72°C for 30 s. These cycles were followed by 40 cycles of denaturation at 95°C for 20 s with an invariable annealing temperature of 57 or 53°C (depending on the marker as mentioned in Table 2) for 15 s, extension at 72°C for 30 s, and a final elongation step at 72°C for 30 min. All the amplified products were visualized on a 3.5% agarose gel using ethidium bromide staining. A DNA ladder (100 bp; Promega, USA) was employed to compare and estimate the size of the amplified product.
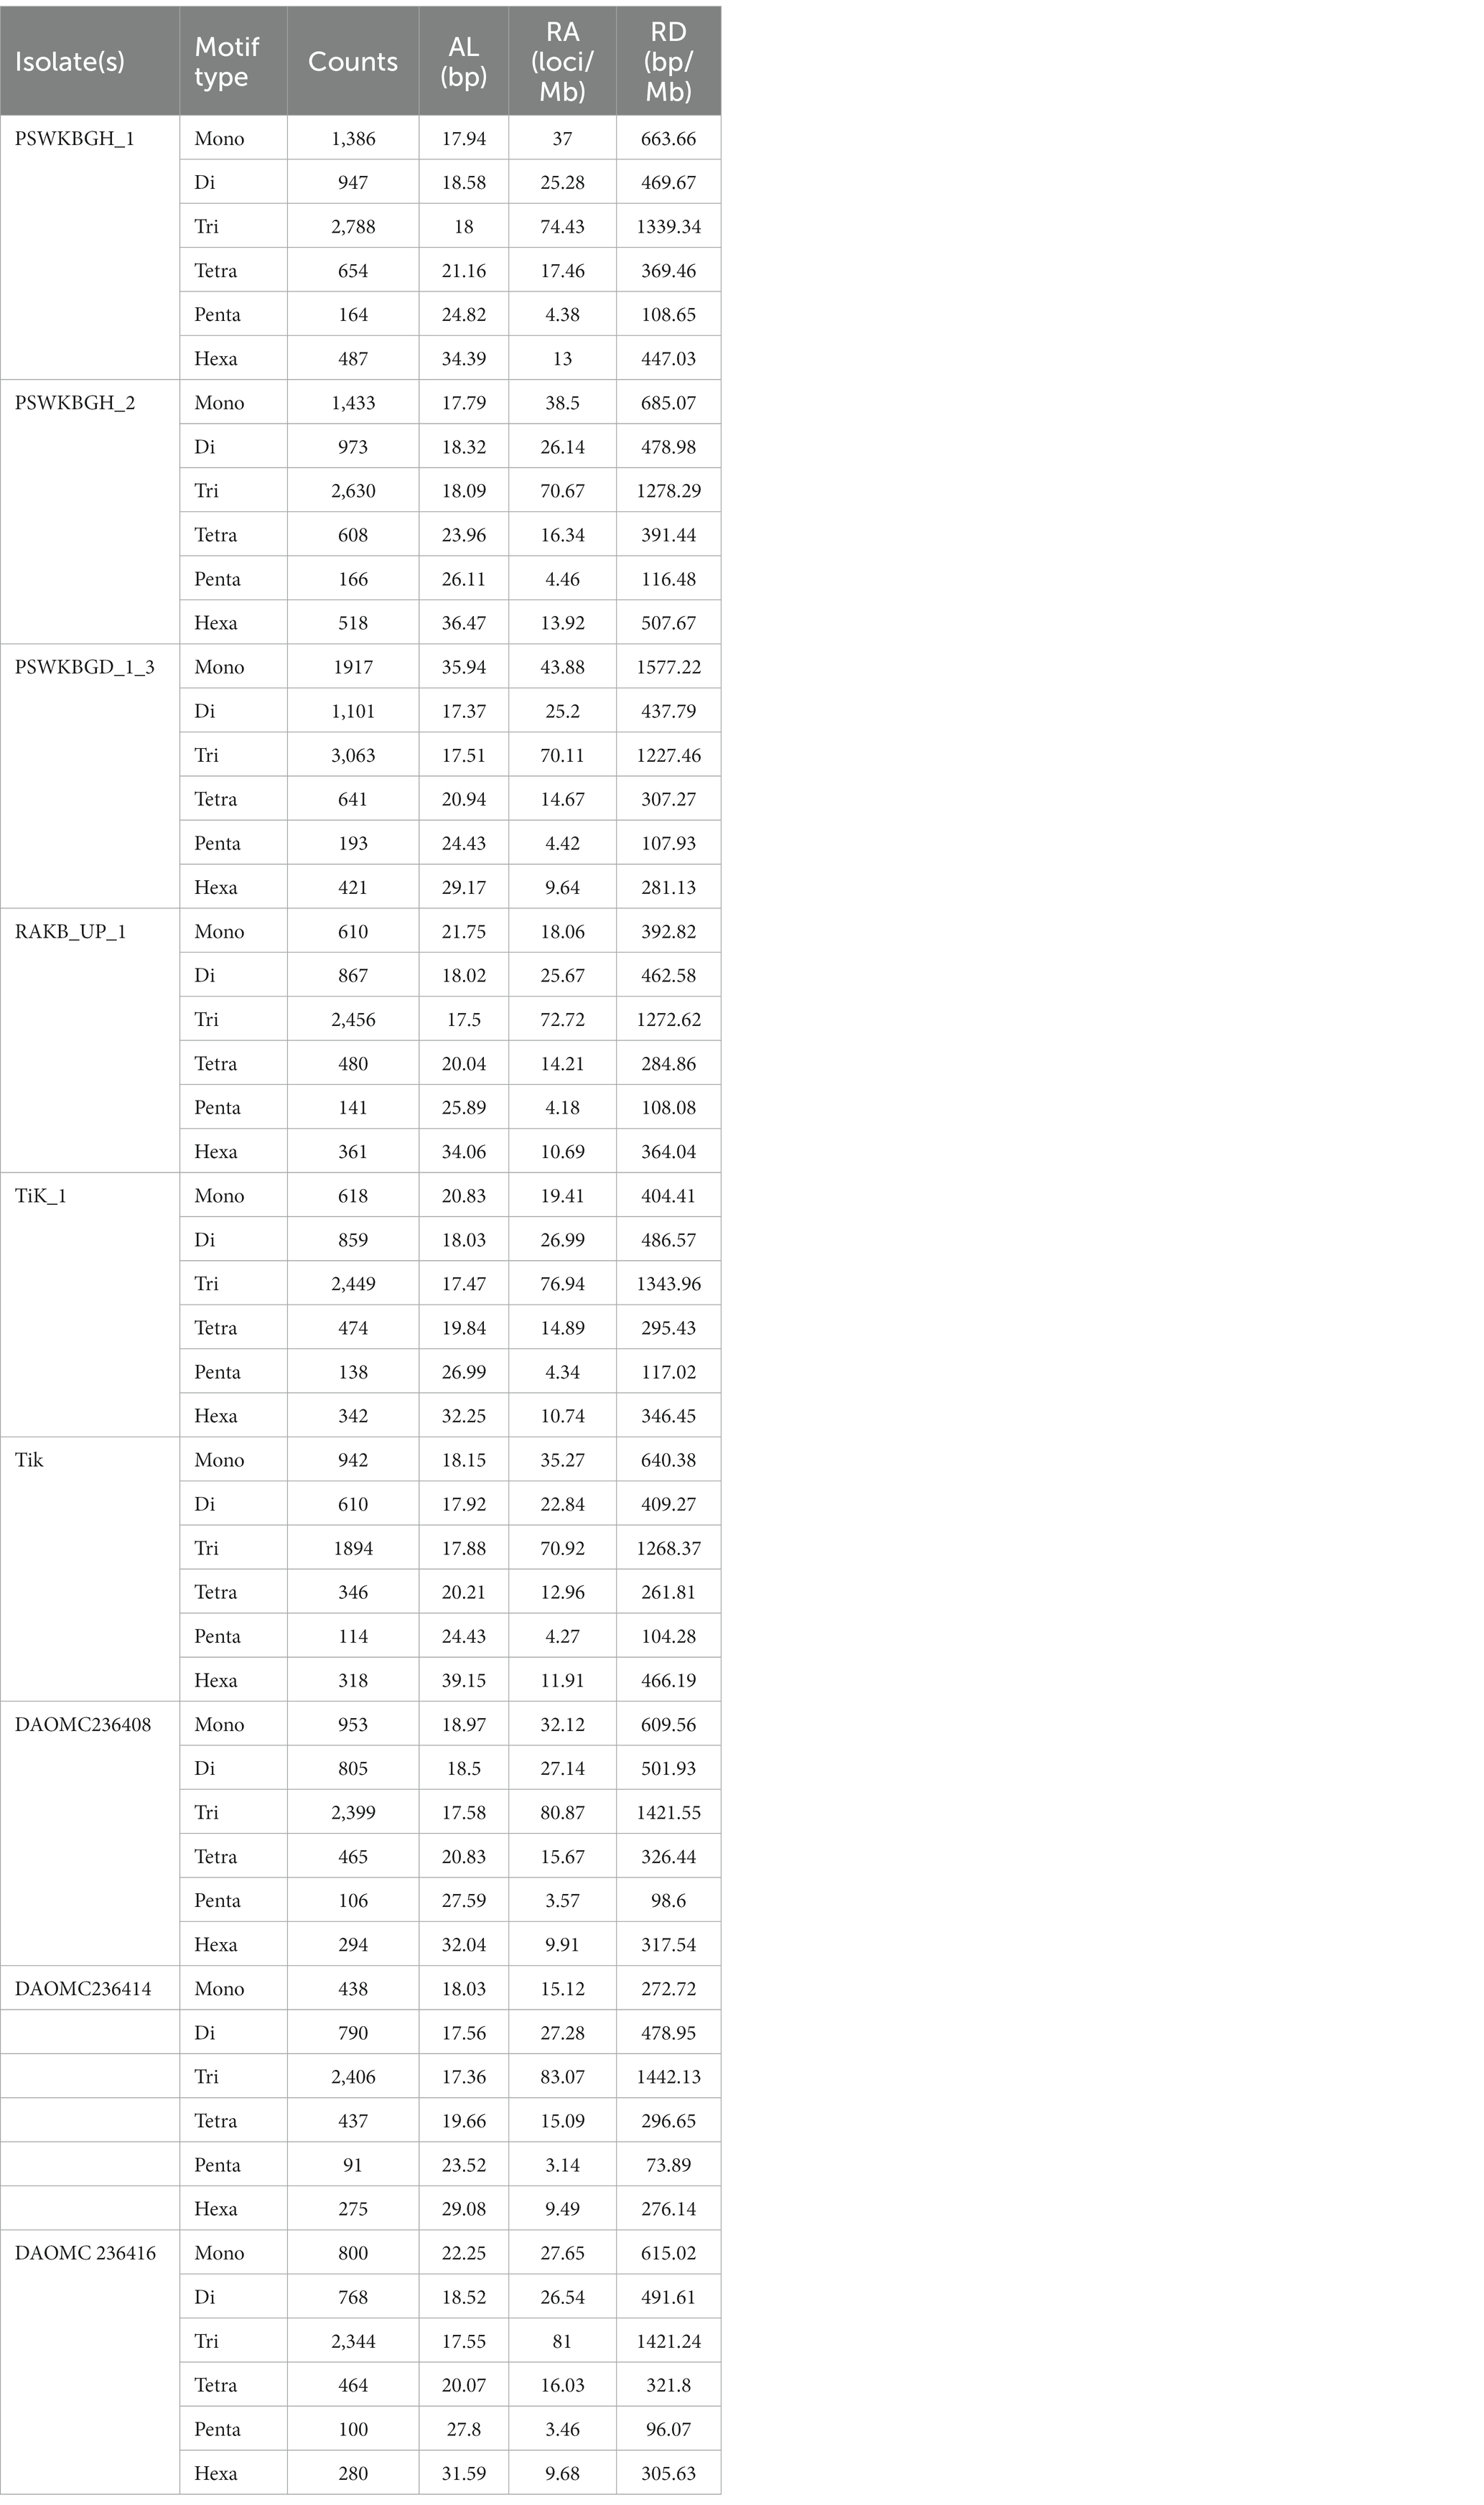
Table 2. Details of primer sequences, motifs, annealing temperatures (Ta), and other indices of polymorphic simple sequence repeat (SSR) markers in the 50 geographical distinct Tilletia indica isolates.
Statistical analysis
Each T. indica isolate was monitored for the presence (recorded as 1) or absence (recorded as 0) of amplified products by each SSR primer used in the PCR assay. The 0/1 matrix was used to compute the similarity genetic distance using the Simqual option available in the computer-driven numerical taxonomy and multivariate analysis system (NTSYS) software, version 2.1 (Rohlf, 2002). To deduce the genetic relationships among different isolates of T. indica, the resultant similarity coefficients were taken into consideration for the generation of a dendrogram based on the unweighted paired group method of arithmetic averages (UPGMA) algorithm and sequential agglomerative hierarchical non-overlapping (SAHN) grouping. The computation of heterozygosity (He) and polymorphism information content (PIC) was made according to Botstein et al. (1980). The PIC value was determined by using the below-mentioned formula:
where Pij depicts frequency of the jth allele for the marker i allessles.
Analysis of molecular variance (AMOVA) was computed by using GenAlEx 6.5 (Peakall and Smouse, 2012) to figure out the role of variance components in genetic variation at the inter-and intra-population levels. Population structure was determined by Structure 2.3.4 (Pritchard et al., 2000). The STRUCTURE program was run by giving command of five independent runs of 50,000 burns in period length at fixed iterations of 1,00,000. Further, the methodology of Evanno et al. (2005) was referred to fix the optimum K-value. Besides this, field experiments performed to check the aggressiveness of each T. indica isolate were statistically arranged in a randomized block design (RBD) with three independent replicates. An analysis of variance (ANOVA) was conducted to test the significance of the generated data. Duncan’s multiple range test (DMRT) is used to make post hoc comparative analyzes of the mean data.
Results
Aggressiveness assessment of Tilletia indica isolates
All the 50 isolates of T. indica were assessed on the parameter of their aggressivity on three susceptible wheat cultivars (cv. WL711, WH542 and PBW343) and obtained data was presented in Table 1. The range of CI in all the three cultivars viz., WL711, WH542 and PBW343 was 7.40–43.28%, 7.17–41.10% and 6.23–46.11%, respectively (Table 1). Isolate KTi-19-17 was found highly aggressive in nature as revealed by CI values more than 41% in all the three cultivars. Similarly, KTi-19-30 was found least aggressive as lowest CI was recorded in WL711 (7.40%) followed by WH542 (7.17%) and PBW343 (6.23%) cultivars. Further, it was noticed that the aggressivity of tested KB isolates ranged from HA (30% T. indica isolates) to LA (24% T. indica isolates) and MA (46% T. indica isolates) (Figure 1).
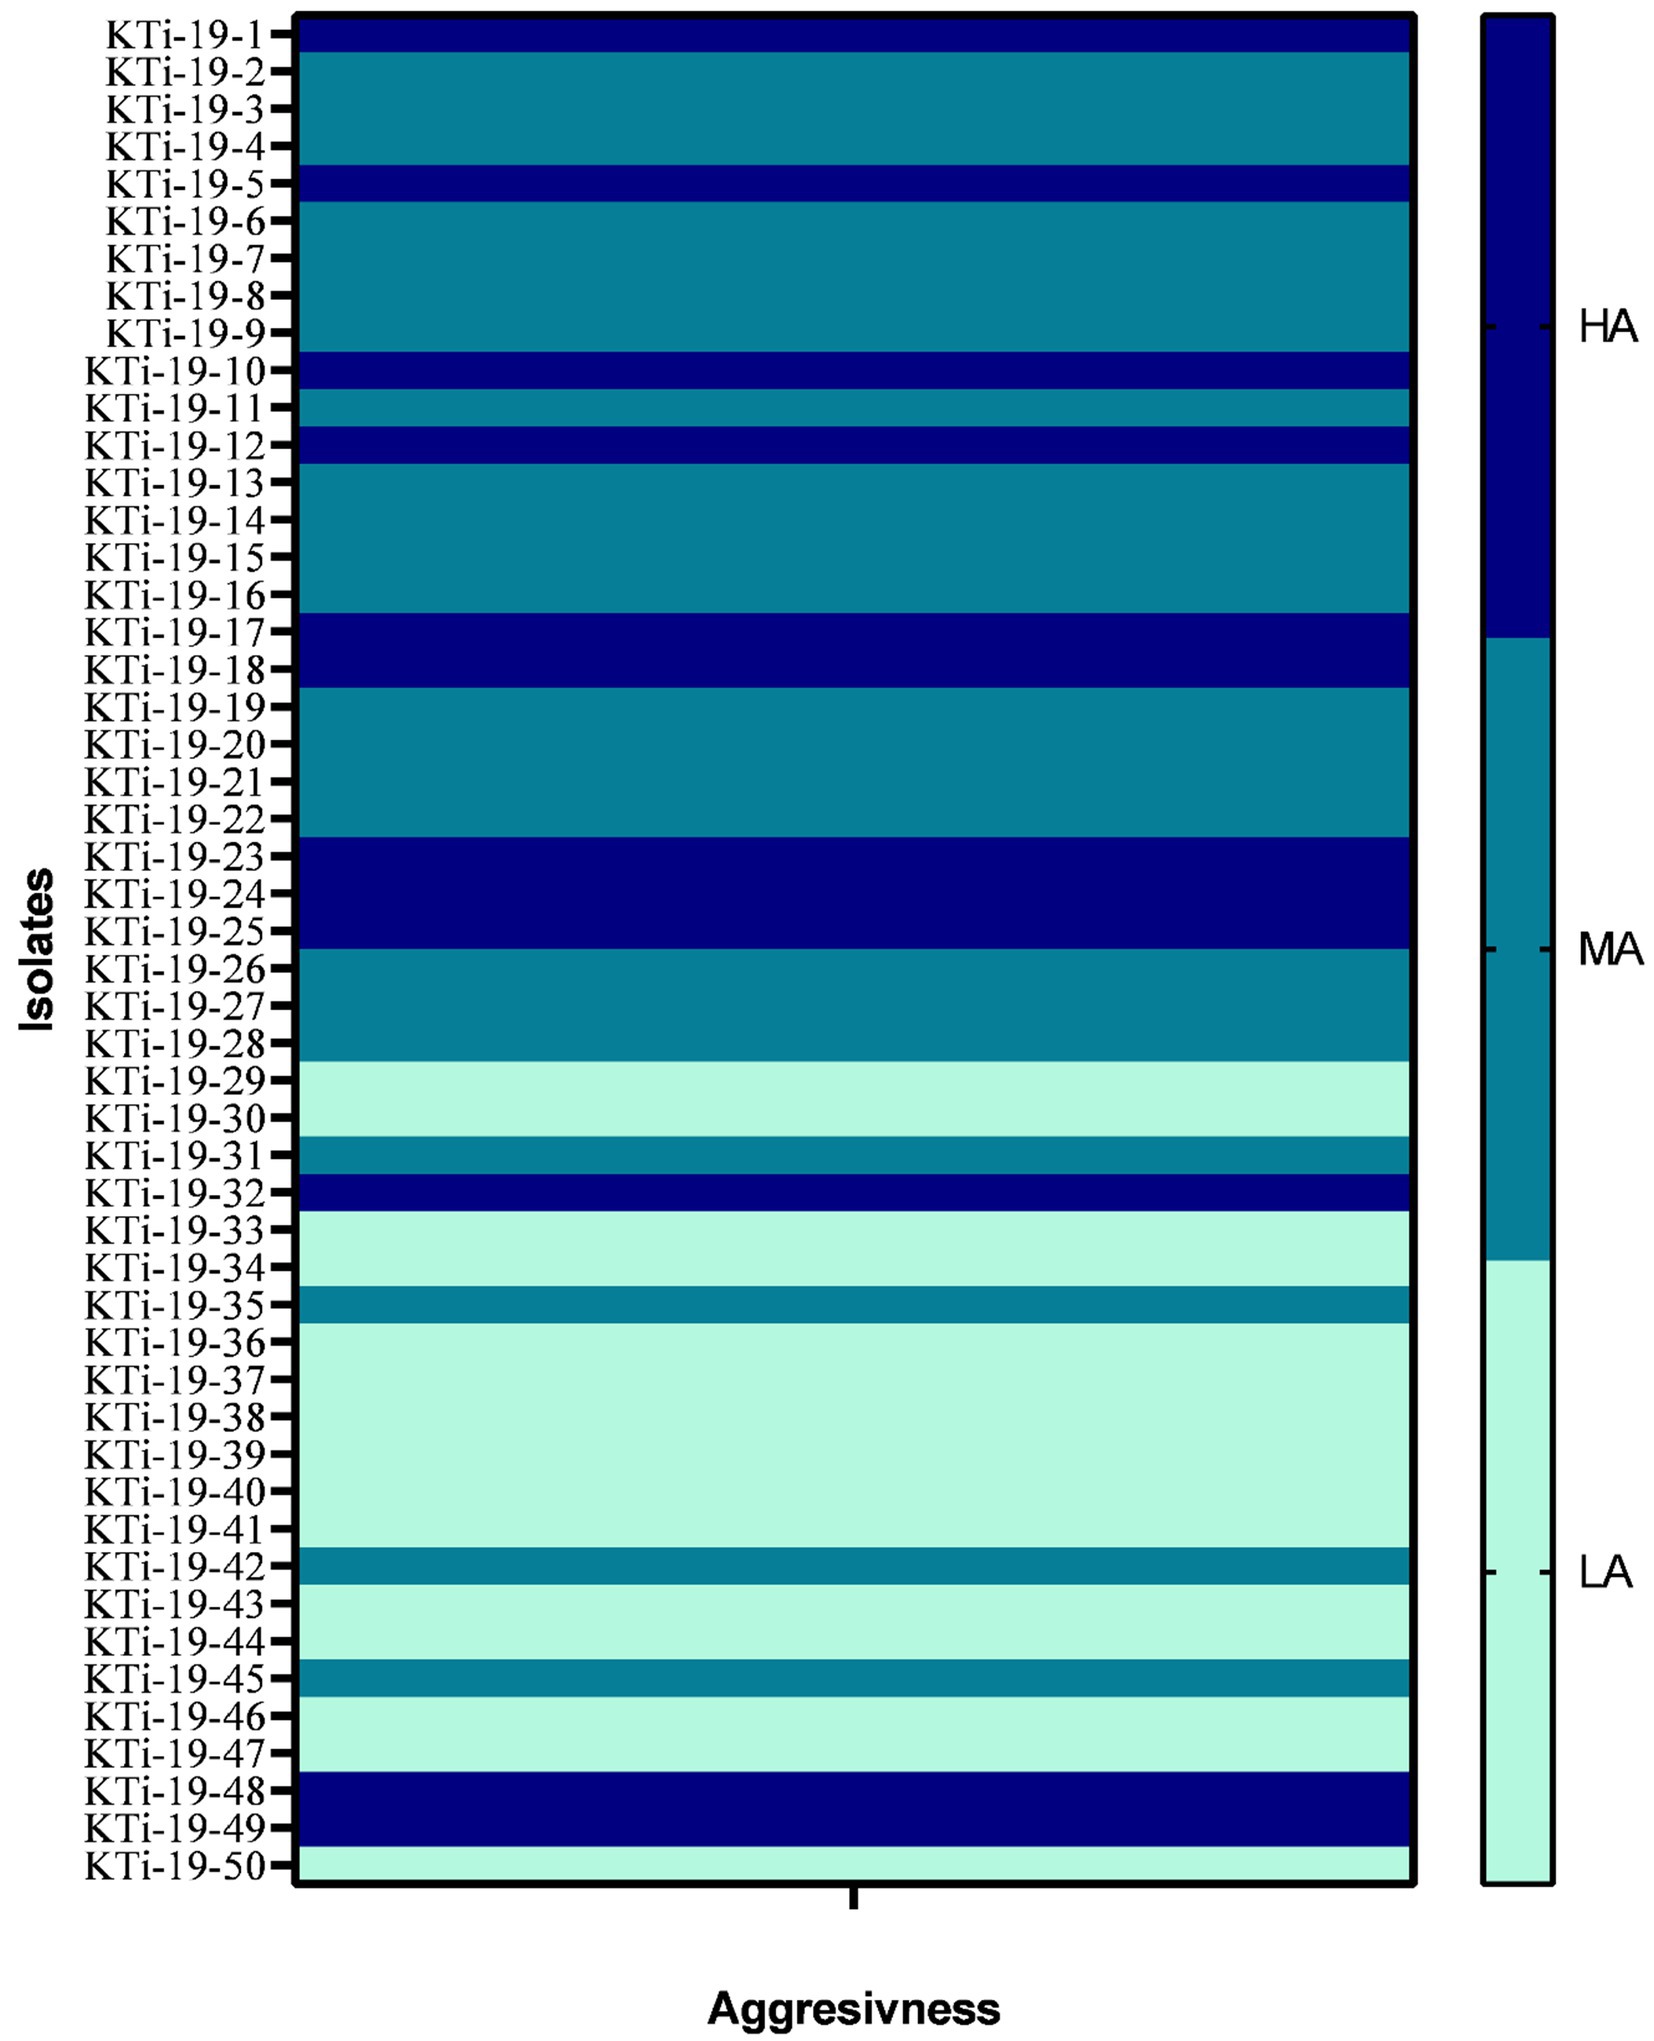
Figure 1. Heat map showing aggressiveness of Tilletia indica isolates. HA: Highly aggressive (CI = 20%), MA: moderately aggressive (CI = 10–20%), LA (least or weakly aggressive = CI <10%).
Genome-wide distribution patterns of microsatellite repeats
Nine distinct T. indica whole genome sequences were mined to determine the total lengths of all kinds of motifs per megabase pair (Mbp) of DNA sequence in order to evaluate the importance of motif length to microsatellite prevalence (Table 3). The PSWKBGD_1_3 genome was found to have the most microsatellites (7336), followed by the PSWKBGH_1 and PSWKBGH_2 genomes (6,426 and 6,328, respectively), DAOMC236408 (5022), RAKB_UP_1 (4915), TiK_1 (4880), DAOMC236416 (4756), DAOMC236414 (4437), and Tik (4224). DAOMC236414 (98.38%) had the highest proportion of perfect microsatellites, followed by DAOMC236416 (98.04%), DAOMC236408 (98.01%), Tik (97.49%), PSWKBGH_1 (97.42%), TiK_1 (97.34%), RAKB_UP_1 (97.21%), PSWKBGH_2 (96.84%), and PSWKBGD_1_3 (95.24%). In addition, it was discovered that the PSWKBGH_1 (171.54) genome had the highest relative abundance of microsatellites when compared to the PSWKBGH_2 (170.03), DAOMC236408 (169.29), PSWKBGD_1_3 (167.92), DAOMC236416 (164.35), Tik (158.17), DAOMC236414 (153.19), TiK_1 (153.311), and RAKB_UP_1 (145). Similar to this, RD of SSR was seen to be at its highest in PSWKBGD_1_3 (3938.8), followed by PSWKBGH_2 (3457.92), PSWKBGH_1 (3397.81), DAOMC236408 (3275.61), DAOMC236416 (3251.37), Tik (3150.31), TiK_1 (2993.85), and RAKB_UP_1 (2885.01) and DAOMC236414 (2840.49). (Table 3). Table 4 contains detailed information on the percentage, relative abundance (RA), and relative density (RD) of SSRs in sequence sets from various T. indica isolates.
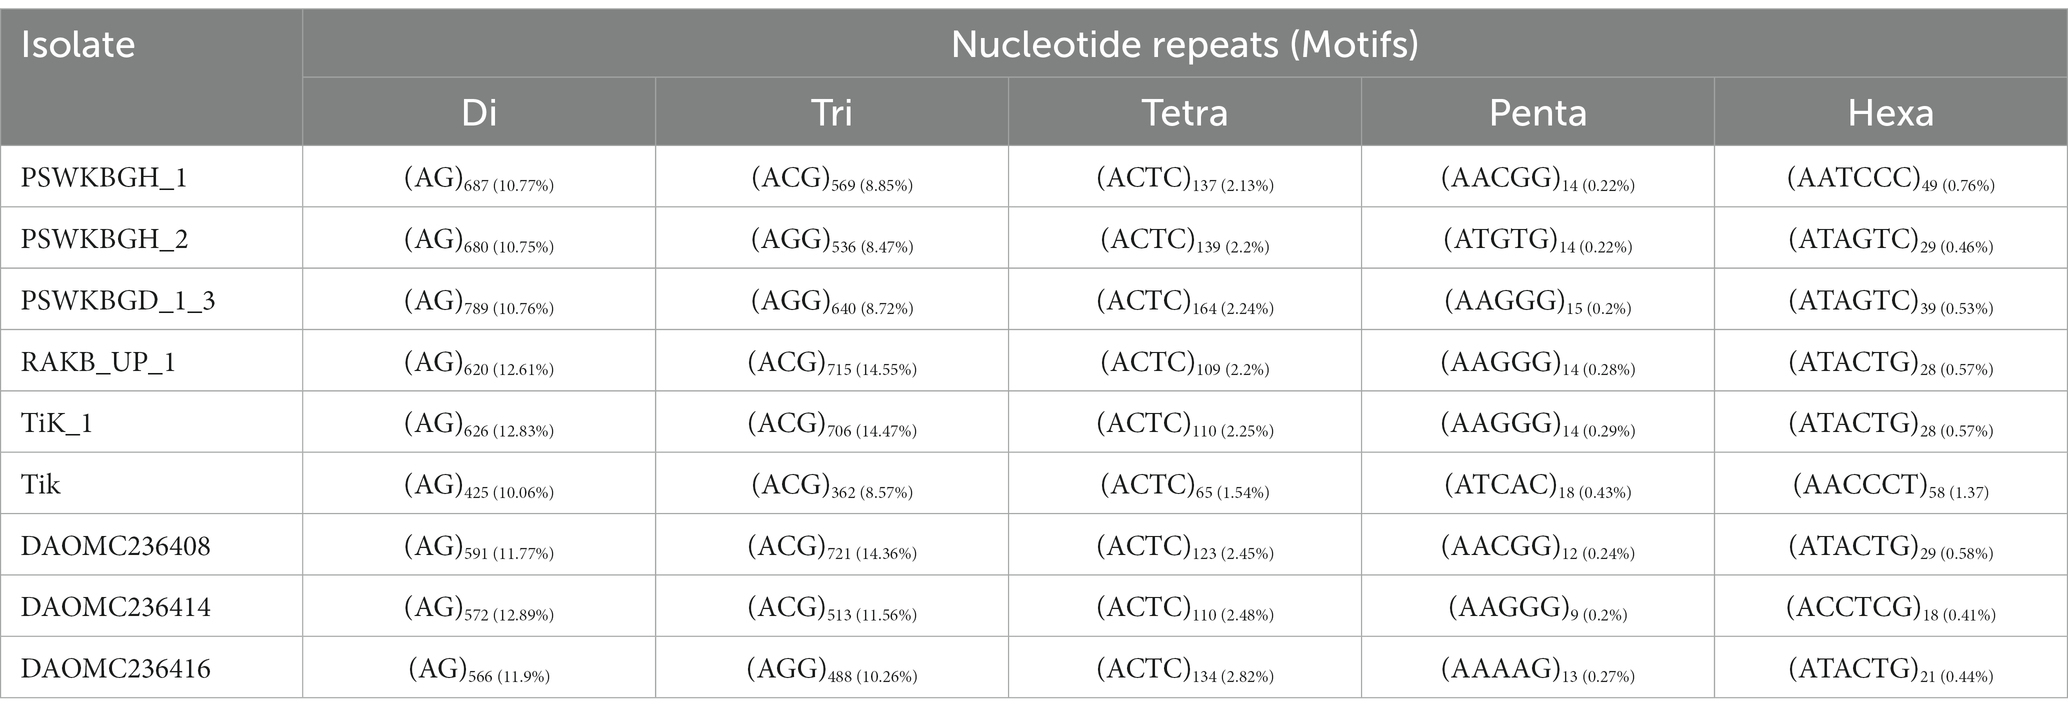
Table 3. Number and distribution of SSRs in different isolates of Tilletia indica.
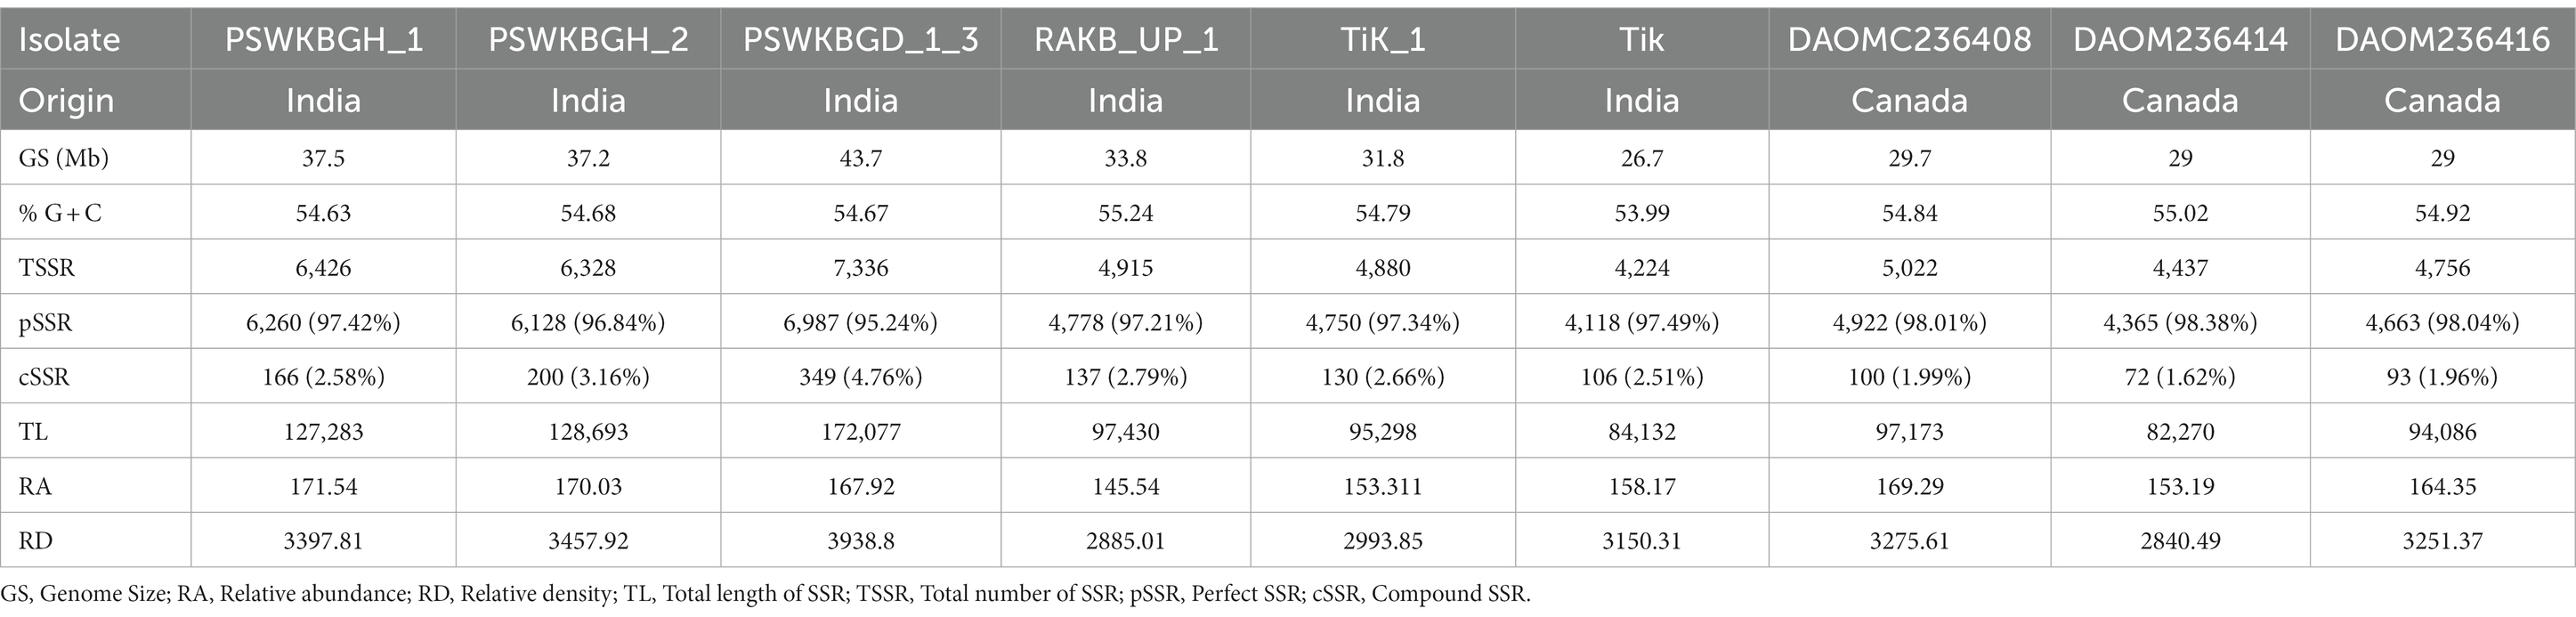
Table 4. Percentage, relative abundance, and relative density of SSRs in sequence sets of different isolates of Tilletia indica.
A total of 2344 (49.3% of the genome), 2406 (54.2% of the genome), 2399 (47.8% of the genome), 2788 (41.6% of the genome), 3063 (41.8% of the genome), 2630 (43.4% of the genome), 2456 (50% of the genome), 2449 (50.2% of the genome), and 1894 (44.8% of the genome) tri-nucleotide motif types were identified in DAOMC236416, DAOMC236414, DAOMC236408, PSWKBGH_1, PSWKBGD_1_3_3, PSWKBGH_2, RAKB_UP_1, TiK_1 and Tik, respectively (Table 4). On the basis of microsatellite count distribution, tri-nucleotide repeat units followed by mono-, di-, tetra-, hexa-, and penta-nucleotide repeat motifs were predominant in DAOMC236416, DAOMC236408, PSWKBGD_1_3, PSWKBGH_2, and Tik genomes (Table 4; Figure 2). Contrarily, DAOMC236414, PSWKBGH_1, RAKB_UP_1, and TiK_1 genomes showed the dominance of tri-nucleotide motifs, followed by mono-, di-, tetra-, hexa-, and penta-nucleotide motifs. A similar trend was observed in all the genomes when the SSR length distribution for each type of motif was explored in all the genomes (Figure 3). The most frequent motif in DAOMC236414, DAOMC236408, PSWKBGH_1, RAKB_UP_1, TiK_1, and Tik genomes was ACG, except in genome DAOMC236416, PSWKBGD_1_3 and PSWKBGH_2, where AGG was found to be the most frequent repeat. Overall, the repeats of AG, AGG, ACG, ACTC, AAAAG, AAGGG, AACGG, ATGTG, ATCAC, ATACTG, ACCTCG, ATAGTC, AATCCC, and AACCCT were abundant in all the genomes (Table 5). The C/G motif in all the genomes was the most abundant mono-nucleotide motif (Figure 4).
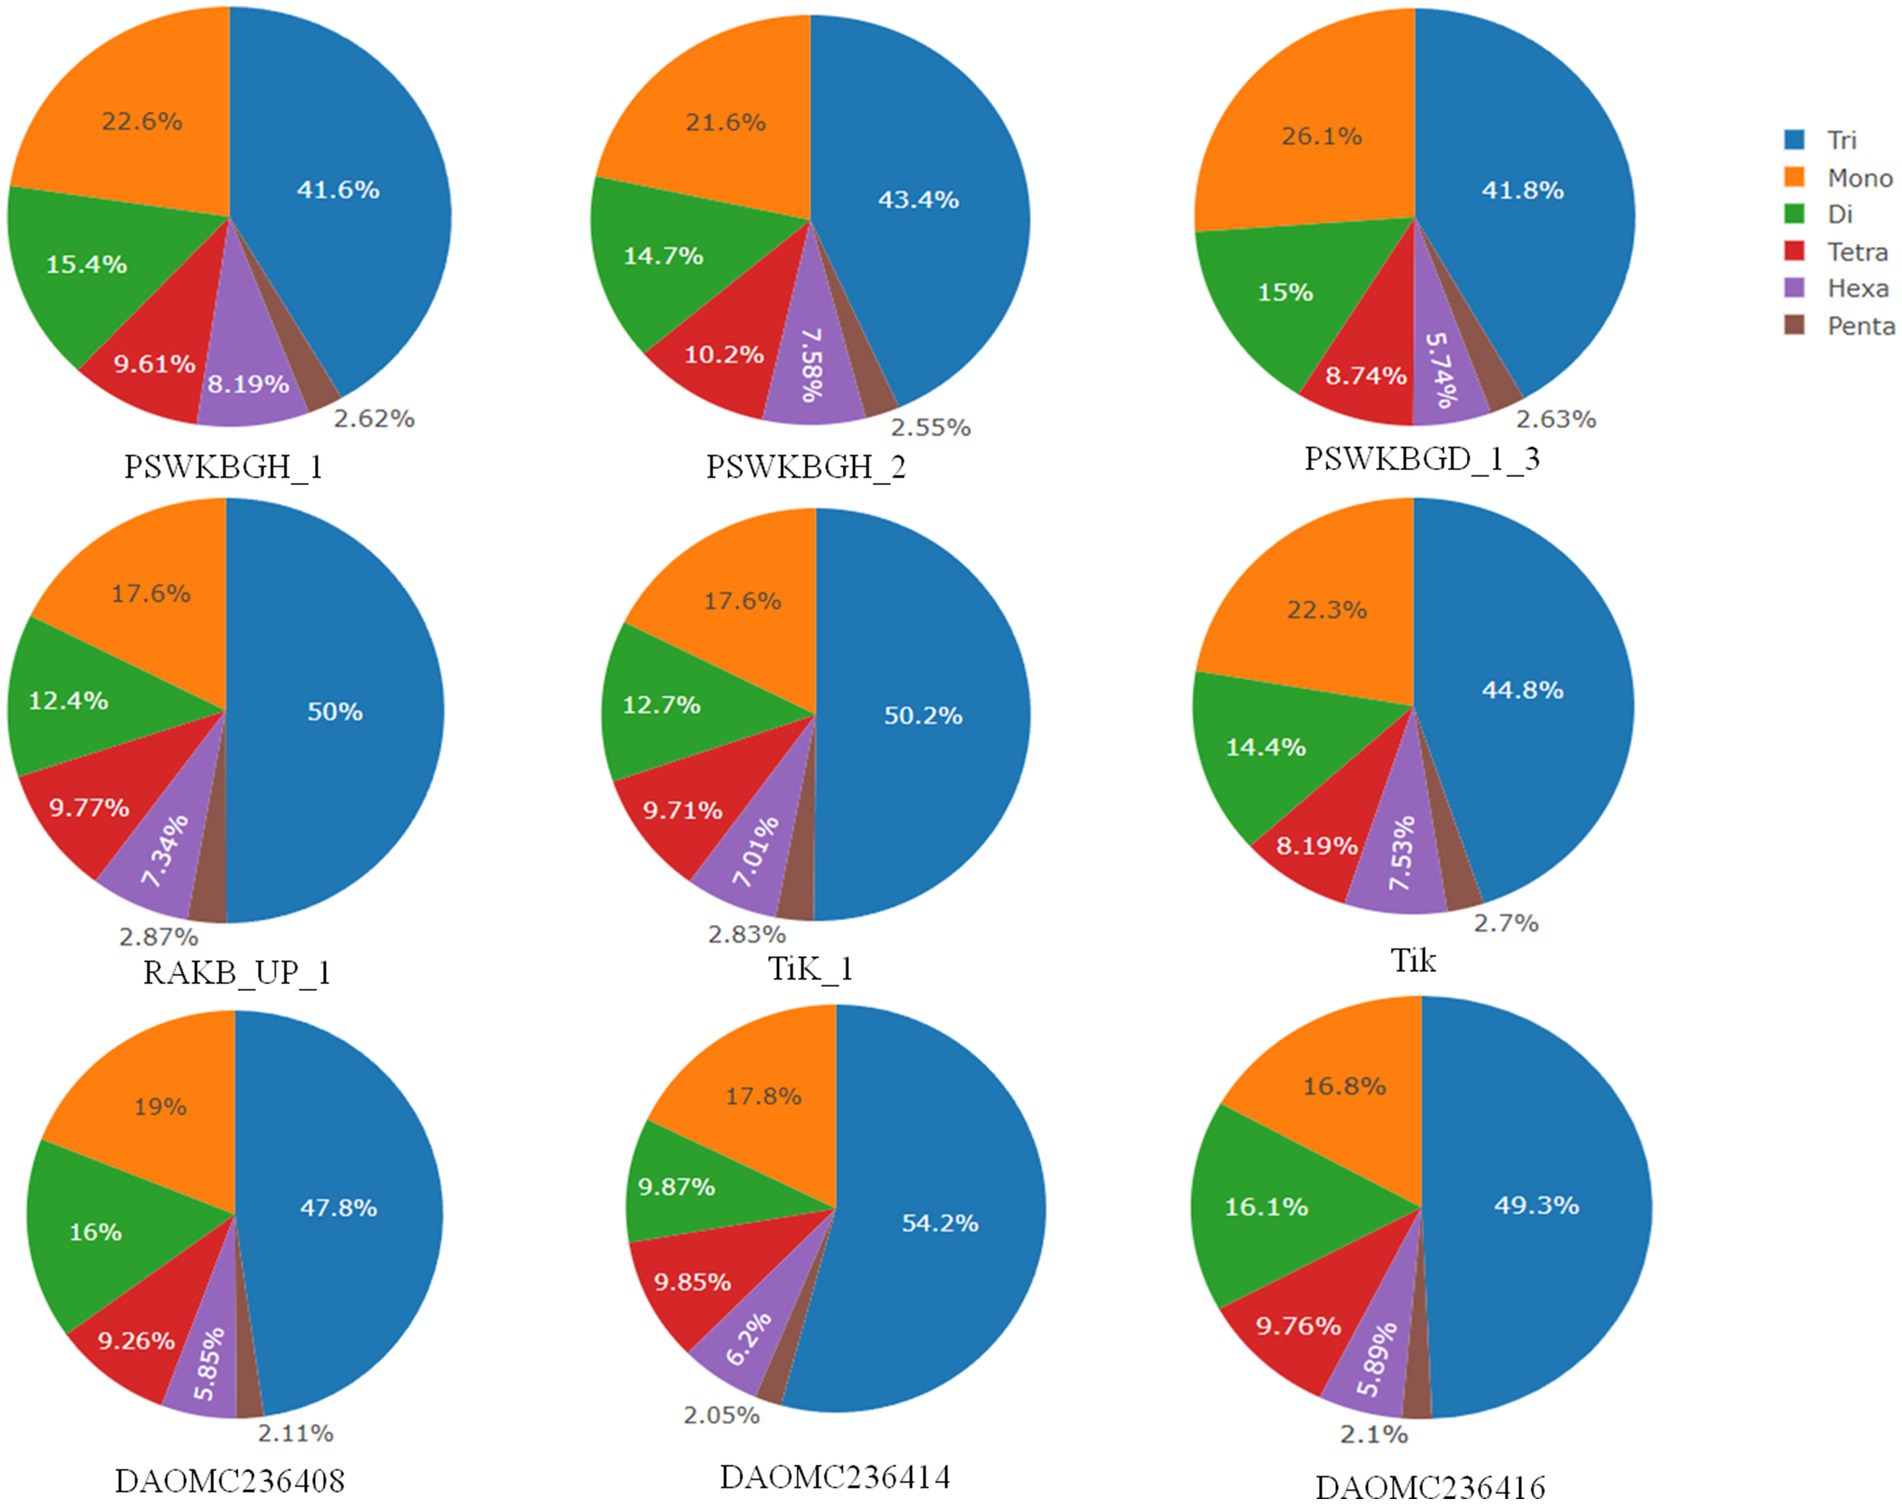
Figure 2. SSR count distribution for each type in Tilletia indica genomes.
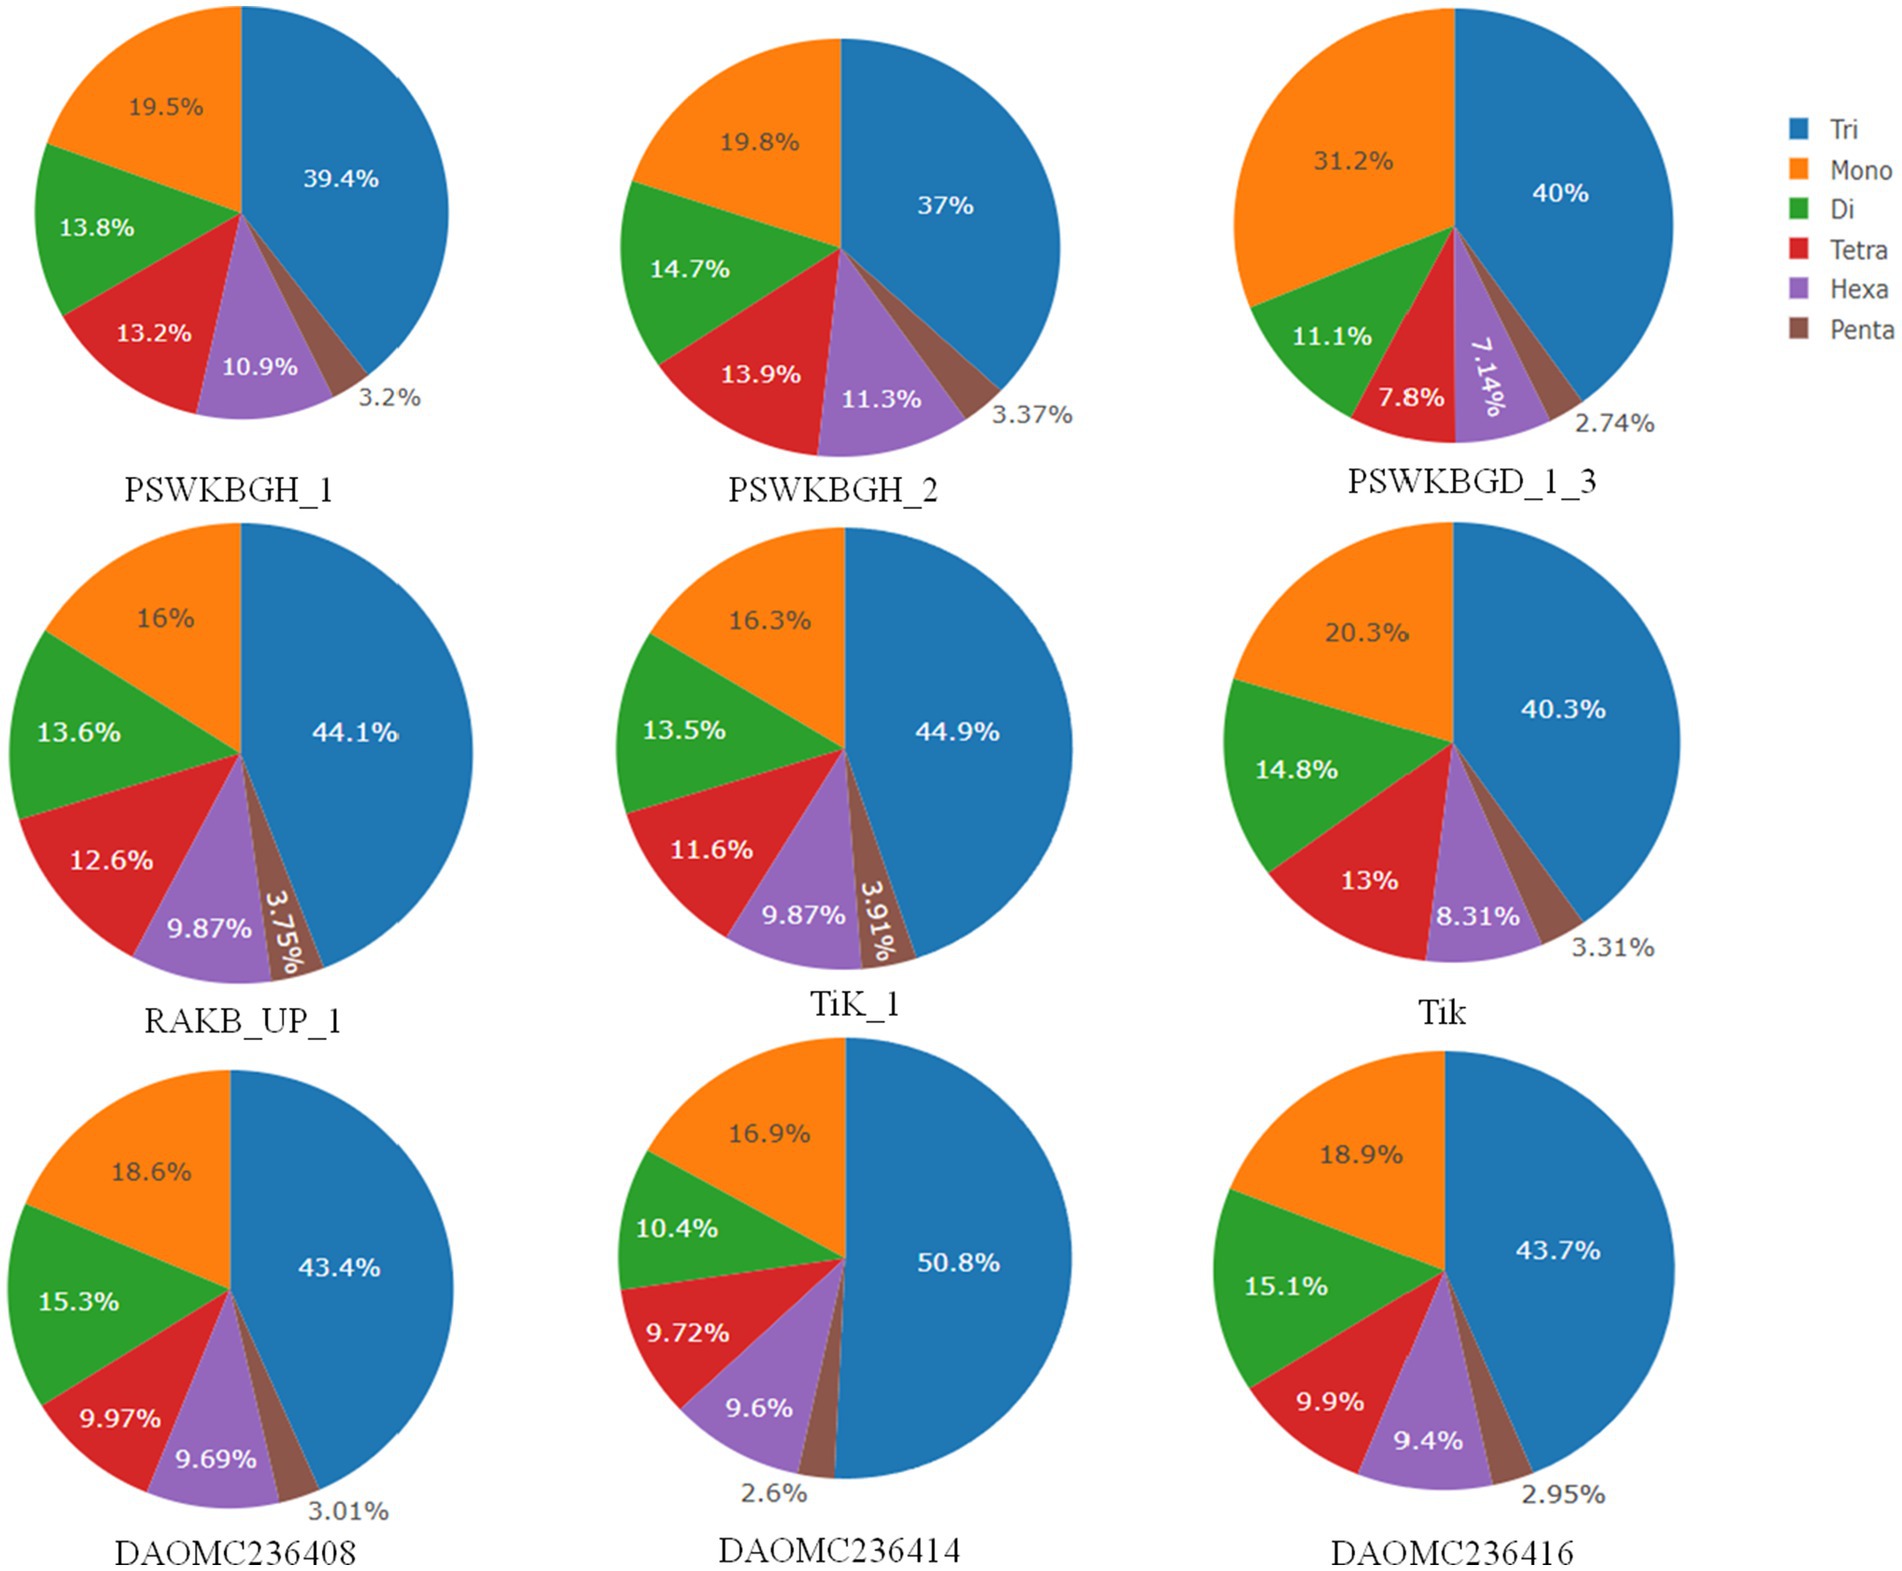
Figure 3. SSR length distribution for each motif in Tilletia indica genomes.
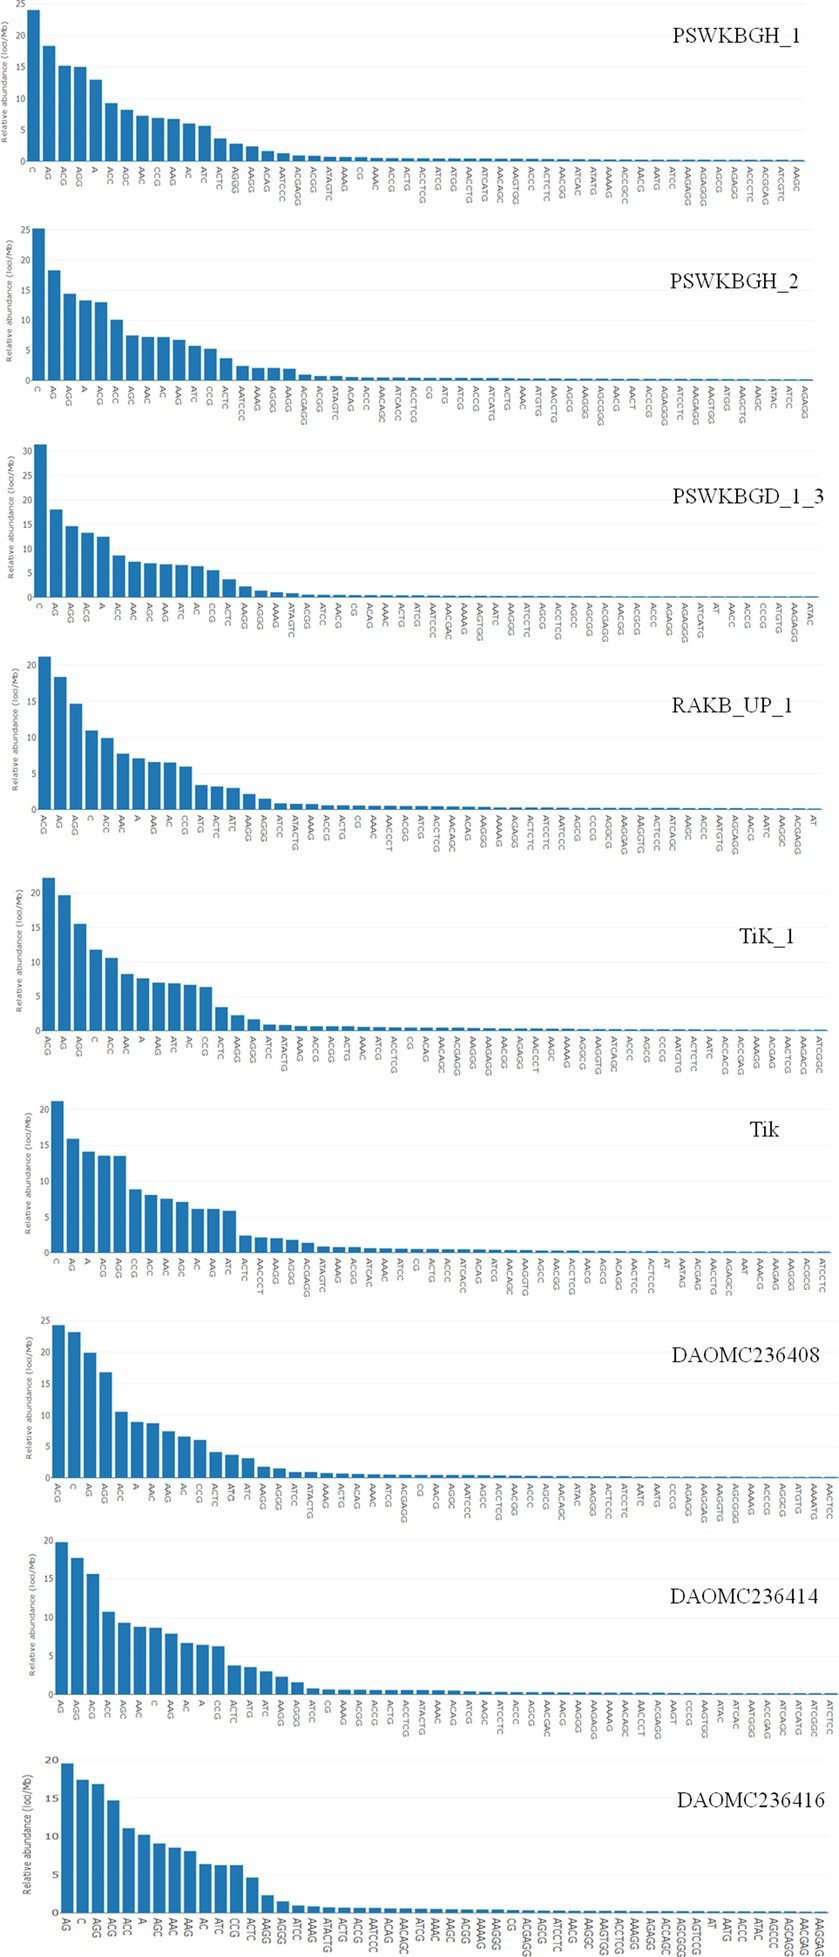
Figure 4. Distribution of most abundant motifs in Tilletia indica genomes.
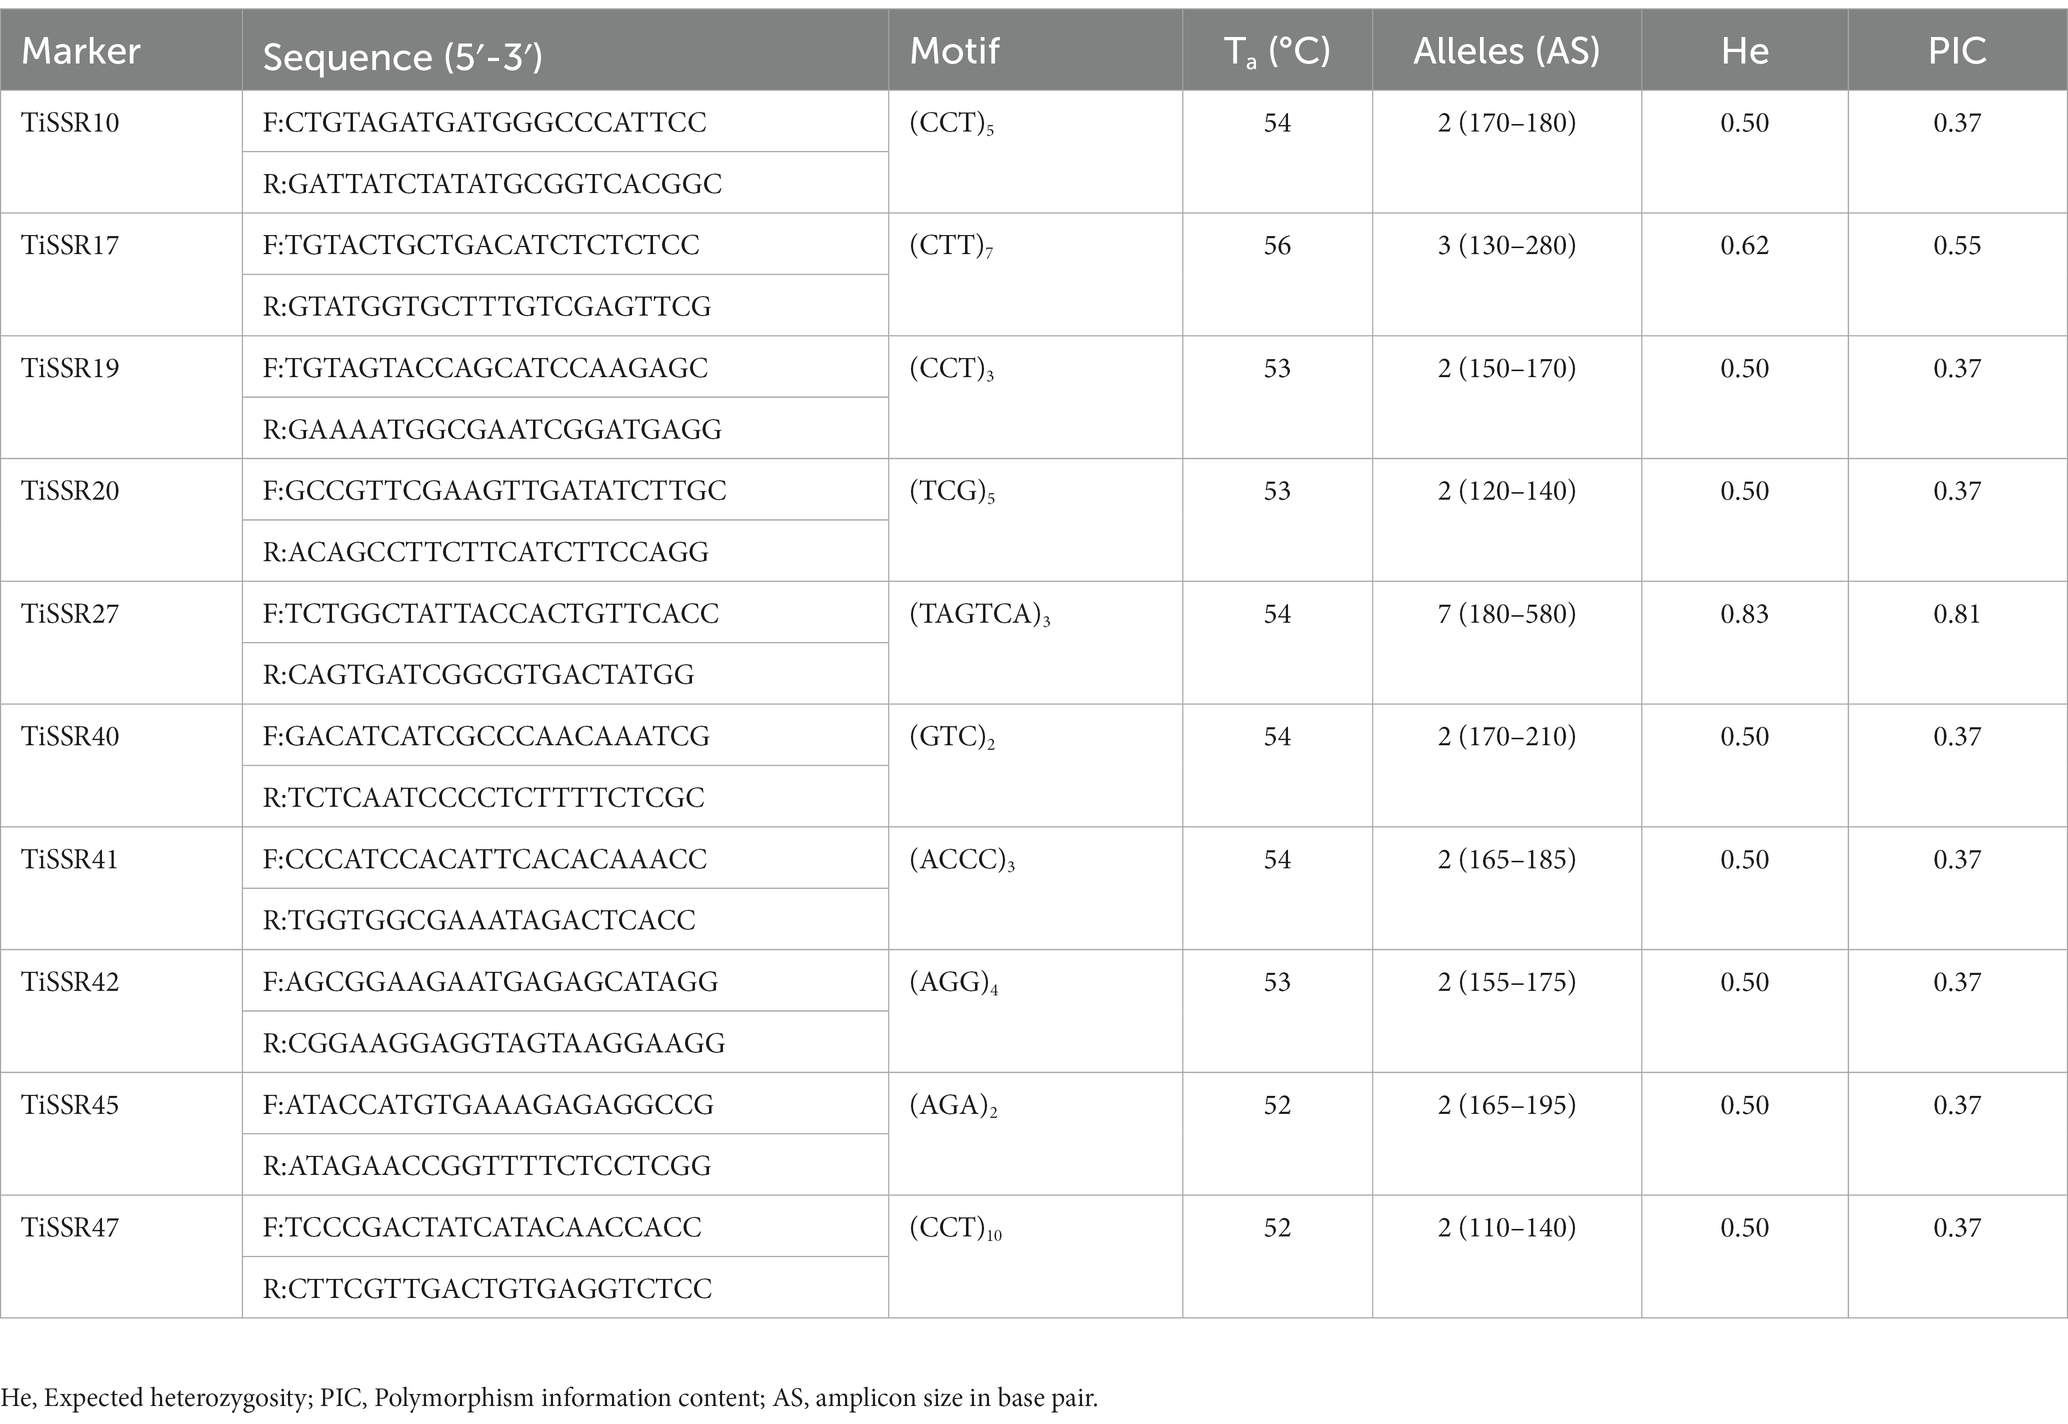
Table 5. The longest SSR motif found in the transcript sequences of Tilletia indica isolates.
Development of genome-wide microsatellite markers and polymorphism evaluation
Among fifty microsatellite markers, only 36 SSR markers were able to generate amplicons when tested on the genomic DNA of T. indica. However, only ten loci showed polymorphism among all 50 isolates and displayed well-amplified and easily detectable amplicons ranging from 110 to 580 bp (Table 2). Among amplified markers, ten markers (37.5%) were polymorphic (PIC >0.35%), and the remaining 26 markers showed monomorphic alleles. A total of 26 alleles were amplified by ten markers (Table 2). Maximum alleles (7) were amplified by the TiSSR27 marker. Both TiSSR17 and TiSSR27 found the most informative SSR markers based on their PIC values (>0.50) and heterozygosity values (>0.62) (Table 2).
Diversity and cluster analysis
The ten polymorphic primer pairs identified in the current study resulted in the production of twenty-six different alleles, which were further deployed to estimate the genetic variability and kinship among different isolates of T. indica. The results of analysis of molecular variance (AMOVA) identified 94% genetic variation within population and 6% among population (Table 6). Further, it has been noticed that similarity coefficients values varied from 0.51 to 1.0 in all the isolates of T. indica. The dendrogram made at similarity index of ≥60% divided T. indica population into four major clusters (Figure 5). The Cluster-I occupied 15 isolates of T. indica (KTi-1, KTi-2, KTi-3, KTi-4, KTi-19, KTi-30, KTi-21, KTi-29, KTi-31, KTi-32, KTi-46, KTi-47, KTi-48, KTi-49, and KTi-50), while cluster II, III and IV included 2 (KTi-43 and KTi-44), 13 (KTi-5, KTi-37, KTi-6, KTi-7, KTi-8, KTi-9, KTi-33, KTi-34, KTi-35, KTi-36, KTi-10, KTi-18 and KTi-22) and 20 isolates (KTi-11, KTi-20, KTi-12, KTi-13, KTi-15, KTi-28, KTi-17, KTi-38, TiSSR45, KTi-14, KTi-16, KTi-23, KTi-24, KTi-25, KTi-26, KTi-27, KTi-41, KTi-42, KTi-39 and KTi-40) of T. indica, respectively. Similar results have been found with STRUCTURE program, when performed to assess similarity among different T. indica isolates at genetic level. The results of STRUCTURE analysis indicated a strong signal with a sole and clear peak at K = 4 (Figure 6) and further confirmed the prevalence of four genetically diverse groups in the studied population of T. indica representing seven Indian regions (Jammu, Himachal Pradesh, Punjab, Haryana, Uttarakhand, Uttar Pradesh and Rajasthan).
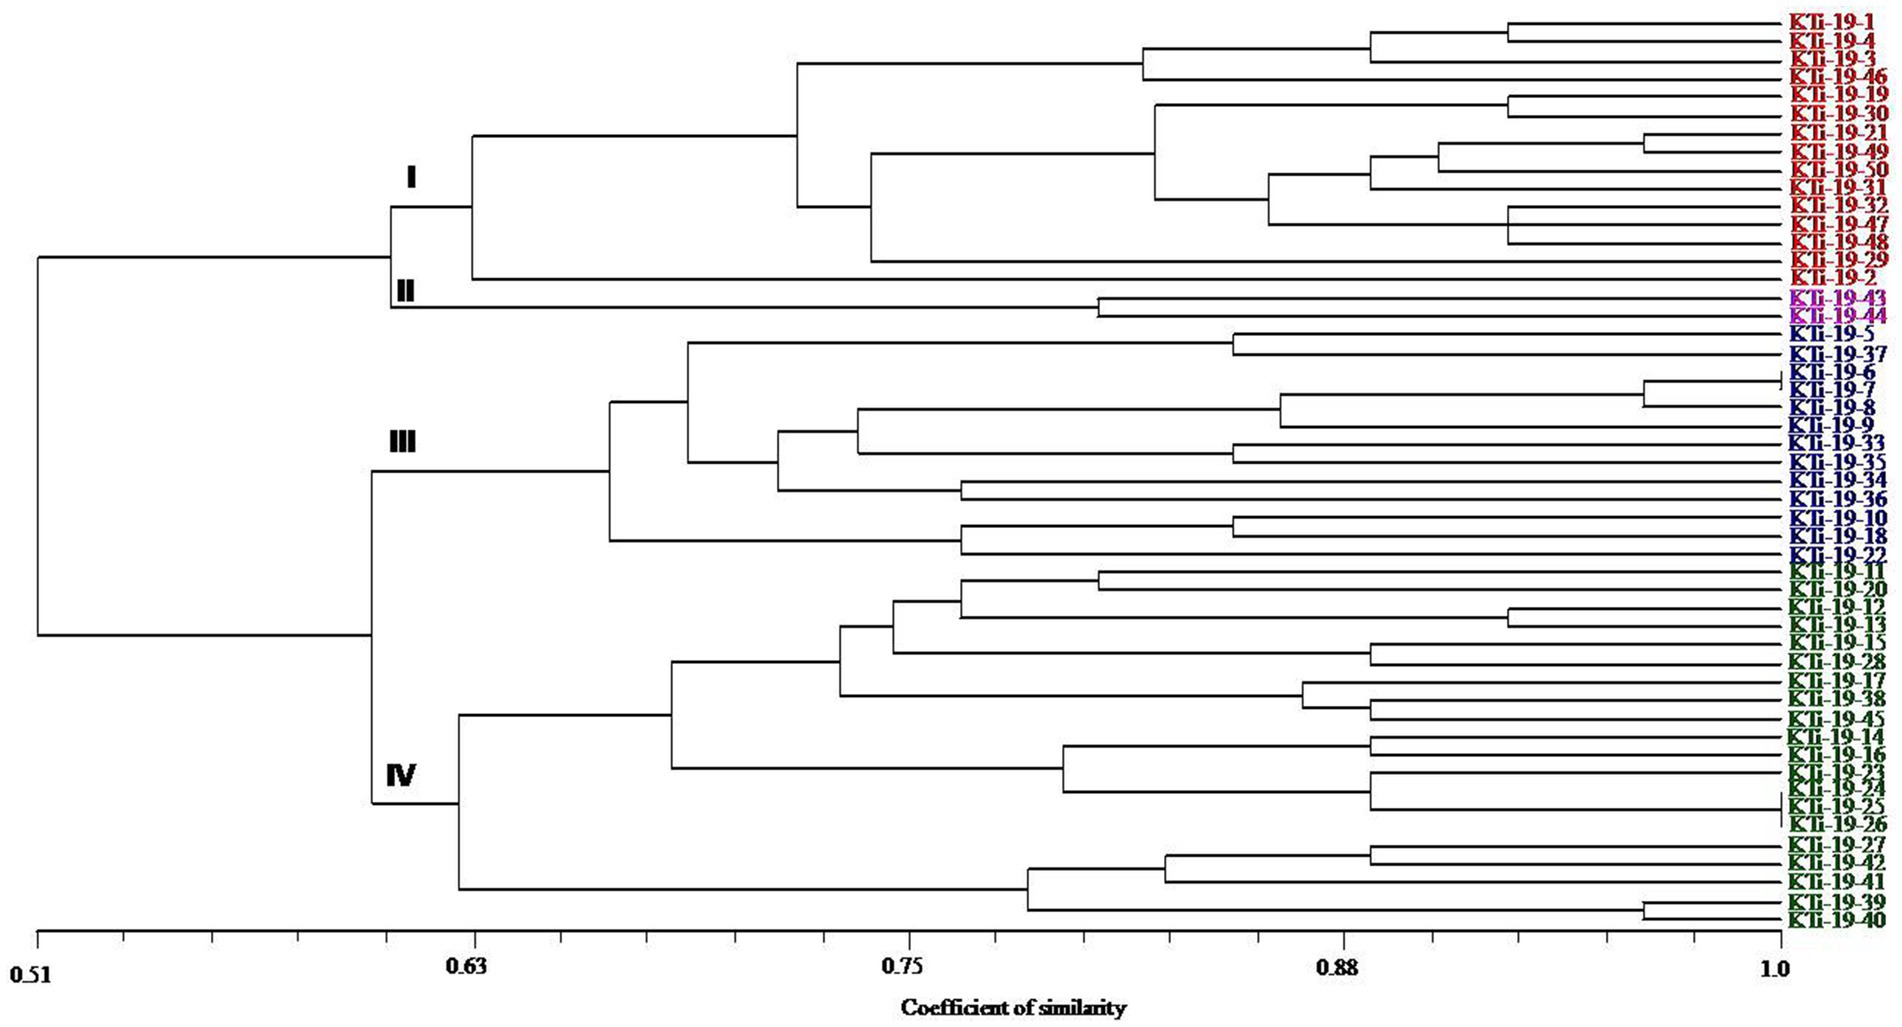
Figure 5. Dendrogram generated by adopting UPGMA clustering method among 50 isolates of Tilletia indica using 10 polymorphic microsatellite markers. The scale in the figure is genetic similarity coefficient computed according to Jaccard’s. Numbers at the nodes represent cluster groups.
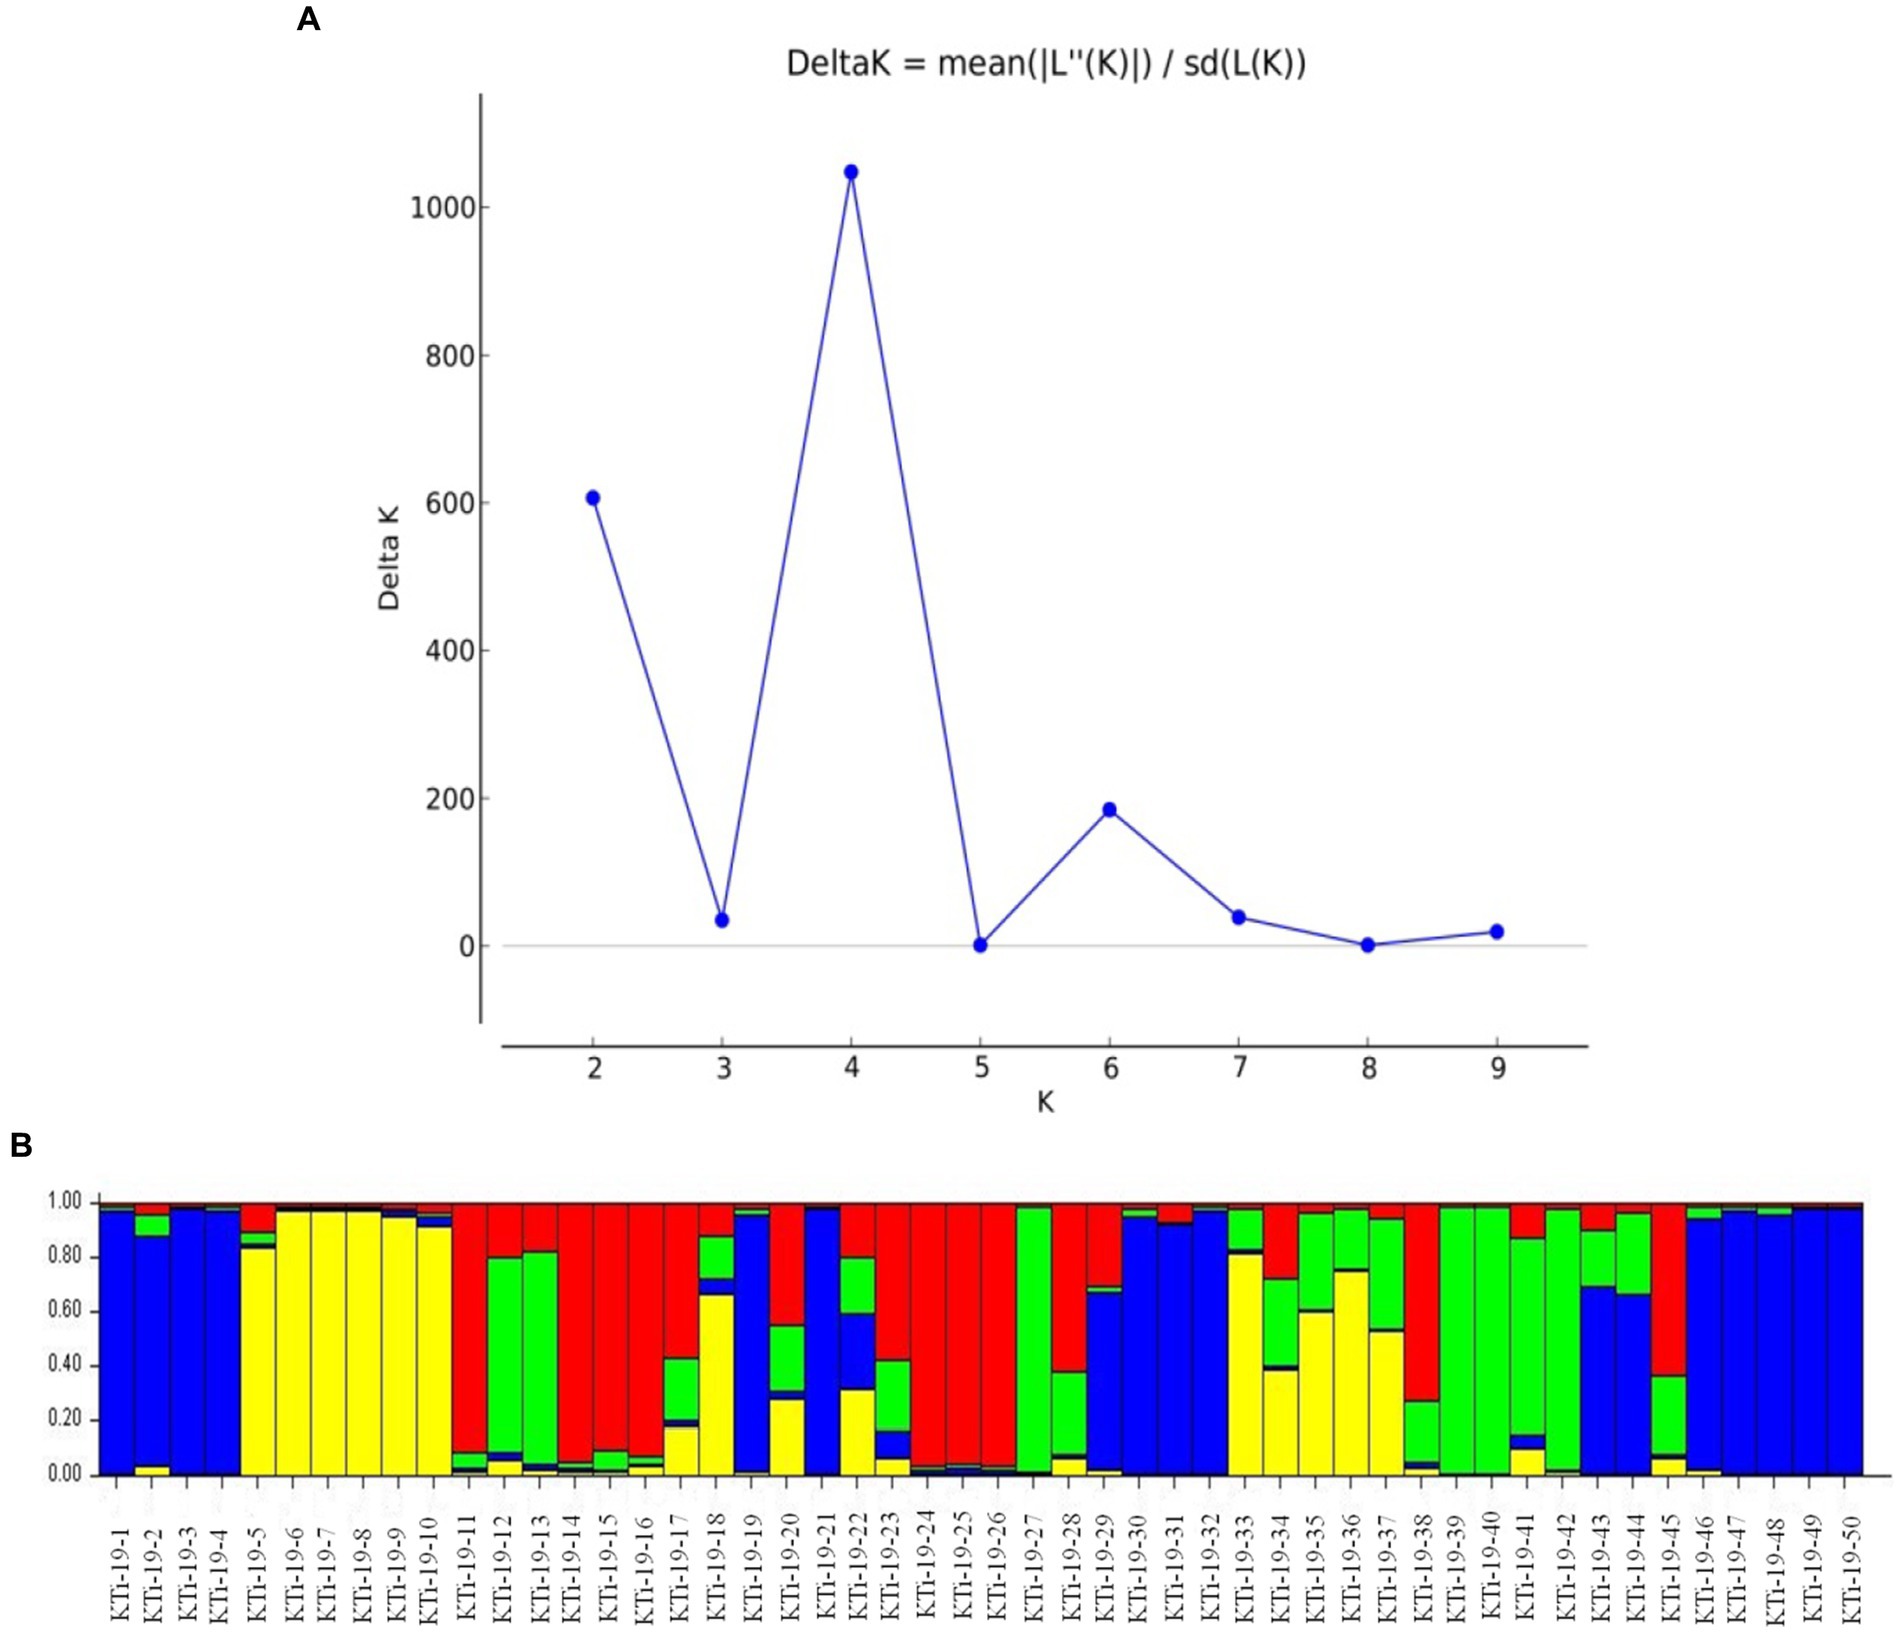
Figure 6. (A) ∆K values detected by novel polymorphic microsatellites using STRUCTURE HARVESTER software showing a clear delineation of four gene pools (K = 4) in 50 isolates of Tilletia indica; (B) Bar plot showing genetic structure of 50 Tilletia indica as revealed by STRUCTURE v2.3.3. The vertical coordinate of each subgroup indicates the membership coefficients for each isolate, and the numbers on the horizontal coordinate represent the isolates as mentioned in Table 1. Single color in each bar reveals the genetic background. Isolates with a mixture of more than one color indicate admixtures.
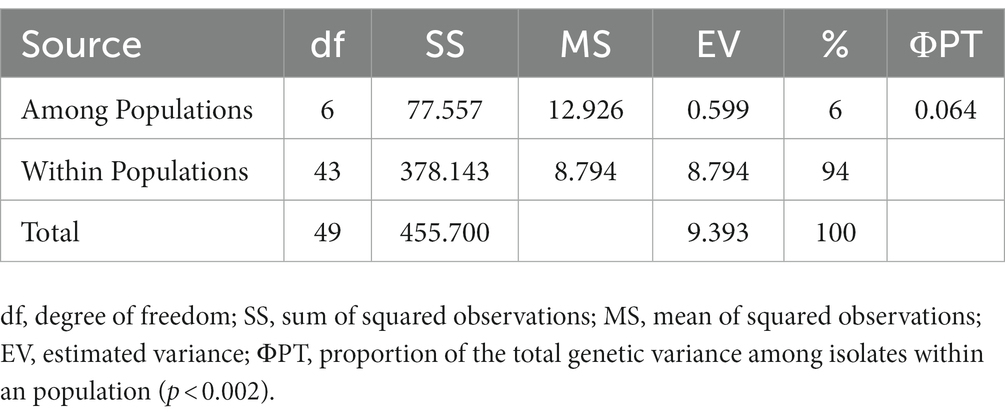
Table 6. Analysis of molecular variance (AMOVA) of Tilletia indica population.
Discussion
Karnal bunt is one of the prime quarantine fungal threats to global wheat production and is reported to cause significant grain quality and economical loss. The most effective approach to dealing with KB disease is to breed disease-resistant wheat varieties, which demand a better and deeper understanding of the T. indica fungus at the genetic level (Bishnoi et al., 2020). In India, the North Western Plain Zone is the prime hot spot for KB disease, but only limited efforts have been made to decipher T. indica diversity at the genomic level. In this connection, current research attempts to make a comparative analysis of nine T. indica genomes available in the public domain for the development of novel and neutral microsatellite markers to dissect the genetic diversity and structure of the field population of T. indica. Earlier researchers have used a series of molecular markers or typing methods to analyze the genetic variability of T. indica (Avinash et al., 2000; Seneviratne et al., 2009; Aggarwal et al., 2010; Parveen et al., 2015; Aasma et al., 2022). Unfortunately, these methods are dominant types and are unable to establish analogous reproducibility of markers across populations at the genetic level, thereby being of limited significance, especially for comparative genotyping studies (Agarwal et al., 2008; Rao et al., 2018). In recent years, researchers have shown interest in exploring the potential of microsatellite markers in unzipping the genetic variation among fungal pathogens because of their ubiquitous nature, high polymorphism, co-dominance inheritance, and high level of allelic variation within the genome (Kumar et al., 2012; Mahfooz et al., 2012; Singh et al., 2014; Kashyap et al., 2015; Rai et al., 2016). Till date, the genomes of nine isolates of T. indica (DAOMC236416, DAOMC236414, DAOMC236408, PSWKBGH_1, PSWKBGD_1_3, PSWKBGH_2, RAKB_UP_1, TiK_1, and Tik) have been decoded, and information about them is available in the public domain (see Footnote 1). This gave us an opportunity to explore these genomes for microsatellite dynamics and prevalence. It is worth mentioning here that microsatellite sequences retrieved through bioinformatics and computational modes have similar utility when compared with microsatellites derived from genomic libraries. Additionally, the negligible expenditure of in silico mining and the high profusion of microsatellites in diverse types of genome sequences put this approach at the forefront of the discovery of novel microsatellite markers for population genomic studies. Therefore, nine genomes of T. indica, viz., DAOMC236416, DAOMC236414, DAOMC236408, PSWKBGH_1, PSWKBGD_1_3, PSWKBGH_2, RAKB_UP_1, TiK_1, and Tik, were mined, and comparative analysis was done to know the distribution and dynamics pattern of microsatellite at whole genome level as well as to discover novel, neutral, and polymorphic microsatellite markers to get deep insight into the evolutionary relationship and dynamics of the T. indica population as well as for devising effective KB management strategies in wheat.
A wide spectrum of published research indicates that different taxa show distinct distribution patterns and dynamic microsatellite repeat motifs (Tautz et al., 1986; Toth et al., 2000; Wang et al., 2009). Likewise, in current research, the occurrence, abundance, and distribution of microsatellite motif repeats in nine genomes of T. indica of Canadian (e.g., DAOMC236416, DAOMC236414, and DAOMC236408) and Indian (PSWKBGH_1, PSWKBGD_1_3, PSWKBGH_2, RAKB_UP_1, TiK_1, and Tik) origin were mined. A series of research reports indicated a strong correlation between the size of the genome and microsatellite content (Karaoglu et al., 2005; Sahu et al., 2020). In contrast, no significant correlation was noticed between the total microsatellite content and the genome size in our study. Further, it was also observed that the RA of microsatellites did not uniformly exist in all nine genomes. Besides this, significant variation in the RA of each type of microsatellite motif was noticed in all the mined genomes. During comparative exploration of the T. indica genome, it was noticed that the RA and RD of microsatellites were at their maximum in the PSWKBGH_1 genome when compared with the other eight genomes. AG was a widely prevalent di-nucleotide motif repeat in all nine genomes of T. indica. Similarly, ACG/AGG was recorded as the most common tri-nucleotide motif in the genome. These observations were analogous to earlier reports where a high abundance of di-and tri-nucleotide motifs was noticed in the genomes of other organisms (Wang et al., 2009; Kumar et al., 2013; Sahu et al., 2020). We felt that these differences in densities and abundance of microsatellite motifs in T. indica could be due to the genomic organization of the isolates.
A series of published papers established the copious nature of tri-nucleotide repeats in contrast to other classes of motif in the coding regions of the genome (Kim et al., 2008; Mahfooz et al., 2012). Kashi and King (2006) mentioned that the dynamic mutations that happen in tri-nucleotide repeats influence diverse types of genetic functions. In the present research, efforts have been made to examine the microsatellite motifs presented in the T. indica genomes to get the real picture regarding the density of microsatellites in the different genomes of T. indica. The study confirmed the wide distribution of tri-nucleotide motifs in contrast to di-nucleotide motifs. Moreover, the trend of tri-nucleotide motif distribution showed conservancy across T. indica isolates. One feasible answer to these events could be selection against slippage mutations, which in turn might influence the stability and organization of the T. indica genome. It is worth mentioning here that the sequence composition of the motif type plays an important role in deciding the abundance of microsatellites in a genome. However, the sequence composition of the motif type did not illustrate conservancy across the species. The current research also established that (AG)n was the longest and most widely occurring microsatellite motif in the DAOMC236416 isolate, while in the cases of DAOMC236414, DAOMC236408, PSWKBGH_1, RAKB_UP_1, TiK_1, and Tik, (ACG)n was noticed as the most common microsatellite repeat unit. These findings also indicated that a sequence might harbor the most widely prevalent microsatellite motifs one or more times, but the total occurrence of the most frequent microsatellite motifs was different in T. indica isolates. Besides this, dissimilarity in the occurrence of polymorphic loci and the number of alleles per locus between genomic microsatellites is largely influenced by the origin of these sequences, owing to the fact that the coding region sequences are highly conserved in comparison to the non-coding region in a particular genome (Xie et al., 2018). Moreover, the size variation of alleles does not serve as a function of their repeating units. This indicates that insertions and deletions have a significant function in deciding the level of polymorphism in a genome. On parallel lines, the polymorphism pattern among the T. indica population composed of 50 different individuals has been studied. The study identified TiSSR27 and TiSSR17 as highly informative and neutral microsatellite markers for the genetic characterization of the T. indica population because of their high PIC values (0.50). The observed high level of polymorphism linked with microsatellites could be explained by replication slippage mechanisms responsible for creating SSR allelic diversity (Baird et al., 2010; Rai et al., 2016).
An ample of published literature indicates a significant amount of variation in the susceptibility of wheat cultivars to T. indica. This may be due to the high level of genetic variation among isolates with different characteristics for virulence and aggression (Mishra et al., 2001; Shakoor et al., 2015). It is important to mention here that the heterothallic nature of T. indica is the prime factor for generating continuous variation in the T. indica population (Fuentes-Davila and Duran, 1986; Thirumalaisamy et al., 2006). Hence, it becomes vital to distinguish T. indica isolates on the basis of aggressivity, which can be used for effective screening of germplasm against KB. Therefore, in the present investigation, efforts have been made to determine the aggressiveness of the 50 T. indica isolates on a set of three wheat cultivars, viz., WL711, PBW343, and WH542. The results reflected a significant level of variation in the aggressivity of T. indica isolates. The study identified 24% of isolates as HA, while 30% and 46% of isolates were LA and MA, respectively. However, no strong correlation between the aggressivity and geographical origin of T. indica isolates and their genetic diversity was established. This means that T. indica isolates contain huge variation in terms of aggressivity in different wheat-growing sites in North India. Additionally, the occurrence of highly aggressive isolates of T. indica in Haryana, Rajasthan, Punjab, Uttar Pradesh, Uttarakhand, Jammu, and Himachal Pradesh also supported the movement of fungus from one region to another through seed or air. Similar results pertaining to the absence of region-specific virulence variability were also reported by Aasma et al. (2022).
Genetic variability and virulence potential of T. indica isolates were reported by earlier workers (Datta et al., 2000; Goates and Jackson, 2006; Parveen et al., 2013; Aasma et al., 2022). In the current study, DNA amplification with ten polymorphic microsatellite markers generated distinct amplicons that were therefore utilized as typing markers to characterize T. indica isolates derived from distinct geographical locations. These markers reveal the presence of a significant level of variation (94%) among the collected isolates at the genetic level. Although a flood of information pertaining to the assessment of the reaction of wheat germplasm to natural infection with KB is available (Kaur and Kaur, 2005; Riccioni et al., 2008; Aasma et al., 2022), limited research efforts were made to determine the variability of the large pool of T. indica isolates in terms of aggressiveness. Therefore, in the current study, a research plan was executed with the aim of capturing the real situation regarding the aggressivity of T. indica isolate prevalence in different wheat growing sites in the northern part of India. The outcome of the study clearly indicates robust genetic diversity among T. indica populations collected from seven Indian localities (Rajasthan, Haryana, Punjab, Uttar Pradesh, Uttarakhand, Jammu and Himachal Pradesh), where isolates of all three virulence categories existed. The significant effect of isolates and cultivars noticed in the current study further indicated that the pathogenic variation in T. indica isolates could be the outcome of gene-to-gene interaction dependent on isolate-host compassion, as documented by previous researchers (Datta et al., 2000; Ullah et al., 2012). However, an in-depth understanding of localized pathogenicity and genetic variability with a large pool of KB isolates is highly warranted with reported natural and novel polymorphic markers for developing sustainable and integrated modules for disease management and effective wheat breeding programs in the near future.
Data availability statement
The datasets presented in this study can be found in online repositories. The names of the repository/repositories and accession number(s) can be found at: https://www.ncbi.nlm.nih.gov/, https://www.ncbi.nlm.nih.gov/genome/browse/#!/eukaryotes/8345/.
Author contributions
The work was conceived and designed by PK and SK. The sampling survey was performed by PK, SK, PJ, and RK. Experiments were conducted by PK, RK, and AS. Field experiments, KB inoculations and data recording were conducted by PK, K, and SK. Bioinformatics and statistical data analysis was done by AK and K. The manuscript was drafted by PK. The final editing and proofing of manuscript was done by PJ, SK, and GS. All authors contributed to the article and approved the submitted version.
Acknowledgments
We are grateful to ICAR-National Bureau of Agriculturally Important Microorganisms (NBAIM) for providing necessary financial support under AMAAS project on Development of diagnostic tools for detection of Karnal bunt and loose smut of wheat (Project Code 1002588).
Conflict of interest
The authors declare that the research was conducted in the absence of any commercial or financial relationships that could be construed as a potential conflict of interest.
Publisher’s note
All claims expressed in this article are solely those of the authors and do not necessarily represent those of their affiliated organizations, or those of the publisher, the editors and the reviewers. Any product that may be evaluated in this article, or claim that may be made by its manufacturer, is not guaranteed or endorsed by the publisher.
Supplementary material
The Supplementary material for this article can be found online at: https://www.frontiersin.org/articles/10.3389/fmicb.2023.1227750/full#supplementary-material
Footnotes
References
Aasma, S., Fayyaz, M., Majeed, K., Rehman Au Ali, S., Liu, J., Rasheed, A., et al. (2022). Genetic variability and aggressiveness of Tilletia indica isolates causing Karnal bunt in wheat. J. Fungi. 8:219. doi: 10.3390/jof8030219
Agarwal, M., Shrivastava, N., and Padh, H. (2008). Advances in molecular marker techniques and their applications in plant sciences. Plant Cell Rep. 27, 617–631. doi: 10.1007/s00299-008-0507-z
Aggarwal, R., Tripathi, A., and Yadav, A. (2010). Pathogenic and genetic variability in Tilletia indica monosporidial culture lines using universal rice primer-PCR. Eur. J. Plant Pathol. 128, 333–342. doi: 10.1007/s10658-010-9655-4
Aujla, S. S., Sharma, I., and Singh, B. B. (1989). Rating scale for identifying wheat varieties resistant to Neovossia indica (Mitra) Mundkur. Indian Phytopathol. 42, 161–162.
Avinash, M., Anil, K., Garg, G. K., and Indu, S. (2000). Determination of genetic variability among isolates of Tilletia indica using random amplified polymorphic DNA analysis. Plant Cell Biotechnol. Mol. Biol. 1, 29–36. doi: 10.1007/s11046-010-9308-3
Baird, R. E., Wadl, P. A., Allen, T., McNeill, D., Wang, X., Moulton, J. K., et al. (2010). Variability of United States isolates of Macrophomina phaseolina based on simple sequence repeats and cross genus transferability to related genera within botryosphaeriaceae. Mycopathologia 170, 169–180. doi: 10.1007/s11046-010-9308-3
Bala, R., Kaur, J., Tak, P. S., Sandhu, S. K., and Pannu, P. P. S. (2022). A model for Tilletia indica (Karnal bunt)—Triticum aestivum (Wheat) system under changing environmental conditions. Indian Phytopathol. 75, 723–730. doi: 10.1007/s42360-022-00520-w
Bishnoi, S. K., He, X., Phuke, R. M., Kashyap, P. L., Alakonya, A., Chhokar, V., et al. (2020). Karnal Bunt: A re-emerging old foe of wheat. Front. Plant Sci. 11:569057. doi: 10.3389/fpls.2020.569057
Bishnoi, S. K., Kumar, S., and Singh, G. P. (2021). The re-emerging Karnal bunt disease of wheat and preparedness of the global wheat sector. Curr. Sci. 120, 1814–1817.
Bonde, M. R., Peterson, G. L., Aujla, S. S., Nanda, G. S., and Phillips, J. G. (1996). Comparison of the virulence of isolates of Tilletia indica, causal agent of Karnal bunt of wheat, from India, Pakistan, and Mexico. Plant Dis. 8, 1071–1074.
Botstein, D., White, R. L., Skalnick, M. H., and Davies, R. W. (1980). Construction of a genetic linkage map in man using restriction fragment length polymorphism. Am. J. Hum. Genet. 32:314–331.
Choudhary, P., Kashyap, P. L., Goswami, S. K., Chakdar, H., Srivastava, A. K., and Saxena, A. K. (2018). Genome-wide analysis of microsatellites in Alternaria arborescens and elucidation of the function of polyketide synthase (PksJ). Interdiscip. Sci. Comput. Life. Sci. 10, 813–822. doi: 10.1007/s12539-017-0251-6
Datta, R., Rajebhosale, M. D., Dhaliwal, H. S., Singh, H., Ranjekar, P. K., and Gupta, V. S. (2000). Intraspecific genetic variability analysis of Neovossia indica causing Karnal bunt of wheat using repetitive elements. Theor. Appl. Genet. 100, 569–575. doi: 10.1007/s001220050075
Duhan, N., Kataria, R., and Kaundal, R. (2022). TriTikBdb: A Functional Annotation Resource for Deciphering the Complete Interaction Networks in Wheat-Karnal Bunt Pathosystem. Int. J. Mol. Sci. 23:7455. doi: 10.3390/ijms23137455
Du, L., Zhang, C., Liu, Q., Zhang, X., and Yue, B. (2018). Krait: an ultrafast tool for genome-wide survey of microsatellites and primer design. Bioinformatics 34, 681–683. doi: 10.1093/bioinformatics/btx665
Emebiri, L., Hildebrand, S., Tan, M. K., Juliana, P., Singh, P. K., Fuentes-Davila, G., et al. (2021). Pre-emptive Breeding against Karnal Bunt Infection in Common Wheat: Combining Genomic and Agronomic Information to Identify Suitable Parents. Front. Plant Sci. 12:675859. doi: 10.3389/fpls.2021.675859
Evanno, G., Regnaut, S., and Goudet, J. (2005). Detecting the number of clusters of individuals using the software STRUCTURE: a simulation study. Mol. Ecol. 14, 2611–2620. doi: 10.1111/j.1365-294X.2005.02553.x
Fuentes-Davila, G., and Duran, R. (1986). Tilletia indica: Cytology and teliospore formation in vitro and in immature kernels. Canad. J. Bot. 8, 1712–1719. doi: 10.1139/b86-229
Goates, B. J., and Jackson, E. W. (2006). Susceptibility of wheat to Tilletia indica during stages of spike development. Phytopathology 96, 962–966. doi: 10.1094/PHYTO-96-0962
Goswami, S. K., Singh, V., and Kashyap, P. L. (2017). Population genetic structure of Rhizoctonia solani AG1IA from rice field in North India. Phytoparasitica 45, 299–316. doi: 10.1007/s12600-017-0600-3
Gupta, P. K., Gogoi, R., and Gharde, Y. (2015). Cultural and morphological variabilities of Tilletia indica, causal agent of Karnal bunt of wheat. Ann. Pl. Protec. Sci. 23, 323–327.
Gupta, P. K., Gogoi, R., Gharde, Y., and Bisen, S. (2017). Pathogenic variability in Indian isolates of Tilletia indica causing Karnal bunt of wheat. J. Plant Dis. Sci. 12, 176–186.
Gurjar, M. S., Jain, P., Jain, S., Kumar, N., Saharan, M. S., and Aggarwal, R. (2022). Identifcation and validation of simple sequence repeats markers in Tilletia indica and compatibility assay of monosporidial lines. Indian Phytopathology 75, 357–366. doi: 10.1007/s42360-022-00467-y
Gurjar, M. S., Mohan, M. H., Singh, J., Saharan, M. S., and Aggarwal, R. (2021). Tilletia indica: biology, variability, detection, genomics and future perspective. Indian Phytopathol. 74, 21–31. doi: 10.1007/s42360-021-00319-1
Iquebal, M. A., Mishra, P., Maurya, R., Jaiswal, S., Rai, A., and Kumar, D. (2021). Centenary of Soil and Air Borne Wheat Karnal Bunt Disease Research: A Review. Biology 10:1152. doi: 10.3390/biology10111152
Jiménez-Becerril, M. F., Hernández-Delgado, S., Solís-Oba, M., and González Prieto, J. M. (2018). Analysis of mitochondrial genetic diversity of Ustilago maydis in Mexico. Mitochondrial DNA A DNA Mapp. Seq. Anal. 29, 1–8. doi: 10.1080/24701394.2016.1229776
Karaoglu, H., Lee, C. M., and Meyer, W. (2005). Survey of simple sequence repeats in completed fungal genomes. Mol. Biol. Evol. 22, 639–649. doi: 10.1093/molbev/msi057
Kashi, Y., and King, D. G. (2006). Simple sequence repeats as advantageous mutators in evolution. Trends Genet. 22, 253–259. doi: 10.1016/j.tig.2006.03.005
Kashyap, P. L., Gupta, V., Gupta, O. P., Sendhil, R., Gopalareddy, K., Jasrotia, P., et al. (2022). New Horizons in Wheat and Barley Research: Crop Protection and Resource Management. Springer. Nature 1:637. doi: 10.1007/978-981-16-4134-3
Kashyap, P. L., and Kaur, S., Pannu, P. P. S. (2019a). Expression analysis of pathogenesis related proteins induced by compatible and incompatible interactions of Tilletia indica in wheat plants. J. Mycol. Pl. Pathol. 49, 39–47.
Kashyap, P. L., Kaur, S., and Pannu, P. P. S. (2018). Induction of systemic tolerance to Tilletia indica in wheat by plant defence activators. Arch. Phytopathol. Plant Prot. 51, 1–13. doi: 10.1080/03235408.2018.1438778
Kashyap, P. L., Kaur, S., Sanghera, G. S., Kang, S. S., and Pannu, P. P. S. (2011). Novel methods for quarantine detection of Karnal bunt (Tilletia indica) of wheat. Elixir Agri. 31, 1873–1876.
Kashyap, P. L., Kumar, S., Kumar, R. S., Tripathi, R., Sharma, P., Sharma, A., et al. (2020). Identification of novel microsatellite markers to assess the population structure and genetic differentiation of Ustilago hordei causing covered smut of barley. Front. Microbiol. 10:2929. doi: 10.3389/fmicb.2019.02929
Kashyap, P. L., Kumar, S., Tripathi, R., Kumar, R. S., Jasrotia, P., Singh, D. P., et al. (2019b). Phylogeography and population structure analysis reveals diversity by gene flow and mutation in Ustilago segetum (Pers.) Roussel tritici causing loose smut of wheat. Front. Microbiol. 10:1072. doi: 10.3389/fmicb.2019.01072
Kashyap, P. L., Rai, S., Kumar, S., Srivastava, A. K., Anandaraj, M., and Sharma, A. K. (2015). Mating type genes and genetic markers to decipher intraspecific variability among Fusarium udum isolates from pigeonpea. J. Basic Microbiol. 55, 846–856. doi: 10.1002/jobm.201400483
Kaur, G., and Kaur, S. (2005). Simulating natural infection of wheat ovaries with Tilletia indica and interaction with date of sowing and varieties. Crop. Improv. 32, 26–34.
Kaur, M., Singh, R., Mandhan, R. L., and Sharma, I. (2015). In silico mining of microsatellites in Ustilago maydis and their cross transferability to the Karnal Bunt pathogen Tilletia indica for polymorphism. Int. J. Microbiol. Res. 7, 679–682.
Kim, T. S., Booth, J. G., Gauch, H. G. Jr., Sun, Q., Park, J., Lee, Y. H., et al. (2008). Simple sequence repeats in Neurospora crassa: distribution, polymorphism and evolutionary inference. BMC Genomics 9:31. doi: 10.1186/1471-2164-9-31
Kumar, A., Pandey, V., Singh, M., Pandey, D., Saharan, M. S., and Marla, S. S. (2017). Draft genome sequence of Karnal bunt pathogen (Tilletia indica) of wheat provides insights into the pathogenic mechanisms of quarantined fungus. PLoS One 12:e0171323. doi: 10.1371/journal.pone.0171323
Kumar, J., Saharan, M. S., Sharma, A. K., Sharma, S., Somvir, T. R., and Nagarajan, S. (2004). Pathogenic and molecular variation among Indian isolates of causing Tilletia indica Karnal bunt of wheat. Indian Phytopath. 57, 144–149.
Kumar, S., Maurya, D., Rai, S., Kashyap, P. L., and Srivastava, A. K. (2012). Computational mining and genome wide distribution of microsatellite in Fusarium oxysporum f. sp. lycopersici. Not. Sci. Biol. 4, 127–131. doi: 10.15835/nsb448271
Kumar, S., Rai, S., Maurya, D. K., Kashyap, P. L., Srivastava, A. K., and Anandaraj, M. (2013). Cross-species transferability of microsatellite markers from Fusarium oxysporum for the assessment of genetic diversity in Fusarium udum. Phytoparasitica 41, 615–622. doi: 10.1007/s12600-013-0324-y
Mahfooz, S., Maurya, D. K., Srivastava, A. K., Kumar, S., and Arora, D. K. (2012). A comparative in silico analysis on frequency and distribution of microsatellites in coding regions of three formae speciales of Fusarium oxysporum and development of EST-SSR markers for polymorphism studies. FEMS Microbiol. Lett. 328, 54–60. doi: 10.1111/j.1574-6968.2011.02483.x
Mishra, A., Kumar, A., Garg, G. K., and Sharma, I. (2001). Determination of genetic variability among isolates of T. indica using random amplified polymorphic DNA analysis. Plant Cell Biotechnol. Mol. Biol. 1, 29–36.
Mitra, M. (1931). A new bunt on wheat in India. Ann. Appl. Biol. 18, 178–179. doi: 10.1111/j.1744-7348.1931.tb02294.x
Pandey, V., Gupta, A. K., Singh, M., Pandey, D., and Kumar, A. (2019). Complementary proteomics, genomics approaches identifies potential pathogenicity/virulence factors in Tilletia indica induced under the influence of host factor. Sci. Rep. 9:553. doi: 10.1038/s41598-018-37810-1
Pandey, V., Singh, M., Pandey, D., Marla, S., and Kumar, A. (2018). Secretome analysis identifies potential pathogenicity/virulence factors of Tilletia indica, a quarantined fungal pathogen inciting Karnal bunt disease in wheat. Proteomics 18:e1700473. doi: 10.1002/pmic.201700473
Pannu, P. P. S., and Chahal, S. S. (2000). Variability in Tilletia indica the incident of Karnal bunt of wheat. Indian Phytopath. 53, 279–282.
Parveen, S., Saharan, M. S., Verma, A., and Sharma, I. (2013). Comparative analysis of RAPD and ISSR marker assays for detecting genetic polymorphism in Tilletia indica. Europ. J. Exp. Biol. 3, 380–387.
Parveen, S., Saharan, M. S., Verma, A., and Sharma, I. (2015). Pathogenic variability among Tilletia indica isolates and distribution of heterothallic alleles in the Northwestern Plains Zone of India. Turk. J. Agric. For. 39:8. doi: 10.3906/tar-1401-143
Peakall, R., and Smouse, P. E. (2012). Gen AlEx 6.5: genetic analysis in Excel. Population genetic software for teaching and research--an update. Bioinformatics 28, 2537–2539. doi: 10.1093/bioinformatics/bts460
Prasad, P., Bhardwaj, S. C., Savadi, S., Kashyap, P. L., Gangwa, R. O. P., Khan, H., et al. (2018). Population distribution and differentiation of Puccinia graminis tritici detected in the Indian subcontinent during 2009–2015. Crop Prot. 108, 128–136. doi: 10.1016/j.cropro.2018.02.021
Pritchard, J. K., Stephens, M., and Donnelly, P. (2000). Inference of population structure using multilocus genotype data. Genetics 155, 945–959.
Rai, S., Kashyap, P. L., Kumar, S., Srivastava, A. K., and Ramteke, P. W. (2016). Comparative analysis of microsatellites in five different antagonistic Trichoderma species for diversity assessment. World J. Microbiol. Biotechnol. 32:8. doi: 10.1007/s11274-015-1964-5
Rao, S., Sharda, S., Oddi, V., and Nandineni, M. R. (2018). The landscape of repetitive elements in the refined genome of chilli anthracnose fungus Colletotrichum truncatum. Front. Microbiol. 9:2367. doi: 10.3389/fmicb.2018.02367
Riccioni, L., Inman, A., Magnus, H. A., Valvassori, M., Porta-Puglia, A., Conca, G., et al. (2008). Susceptibility of European bread and durum wheat cultivars to Tilletia indica. Plant Pathol. 57, 612–622. doi: 10.1111/j.1365-3059.2008.01830.x
Rohlf, F. J. (2002). “Geometric morphometrics and phylogeny” in Morphology, Shape and Phylogeny. ed. P. L. Forey (Boca Raton, FL: CRC Press), 175–193.
Rush, C. M., Stein, J. M., Bowden, R. L., Riemenschneider, R., Boratynski, T., and Royer, M. H. (2005). Status of Karnal Bunt of Wheat in the United States 1996 to 2004. Plant Dis. 89, 212–223. doi: 10.1094/PD-89-0212
Sahu, B. P., Majee, P., Singh, R. R., Sahoo, A., and Nayak, D. (2020). Comparative analysis, distribution, and characterization of microsatellites in Orf virus genome. Sci. Rep. 10:13852. doi: 10.1038/s41598-020-70634-6
Sansford, C. E., Baker, R. H. A., and Brennan, J. P. (2008). The new pest risk analysis for Tilletia indica, the cause of Karnal bunt of wheat, continues to support the quarantine status of the pathogen in Europe. Eur. Plant Pathol. 57, 603–661. doi: 10.1111/j.1365-3059.2008.01825.x
Savadi, S. P., Prasad, B., Bhardwaj, S. C., Rathore, R., Sharma, K., Lal Kashyap, P., et al. (2020). Development and characterization of novel microsatellite markers in Puccinia striiformis f. sp. tritici and their transferability in Puccinia species. J. Phytopathol. 168, 120–128. doi: 10.1111/jph.12876
Sekhon, K. S., Saxena, A. K., Randhawa, S. K., and Gill, K. S. (1980). Effect of Karnal bunt disease on quality characteristics of wheat. Bull. Grain Tech. 18, 208–212.
Seneviratne, J. M., Gupta, A., Pandey, D., Sharma, I., and Kumar, A. (2009). Determination of genetic divergence based on DNA markers amongst monosporidial strains derived from fungal isolates from Karnal bunt (Tilletia indica) of wheat. Plant Pathol. J. 25, 303–316. doi: 10.5423/PPJ.2009.25.4.303
Shakoor, M. A., Ahmad, M., Shahid, M. R., and Hussain, M. (2015). Screening of advanced lines and commercial varieties of wheat against Karnal bunt disease. Int. J. Adv. Res. Biol. Sci. 2, 1–6.
Sharma, P., Chauhan, R., Pande, V., Basu, T., Rajesh,, and Kumar, A. (2022). Rapid sensing of Tilletia indica-teliospore in wheat extract by a piezoelectric label free immunosensor. Bioelectrochemistry 147:108175. doi: 10.1016/j.bioelechem.2022.108175
Sharma, P., Pandey, B., Muthusamy, S. K., Kumar, S., Saharan, M. S., Kumar, S., et al. (2018). Development and validation of microsatellite markers for Karnal bunt (Tilletia indica) and loose smut (Ustilago segetum tritici) of wheat from related fungal species. J. Phytopathol. 166, 729–738. doi: 10.1111/jph.12756
Sharma, S. K., Singh, D. V., Aggarwal, R., and Srivastava, K. D. (2002). Pathogenic and biochemical variations in Neovossia indica. Indian Phytopathol. 55, 133–139.
Singh, D. V., and Gogoi, R. (2011). Karnal bunt of wheat (Triticum sp.): A global scenario. Indian J. Agr. Sci. 81, 3–14.
Singh, R., Kumar, S., Kashyap, P. L., Srivastava, A. K., Mishra, S., and Sharma, A. K. (2014). Identification and characterization of microsatellite from Alternaria brassicicola to assess cross-species transferability and utility as a diagnostic marker. Mol. Biotechnol. 56, 1049–1059. doi: 10.1007/s12033-014-9784-7
Tautz, D., Trick, M., and Dover, G. (1986). Cryptic simplicity in DNA is a major source of genetic variation. Nature 322, 652–656. doi: 10.1038/322652a0
Thirumalaisamy, P. P., and Singh, D. V. (2012). Variability of Indian isolates of Tilletia indica assessed by pathogenicity and molecular markers. J. Phytopathol. 160, 525–531. doi: 10.1111/j.1439-0434.2012.01940.x
Thirumalaisamy, P. P., Singh, D. V., Aggarwal, R., and Srivastava, K. D. (2006). Pathogenic variability in Tilletia indica, the causal agent of Karnal bunt of wheat. Indian Phytopath. 59, 22–26.
Toth, G., Gaspari, Z., and Jurka, J. (2000). Microsatellites in different eukaryotic genomes: survey and analysis. Genome Res. 10, 967–981. doi: 10.1101/gr.10.7.967
Ullah, H. M. Z., Haque, M. I., Rauf, C. A., Akhtar, L. H., and Munir, M. (2012). Comparative virulence in isolates of T. indica and host resistance against Karnal bunt of wheat. J. Anim. Plant Sci. 22, 467–472. doi: 10.5423/PPJ.2009.25.4.303
Wang, S., Zhang, L., and Matz, M. (2009). Microsatellite characterization and marker development from public EST and WGS databases in the reef-building coral Acropora millepora (Cnidaria, Anthozoa, Scleractinia). J. Hered. 100, 329–337. doi: 10.1093/jhered/esn100
Warham, E. (1986). Karnal bunt disease of wheat: a literature review. Trop. Pest Manag. 32, 229–242. doi: 10.1080/09670878609371068
Xie, J., Qian, K., Si, J., Xiao, L., Ci, D., and Zhang, D. (2018). Conserved noncoding sequences conserve biological networks and influence genome evolution. Heredity 120, 437–451. doi: 10.1038/s41437-018-0055-4
Zhang, M., Chen, Y., Yuan, J., and Meng, Q. (2015). Development of genomic SSR markers and analysis of genetic diversity of 40 haploid isolates of Ustilago maydis in China. Int. J. Agric. Biol. 17, 369–374.
Keywords: aggressiveness, genome, Karnal bunt, microsatellite, population structure, structure, Tilletia indica
Citation: Kashyap PL, Kumar S, Kumar RS, Sharma A, Khanna A, Kajal Raj S, Jasrotia P and Singh G (2023) Comparative analysis of nine Tilletia indica genomes for the development of novel microsatellite markers for genetic diversity and population structure analysis. Front. Microbiol. 14:1227750. doi: 10.3389/fmicb.2023.1227750
Edited by:
Rajarshi Kumar Gaur, Deen Dayal Upadhyay Gorakhpur University, IndiaReviewed by:
Canan Can, University of Gaziantep, TürkiyeBasavantraya N. Devanna, National Rice Research Institute (ICAR), India
Copyright © 2023 Kashyap, Kumar, Kumar, Sharma, Khanna, Kajal, Raj, Jasrotia and Singh. This is an open-access article distributed under the terms of the Creative Commons Attribution License (CC BY). The use, distribution or reproduction in other forums is permitted, provided the original author(s) and the copyright owner(s) are credited and that the original publication in this journal is cited, in accordance with accepted academic practice. No use, distribution or reproduction is permitted which does not comply with these terms.
*Correspondence: Prem Lal Kashyap, UHJlbS5LYXNoeWFwQGljYXIuZ292Lmlu; cGxrYXNoeWFwQGdtYWlsLmNvbQ==; Sudheer Kumar, U3VkaGVlci5LdW1hckBpY2FyLmdvdi5pbg==; c3VkaGVlci5pY2FyQGdtYWlsLmNvbQ==;; Annie Khanna, YW5uaWVraGFubmFhbm5pZUBnbWFpbC5jb20=