- 1Laboratory of Forage Comprehensive Utilization, College of Animal Science and Technology, Shihezi University, Shihezi, China
- 2Tumushuke Tuxing Animal Husbandry Co., Ltd., Tumushuke, China
- 3Nileke County's Animal Husbandry and Veterinary Development Center of Yili Prefecture, Nileke, China
- 4Animal Nutrition Institute, Sichuan Agricultural University, Chengdu, China
Background: Cotton straw is a widely available agricultural by-product in Xinjiang, China, but its utilization as livestock feed is hindered by challenges such as high fiber content and the presence of toxic free gossypol, which can negatively impact animal health and feed digestibility. Urea addition in feed fermentation has shown potential in improving feed quality by providing a nitrogen source for microorganisms, promoting fiber degradation, and increasing the content of crude protein. However, the optimal urea addition level for cotton straw fermentation remains unclear. The objective of this study was to explore the effects of urea addition on the fermentation quality, nitrogen fractions, bacterial community, and metabolic characteristics of cotton strawlage. The experiment included a control group with 0 % urea added (U0), a 0.1% urea group (U1, 1 g/kg fresh matter), a 0.2% urea group (U2, 2 g/kg fresh matter), and a 0.4% urea group (U3 4 g/kg fresh matter). After 45 days of fermentation, samples of the strawlage were collected and analyzed for their chemical composition, fermentation quality, nitrogen fractions, bacterial community, and metabolic characteristics.
Result: Compared to the U0 group, the U3 group significantly increased total nitrogen (TN), non-protein nitrogen (NPN), acetic acid, and propionic acid contents by 17.93%, 0.08%, 13.26%, and 0.01%, respectively, while significantly reducing free gossypol and non-structural nitrogen (NSN) levels by 48.50% and 14.22%, respectively, thereby optimizing the protein composition of cotton straw. Furthermore, the U1 and U2 groups exhibited significant downregulation of metabolites associated with amino acid and energy metabolism pathways, such as L-arginine, L-proline, L-ornithine, and 2-Oxoglutaric acid, compared to the U0 group.
Conclusion: The addition of urea significantly altered the fermentation quality, nitrogen fraction composition, microbial community composition, and metabolic profiles of cotton straw.
1 Introduction
Cotton serves as a globally significant source of natural textile fibers and oil crops (Lee et al., 2007; Zaidi et al., 2020; Jan et al., 2022). Xinjiang, China, has emerged as the country's leading cotton-producing region, thanks to its unique geographical and climatic conditions, including a vast land area, prolonged sunshine duration, an arid climate, and marked diurnal temperature variations. According to statistical data from the National Bureau of Statistics Announcement on Cotton Production, 2022, Xinjiang's cotton planting area reached 2.5 million hectares, yielding 5.391 million tons of cotton, which accounted for over 90% of China's total production (National Bureau of Statistics Announcement on Cotton Production, 2022). Based on the straw-to-grain ratio model proposed by Cai et al. (2024) (assuming a cotton straw-to-cotton ratio of 5:1), the theoretical annual cotton straw production in Xinjiang was ~26.955 million tons. The nutritional composition varies significantly among different cotton straw tissues (roots, stems, leaves) (Zhang et al., 2018), with whole-plant averages of 6.41% crude protein, 34.76% cellulose, 15.58% hemicellulose, 10.29% lignin, and 23.34 MJ/kg of gross energy. Leaves and boll shells, which have relatively higher nutrient contents, show potential as ruminant feed resources (Gong, 2007; Zhang et al., 2018). However, their feed utilization is severely constrained by high crude fiber content (with neutral detergent fiber at 65.42%) and toxic free gossypol levels (ranging from 0.02% to 0.2%).
Urea, an odorless, tasteless, deliquescent white crystalline granular substance with a high nitrogen content of 46.6% and low cost, is widely used as a feed additive in ruminant husbandry. Studies have demonstrated that urea supplementation can significantly reduce neutral detergent fiber content in silage, while simultaneously increasing organic acid content and aerobic stability (Fu, 2014; Tan et al., 2014). This technology not only effectively mitigates the risks of ammonia poisoning associated with direct urea feeding but it also enhances the crude protein content through microbial transformation, improving feed intake and dry matter digestibility (Cairang et al., 2014; Costa et al., 2020).
The Cornell Net Carbohydrate and Protein System (CNCPS), developed by Cornell University, provides a precise framework for evaluating feed nutritional value by classifying nutrients based on animal digestion characteristics (Wang X. G. et al., 2024). Although previous research confirmed urea's role in increasing crude protein content in fermented feeds (Costa et al., 2020), a systematic understanding of its effects on nitrogen fraction composition and microbial regulatory mechanisms remains limited. This study applied a simplified nitrogen fractionation approach within the CNCPS framework, combined with 16S rRNA sequencing and untargeted metabolomics, to investigate the effects of urea supplementation on nitrogen nutrition transformation in cotton straw. The findings aim to provide theoretical support for the efficient utilization of cotton straw resources.
2 Materials and methods
2.1 Cotton straw preparation
Cotton straw (the variety was Xinluzao No.84) were harvested on October 3, 2023, in Liangzhouhu Town, Manas County, Changji Prefecture, Xinjiang (43°28′-45°38′N, 85°34′-86°43′E). The cotton straw used for ensiling strawlage were chopped into 1–2 cm pieces using a forage crusher. The compound fermented bacterial liquid and molasses were purchased from Shihezi Dongke Animal Husbandry Technology Co., Ltd., China.
A single-factor experimental design was employed in this study, with four treatment groups established: (1) U0 (no urea added); (2) U1 (0.1% urea added); (3) U2 (0.2% urea added); (4) U3 (0.4% urea added). For each treatment, 1% of microbial liquid (Lactobacillus plantarum ≥ 1.5 × 10⁶ CFU/mL, Candida utilis ≥ 3.0 × 10⁵ CFU/mL, Saccharomyces cerevisiae ≥ 1.0 × 10⁶ CFU/mL, Candida tropicalis ≥ 1.2 × 10⁵ CFU/mL, Bacillus subtilis ≥ 2.0 × 10⁶ CFU/mL, Geotrichum candidum ≥ 1.0 × 10⁴ CFU/mL, D-FGP strain ≥ 5 × 10⁴ CFU/mL, D-CF strain ≥ 3.0 × 10⁵ CFU/mL) were added as inoculum and 5% molasses (based on fresh weight, FW) were added as energy source for microbes. Then the distilled water was added to adjust the moisture content to ~65% (FW). After mixing thoroughly, 500 g of the treated straw was packed into laboratory sterile plastic bags with release valves, vacuum-sealed, and stored at room temperature for 45 days, according to Xu's (2022) study.
2.2 Chemical composition analyses
Some fresh samples of fermented cotton strawlage after 45 days were collected for determining the enzymes activity and chemical composition. Firstly, urease, glutamate synthase, glutamine synthetase, and glutamate dehydrogenase assay kits (all purchased from Jiangsu Jingmei Biotechnology Co., Ltd., China) were used to determine the activities of these enzymes. Appropriate samples from each treatment group were placed into the oven (LBAO-250; Shanghai Sidike Instrument and Equipment Co., Ltd., Shanghai, China) and dried at 65°C for 48 h. Afterward, they were removed from the oven and allowed to absorb moisture for 24 h to make the samples reach equilibrium with the humidity of the surrounding environment to ensure the accuracy of the dry matter determination (Wang et al., 2025). Subsequently, the samples were crushed using a crusher (FS200; Guangzhou Bomin Electromechanical Equipment Co., Ltd., Guangzhou, China) and sieved through 1.0 mm and 2.0 mm mesh, respectively. The dry matter (DM), crude protein (CP), and ether extract (EE) were determined by the AOAC method (AOAC, 2006). The neutral detergent fiber (NDF) and acidic detergent fiber (ADF) were analyzed according to the method described in the previous report (Van Soest et al., 1991). The WSC concentration was determined by the sulfuric acid-anthrone colorimetric method (Yemm and Willis, 1954). Nitrogen distribution fractions were analyzed according to the method described in the previous report (Liu, 2024). The free gossypol content was determined in accordance with GB/T 13086-2020 (National Feed Industry Standardization Technical Committee, 2020).
2.3 Fermentation quality analysis
The fermentation quality was assessed after 45 days of fermentation. A sample of 20 g from each treatment was mixed with 180 mL of distilled water. After sealing with parafilm, the mixture was stored in a refrigerator at 4 °C for 24 h for extraction. The extract was then filtered through four layers of gauze and qualitative filter paper. The pH of the filtered solution was determined using a digital pH meter (PHBJ- 260F; Shanghai INESA Scientific Instrument Co., Ltd., China). The ammonia nitrogen concentration was measured using the phenol-sodium hypochlorite method (Broderick and Kang, 1980). Organic acids were quantified using high-performance liquid chromatography (1,260 Infinity II; Agilent Technologies, Waldbronn, Germany) as described by Xie et al. (2023).
2.4 DNA extraction and amplification
Microbial DNA was extracted from samples using the E.Z.N.A.® Soil DNA Kit (Omega Bio-tek, Norcross, GA, U.S.) according to manufacturer's protocols. The V4-V5 region of the bacteria 16S ribosomal RNA gene was amplified by PCR under the following conditions: 95°C for 2 min, followed by 25 cycles at 95°C for 30 s, 55°C for 30 s, and 72°C for 30 s, and a final extension at 72°C for 5 min. The primers used were 515F 5′-barcode- GTGCCAGCMGCCGCGG-3′ and 907R 5′-CCGTCAATTCMTTTRAGTTT-3′, where barcode is an eight-base sequence unique to each sample. PCR reactions were performed in triplicate 20 μL mixture containing 4 μL of 5 × FastPfu Buffer, 2 μL of 2.5 mM dNTPs, 0.8 μL of each primer (5 μM), 0.4 μL of FastPfu Polymerase, and 10 ng of template DNA. Amplicons were extracted from 2% agarose gels and purified using the AxyPrep DNA Gel Extraction Kit (Axygen Biosciences, Union City, CA, U.S.) according to the manufacturer's instructions.
2.5 Library construction and sequencing
SMRTbell libraries were prepared from the amplified DNA by blunt-ligation according to the manufacturer's instructions with SMRTbell prep kit 3.0 (Pacific Biosciences, PN: 102-182-700). Purified SMRTbell libraries from the pooled and barcoded samples were sequenced on a single PacBio Sequel IIe cell. All amplicon sequencing was performed by Shanghai Biozeron Biotechnology Co. Ltd (Shanghai, China).
2.6 Processing of sequencing data
PacBio raw reads were processed using the SMRT Link Analysis software version 11.0 to obtain demultiplexed circular consensus sequence (CCS) reads with the following settings: minimum number of passes = 3, minimum predicted accuracy = 0.99. Raw reads were processed through SMRT Portal to filter sequences for length (>1000 or <1800 bp) and quality. Sequences were further filtered by removing barcode and primer sequences with lima pipeline (Pacific Biosciences demultiplexing barcoded software, https://lima.how/).
2.7 Operational units (OTUs) generation
OTUs were clustered with 98.65% (Edgar, 2018; Johnson et al., 2019; Gao et al., 2022) similarity cutoff using UPARSE (Edgar, 2013) (version 10, http://drive5.com/uparse/). The phylogenetic affiliation of each 16S rRNA gene sequence was analyzed by uclust algorithm (Edgar, 2010) (https://github.com/topics/uclust) against the Silva (SSU138.2) (Quast et al., 2012) 16S rRNA database (http://www.arb-silva.de) using confidence threshold of 80% (Kim and Chun, 2014). After ASVs generation, the analysis of the full-length 16S rDNA data were operated by CFViSA platform, which contained microbiome analysis pipeline and nearly 80 analysis tools spanning simple sequence processing, visualization, and statistics available for the amplicon sequencing data.
2.8 LC-MS analysis
The LC-MS analysis was performed to identify metabolites, using an Ultimate 3000LC-Q-Exactive instrument (Thermo, CA, USA) equipped with a Hyper gold C18 column (100 mm by 2.1 mm, 1.9 μm; Thermo).The column temperature was maintained at 40°C. The mobile phase consisted of mobile phase A (water plus 5% [vol/vol] acetonitrile and 0.1% [vol/vol] formic acid) and mobile phase B (acetonitrile plus 0.1% [vol/vol] formic acid) at a flow rate of 0.3 mL/min. The elution procedure was as follows: 5% mobile phase B from 0 to 1 min, 5% to 95% mobile phase B from 1 to 11 min, and 95% to 5% mobile phase B from 11 to 19.5 min. The injection volume was 10 μL, and the autosampler was maintained at 4°C. The mass spectrometric settings for positive/negative-ion modes were as follows: a heater temperature of 300°C, a sheath gas flow rate of 45 arb, an auxiliary gas flow rate of 15 arb, a sweep gas flow rate of 1 arb, a spray voltage of 3.0 kV/3.2 kV, a capillary temperature of 350°C, and an S-ens radio frequency level of 30%/60%, respectively.
The raw data were analyzed using feature extraction and preprocessing by Compound Discoverer 2.0 software (Thermo Fisher Scientific Inc, USA). lon peak data present in <50% of the samples were removed. The main parameters were set as follows: an intensity threshold of 300,000, an m/z range of 70 to 1,050, an m/z width of 5 ppm, a frame time width of 0.2 min, and retention time start and end values of 0.01 and 19.5 min, respectively. The data were normalized according to the internal label and post-edited using Excel 2010 software. The online Human Metabolome Database (https://hmdb.ca) and KEGG database (https:/www.genome.jp/kegg/) were used to identify metabolites by aligning the molecular mass data. The metabolites were reported only when the difference between the theoretical mass and the observed mass was <20 ppm and further validated by isotopic distribution measurement. Principal component analysis (PCA), orthogonal partial least squares discriminant analysis (OPLS-DA), and loading plots were conducted using SlMCA-P software (version 13.0: Umetrics, Umea, Sweden). The OPLS-DA models were validated based on the variation interpretation (R2Y) and predictability (Q2) of the model in cross-validation and permutation tests with 200 iterations. Differential metabolites were identified according to the VIP obtained from the OPLS-DA model and statistical analysis (VIP score >1 and P-value <0.05). When metabolites were identified in both positive and negative ion modes, data from the mode with the lower P-value were retained.
2.9 Correlation between bacterial community and enzymes and nitrogen fractions
The correlation between the affected bacterial genera with a relative abundance >0.02% and the enzymes, as well as the correlation between these affected bacterial genera and nitrogen fractions, was assessed separately by Pearson's correlation analysis in Origin (version 2024). These correlations were visualized using the app of Correlation plot (version v1.31).
One-way analysis of variance (ANOVA) was conducted using IBM SPSS Statistics software to analyze the data on affected bacteria due to urea addition. In addition, regression analysis of chemical composition and fermentation quality was conducted using curve estimation with IBM SPSS statistics software.
2.10 Statistical analysis
All microbiota data were submitted to the NCB (National Centre of Biotechnology Information Bethesda, Maryland, USA) Sequence Read Archive (SRA) database (accession number SUB15181778).
3 Results
3.1 Chemical composition of cotton straw before and after fermentation
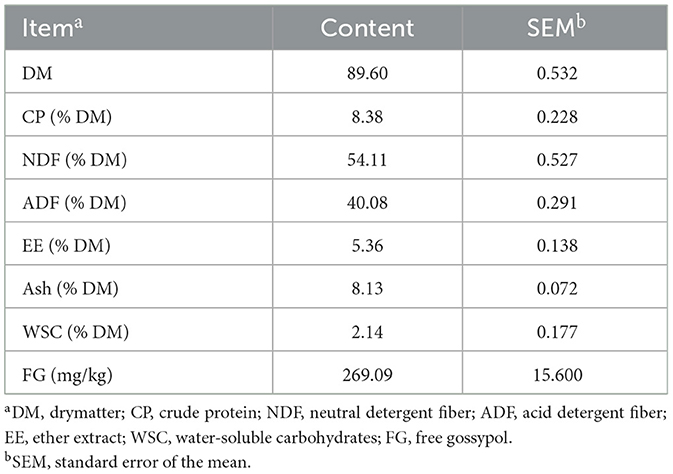
The chemical composition of cotton straw before being fermented is presented in Table 1. The DM content was 89.60% fresh material. CP, NDF, ADF, EE, Ash, WSC, and FG contents were 8.38%, 54.11%, 40.08%, 5.36%, 8.13%, 2.14%, and 269.09 mg/kg, respectively.
The chemical compositions of fermented cotton strawlage are presented in Table 2. With the exception of NDF, all other indices presented in the table were significantly influenced by the increasing addition of urea. DM and ADF contents initially decreased and then increased, following a cubic trend, peaking at U3 (P = 0.035 for DM, and P = 0.031 for ADF). As expected, CP content increased in a linear, quadratic, and cubic manner with the addition of urea. In contrast, the FG content decreased linearly, quadratically, and cubically as urea was added. A quadratic and cubic decline of EE and WSC contents was observed with increasing urea addition. No significant differences were noted in NDF and ash contents with varying levels of urea addition; however, the increased addition of urea exhibited a cubic trend effect on ash content.
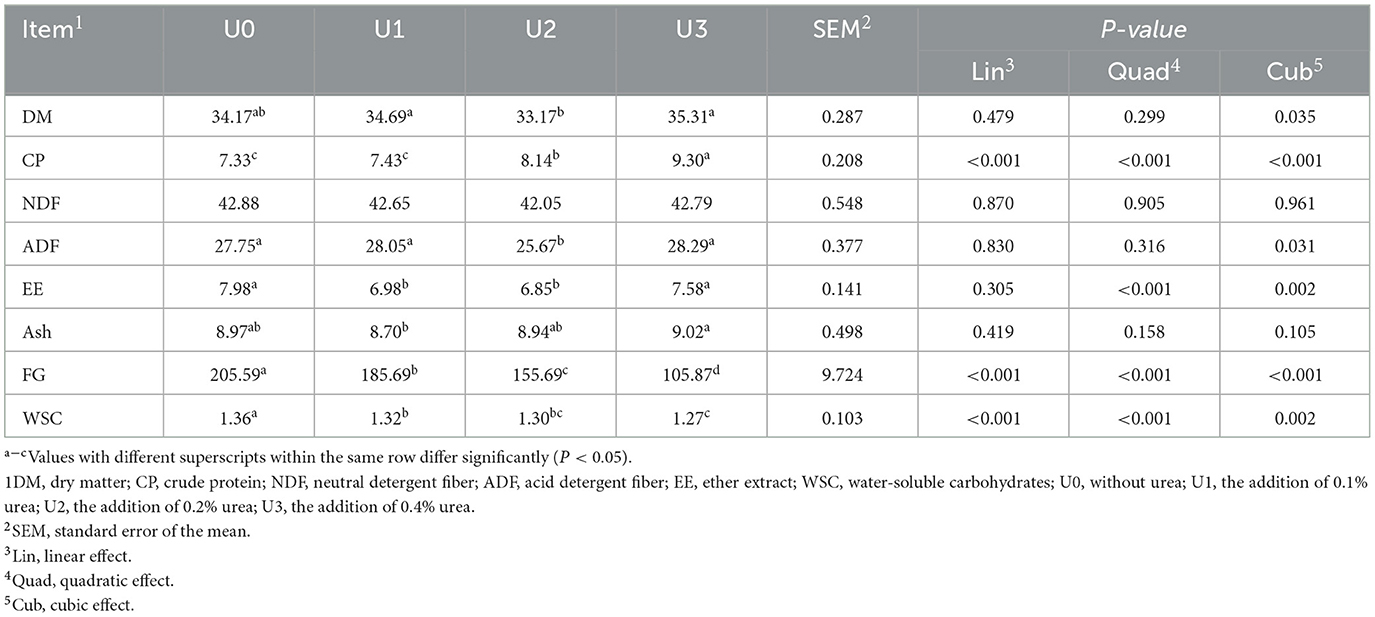
Table 2. The chemical compositions of cotton strawlage after 45 days of fermentation with varying levels of urea (%DM).
3.2 Effect of urea on fermentation quality of cotton strawlage
Fermentation characteristics of cotton strawlage are presented in Table 3. The addition of urea resulted in linear, quadratic, and cubic increases in AA (acetic acid) and PA (propionic acid) contents, reaching peaks of 14.35 μg/mL (U3) and 2.43 μg/mL (U2 and U3), respectively. However, the differences in pH and LA (lactic acid) content between U0 and the other treatments with varying levels of urea were not significant. BA was not detected in any of the groups.
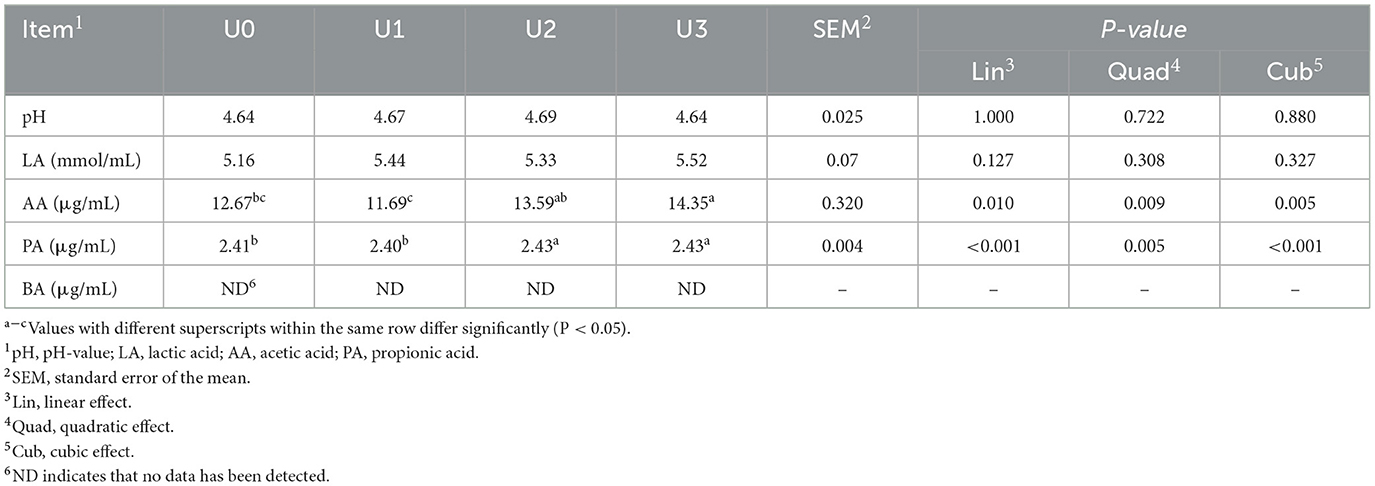
Table 3. Fermentation characteristics of cotton strawlage after 45 days of fermentation with varying levels of urea.
3.3 Effect of urea on nitrogen distribution fractions and amino acid profiles of cotton strawlage
Nitrogen distribution fractions of cotton strawlage after 45-day fermentation are presented in Table 4. It was obvious that urea addition had both quadratic and cubic effects on the contents of TN, NPN, PN, FAAN, and NH3-N. Notably, there was a marked linear, quadratic, and cubic increase in FAAN and NH3-N. Compared to U0, TN increased significantly from 1.41% to 1.71%, NPN increased from 52.35% TN to 59.17%, and PN increased from 43.24% TN to 47.90% as urea addition rose from 0.1% to 0.4%. However, upon completion of the fermentation process, no differences in NH3-N content were observed among the treatment groups with increasing urea additions, all of which were higher than U0. Furthermore, FAAN content initially increased and then decreased quadratically and cubically (P = 0.041, P = 0.013, respectively), reaching its highest point with the addition of 0.1% urea.
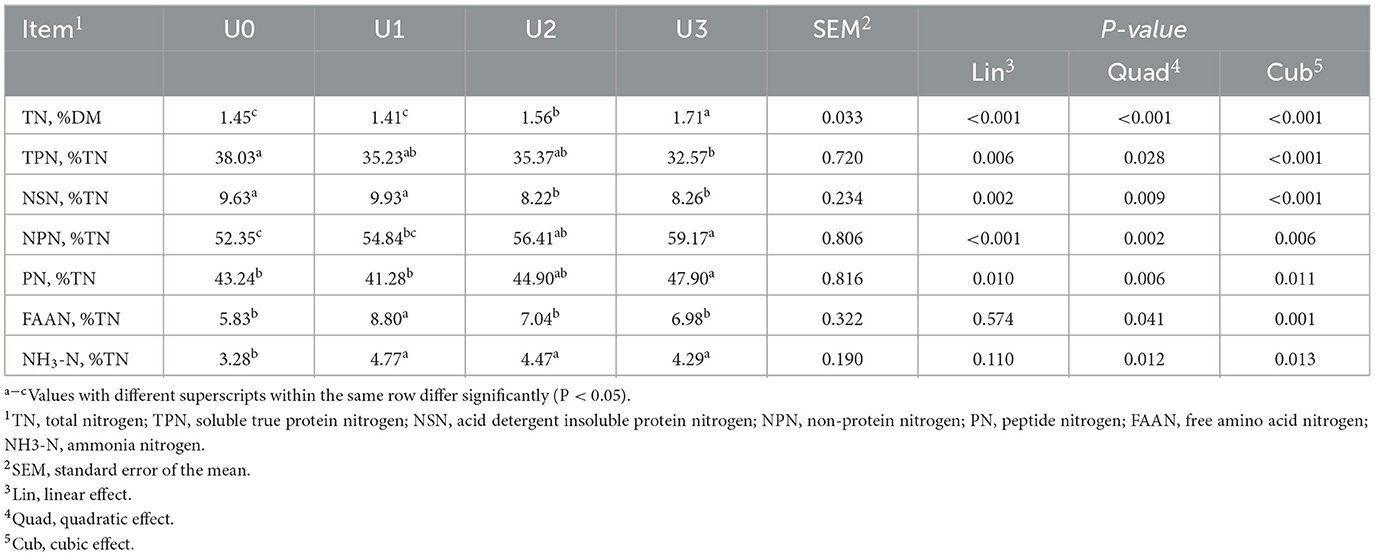
Table 4. Nitrogen distribution fractions of cotton strawlage after 45 days of fermentation with varying levels of urea.
The amino acid profiles of cotton straw are presented in Table 5. Aspartic acid (Asp), threonine (Thr), serine (Ser), leucine (Leu), arginine (Arg), and proline (Pro) exhibited significant linear, quadratic, and cubic decreases in concentration with increased urea supplementation. Glycine (Gly), valine (Val), phenylalanine (Phe), and lysine (Lys) concentrations showed significant reductions in both linear and quadratic patterns. Conversely, tyrosine (Tyr) and histidine (His) demonstrated significant quadratic and cubic responses, while Glutamic acid (Glu) levels decreased significantly in both linear and cubic manners. No differences were observed in isoleucine (Ile) content across all treatment groups.
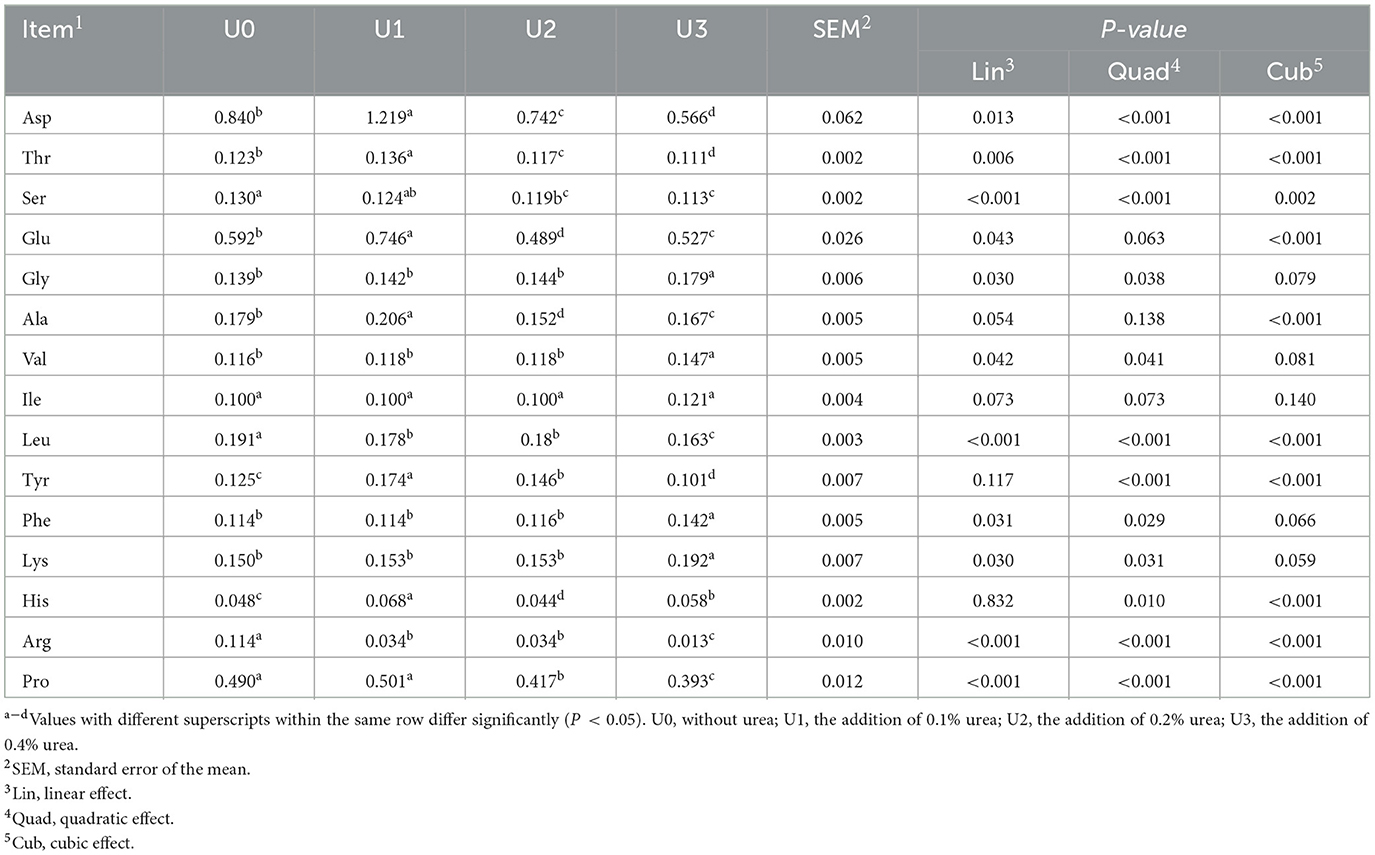
Table 5. Amino acids contents of cotton straw after 45 days of fermentation with varying levels of urea.
3.4 Effect of urea on urease and ammonia assimilation enzyme activities of cotton strawlage
Urease, glutamate synthase (GS), glutamine-oxoglutarate aminotransferase (GOGAT), and glutamate dehydrogenase activities (GDH) are presented in Table 6. Urease activity increased linearly, quadratically, and cubically with the addition of urea, reaching its lowest point at 6,764.81 U/g with the addition of 0.4% urea. GS activity increased by 20% in U2 compared to the U0, and this increase followed a cubic trend with rising urea levels. GDH activity initially decreased and then increased significantly, exhibiting quadratic and cubic responses to urea concentrations ranging from 0.1% to 0.4%. However, no significant differences in GOGAT activity were detected among the treatment groups.

Table 6. Urease, GOGAT, GS, and GDH concentrations in cotton strawlage after 45 days of fermentation with varying levels of urea (U/g).
3.5 Effect of urea on the relative abundance (%) of the affected bacteria at the genus level of cotton strawlage
Among all genera, 10 genera were affected by urea and presented in Table 7. The relative abundances of Schleiferilactobacillus, Enterococcus, and Weissella initially decreased and then increased with higher urea additions, peaking at 36.15% (U1), 1.36% (U2), and 1.54% (U3), respectively. Conversely, the trend of Pantoea was the opposite of these three genera. Three genera, including Lactiplantibacillus, Aerococcus, and Massilia, showed an increase with rising urea concentrations. Compared to U0, the relative abundances of Pediococcus and Levilactobacillus decreased across the other three treatments. The relative abundance of Lacticaseibacillus exhibited a trend of initially increasing, followed by a decrease again with greater urea addition.
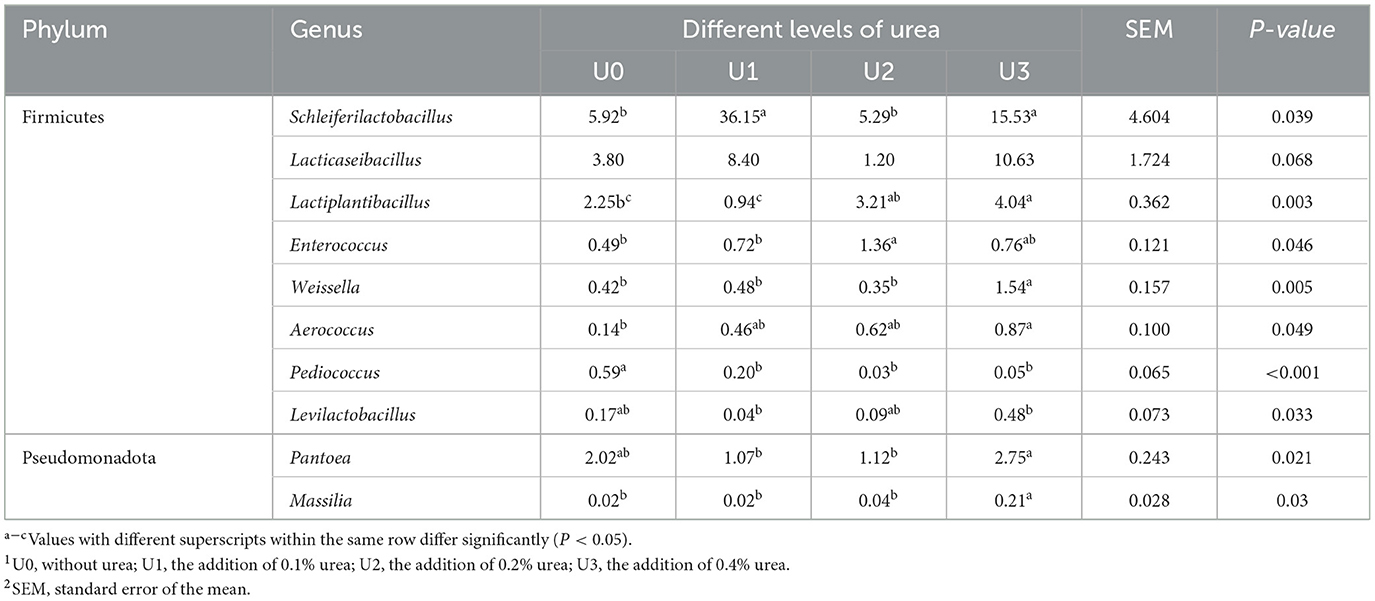
Table 7. The relative abundance (%) of the affected bacteria at genus level of cotton strawlage after 45 days of fermentation with varying levels of urea.
3.6 Correlation between affected bacteria and the urease and ammonia assimilation enzyme activities
Pearson correlation coefficients were calculated to study the correlation between various bacteria and the activities of urease, GOGAT, GS, and GDH. As shown in Figure 1, urease activity was negatively correlated with Weissella, Levilactobacillus, and Massilia. GOGAT displayed a negative correlation with the Levilactobacillus and tended to negatively correlate with the Pantoea. GDH tended to positively correlate with both Levilactobacillus and Pantoea.
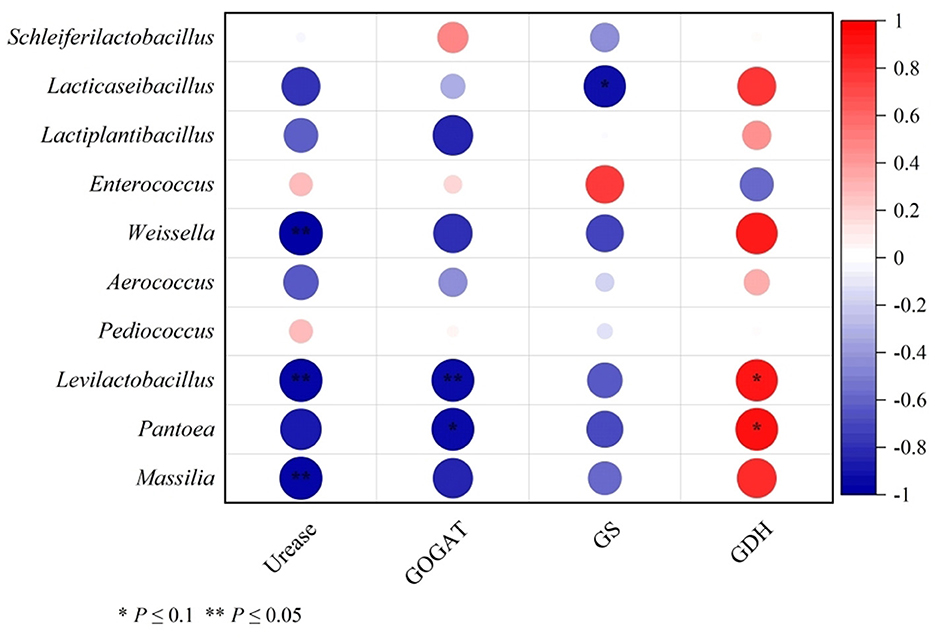
Figure 1. Correlation analysis of differential bacteria genus and urease, GOGAT, GS, and GDH concentrations of cotton strawlage after 45 days of fermentation with varying levels of urea. Each row represents a bacteria genus, only the genera with relative abundance > 0.01% are selected; each column represents an enzyme. The color blue means negative correlation, the color red means positive correlation. *P < 0.1, **P < 0.05.
3.7 Correlation between affected bacteria and the nitrogen distribution fractions
As shown in Figure 2, TN content tended to positively correlate with Lactiplantibacillus and Massilia, while TPN was negatively correlated with the Aerococcus. Non-structural nitrogen (NSN) content tended to negatively correlate with the Lactiplantibacillus, while NPN content was positively correlated with the Aerococcus. PN content showed a positive correlation with Lactiplantibacillus, and FAAN content displayed a tendency to positively correlate with Schleiferilactobacillus.
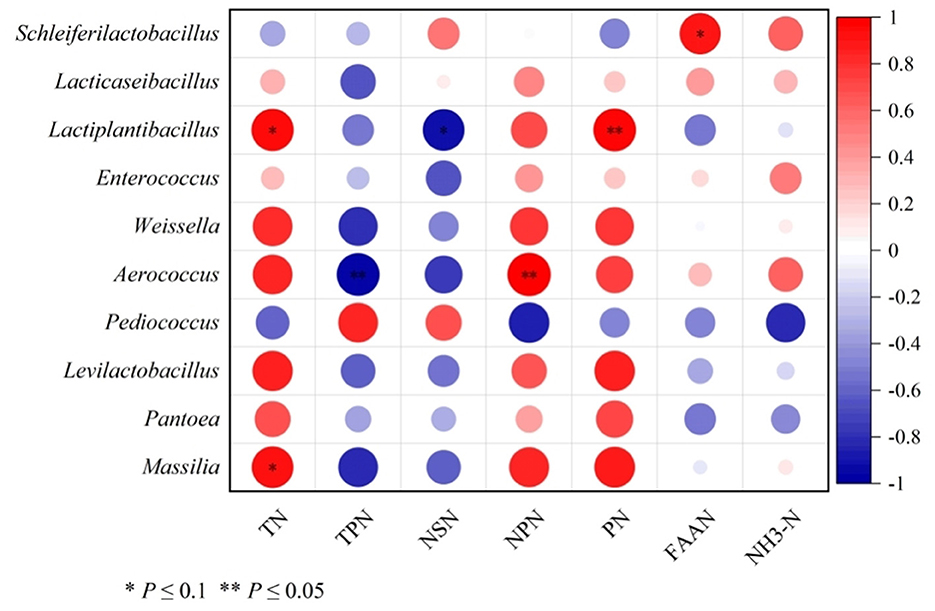
Figure 2. Correlation analysis of differential bacteria genera and nitrogen distribution fractions of cotton strawlage after 45 days of fermentation with varying levels of urea. Each row represents a bacteria genus, only the genera with relative abundance > 0.01% are selected; each column represents a nitrogen distribution fraction. The color blue means negative correlation, the color red means positive correlation. *P < 0.1, **P < 0.05.
3.8 Fermented metabolomics profiling
The principal component analysis (PCA) score plot was used to identify differences in metabolite data among the groups (Figure 3). The results indicate clear separation among samples from all groups. The OPLS-DA score plots validated the differentiated metabolites between each pair of groups, demonstrating distinct separation and discrimination under both positive and negative ion modes (Supplementary Figures S1, S2). The validation plots following the permutation test provided parameters for evaluating the OPLS-DA model's ability to distinguish among the four groups.
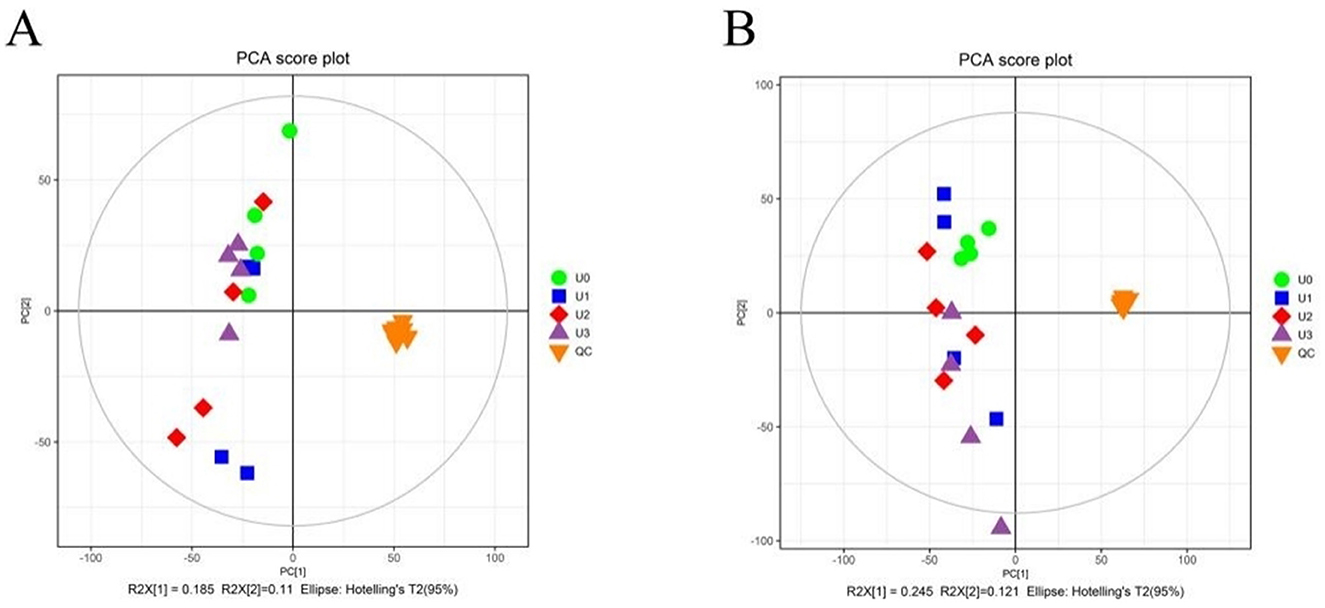
Figure 3. Principal component analysis (PCA) of cotton strawlage after 45 days of fermentation with varying levels of urea. (A) cationic mode; (B) anionic mode.
Volcano plot analysis visualized the effects of urea treatments on differential metabolites in fermented cotton straw (Supplementary Figure S3). In positive ion mode: U1 vs. U0 (Supplementary Figure S3a) identified 612 differential metabolites (161 down-regulated, 451 up-regulated); U2 vs. U0 (Supplementary Figure S3c) yielded 354 (207 down, 147 up); U3 vs. U0 (Supplementary Figure S3e) detected 801 (331 down, 470 up). In negative ion mode: U1 vs. U0 (Supplementary Figure S3b) identified 712 differential metabolites (302 down, 410 up); U2 vs. U0 (Supplementary Figure S3d) showed 542 (306 down, 236 up); U3 vs. U0 (Supplementary Figure S3f) revealed 1,016 (490 down, 526 up).
Metabolic pathway enrichment of the differential metabolites between U1, U2, U3, and U0 groups was visualized using topological bubble plots, as shown in Supplementary Figure S4. Given the complexity of metabolic responses, the top six pathways were selected for analysis based on their importance ranking. The pathways involved in U1 vs. U0 mainly included alanine, aspartate and glutamate metabolism, arginine biosynthesis, β-alanine metabolism, glyoxylate and dicarboxylate metabolism, arginine and proline metabolism, and pantothenate and CoA biosynthesis. The pathways for U2 vs. U0 comprised C5-branched dibasic acid metabolism, ubiquinone and terpenoid-quinone biosynthesis, tyrosine metabolism, β-alanine metabolism, arginine and proline metabolism, and arginine biosynthesis. U3 vs. U0 highlighted cutin, suberin and wax biosynthesis, glyoxylate and dicarboxylate metabolism, arginine and proline metabolism, arginine biosynthesis, ubiquinone and terpenoid-quinone biosynthesis, and the TCA cycle.
Based on VIP scores, fold changes (FC), and P-value (VIP > 1, FC > 1 or <1, P < 0.05), differential metabolites involved in the Top six metabolic pathways for each group were further screened (Supplementary Table S1). In the comparison of U1 vs. U0, six metabolites showed significant pathway-specific alterations: L-Proline, L-Alanine, and L-Glutamate were up-regulated, while L-Arginine, 3-Ureidopropionic acid, and Glyceric acid were down-regulated. In U2 vs. U0, seven down-regulated metabolites were identified: L-Proline, Citraconic acid, 4-Hydroxybenzoate, Homogentisic acid, 3-Ureidopropionic acid, L-Arginine, and 2-Oxoglutaric acid. The U3 vs. U0 comparison revealed 11 differential metabolites with L-Glutamate, L-Proline, Hydroxyproline, Citric acid, Glyceric acid, Glyoxylic acid, 2-Oxoglutaric acid, L-Arginine, L-Ornithine, and Homogentisic acid being down-regulated, except for 16-Hydroxyhexadecanoic acid, which was up-regulated.
4 Discussion
4.1 Impact of urea supplementation on nutritional characteristics of cotton strawlage
The DM content of the U2 treatment was lower than any other treatment, which was attributed to its high pH. Numerous studies have shown that high pH is not beneficial for DM preservation (Muck et al., 2018; Li et al., 2022). Saminathan, Wan Mohamed, Md Noh, Ibrahim, Fuat, and Kumari Ramiah (2022) study found that with increasing levels of urea inclusion (1%–5%), the contents of neutral detergent fibre (NDF) and acid detergent lignin (ADL) were significantly decreased. However, in this study, the ADF content of cotton strawlage did not continue to decrease with the increase in urea addition level. The study found that compared to the U0 treatment, 16-hydroxypalmitate was significantly upregulated in the cutin, suberin, and wax biosynthesis metabolic pathways of the U3 treatment. 16-Hydroxypalmitate serves as one of precursors for cutin biosynthesis (Li-Beisson et al., 2009). Increased cutin leads to the isolation of the plant surface from the surrounding environment (Chen J. Y. et al., 2023), thereby hindering the degradation of fibers by fiber-degrading bacteria and enzymes in the U3 treatment.
CP concentration serves as a pivotal determinant of feed nutritive value, directly correlating with dietary utility. In the current study, incremental urea supplementation in fermented cotton strawlage resulted in a statistically significant elevation in CP content relative to the U0 control group (P < 0.05), corroborating findings reported by Hou et al. (2022). Paradoxically, post-fermentation CP concentrations in all experimental groups (except U3) were lower than pre-fermentation values. This phenomenon may be attributed to incomplete suppression of aerobic microbial populations under suboptimal pH conditions, which perpetuated proteolytic activity and subsequent nitrogen loss (Hou et al., 2022; Shaani et al., 2017). WSC is a key factor in facilitating fermentation, serving as a microbial energy source during the micro-storage process. Xu (2022) also found that the content of WSC significantly affects the fermentation quality of cotton straw when adding different levels of molasses. A WSC content of 2%−3% DM is the threshold for continuous good fermentation and further reduction of pH (Hristov and Sandev, 1998). This well explains why the pH at the end of cotton straw fermentation in this study did not drop below 4.0.
The presence of free gossypol in cotton straw poses a significant limitation in their conversion to feed. Ruminants such as cattle and sheep can metabolize some free gossypol, but their metabolic capacity is limited. Prolonged feeding on diets high in cotton sources can lead to poisoning due to liver damage, posing serious health risks for the animals. In addition, excessive free gossypol intake can adversely affect the reproductive systems of male animals, leading to infertility (Hu et al., 2020; Wang et al., 2020). Studies have found that during the fermentation of cotton-based feed by microorganisms, specific enzymes produced by these microbes reduce the content of free gossypol in the feed (Wang et al., 2021, 2023; Ni et al., 2024). Urea serves as a nitrogen source for microbial growth and reproduction (Méndez-García et al., 2015; Hou et al., 2022). In this study, the gossypol degradation rate increased with the increase in urea addition levels, likely because a more abundant nitrogen supply promotes the proliferation of microorganisms and the production of gossypol-degrading enzymes—this relationship warrants further investigation. Additionally, based on the lack of a decline in gossypol degradation rate across the urea addition gradients tested in this experiment, we infer that the current urea levels have not yet reached the upper limit of microbial utilization. Second, Gossypol was noted as being less toxic to ruminants, and the current maximum level for free gossypol in complete feed for sheep, goat and cattle (except calves) is 300~500 mg/kg [EFSA Panel on Contaminants in the Food Chain (CONTAM) et al., 2017]. In this study, at the end of fermentation, the free gossypol content was less than the maximum level.
4.2 Impact of urea addition on fermentative characteristics of cotton straw
Li et al. (2021) and Wu et al. (2020) reported in their studies that Pseudomonadota and Firmicutes were the dominant phyla in fermented forage, and the phyla significantly affected by fermentation in this study were consistent with this finding. Most lactic acid bacteria (LAB) belong to the phylum Bacillota, which can increase lactic acid content in the system and rapidly create an acidic environment (Guan et al., 2018), further promoting the microbial composition to develop toward Firmicutes. pH, NH3-N, and volatile fatty acids are key indicators for preliminarily evaluating microbial fermentation of forage (Wang et al., 2020). Traditional ensiling practices suggest that forage with a post-fermentation pH below 4.2 is generally considered high-quality, but this threshold is closely associated with factors such as fermentation temperature, moisture content, and raw material characteristics (Ye et al., 2015; Wan et al., 2019; Wang et al., 2020; Shan et al., 2021). In this study, the pH values of groups U0 and U3 were lower than those of groups U1 and U2, which was due to the higher content of volatile fatty acids in these two groups. However, this study found that the relative abundance of LAB (lactic acid bacteria) was highest in group U1, particularly for *Schleiferilactobacillus*, but its pH was not the lowest. This may be because: (1) The acid-producing efficiency of Schleiferilactobacillus is lower than that of genera such as Lacticaseibacillus, Lactiplantibacillus, and Weissella, but this requires further investigation to confirm; (2) The NH3-N content in group U1 was higher than that in groups U0 and U3, resulting in a higher pH.
4.3 Impacts of urea on the nitrogen fractions, urease activity, and ammonia assimilation enzyme activity of cotton straw
In the cotton straw fermentation process, efficient urea utilization requires the involvement of urea-decomposing bacteria, which synthesize urease to convert urea into ammonia nitrogen. This ammonia nitrogen can then be incorporated into microbial proteins through ammonia-assimilating enzymes such as GS, GOGAT, and GDH (Partow et al., 2017; Scarcia et al., 2017; Porcelli et al., 2018; Zhang et al., 2020; Cheng et al., 2022). In this experiment, GOGAT and GS activities were higher than that of GDH across all groups, indicating that ammonia assimilation primarily relied on GOGAT and GS. This explains why the total TPN content in the U3 treatment group was lower than in other groups. However, further analysis revealed significant negative correlations between GOGAT/GS activities and the abundances of Levilactobacillus and Lacticaseibacillus. Studies indicate that these two genera produce lactic acid to reduce silage pH (Chen Y. L. et al., 2023), suggesting that GOGAT and GS activities were inhibited in acidic environments. In contrast, GDH showed positive correlations with the abundances of most lactic acid bacteria and Pantoea, indicating that these microbes may preferentially utilize GDH for ammonia assimilation under low pH conditions. In this study, Aerococcus showed negative and positive correlations with TPN and NPN contents, respectively, indicating that Aerococcus may contribute to TPN loss and NPN accumulation. However, further research is needed to validate this finding. Studies have shown that Schleiferilactobacillus can degrade proteins into FAAN (Zheng et al., 2021), which aligns with the positive correlation observed between FAAN and Schleiferilactobacillus in this experiment. Additionally, a negative correlation between NSN content and lactate-utilizing bacteria was observed, particularly with a stronger negative correlation with Lactiplantibacillus. This effect may be due to lactate-utilizing bacteria breaking down the fibrous structure of cotton straw through organic acid production (Jia et al., 2013), and thereby degrading bound proteins. This is consistent with the results indicating NSN content in the U2 and U3 groups was significantly lower than that in the U0 and U1 groups.
4.4 Impact of urea on amino acids and metabolic profiles of cotton straw fermentation
PCA and OPLS-DA of metabolomics data from fermented cotton straw revealed significant separation between treatment groups with varying urea levels, indicating close correlations between metabolic profiles and urea addition. Existing studies have confirmed that energy metabolism, amino acid metabolism, and cofactor metabolic pathways play critical regulatory roles in forage fermentation processes, and significantly influencing fermentation quality (Du et al., 2021). This study further demonstrated that differential metabolites in fermented cotton straw were primarily enriched in amino acid metabolic pathways, with pathway complexity increasing significantly with higher urea levels. Notably, metabolites such as L-proline, L-arginine, L-glutamate, 3-ureidopropionic acid, glyceric acid, 2-Oxoglutaric acid, and homogentisic acid showed significant inter-group differences. Among these, L-proline and L-arginine showed consistent significant changes across all treatment groups, suggesting their central roles in urea-regulated metabolic networks of ensiled cotton straw. Pathway analysis indicated that variations in L-proline and L-arginine significantly impacted arginine biosynthesis and arginine/proline metabolic pathways. As a major component of collagen and milk proteins, proline is the amino acid with the highest demand for systemic protein synthesis (Wu et al., 2011) and play a role in maintaining cellular osmotic homeostasis (Christian, 1955). Proline biosynthesis occurs through two primary pathways: glutamate-dependent and ornithine-dependent routes (Fichman et al., 2015). This study found that compared to the U0 group, L-proline levels were significantly upregulated in the U1 group but downregulated in U2 and U3 groups (U3 <U2), consistent with amino acid quantification results. Possible mechanisms include: (1) the U1 group accumulated L-alanine and L-glutamate, providing sufficient substrates for proline synthesis; (2) the U2 group showed significantly reduced 2-Oxoglutaric acid, which may limit ornithine/glutamate production and inhibit proline synthesis through disruptions in energy metabolism. Additionally, coordinated downregulation of 2-Oxoglutaric acid, L-ornithine, and L-glutamate was observed in the U3 group, further supporting this hypothesis.
As a key amino acid for animal reproductive development and nutritional regulation (Sun et al., 2014; Fichman et al., 2015; Dubeibe et al., 2017), arginine biosynthesis relies primarily on glutamate-derived ornithine or citrulline precursors (Wang Q. et al., 2024). In this study, arginine levels were significantly lower in U1, U2, and U3 groups compared to U0, with decreasing amplitudes following the order U3 > U2 > U1. The reduced arginine levels in the U1 group may result from arginase-catalyzed decomposition into ornithine, which is subsequently converted to glutamate via ornithine aminotransferase (Liu et al., 2020), aligning with the observed upregulation of glutamate. The pronounced decreases in arginine in U2 and U3 groups likely stem from precursor ornithine deficiency, with reductions in 2-Oxoglutaric acid further evidencing the impact of energy metabolism on arginine synthesis.
5 Conclusion
The addition of 0.4% urea in ensiling cotton strawlage significantly increased the TN content, reduced the NSN and free gossypol contents, thereby enhancing the nutritional value of cotton strawlage, optimizing its nitrogen composition and mitigating feeding risks. In addition, the inclusion of urea in fermenting cotton strawlage significantly affected the composition of various bacterial genera. As urea addition levels increased, the amino acid and energy metabolism of cotton straw become increasingly complex.
Data availability statement
The original contributions presented in the study are publicly available. This data can be found here: https://www.ncbi.nlm.nih.gov, accession number PRJNA1237804.
Author contributions
SZ: Data curation, Formal analysis, Software, Writing – original draft, Writing – review & editing. ZZ: Data curation, Formal analysis, Software, Writing – review & editing. XC: Writing – review & editing. QP: Writing – review & editing. SL: Writing – review & editing. YL: Methodology, Supervision, Validation, Writing – review & editing. YoS: Writing – review & editing. YaS: Writing – review & editing. XS: Writing – review & editing. CS: Writing – review & editing. WS: Data curation, Formal analysis, Methodology, Writing – review & editing. DH: Data curation, Formal analysis, Methodology, Supervision, Writing – original draft, Writing – review & editing. XW: Data curation, Funding acquisition, Methodology, Project administration, Writing – original draft, Writing – review & editing.
Funding
The author(s) declare that financial support was received for the research and/or publication of this article. This work was financially supported by the 8th Group Key Areas of Technological Research and Development (2023NY03), the Third Division's unveiling and leadership project (KY2024JBGS08), the Xinjiang Production and Construction Corps. Key Areas of Technological Research and Development (2023AB008), Autonomous Region's Rural Revitalization Industrial Development Science and Technology Action Plan Program (2024NC026), and the Scientific Research Project of Shihezi University (KTP202316).
Conflict of interest
XC and SL were employed by Tumushuke Tuxing Animal Husbandry Co., Ltd.
The remaining authors declare that the research was conducted in the absence of any commercial or financial relationships that could be construed as a potential conflict of interest.
Generative AI statement
The author(s) declare that no Gen AI was used in the creation of this manuscript.
Publisher's note
All claims expressed in this article are solely those of the authors and do not necessarily represent those of their affiliated organizations, or those of the publisher, the editors and the reviewers. Any product that may be evaluated in this article, or claim that may be made by its manufacturer, is not guaranteed or endorsed by the publisher.
Supplementary material
The Supplementary Material for this article can be found online at: https://www.frontiersin.org/articles/10.3389/fmicb.2025.1610850/full#supplementary-material
Figure S1 | Orthogonal partial least squares discriminant analysis (OPLS-DA) (a, c, e) and corresponding permutation test following positive mode ionization (b, d, f) derived from the metabolomics analysis of cotton strawlage after 45 days of fermentation with varying levels of urea. U0, without urea; U1, the addition of 0.1% urea; U2, the addition of 0.2% urea; U3, the addition of 0.4% urea.
Figure S2 | Orthogonal partial least squares discriminant analysis (OPLS-DA) (a, c, e) and corresponding permutation test following negative mode ionization (b, d, f) derived from the metabolomics analysis of cotton strawlage after 45 days of fermentation with varying levels of urea. U0, without urea; U1, the addition of 0.1% urea; U2, the addition of 0.2% urea; U3, the addition of 0.4% urea.
Figure S3 | Volcano plot analysis of differential metabolites in cotton strawlage after 45 days of fermentation with varying levels of urea. In the volcano plot, each dot represents a metabolite. The x-axis indicates the log2-transformed fold change of metabolites between groups, while the y-axis represents the -log10 transformed P-value from t-tests. The size of each dot corresponds to the VIP score derived from the OPLS-DA model, where larger dots denote higher VIP values. The up-regulated metabolites are colored red, the down-regulated metabolites are colored blue, and non-significant metabolites are shown in gray. And (a, c, e) are under positive mode ionization; (b, d, f) are under negative mode ionization.
Figure S4 | Top six KEGG pathway enrichment analysis of differential metabolites from U1 vs. U0 (a), U2 vs. U0 (b) and U3 vs. U0 (c) of cotton strawlage after 45 days of fermentation with varying levels of urea. The color is to distinguish the enrichment significance (- ln P-value), the darker the color is, the more significantly the metabolic pathway is enriched. The x-axis indicates the P-value. A larger size dot indicates higher pathway enrichment.
References
AOAC (2006). Official Methods of Analysis, 18th Edn. Gaithersburgs, MD: Association of Official Analytical Chemists.
Broderick, G. A., and Kang, J. H. (1980). Automated simultaneous determination of ammonia and total amino acids in ruminal fluid and in vitro media. J. Dairy Sci. 63, 64–75. doi: 10.3168/jds.S0022-0302(80)82888-8
Cai, C., Wang, Z., Ma, L., Xu, Z., Yu, J., and Li, F. (2024). Cotton stalk valorization towards bio-based materials, chemicals, and biofuels: a review. Renew. Sustain. Energy Rev. 202:114651. doi: 10.1016/j.rser.2024.114651
Cairang, D. Z., Wu, K. X., and Hao, L. Z. (2014). Effects of different urea addition levels on the quality of ammoniated wheat straw. Heilongjiang Anim. Sci. Vet. Med. 9, 115–118.
Chen, J. Y., Kuruparan, A., Zamani-Babgohari, M., and Gonzales-Vigil, E. (2023). Dynamic changes to the plant cuticle include the production of volatile cuticular wax–derived compounds. Proc. Nat. Acad. Sci. 120:e2307012120. doi: 10.1073/pnas.2307012120
Chen, Y. L., Fan, X. Y., Long, J. H., Li, M. Y., Lei, Y., Li, P., et al. (2023). Effect of formic acid and lactic acid bacteria on quality and microbial community of Broussonetia papyrifera L. silage. Feed Res. 13, 93–97.
Cheng, Q., Li, M., Fan, X., Chen, Y., Sun, H., Xie, Y., et al. (2022). Effects of epiphytic and exogenous lactic acid bacteria on fermentation quality and microbial community compositions of paper mulberry silage. Front. Microbiol. 13:973500. doi: 10.3389/fmicb.2022.973500
Costa, L. A., de Araújo, M. J., Edvan, R. L., Bezerra, L. R., de Sousa, A. R., Viana, F. J. C., et al. (2020). Chemical composition, fermentative characteristics, and in situ ruminal degradability of elephant grass silage containing Parkia platycephala pod meal and urea. Trop. Anim. Health Prod. 52, 3481–3492. doi: 10.1007/s11250-020-02382-8
Du, Z., Sun, L., Chen, C., Lin, J., Yang, F., and Cai, Y. (2021). Exploring microbial community structure and metabolic gene clusters during silage fermentation of paper mulberry, a high-protein woody plant. Anim. Feed Sci. Technol. 275:114766. doi: 10.1016/j.anifeedsci.2020.114766
Dubeibe, D. F., Caldas-Bussiere, M. C., Maciel, V. L., Sampaio, W. V., Quirino, C. R., Gonçalves, P. B. D., et al. (2017). L-arginine affects the IVM of cattle cumulus-oocyte complexes. Theriogenology 88, 134–144. doi: 10.1016/j.theriogenology.2016.09.017
Edgar, R. C. (2010). Search and clustering orders of magnitude faster than BLAST. Bioinformatics 26, 2460–2461. doi: 10.1093/bioinformatics/btq461
Edgar, R. C. (2013). UPARSE: highly accurate OTU sequences from microbial amplicon reads. Nat. Methods 10, 996–998. doi: 10.1038/nmeth.2604
Edgar, R. C. (2018). Updating the 97% identity threshold for 16S ribosomal RNA OTUs. Bioinformatics 34, 2371–2375. doi: 10.1093/bioinformatics/bty113
EFSA Panel on Contaminants in the Food Chain (CONTAM) Knutsen, H. K. Barregård L. Bignami M. Brüschweiler B. Ceccatelli S.. (2017). Presence of free gossypol in whole cottonseed. EFSA J. 15:e04850. doi: 10.2903/j.efsa.2017.4850
Fichman, Y., Gerdes, S. Y., Kovács, H., Szabados, L., Zilberstein, A., and Csonka, L. N. (2015). Evolution of proline biosynthesis: enzymology, bioinformatics, genetics, and transcriptional regulation. Biol. Rev. Camb. Philos. Soc. 90, 1065–1099. doi: 10.1111/brv.12146
Fu, T. (2014). Screening of Dominant Lactic Acid Bacteria andFermentation Qualitty Control of Corn Silage processing. Zhengzhou, Henan: Henan Agricultural University.
Gao, F., Guo, R., Ma, Q., Li, Y., Wang, W., Fan, Y., et al. (2022). Stressful events induce long-term gut microbiota dysbiosis and associated post-traumatic stress symptoms in healthcare workers fighting against COVID-19. J. Affect. Disord. 303, 187–195. doi: 10.1016/j.jad.2022.02.024
Gong, A. J. (2007). Development and utilization of cotton stalk feed. Rural Sci. Technol. 6, 73–74. doi: 10.3969/j.issn.1002-6193.2007.06.070
Guan, R., Li, X., Wachemo, A. C., Yuan, H., Liu, Y., Zou, D., et al. (2018). Enhancing anaerobic digestion performance and degradation of lignocellulosic components of rice straw by combined biological and chemical pretreatment. Sci. Total Environ. 637, 9–17. doi: 10.1016/j.scitotenv.2018.04.366
Hou, Z.P, Zheng, X., Zhang, X.L, Chen, Q., et al. (2022). Effects of urea supplementation on the nutritional quality and microbial community of alfalfa (Medicago sativa L.) silage. Arch. Microbiol. 204:414. doi: 10.1007/s00203-022-03046-x
Hristov, A. N., and Sandev, S. G. (1998). Proteolysis and rumen degradability of protein in alfalfa preserved as silage, wilted silage or hay. Anim. Feed Sci. Technol. 72, 175–181. doi: 10.1016/S0377-8401(97)00177-6
Hu, B., Zheng, W. X., Gao, W. M., and Yang, H. Y. (2020). Research progress of toxicology and detoxification technology of free. Grass Feed. Livest. 3, 1–7.
Jan, M., Liu, Z., Guo, C., Zhou, Y., and Sun, X. (2022). An overview of cotton gland development and its transcriptional regulation. Int. J. Mol. Sci. 23:4892. doi: 10.3390/ijms23094892
Jia, M., Zhang, Z. X., Ren, G. Y., Wang, X. Y., and Du, X. Y. (2013). Process optimization of cornstalk degradation by straw fermentation agent. J. Henan Univ. Sci. Technol. 2, 70–74.
Johnson, J. S., Spakowicz, D. J., Hong, B. Y., Petersen, L. M., Demkowicz, P., Chen, L., et al. (2019). Evaluation of 16S rRNA gene sequencing for species and strain-level microbiome analysis. Nat. Commun. 10:5029. doi: 10.1038/s41467-019-13036-1
Kim, M., and Chun, J. (2014). 16S rRNA gene-based identification of bacteria and archaea using the EzTaxon server. Methods Microbiol. 4161–4174. doi: 10.1016/bs.mim.2014.08.001
Lee, J. J., Woodward, A. W., and Chen, Z. J. (2007). Gene expression changes and early events in cotton fibre development. Ann. Bot. 100, 1391–1401. doi: 10.1093/aob/mcm232
Li, M., Zi, X., Zhou, H., Lv, R., Tang, J., and Cai, Y. (2021). Effect of lactic acid bacteria, molasses, and their combination on the fermentation quality and bacterial community of cassava foliage silage. Anim. Sci. J. 92:e13635. doi: 10.1111/asj.13635
Li, Y., Du, S., Sun, L., Cheng, Q., Hao, J., Lu, Q., et al. (2022). Effects of lactic acid bacteria and molasses additives on dynamic fermentation quality and microbial community of native grass silage. Front. Microbiol. 13:830121. doi: 10.3389/fmicb.2022.830121
Li-Beisson, Y., Pollard, M., Sauveplane, V., Pinot, F., Ohlrogge, J., and Beisson, F. (2009). Nanoridges that characterize the surface morphology of flowers require the synthesis of cutin polyester. Proc. Natl. Acad. Sci. U.S.A. 106, 22008–22013. doi: 10.1073/pnas.0909090106
Liu, M. J. (2024). Study on Protein Degradation and Regulation Mechanism of Alfalfa Silage. Hohhot City, Inner Mongolia Autonomous Region: Inner Mongolia University.
Liu, C., Luo, R., Du, J. P., and Li, X. (2020). Arginase II: an extraordinary enzyme. Chin. J. Comp. Med. 9, 85–90. doi: 10.3969/j.issn.1671-7856.2020.09.016
Méndez-García, C., Peláez, A. I., Mesa, V., Sánchez, J., Golyshina, O. V., and Ferrer, M. (2015). Microbial diversity and metabolic networks in acid mine drainage habitats. Front. Microbiol. 6:475. doi: 10.3389/fmicb.2015.00475
Muck, R. E., Nadeau, E. M. G., McAllister, T. A., Contreras-Govea, F. E., Santos, M. C., and Kung, L. Jr. (2018). Silage review: recent advances and future uses of silage additives. J. Dairy Sci. 101, 3980–4000. doi: 10.3168/jds.2017-13839
National Bureau of Statistics Announcement on Cotton Production (2022). National Bureau of Statistics. Available online at: https://www.stats.gov.cn/sj/zxfb/202302/t20230203_1901689.html (accessed March 13, 2025).
National Feed Industry Standardization Technical Committee (2020). Determination Method of Free Gossypol in Feed. Beijing: Standardization Administration of China.
Ni, S., Zhao, D., Li, K., Wu, Y., Yang, S., Chen, X., et al. (2024). Cofermentation of cottonseed meal by the synergistic action of microbial flora with protease and its metabolic kinetic. ACS Food Sci. Technol. 4, 773–785. doi: 10.1021/acsfoodscitech.3c00662
Partow, S., Hyland, P. B., and Mahadevan, R. (2017). Synthetic rescue couples NADPH generation to metabolite overproduction in Saccharomyces cerevisiae. Metab. Eng. 43, 64–70. doi: 10.1016/j.ymben.2017.08.004
Porcelli, V., Vozza, A., Calcagnile, V., Gorgoglione, R., Arrigoni, R., Fontanesi, F., et al. (2018). Molecular identification and functional characterization of a novel glutamate transporter in yeast and plant mitochondria. Biochim. Biophys. Acta. Bioenerg. 1859, 1249–1258. doi: 10.1016/j.bbabio.2018.08.001
Quast, C., Pruesse, E., Yilmaz, P., Gerken, J., Schweer, T., Yarza, P., et al. (2012). The SILVA ribosomal RNA gene database project: improved data processing and web-based tools. Nucleic Acids Res. 41, D590–D596. doi: 10.1093/nar/gks1219
Saminathan, M., Wan Mohamed, W. N., Md Noh, A., Ibrahim, N. A., Fuat, M. A., Kumari Ramiah, S., et al. (2022). Effects of urea-treated oil palm frond on nutrient composition and in vitro rumen fermentation using goat rumen fluid. J. Anim. Physiol. Anim. Nutr. 106, 1228–1237. doi: 10.1111/jpn.13670
Scarcia, P., Palmieri, L., Agrimi, G., Palmieri, F., and Rottensteiner, H. (2017). Three mitochondrial transporters of Saccharomyces cerevisiae are essential for ammonium fixation and lysine biosynthesis in synthetic minimal medium. Mol. Genet. Metab. 122, 54–60. doi: 10.1016/j.ymgme.2017.07.004
Shaani, Y., Nikbachat, M., Yosef, E., Ben-Meir, Y., Friedman, N., Miron, J., et al. (2017). Effect of wheat hay particle size and replacement of wheat hay with wheat silage on rumen pH, rumination and digestibility in ruminally cannulated non-lactating cows. Animal 11, 426–435. doi: 10.1017/S1751731116001865
Shan, G., Buescher, W., Maack, C., Lipski, A., Acir, I.-H., Trimborn, M., et al. (2021). Dual sensor measurement shows that temperature outperforms pH as an early sign of aerobic deterioration in maize silage. Sci. Rep. 11:8686. doi: 10.1038/s41598-021-88082-1
Sun, H. G., Yang, H. M., Wang, Z. Y., Zhang, D. C., Zhang, F. F., and Yang, Z. (2014). Nutrition physiological and immune functions of arginine in animals. Chin. J. Anim. Nutr. 1, 54–62. doi: 10.3969/j.issn.1006-267x.2014.01.008
Tan, S. Y., Wei, L. M., and Wang, F. (2014). Effects of urea on fermentation quality of Sorghum sudanense (Piper) stapt. China Feed 17, 18–19+22. doi: 10.15906/j.cnki.cn11-2975/s.2014.17.002
Van Soest, P. J., Robertson, J. B., and Lewis, B. A. (1991). Methods for dietary fiber, neutral detergent fiber, and nonstarch polysaccharides in relation to animal nutrition. J. Dairy Sci. 74, 3583–3597. doi: 10.3168/jds.S0022-0302(91)78551-2
Wan, J. C., Yu, H., Zhang, Y. H., Zheng, W., and Li, N. (2019). Effects of cellulase and lactic acid bacteria on fermentation quality and in vitro digestibility of cotton stalk silage. Chin. J. Anim. Sci. 4, 101–106.
Wang, C., Qiu, X., Hou, R., Liu, J., Li, L., and Mao, X. (2023). Improvement of soybean meal quality by one-step fermentation with mixed-culture based on protease activity. Innov. Food Sci. Emerg. Technol. 85:103311. doi: 10.1016/j.ifset.2023.103311
Wang, L., Li, A., Shi, J., Liu, K., Cheng, J., Song, D., et al. (2020). Effects of different levels of cottonseed meal on laying performance, egg quality, intestinal immunity and hepatic histopathology in laying hens. Food Agric. Immunol. 31, 803–812. doi: 10.1080/09540105.2020.1774745
Wang, T. Y., Huang, Z. X., Zhang, N., Kareem, K., Sun, X. W., Shang, C. L., et al. (2025). Effects of molasses on the quality, aerobic stability, and ruminal degradation characteristics of mixed ensilage of seed-used zucchini peel residue and corn stalk. Front. Sustain. Food Syst. 9:1560403. doi: 10.3389/fsufs.2025.1560403
Wang, W. K., Li, W. J., Wu, Q. C., Wang, Y. L., Li, S. L., and Yang, H. J. (2021). Isolation and identification of a rumen Lactobacillus bacteria and its degradation potential of gossypol in cottonseed meal during solid-state fermentation. Microorganisms 9:2200. doi: 10.3390/microorganisms9112200
Wang, Q., Guo, S. T., Xin, B., Zhong, C., and Wang, Y. (2024). Recent advances in biosynthesis of L-arginine using engineered microorganisms. Synth. Biol. J. 1–16.
Wang, X. G., Yang, Y. W., Ma, Q., and Zhou, Y. X. (2024). Advances in the application of CNCPS in evaluation of feed nutritional value and prediction of ruminant production performance. Chin. J. Anim. Sci. 4, 52–57.
Wu, G., Bazer, F. W., Burghardt, R. C., Johnson, G. A., Kim, S. W., Knabe, D. A., et al. (2011). Proline and hydroxyproline metabolism: implications for animal and human nutrition. Amino Acids 40, 1053–1063. doi: 10.1007/s00726-010-0715-z
Wu, P., Li, L., Jiang, J., Sun, Y., Yuan, Z., Feng, X., et al. (2020). Effects of fermentative and non-fermentative additives on silage quality and anaerobic digestion performance of Pennisetum purpureum. Bioresour. Technol. 297:122425. doi: 10.1016/j.biortech.2019.122425
Xie, H., Xie, F., Guo, Y., Liang, X., Peng, L., Li, M., et al. (2023). Fermentation quality, nutritive value and in vitro ruminal digestion of Napier grass, sugarcane top and their mixed silages prepared using lactic acid bacteria and formic acid. Grassl. Sci. 69, 23–32. doi: 10.1111/grs.12382
Xu, P. F. (2022). Effects of Adding Molasses and Lactic Acid Bacteria on Fermentation Quality and Rumen Degradation Rate of Cotton Stalk. Shihezi, Xinjiang, China: Shihezi University.
Ye, H., Zhang, W. C., Zou, C. L., Zhang, G. Y., Chen, G. F., and Zhuang, Y. F. (2015). Effects of xylanase on quality of rice straw silage. Chin. Agric. Sci. Bull. 11, 45–49.
Yemm, E. W., and Willis, A. J. (1954). The estimation of carbohydrates in plant extracts by anthrone. Biochem. J. 57, 508–514. doi: 10.1042/bj0570508
Zaidi, S. S.-E.-A., Naqvi, R. Z., Asif, M., Strickler, S., Shakir, S., Shafiq, M., et al. (2020). Molecular insight into cotton leaf curl geminivirus disease resistance in cultivated cotton (Gossypium hirsutum). Plant Biotechnol. J. 18, 691–706. doi: 10.1111/pbi.13236
Zhang, G. Q., Luo, Q. J., Zang, C. J., Li, F. M., and Zhang, J. R. (2018). Nutritional value of cotton stalk and its effects on digestion metabolism of nutrients, growth and mutton safety of sheep. Chin. J. Anim. Nutr. 8, 3247–3257. doi: 10.3969/j.issn.1006-267x.2018.08.044
Zhang, X. Y., Zhao, S. G., Zheng, N., and Wang, J. Q. (2020). Research advances in diversity and function of bacterial urease in Rumen. Chin. J. Anim. Nutr. 12, 5532–5539. doi: 10.3969/j.issn.1006-267x.2020.12.006
Keywords: cotton strawlage, urea, nitrogen metabolism, microbial community, metabolic characteristics
Citation: Zhou S, Zhu Z, Chen X, Pu Q, Liu S, Luo Y, Shao Y, Sun Y, Sun X, Shang C, Shen W, Hua D and Wang X (2025) Study on the effects of urea addition on the fermentation quality, nitrogen metabolism, microbial community, and metabolic characteristics of cotton strawlage. Front. Microbiol. 16:1610850. doi: 10.3389/fmicb.2025.1610850
Received: 13 April 2025; Accepted: 30 May 2025;
Published: 23 June 2025.
Edited by:
Atul P. Kolte, National Institute of Animal Nutrition and Physiology (ICAR), IndiaReviewed by:
Chayon Goswami, Bangladesh Agricultural University, BangladeshTawakalt Ayodele, North Dakota State University, United States
Copyright © 2025 Zhou, Zhu, Chen, Pu, Liu, Luo, Shao, Sun, Sun, Shang, Shen, Hua and Wang. This is an open-access article distributed under the terms of the Creative Commons Attribution License (CC BY). The use, distribution or reproduction in other forums is permitted, provided the original author(s) and the copyright owner(s) are credited and that the original publication in this journal is cited, in accordance with accepted academic practice. No use, distribution or reproduction is permitted which does not comply with these terms.
*Correspondence: Wen Shen, YmdkazA4MEAxNjMuY29t; Dengke Hua, ZGVuZ2tlX2hAMTYzLmNvbQ==; Xinfeng Wang, d3hmLTRAMTYzLmNvbQ==
 Shuaibin Zhou
 Zhenxin Zhu1
 Dengke Hua
 Xinfeng Wang