 Liang Cai1
 Chun-Mei Zeng
- 1Guangxi Medical University, Nanning, Guangxi, China
- 2Department of Cardiology, Yulin First People’s Hospital, The Sixth Affiliated Hospital of Guangxi Medical University Yulin, Yulin, Guangxi, China
- 3Center for Genomic and Personalized Medicine, Guangxi Key Laboratory for Genomic and Personalized Medicine, Guangxi Collaborative Innovation Center for Genomic and Personalized Medicine, Guangxi Medical University, Nanning, Guangxi, China
- 4Department of Ultrasound, Yulin First People’s Hospital, The Sixth Affiliated Hospital of Guangxi Medical University Yulin, Yulin, Guangxi, China
Objective: This study aims to identify potential diagnostic biomarkers for individuals with hypertension and left ventricular hypertrophy (LVH) by characterizing associated clinical features and gut microbiota profiles.
Methods: Participants were classified into three groups: a hypertrophy group (hypertension with LVH, n = 63), a non-hypertrophy group (hypertension without LVH, n = 64), and a control group (healthy participants, n = 33). Clinical parameters were recorded, and fecal samples were analyzed for microbial diversity, abundance, and distribution.
Results: Patients in the hypertrophy group exhibited elevated body mass index (BMI), uric acid, triglycerides, and homocysteine levels, as well as reduced estimated glomerular filtration rate and high-density lipoprotein cholesterol. Structural cardiac changes were more pronounced in this group. Increased BMI and γ-glutamyl transferase levels emerged as independent risk factors for LVH. A significant reduction in Actinobacteria abundance was observed in the hypertrophy group compared to healthy controls. At the genus level, microbial compositions in the non-hypertrophy and control groups were more similar. Blautia was significantly enriched in patients with LVH, while Streptococcus equinus showed increased abundance at the species level (p < 0.05). The area under the receiver operating characteristic curve for gut microbiota markers in distinguishing patients with LVH from healthy controls was 0.839, and 0.796 when differentiating from patients with hypertension but without LVH.
Conclusion: Patients with hypertension and LVH demonstrated distinct metabolic abnormalities and alterations in gut microbiota composition. These findings reported potential microbial biomarkers and pathways for the prevention and management of hypertension-related target organ damage.
1 Introduction
Long-term uncontrolled hypertension is a major contributor to organ damage, particularly affecting the heart, brain, and kidneys. Among these, left ventricular hypertrophy (LVH) represents one of the most prevalent complications and serves as an independent risk factor for cardiovascular events. According to the World Health Organization Global Hypertension Report 2023, the global prevalence of hypertension rose from 650 million to 1.3 billion between 1990 and 2019, with over 30% of individuals with hypertension exhibiting LVH. The severity of LVH is strongly associated with increased cardiovascular disease incidence and elevated mortality risk (Leache et al., 2021).
Recent studies have shown that gut microbiota dysbiosis is not only closely associated with the development of hypertension, but may also contribute to the onset and progression of LVH through multiple mechanisms (Liu et al., 2018; Qu et al., 2022; Cao et al., 2024). These mechanisms involve hemodynamic changes, neuroendocrine activation, inflammatory cell infiltration and cytokine release, oxidative stress, and genetic predisposition (Djekic et al., 2020). However, population-based data concerning the clinical and gut microbiota characteristics of individuals with both hypertension and LVH remain limited.
Comprehensive assessment of clinical profiles and gut microbiota distribution in this population is therefore critical for early identification and prevention of LVH progression, with the potential to improve cardiovascular outcomes. This study examined the clinical indicators and gut microbiota profiles of patients with hypertension and LVH, and assessed their association with the severity of LVH. The findings aim to provide population-level evidence supporting the mechanistic understanding of hypertension-induced cardiac target organ damage, and to inform preventive and early therapeutic strategies for affected individuals.
2 Materials and methods
2.1 General data
A total of 127 patients diagnosed with hypertension at the First People’s Hospital of Yulin City between April 2024 and December 2024 were consecutively enrolled. As determined by cardiac ultrasound findings, participants were categorized into a hypertrophy group (hypertension with left ventricular hypertrophy, n = 63) and a non-hypertrophy group (hypertension without left ventricular hypertrophy, n = 64). Additionally, healthy individuals undergoing routine physical examinations during the same period were recruited as the control group (n = 33).
General demographic data, medical history, lifestyle behaviors, laboratory test results, auxiliary examination findings, and medication use were documented for all participants. Stool samples were collected, and the composition, diversity, and abundance of gut microbiota were analyzed using high-throughput sequencing of amplicons targeting the V3–V4 region of the 16S rRNA gene.
Ethical approval was obtained from the Ethics Committee of the First People’s Hospital of Yulin City (YLSY-IRB-RP-2023022), and written informed consent was obtained from all participants.
2.2 Diagnostic criteria for left ventricular hypertrophy
The left ventricular mass index (LVMI) serves as a primary echocardiographic indicator for the diagnosis of LVH, defined by an LVMI of ≥115 g/m2 in males and ≥95 g/m2 in females (Mancia et al., 2013). End-diastolic left ventricular internal diameter (LVID), interventricular septal thickness (IVST), and left ventricular posterior wall thickness (LVPWT) are measured, and left ventricular mass (LVM) is calculated accordingly. The LVM is then normalized to body surface area (BSA) to obtain the LVMI. The calculation formula is as follows:
2.3 Inclusion and exclusion criteria
2.3.1 Inclusion criteria
Age ≥18 years; diagnosis of primary hypertension based on established clinical guidelines (Hypertension is diagnosed if clinic blood pressure is ≥ 140/90 mmHg on three separate days without antihypertensive medication or home blood pressure monitoring shows an average blood pressure ≥135/85 mmHg over 5 to 7 consecutive days. Patients with a history of hypertension currently taking antihypertensive medication should still be diagnosed with hypertension, even if their blood pressure is below the above diagnostic thresholds); provision of written informed consent.
2.3.2 Exclusion criteria
Absence of a stool sample; diagnosis of secondary hypertension; use of antibiotics or probiotics within 4 weeks prior to stool collection; history of chronic diarrhea lasting more than 1 month, enteritis, or other gastrointestinal diseases; history of radiotherapy or chemotherapy for intestinal or other malignancies; history of long-term heavy alcohol consumption; pregnancy.
2.4 Stool collection
Fresh stool specimens were self-collected by participants using sterile collection tubes pre-chilled at 4 °C. Participants were instructed to collect mid-portion stool (avoiding urine/water contact) immediately after natural defecation, and transfer approximately 100 mg feces into the tube using the provided sterile spatula. The tube was tightly capped and vigorously shaken for 15 s to homogenize the sample with DNA stabilization buffer. All samples were labeled with unique IDs and time of collection, then stored in portable 4 °C coolers with ice packs. Within 2 h, samples were transported to the laboratory, logged into the sample management system, and temporarily stored at −40 °C in a monitored freezer (single-layer placement, ≤24 h). For long-term preservation, samples were transferred on dry ice to designated positions within −80 °C ultra-low freezers.
2.5 16S rDNA sequencing and bioinformatics analysis
The stool samples were transported on dry ice to the testing institution (Wuhan Metware Biotechnology Inc.) for 16S rDNA sequencing and subsequent bioinformatics analysis.
Genomic DNA was extracted from samples using either the CTAB or SDS method. The purity and concentration of the extracted DNA were assessed via agarose gel electrophoresis. Qualified DNA was diluted to 1 ng/μL with sterile water. This diluted DNA served as the template for PCR amplification targeting specific hypervariable regions. Amplification was performed using barcoded primers, Phusion® High-Fidelity PCR Master Mix with GC Buffer (New England Biolabs), and a high-efficiency, high-fidelity polymerase to ensure amplification efficiency and accuracy. PCR products were verified by electrophoresis on a 2% agarose gel. Qualified amplicons were purified using magnetic beads, quantified using a microplate spectrophotometer, and pooled in equimolar amounts based on concentration. The pooled product was re-checked on a 2% agarose gel, and the target bands were excised and purified using a gel extraction kit (Qiagen). Sequencing libraries were constructed using the TruSeq® DNA PCR-Free Sample Preparation Kit. The quality and concentration of the final libraries were assessed using Qubit fluorometry and qPCR. Qualified libraries were sequenced on the Illumina NovaSeq 6000 platform.
Raw sequencing reads were demultiplexed based on their unique barcode and primer sequences, followed by the removal of these adapter sequences. Sequence quality control was performed using fastp1 to obtain high-quality reads. Paired-end reads were then assembled into longer, high-quality fragments (clean tags) using FLASH.2 Potential chimeric sequences were identified and removed from the clean tags by comparing them against a reference database using vsearch,3 resulting in effective tags. All effective tags across samples were clustered into operational taxonomic units (OTUs) at 97% sequence identity using the UPARSE algorithm within USEARCH.4 Alternatively, amplicon sequence variants (ASVs) were generated using a denoising method. Taxonomic annotation of OTUs/ASVs was performed against the SILVA SSU rRNA database5 using the Mothur method with a confidence threshold of 0.8 to 1.0. Community composition was subsequently analyzed at each taxonomic level.
2.6 Statistical analysis
Statistical analysis was conducted using SPSS version 27.0. Categorical variables were presented as counts and percentages (n, %), and comparisons between groups were performed using either the chi-square test or Fisher’s exact test, as appropriate. Continuous variables with normal distribution were expressed as mean ± standard deviation (SD). Comparisons among three groups were performed using one-way analysis of variance, while comparisons between two groups were conducted using the independent samples t-test. For continuous variables not conforming to a normal distribution, non-parametric tests were applied for group comparisons.
Multivariate logistic regression analysis was used to assess the association between relevant clinical indicators and the presence of LVH. The phyloseq and vegan packages in R were used to calculate alpha diversity indices, including Shannon, Simpson, ACE, and Chao1. Dilution and species accumulation curves were generated using R software. Differences in alpha diversity indices among groups were analyzed, with the Kruskal–Wallis test applied for comparisons across the three groups.
For beta diversity analysis, the Jaccard distance was computed using the phyloseq package, and principal coordinate analysis (PCoA) plots were generated. Differences in beta diversity among groups were assessed using the Kruskal–Wallis test. Linear discriminant analysis effect size (LEfSe) was used to compare the relative abundance of bacteria at the genus level between groups, with the threshold for LDA score set at 4. Differential bacterial taxa between groups were identified through LEfSe analysis.
A random forest prediction model was constructed to assess the discriminatory capacity of microbial features, and receiver operating characteristic curves were plotted accordingly. All statistical tests were two-sided, and a value of p < 0.05 was considered statistically significant.
3 Results
3.1 Clinical characteristics of the study participants
A total of 160 stool samples were consecutively collected from 63 patients with hypertension and left ventricular hypertrophy (hypertrophy group, n = 63), 64 patients with hypertension without LVH (non-hypertrophy group, n = 64), and 33 healthy individuals (control group, n = 33).
Detailed clinical characteristics of the three groups are presented in Table 1. The mean age of participants was 51.9 ± 14.9 years, with 85 participants (53.1%) being male. The proportion of male participants was higher in the hypertrophy group. Body mass index (BMI) (p < 0.001; p = 0.001), uric acid (p < 0.001; p = 0.013), triglycerides (p = 0.015; p = 0.028), homocysteine (p = 0.025; p = 0.035), alkaline phosphatase (p = 0.013; p = 0.037), and γ-glutamyl transferase (p = 0.005; p < 0.001) levels were significantly elevated in the hypertrophy group compared to the control and non-hypertrophy groups. In contrast, estimated glomerular filtration rate (p < 0.001; p < 0.001) and high-density lipoprotein cholesterol (HDL-C) (p = 0.003; p = 0.038) levels were significantly lower. With respect to cardiac structural parameters, the left atrial anteroposterior diameter (p < 0.001; p < 0.001), right ventricular internal diameter (p = 0.019; p = 0.026), and E/e′ ratio (p < 0.001; p = 0.005) were significantly increased in the hypertrophy group when compared to the control and non-hypertrophy groups. Additionally, the use of calcium channel blockers (57.1%, p = 0.027) and statins (73.0%, p = 0.013) was more frequent in the hypertrophy group.
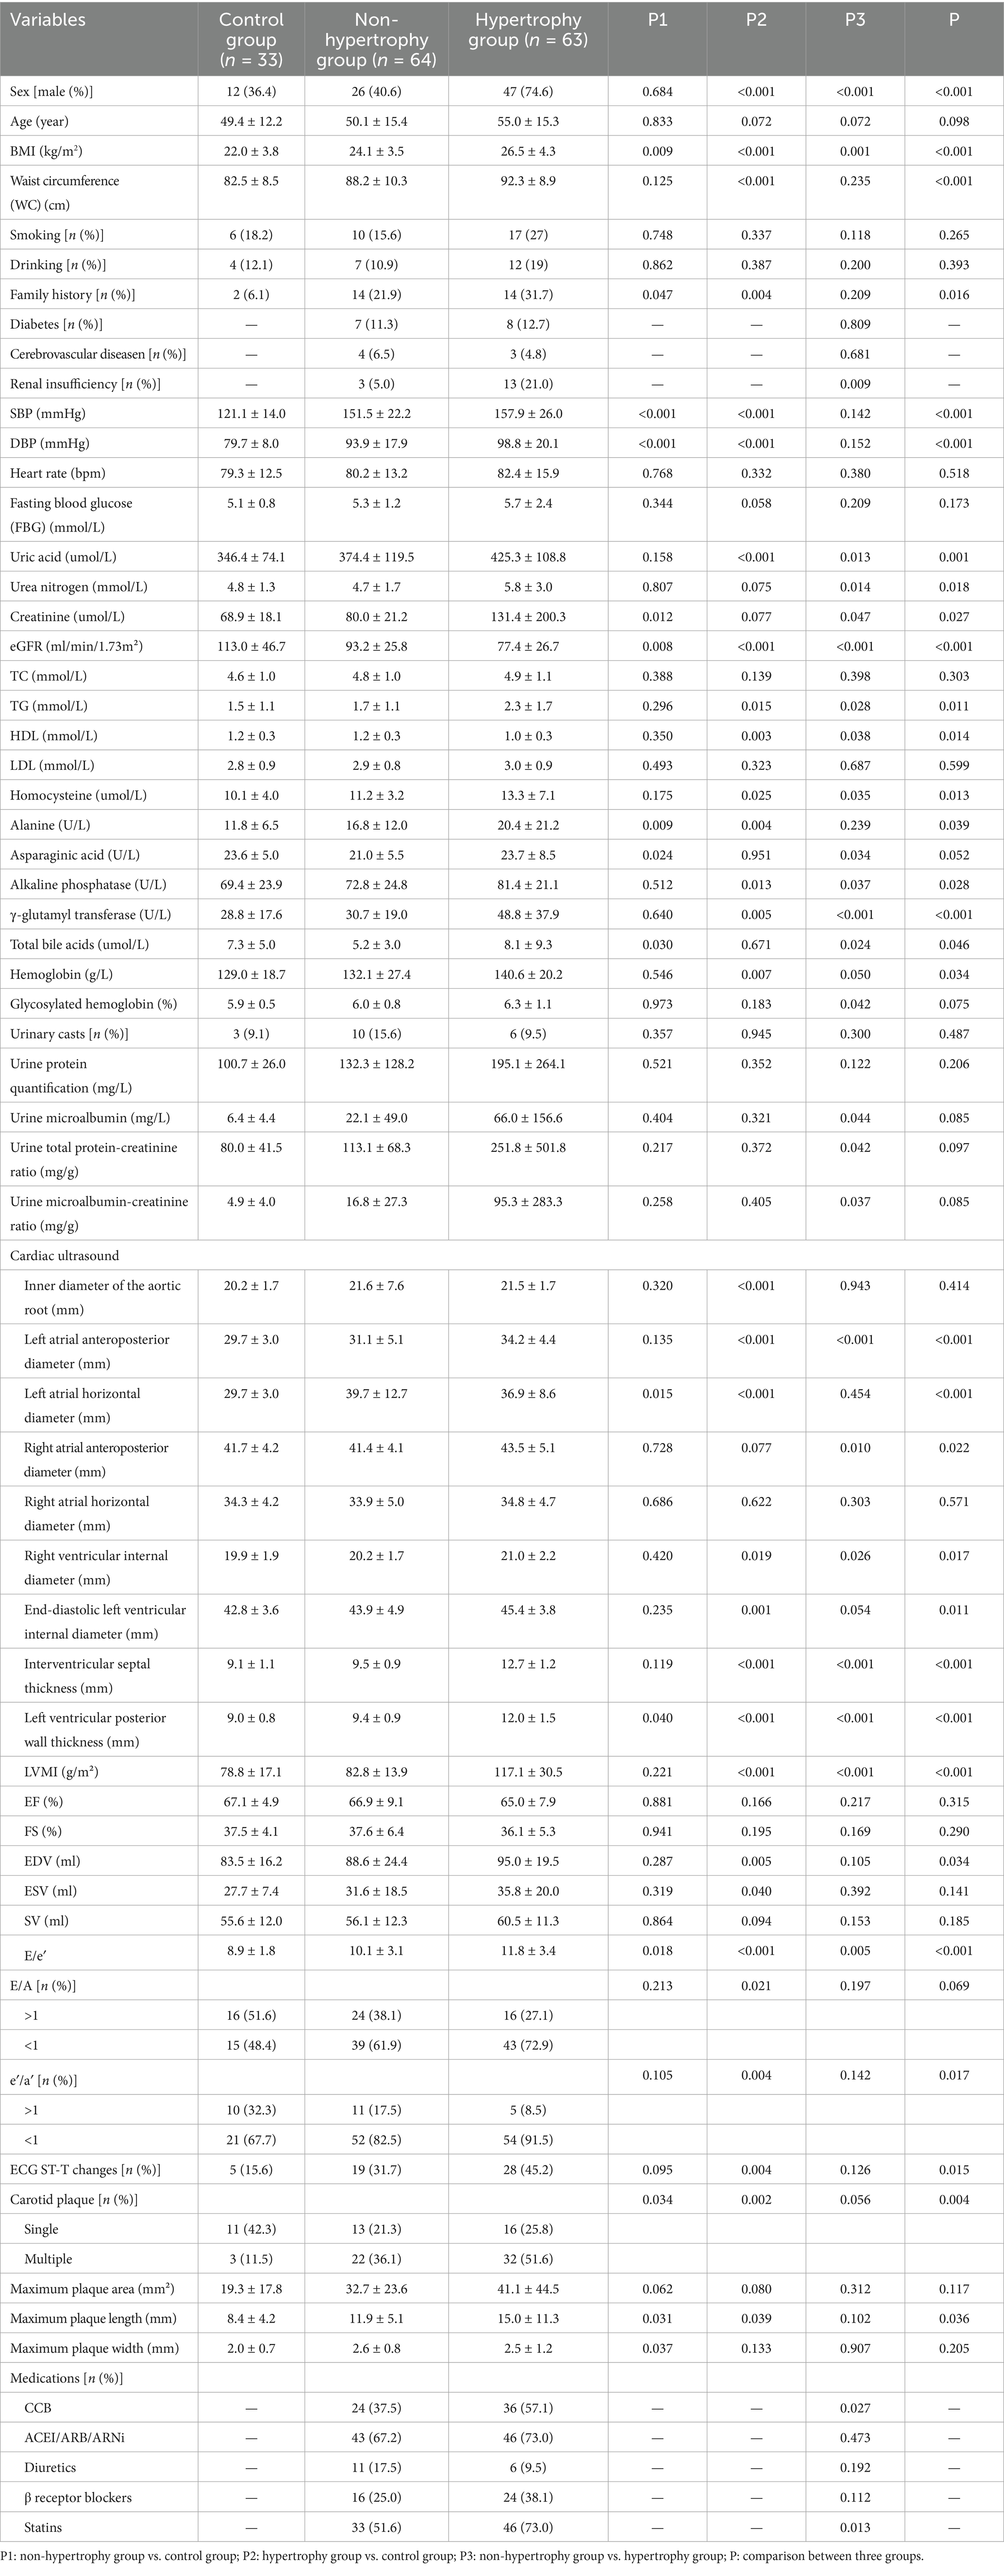
Table 1. Characteristics of clinical data.
3.2 Multivariate analysis of LVH
LVH was set as the dependent variable (2 = hypertension with LVH, 1 = hypertension without LVH), and variables including sex, BMI, renal function, blood lipid levels, uric acid, and homocysteine were included as independent variables in a multivariate logistic regression analysis. An increase in BMI and γ-glutamyl transferase levels were identified as independent risk factors for LVH [BMI: OR = 1.316, 95% CI: 1.089–1.590, p = 0.004; γ-glutamyl transferase: OR = 1.026, 95% CI: 1.003–1.051, p = 0.029] (Table 2).
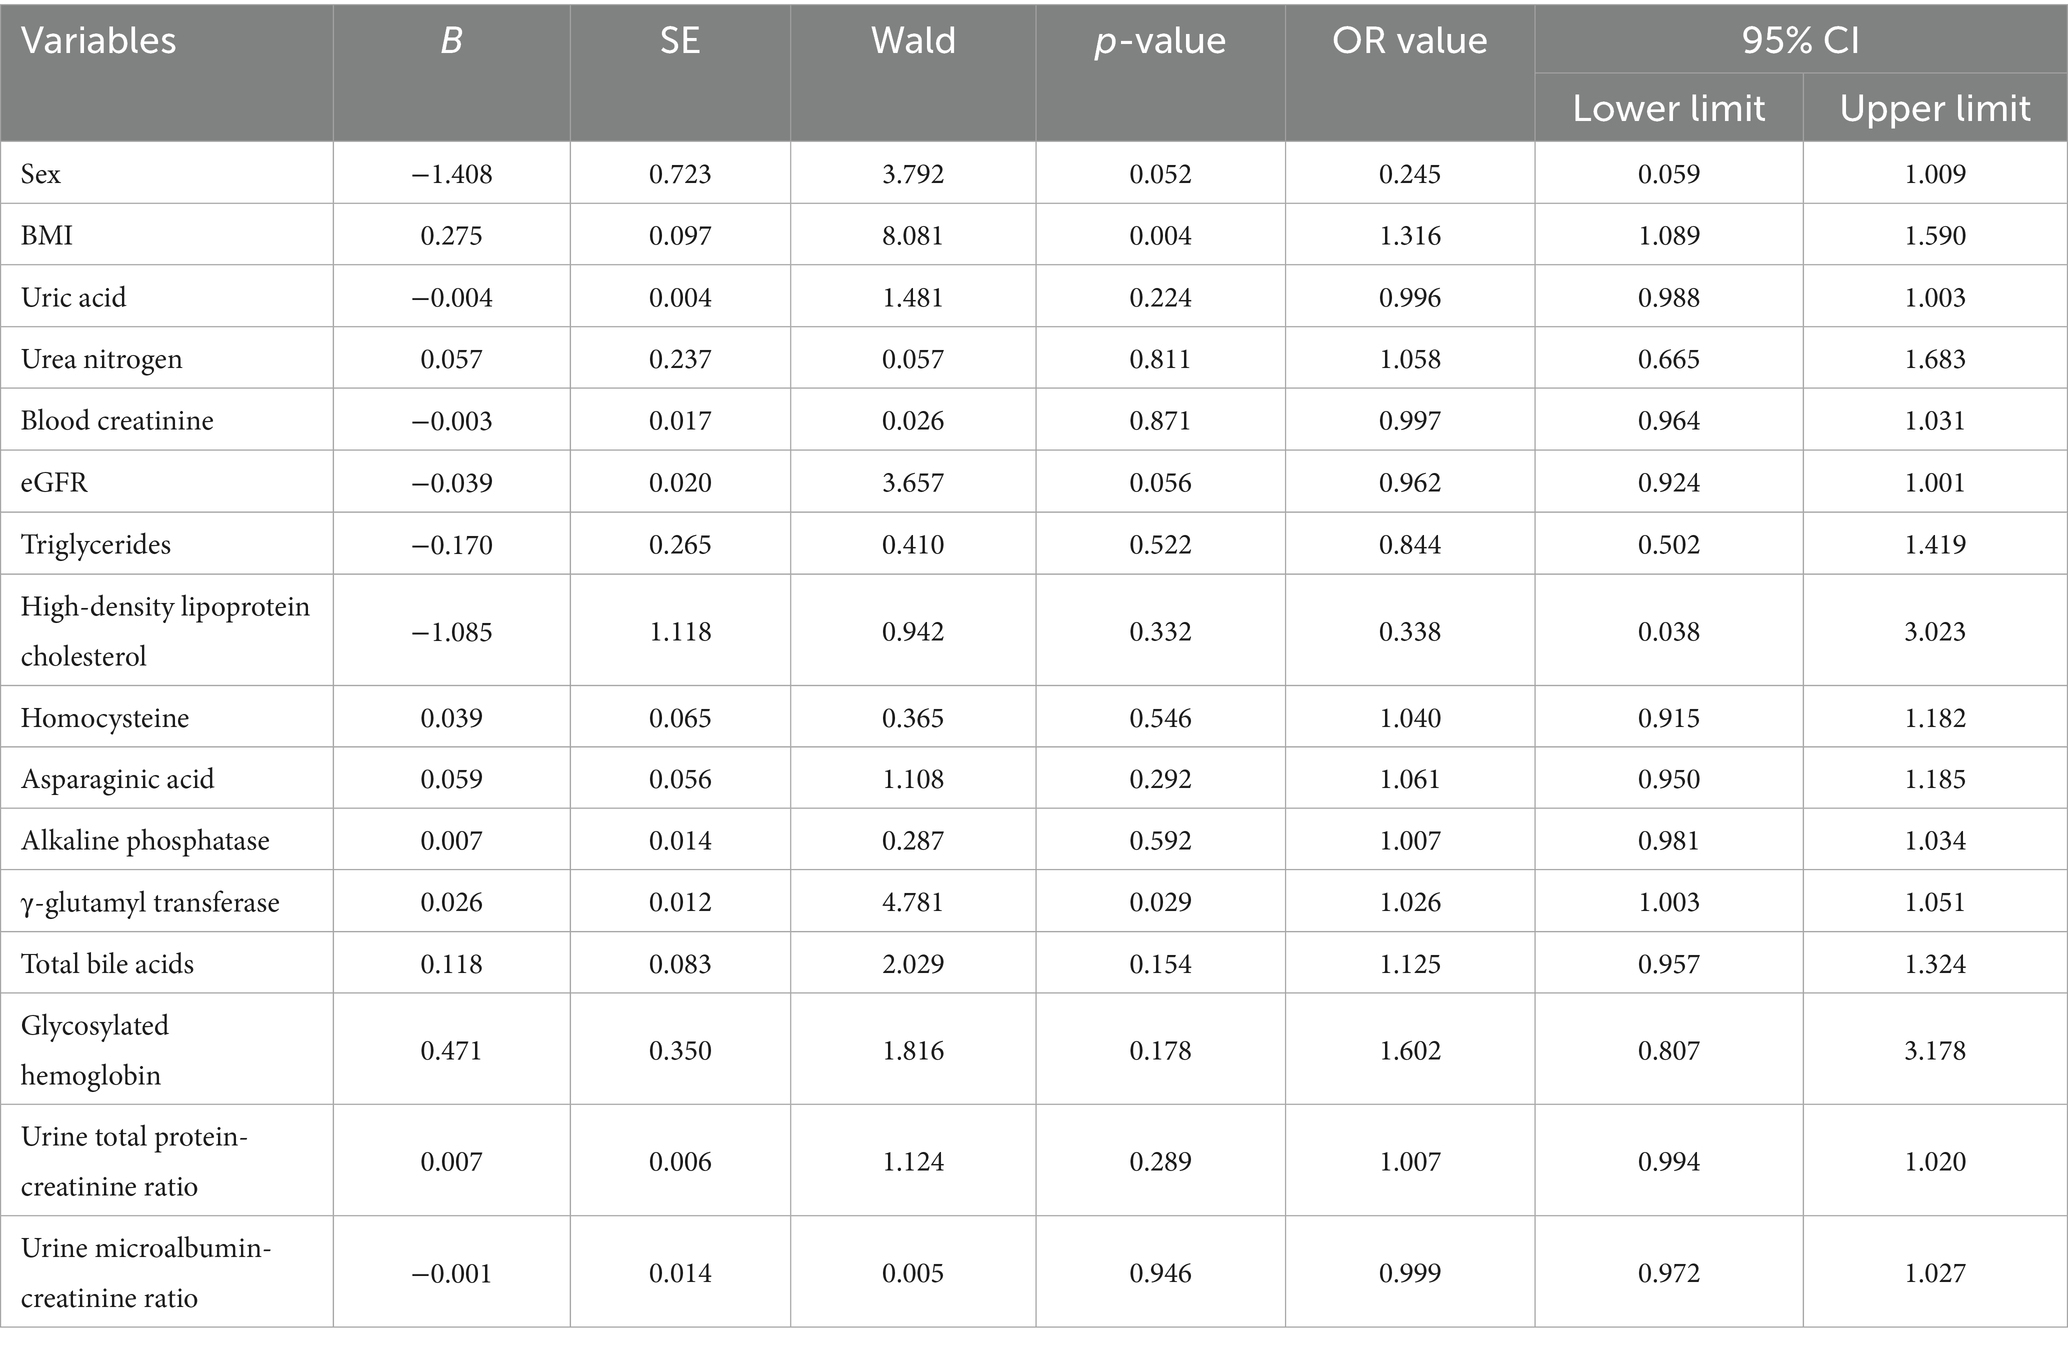
Table 2. Results of multivariate logistic regression analysis of LVH.
3.3 Gut microbiota analysis
3.3.1 Results of operational taxonomic units (OTUs) analysis of gut microbiota
OTUs were clustered at a 97% sequence similarity threshold, and the intersection of OTUs among the three groups was analyzed. A Venn diagram depicted that a total of 532 OTUs were identified across all groups, with 18 unique to the control group, 42 unique to the non-hypertrophy group, and 30 unique to the hypertrophy group (Figure 1). The number of sequencing reads generated for each sample were provided in Supplementary Table S1. The sequencing data were deposited to Metware Cloud with project number MWY-24-7280.6 All data generated in this study are available on reasonable request.
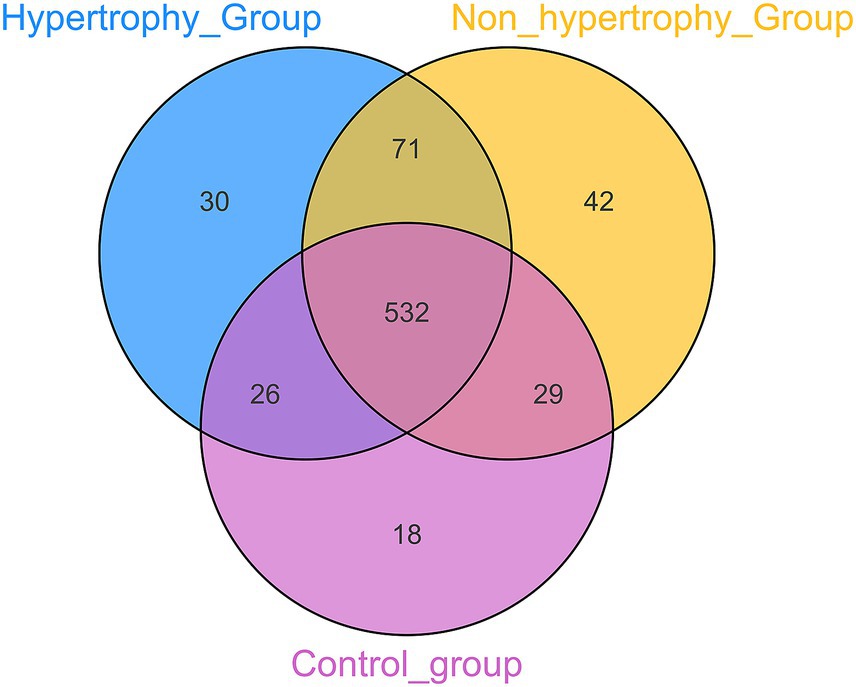
Figure 1. Venn diagrams of the OTU of intestinal flora among different groups.
3.3.2 Alpha diversity analysis
To assess the adequacy of the sample size for capturing species richness, dilution curves and species accumulation box plots were generated by progressively increasing the sequencing depth through random sampling (Figures 2A,B). The observed plateau in the curves with increasing sample size showed that the sequencing depth was sufficient, and the data were stable.
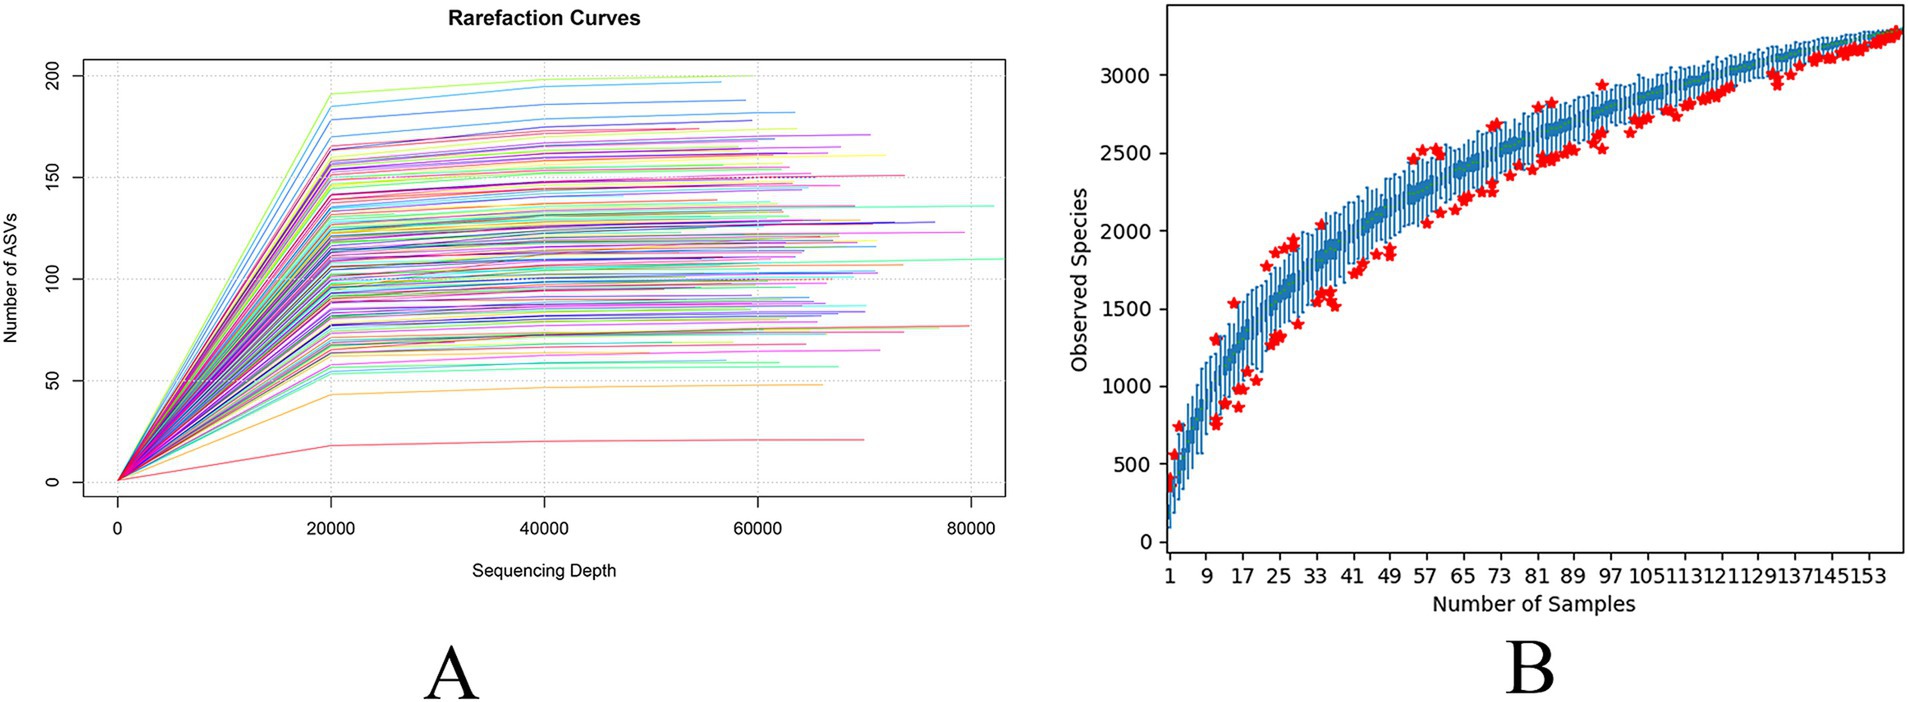
Figure 2. Dilution curves (A) and species accumulation box plots (B) of sequencing data.
Alpha diversity of the gut microbiota was assessed among the hypertrophy, non-hypertrophy, and control groups using the Shannon, Simpson, ACE, and Chao1 indices. No statistically significant differences in alpha diversity were observed among the three groups (p > 0.05) (Figures 3A–D).
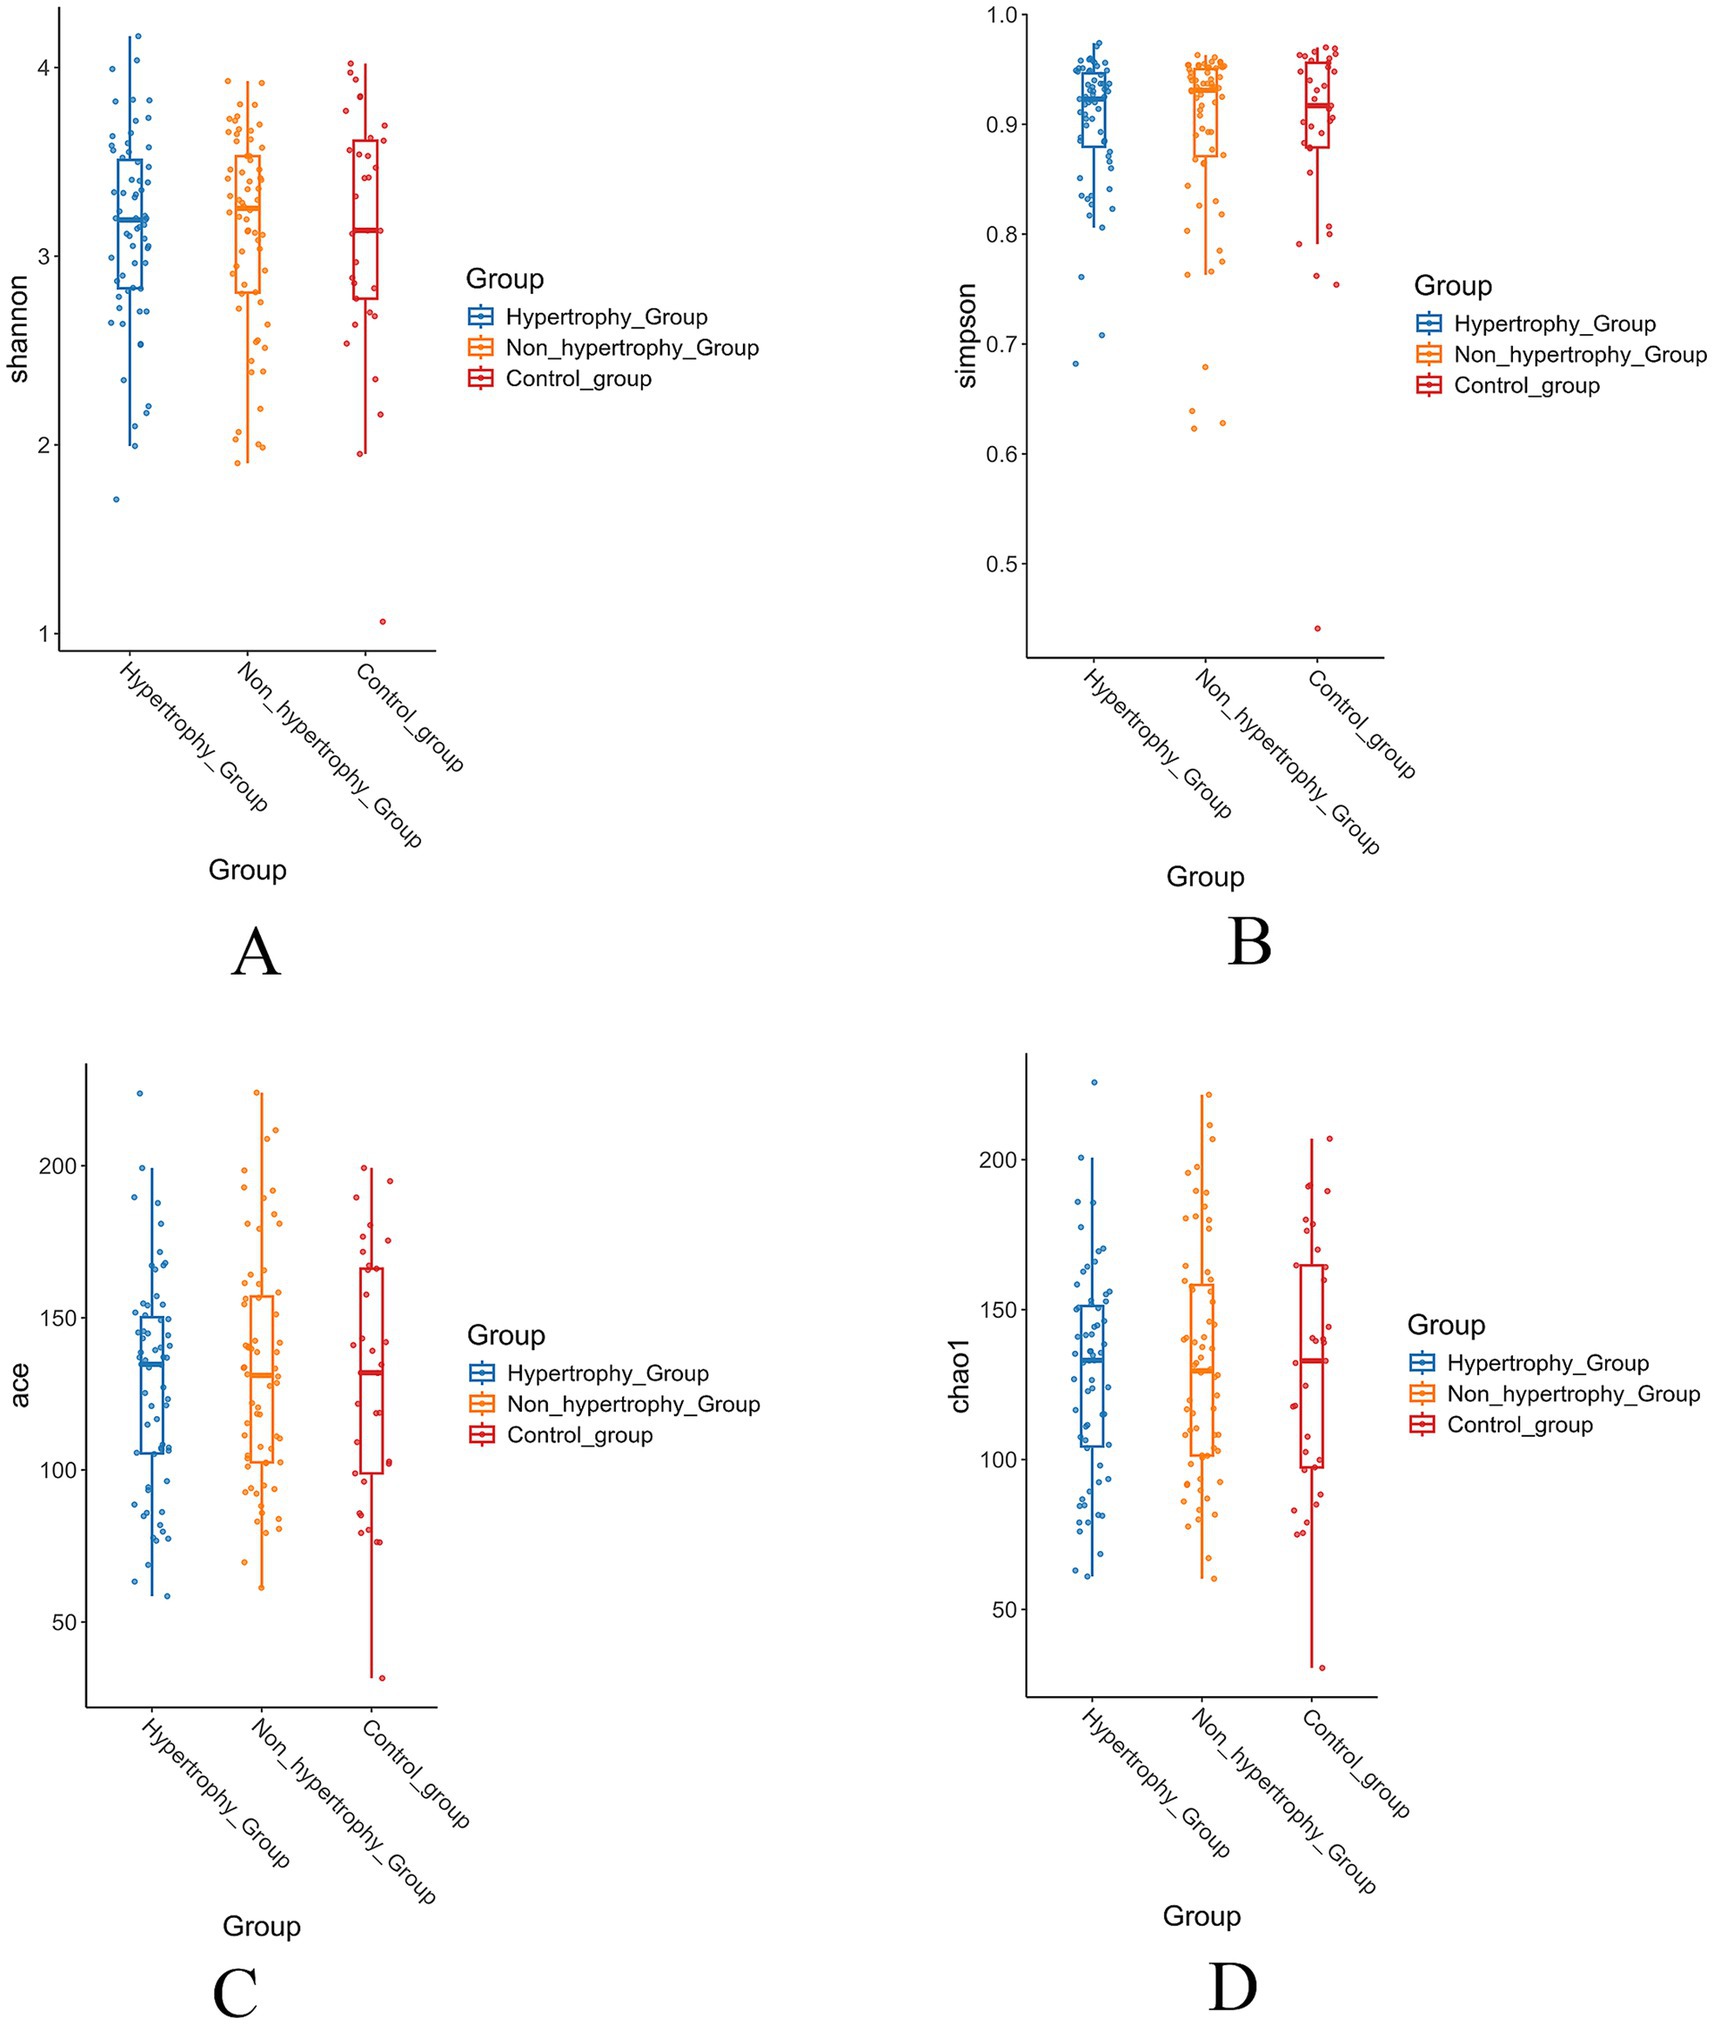
Figure 3. The results of alpha diversity of intestinal flora in each group (A: Shannon index; B: Simpson index; C: Ace index; D: Chao1 index).
3.3.3 Beta diversity analysis
PCoA was conducted on all samples using the Jaccard distance algorithm to assess beta diversity differences among the hypertrophy, non-hypertrophy, and control groups. The results (Figure 4) showed a statistically significant difference in β diversity among the three groups (Adonis: R2 = 0.016, p = 0.031).
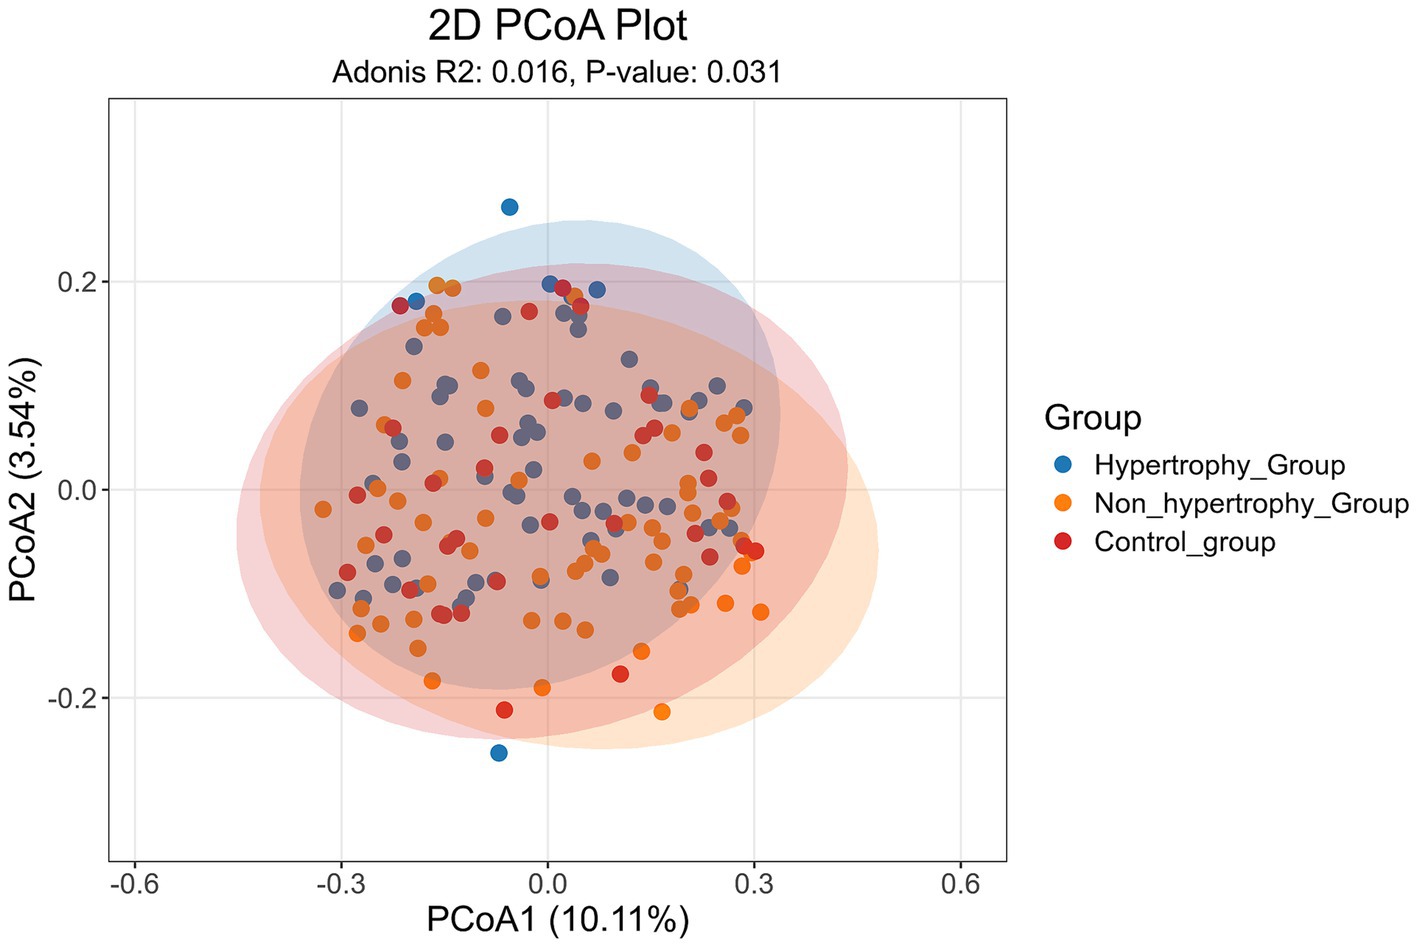
Figure 4. Score charts of PCoA analysis of intestinal flora.
To further assess intergroup differences in beta diversity, both unweighted and weighted UniFrac distance algorithms were applied. The unweighted UniFrac analysis showed statistically significant differences in beta diversity between the hypertrophy and control groups, as well as between the non-hypertrophy and control groups (p < 0.001 for both comparisons) (Figure 5A). Similar results were observed using the weighted UniFrac distance algorithm (p = 0.032 and p = 0.042, respectively) (Figure 5B). However, no significant difference in beta diversity was observed between the hypertrophy and non-hypertrophy groups (p = 0.069 and p = 0.856 for unweighted and weighted UniFrac, respectively).
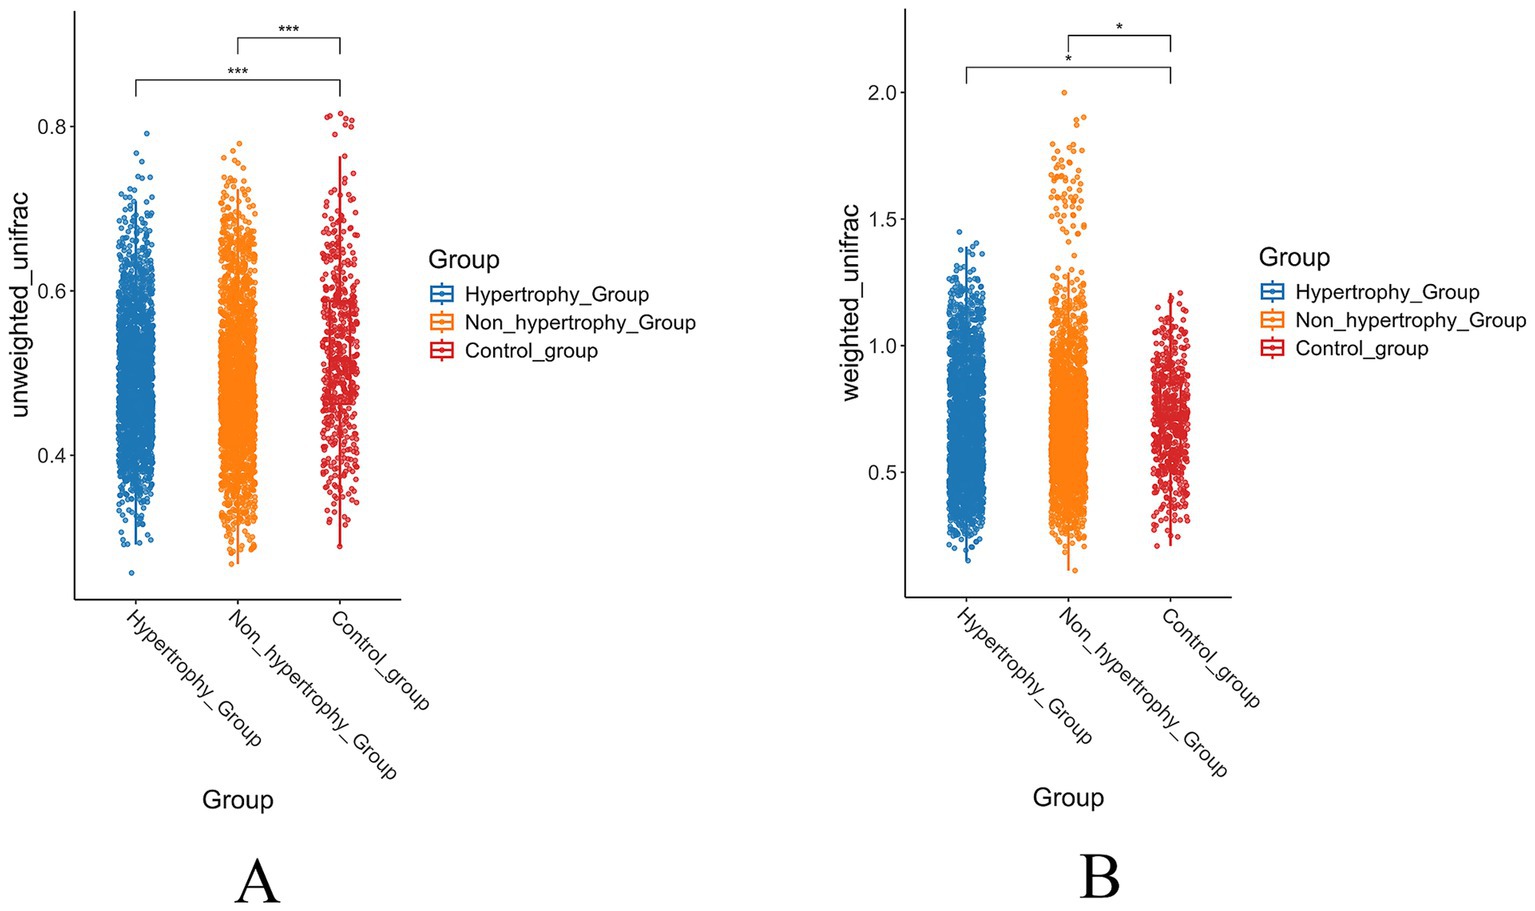
Figure 5. The results of beta diversity of intestinal flora in each group (A: unweighted UniFrac distance; B: weighted UniFrac distance).
These findings showed that individuals with hypertension, regardless of the presence of LVH, share similar gut microbial communities, whereas significant differences exist when compared with healthy individuals.
3.4 Analysis of community structure differences between groups
A significance analysis of community structure differences between groups was conducted based on the ranked Bray–Curtis distance values. The results showed statistically significant differences in microbial community structure between the hypertrophy and non-hypertrophy groups (p = 0.019) (Figure 6C). However, no significant differences were observed between the hypertrophy and control groups or between the non-hypertrophy and control groups (p = 0.260 and p = 0.331, respectively) (Figures 6A,B).
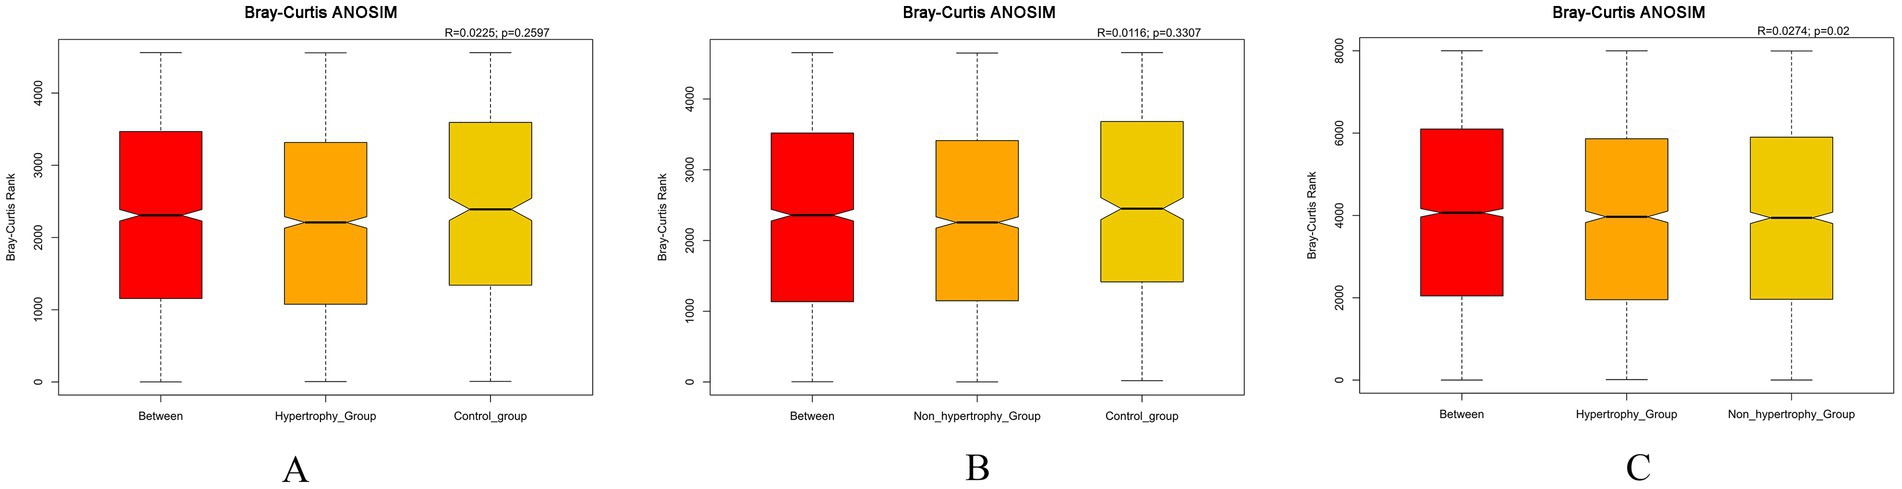
Figure 6. Bray–Curtis ANOSIM differential analysis among different groups (A: hypertrophy group vs. control group, R = 0.0225, p = 0.2597; B: non-hypertrophy group vs. control group, R = 0.0116, p = 0.3307; C: hypertrophy vs. non-hypertrophy group, R = 0.0274, p = 0.02).
3.5 Analysis of microbiota composition between the three groups
3.5.1 Analysis of the relative abundance of microbiota between groups
The top 10 most abundant taxa at both the phylum and genus levels were selected to generate cumulative histograms, which visually illustrated the average relative abundance of dominant taxa across the sample groups. At the phylum level, Firmicutes, Bacteroidetes, and Proteobacteria were predominant within the gut microbiota. A significant reduction in the relative abundance of Actinobacteria was observed in the hypertrophy group compared to the control group (p = 0.049) (Figure 7A). At the genus level, the microbial composition in the non-hypertrophy group more closely resembled that of the control group (Figure 7B).
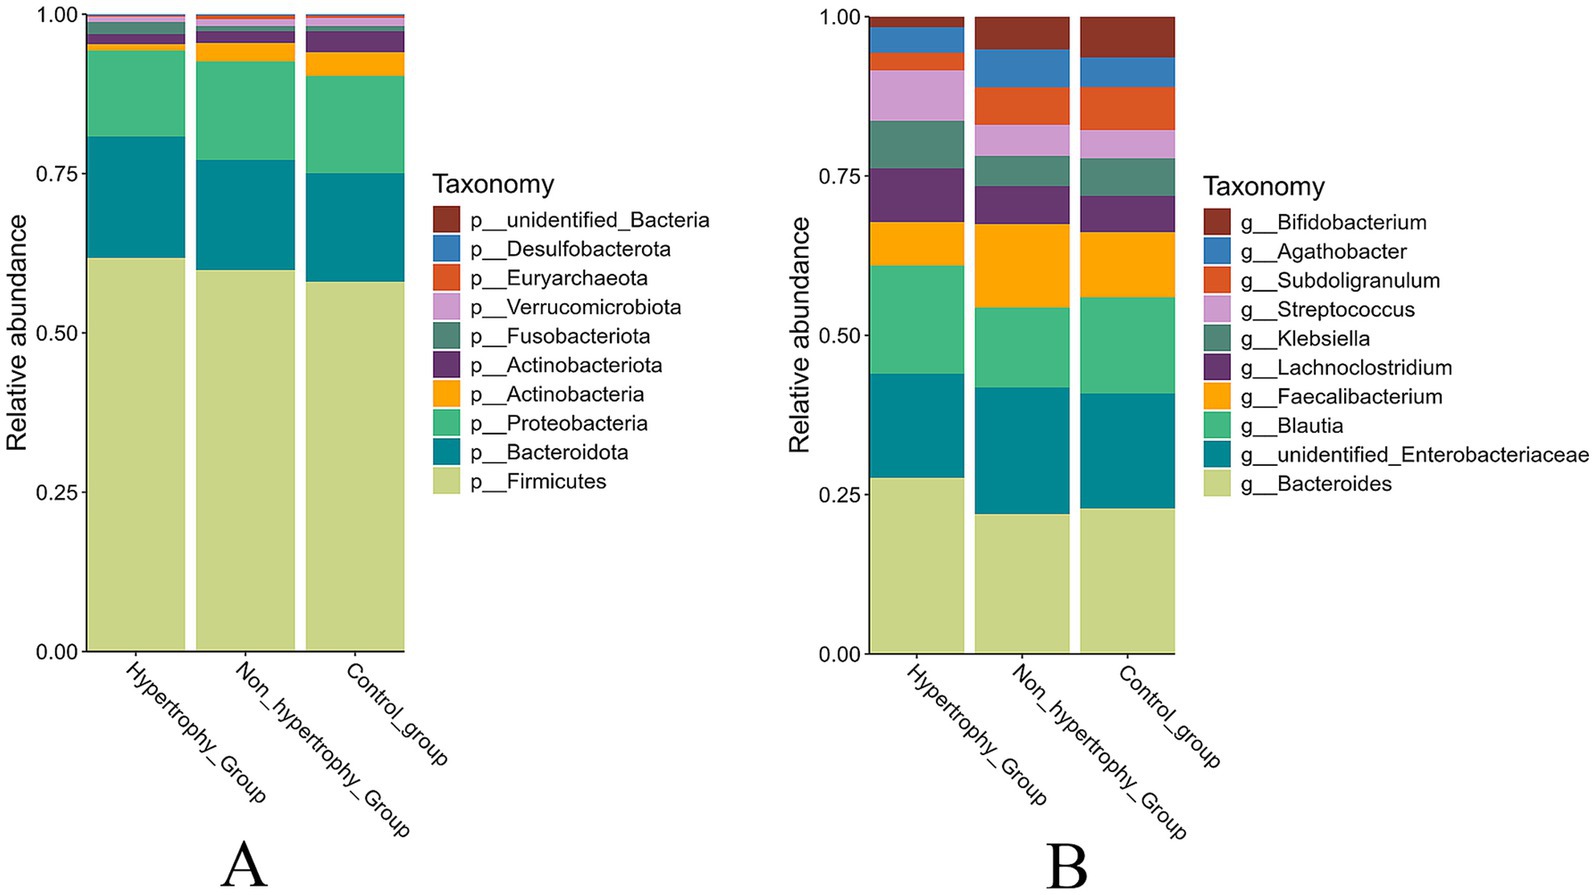
Figure 7. The relative abundance of taxonomy of the intestinal microbiota among different groups (A: phylum level; B: genus level).
3.5.2 Differential species analysis between groups
The LEfSe method was applied to identify differential bacterial taxa among the three groups. Higher abundances of Bifidobacterium and Bifidobacterium longum were observed in the control group at the genus and species levels, respectively. At the species level, an increased enrichment of Streptococcus equinus was found in the hypertrophy group (p < 0.05) (Figure 8A). When compared with the non-hypertrophy group, the hypertrophy group exhibited greater enrichment of Blautia at the genus level. Conversely, patients in the non-hypertrophy group exhibited significantly higher relative abundances of Actinobacteria (phylum level), Bifidobacteriaceae (family level), Subdoligranulum and Faecalibacterium (genus level), and Faecalibacterium prausnitzii (species level) (p < 0.05) (Figure 8B).
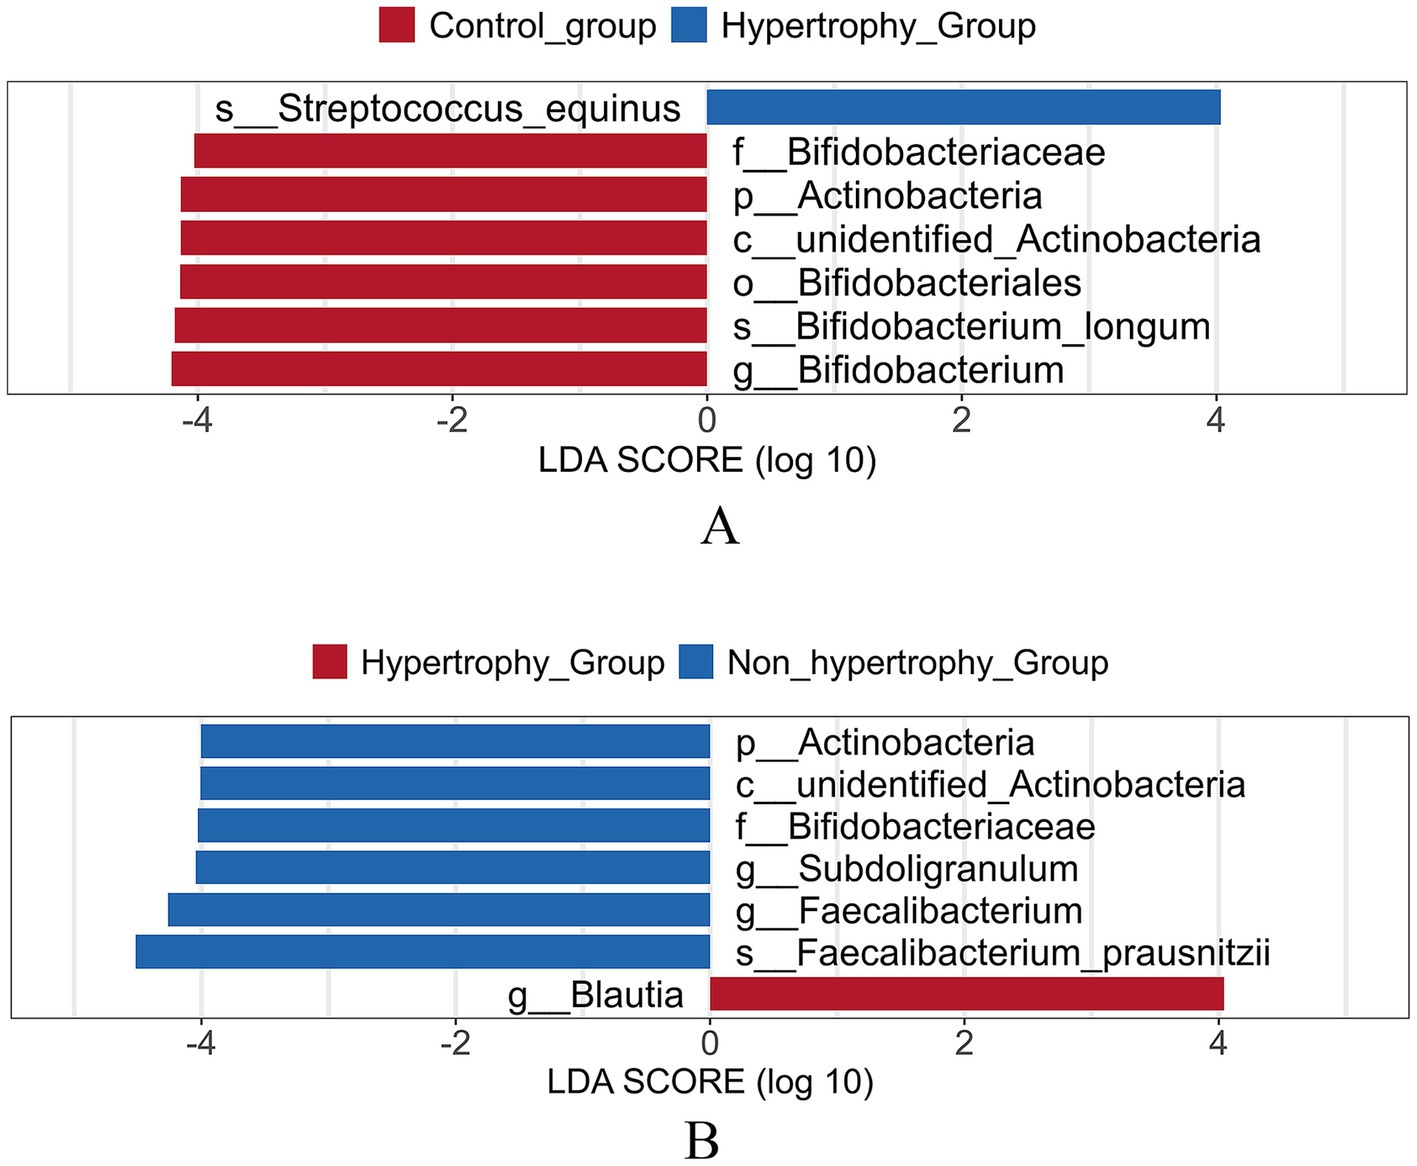
Figure 8. Linear discriminant analysis effect size (LEfSe) analysis of different species of intestinal flora among different groups (A: hypertrophy group vs. control group; B: hypertrophy group vs. non-hypertrophy group).
3.6 Random forest analysis
The mean decrease accuracy and mean decrease gini metrics were used to compare and rank the importance of gut bacterial species associated with hypertension and LVH (Figures 9A,C). A random forest prediction model was constructed based on the gut microbiota profiles.
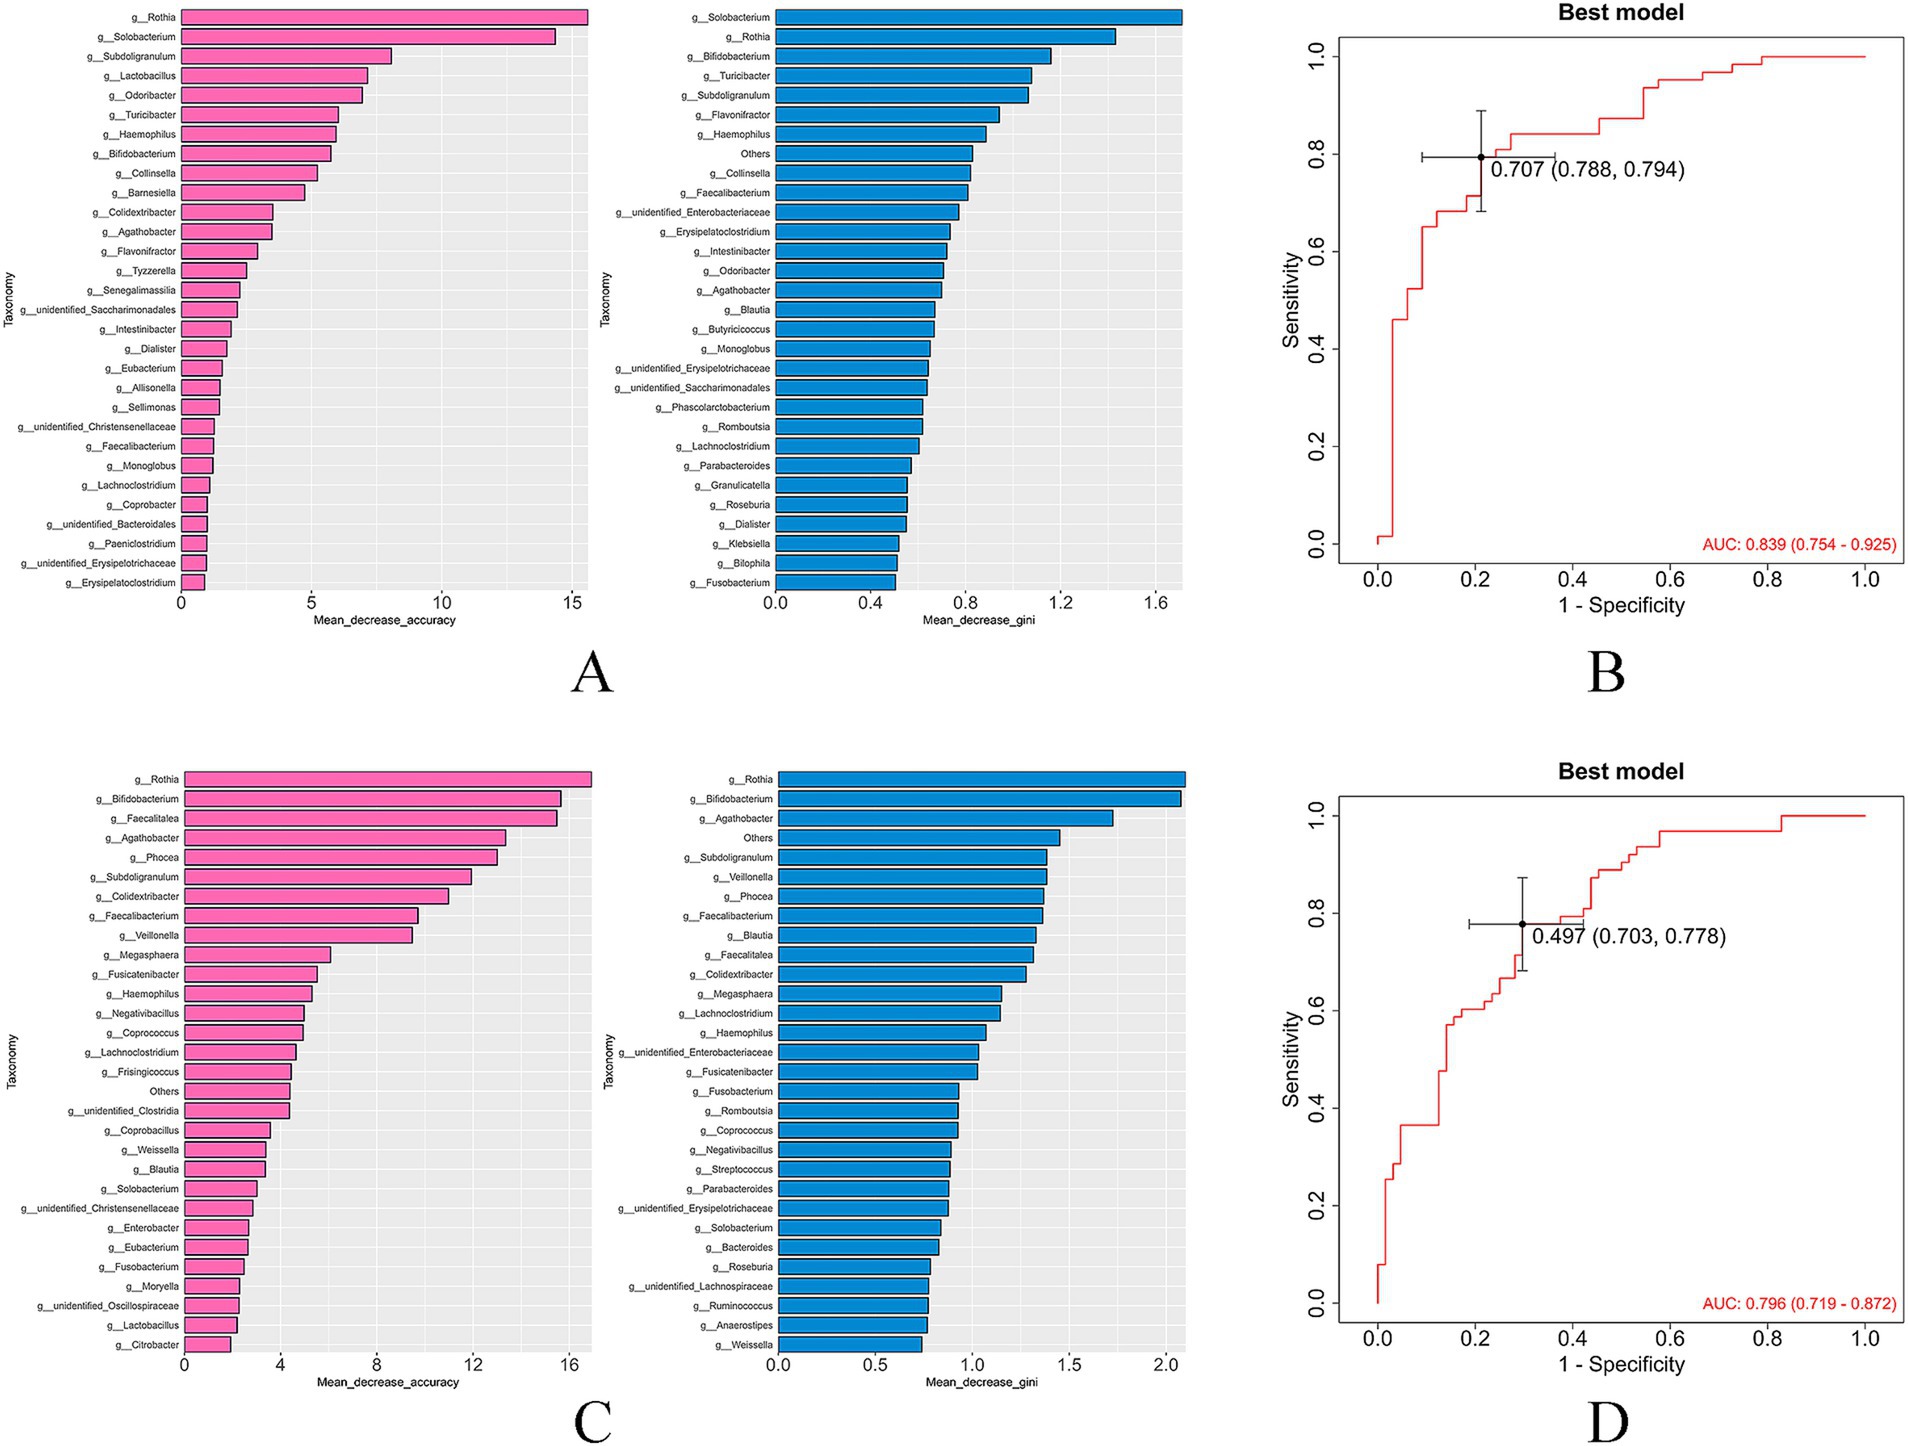
Figure 9. Ranking of the importance of bacteria and ROC curve for diagnosing LVH of based on random forest model (A,B: hypertrophy group vs. control group; C,D: hypertrophy group vs. non-hypertrophy group).
The results demonstrated that the gut microbiota exhibited substantial diagnostic value in identifying hypertension with LVH. The model achieved an area under the curve (AUC) of 0.839 for distinguishing patients in the hypertrophy group from healthy individuals (Figure 9B), and an AUC of 0.796 for distinguishing patients in the hypertrophy group from those in the non-hypertrophy group (Figure 9D), indicating strong predictive performance.
4 Discussion
Hypertension is recognized as the most common cause of pathological myocardial hypertrophy and represents a significant independent risk factor for adverse cardiovascular events and mortality. In this study, uric acid levels were notably higher in patients with hypertension and LVH. Elevated serum uric acid has been associated with increased risk of hypertension and microalbuminuria, whereas the modulation of gut microbiota dysbiosis reduces inflammation, lowers serum uric acid levels, and improves renal function (Bjornstad et al., 2019; Liu et al., 2025). Hyperhomocysteinemia is frequently observed in individuals with hypertension. Impaired homocysteine metabolism and clearance, along with abnormal methylation and transsulfuration processes, contribute to cellular injury and organ dysfunction, which are key mechanisms underlying hypertension (Weber et al., 2016). Furthermore, abnormalities in bile acid and lipid metabolism represent another common pathological feature in hypertensive populations. A study conducted in Japan demonstrated that gut microbiota dysbiosis significantly affects both blood pressure regulation and lipid metabolism (Takagi et al., 2020). In this study, patients with hypertension and LVH showed significantly elevated triglyceride levels and reduced HDL-C levels.
Previous studies have reported that stress overload in individuals with hypertension induces mechanical stretching of cardiomyocytes, thereby activating intracellular signaling pathways that lead to the expression of genes and the synthesis of structural proteins such as actin and myosin (Han et al., 2024). However, the development of LVH in hypertensive individuals is not solely attributable to hemodynamic overload resulting from elevated blood pressure. Clinical observations have shown that in some cases, the hypertrophic myocardium remains unremitted despite long-term, well-controlled blood pressure (Devereux et al., 2004). Furthermore, animal studies have demonstrated that spontaneously hypertensive rats can develop LVH prior to the onset of elevated blood pressure (Kundu et al., 2015).
An increasing body of evidence suggests that gut microbiota contribute significantly to the pathogenesis and progression of hypertension (Avery et al., 2021). Prior studies have reported reduced alpha diversity of the gut microbiota in individuals with hypertension, as shown by a lower Shannon index, which has been found to be negatively correlated with blood pressure. However, no significant differences were observed in the Simpson, ACE, or Chao1 indices (Cai et al., 2023; Tsiavos et al., 2024). In contrast, the present study did not identify any significant differences in alpha diversity among the groups. This discrepancy may reflect the stage-specific microbial dynamics: early hypertension may exhibit diversity loss, whereas LVH development (as in our cohort) could be driven by specific pathobiont expansion rather than global diversity collapse. Additionally, examination of baseline characteristics showed a higher proportion of male participants in the hypertensive group with LVH, and it is possible that sex-based differences may influence the composition of the gut microbiota (Sharma et al., 2025).
Prior studies have shown that individuals with hypertension frequently exhibit gut microbiota dysbiosis, characterized by an overgrowth of potentially pathogenic taxa and a reduction in beneficial microbial populations. This dysbiosis may contribute to the pathogenesis of hypertension and the progression of target organ damage. For instance, this study demonstrated that the relative abundances of Firmicutes and Bacteroidetes were elevated in patients with hypertension and LVH, whereas Actinobacteria were significantly reduced.
Microbial imbalances may impair intestinal barrier function, facilitating the translocation of endotoxins—such as lipopolysaccharides (LPS)—into the systemic circulation. This process can trigger a systemic inflammatory response, thereby contributing to the development of multiple conditions, including insulin resistance, dyslipidemia, and cardiovascular disease (Moludi et al., 2020). LPS upregulates the expression of inflammation-related genes and increases circulating levels of inflammatory mediators, such as tumor necrosis factor-α and interleukin-6, which may inhibit mitochondrial fatty acid oxidation in cardiomyocytes and consequently impair myocardial function (Zou et al., 2022). Additionally, LPS may promote the progression of atherosclerosis by activating the Toll-like receptor 4 signaling pathway and enhancing platelet aggregation (Zhou et al., 2018). These inflammatory responses are considered potential mechanisms contributing to the development of LVH in individuals with hypertension.
Furthermore, the intestinal microbiota can produce a rich group of metabolites, whose levels are closely related to human health. Gut microbiota-derived metabolites, including short-chain fatty acids (SCFAs), bile acids, and trimethylamine N-oxide (TMAO), have also been strongly linked to cardiovascular disease. SCFAs, generated through the fermentation of dietary fiber by gut microbiota, possess anti-inflammatory and metabolic regulatory properties (Chen et al., 2020). These metabolites attenuate myocardial remodeling associated with hypertension by activating G protein-coupled receptors, such as GPR43 and GPR109A (Kaye et al., 2020). Consequently, reductions in SCFA levels due to microbial dysbiosis may represent an additional contributing factor in the development of LVH in hypertensive individuals. TMAO, another key microbial metabolite, has been implicated in vascular inflammation, foam cell formation, atherogenesis, and increased risk of platelet overactivation and thrombosis (Koeth et al., 2019; Zhu et al., 2016; Seldin et al., 2016). It is hypothesized that changes in the composition of the gut microbiota may exacerbate LVH by altering the levels of such metabolites. In an animal model study conducted by Li et al., dietary-induced elevation of TMAO levels was found to promote ventricular hypertrophy and fibrosis via the Smad3 signaling pathway. Inhibition or reduction of TMAO production through modulation of gut microbiota may thus represent a potential therapeutic strategy for the prevention and treatment of ventricular hypertrophy (Li et al., 2019).
Currently, it is proposed that the gut microbiota may serve as a promising therapeutic target for hypertension management in the future (Mahgoup, 2025). Modulation of the composition and function of the gut microbiota through dietary interventions or probiotic supplementation has been reported to exert beneficial effects on both hypertension and LVH (Xue et al., 2021; Mähler et al., 2020). Additionally, fecal microbiota transplantation (FMT), an emerging therapeutic strategy, has demonstrated the potential to restore microbial balance and reduce blood pressure in individuals with hypertension (Fan et al., 2022). In a hypertensive rat model treated with angiotensin receptor blockers, FMT significantly lowered systolic and mean arterial pressures following ARB administration, and further reduced vascular injury and collagen deposition (Li et al., 2024). These findings propose that modulation of the gut microbiota via FMT may confer protective effects against hypertensive LVH.
In summary, our findings reported that patients with hypertension and LVH exhibited a higher prevalence of metabolic disturbances, including hyperuricemia, hyperhomocysteinemia, and hypertriglyceridemia, along with a greater susceptibility to renal impairment and more pronounced cardiac remodeling. Significant changes in the abundance, diversity, and structural composition of the gut microbiota were observed in patients with hypertension and LVH. Bifidobacterium were more abundant among healthy individuals. In contrast, patients with hypertension and LVH demonstrated a marked reduction in the relative abundance of Actinobacteria and increased enrichment of Streptococcus equinus. The microbial structure in patients with hypertension without LVH more closely resembled that of healthy individuals. The above findings revealed that gut flora intervention may be an important target for the prevention and treatment of hypertension-related cardiac target organ damage in the future. Given the current encouraging results, more cohorts should be collected in the future to continue verifying the differential species or conduct metagenomic analysis to achieve precise intervention of the gut microbiota in hypertensive individuals with LVH.
Several limitations should be acknowledged in this study. First, considerable sex differences were present among the groups at baseline, and stratification by age and comorbidities was not performed, which may have introduced potential confounding effects. Second, although all participants were recruited from the same local community and thus shared broadly similar dietary patterns, we did not perform quantitative dietary assessments; therefore, residual dietary variability could have influenced the results. Third, the absence of fecal and plasma metabolomics analysis limited further investigation into the mechanistic associations between gut microbiota dysbiosis and the development of LVH in individuals with hypertension.
5 Conclusion
BMI, uric acid, triglycerides, homocysteine, alkaline phosphatase, and γ-glutamyl transferase levels were significantly elevated in patients with hypertension and LVH, and the composition of the gut microbiota differed significantly from that observed in hypertensive patients without LVH and in healthy individuals. These findings provide new insights into the potential relationship between hypertension-related LVH and gut microbiota, and may inform future strategies for the prevention and treatment of cardiac target organ damage associated with hypertension.
Data availability statement
The raw sequence data reported in this paper have been deposited in the Genome Sequence Archive (Genomics, Proteomics & Bioinformatics 2025) in National Genomics Data Center (Nucleic Acids Res 2025), China National Center for Bioinformation/Beijing Institute of Genomics, Chinese Academy of Sciences (GSA-Human: HRA014282) that are publicly accessible at https://ngdc.cncb.ac.cn/gsa-human, (Zhang et al., 2025; CNCB-NGDC Members and Partners, 2025).
Ethics statement
The studies involving humans were approved by Ethics Committee of Yulin First People’s Hospital (YLSY-IRB-RP-2023022). The studies were conducted in accordance with the local legislation and institutional requirements. The participants provided their written informed consent to participate in this study.
Author contributions
LC: Conceptualization, Data curation, Methodology, Supervision, Writing – original draft, Writing – review & editing. G-QL: Conceptualization, Formal analysis, Methodology, Project administration, Visualization, Writing – original draft. C-MZ: Data curation, Investigation, Software, Supervision, Visualization, Writing – review & editing. W-FX: Formal analysis, Investigation, Project administration, Visualization, Writing – original draft. R-NJ: Conceptualization, Project administration, Resources, Writing – review & editing. H-YC: Data curation, Methodology, Validation, Writing – review & editing.
Funding
The author(s) declare that financial support was received for the research and/or publication of this article. This study was supported by the Open Project of Guangxi Key Laboratory for Genomic and Personalized Medicine (GXGPMC202306) and Guangxi Science and Technology Major Project (GuikeAA22096030).
Acknowledgments
The authors would like to acknowledge the hard and dedicated work of all the staff that implemented the intervention and evaluation components of the study.
Conflict of interest
The authors declare that the research was conducted in the absence of any commercial or financial relationships that could be construed as a potential conflict of interest.
Generative AI statement
The authors declare that no Gen AI was used in the creation of this manuscript.
Any alternative text (alt text) provided alongside figures in this article has been generated by Frontiers with the support of artificial intelligence and reasonable efforts have been made to ensure accuracy, including review by the authors wherever possible. If you identify any issues, please contact us.
Publisher’s note
All claims expressed in this article are solely those of the authors and do not necessarily represent those of their affiliated organizations, or those of the publisher, the editors and the reviewers. Any product that may be evaluated in this article, or claim that may be made by its manufacturer, is not guaranteed or endorsed by the publisher.
Supplementary material
The Supplementary material for this article can be found online at: https://www.frontiersin.org/articles/10.3389/fmicb.2025.1647668/full#supplementary-material
Abbreviations
LVH, Left ventricular hypertrophy; BMI, Body mass index; eGFR, Estimated glomerular filtration rate; HDL, High-density lipoprotein cholesterol; LVMI, Left ventricular mass index; LVID, Left ventricular internal diameter; IVST, Interventricular septal thickness; LVPWT, Left ventricular posterior wall thickness; LVM, Left ventricular mass; BSA, Body surface area; CCB, Calcium antagonists; OUT, Operational taxonomic units; ASV, Amplicon sequence variant; LEfSe, LDA effect size.
Footnotes
1. ^https://github.com/OpenGene/fastp
2. ^http://ccb.jhu.edu/software/FLASH/
3. ^https://github.com/torognes/vsearch/
References
Avery, E. G., Bartolomaeus, H., Maifeld, A., Marko, L., Wiig, H., Wilck, N., et al. (2021). The gut microbiome in hypertension: recent advances and future perspectives. Circ. Res. 128, 934–950. doi: 10.1161/CIRCRESAHA.121.318065
Bjornstad, P., Laffel, L., Lynch, J., El Ghormli, L., Weinstock, R. S., Tollefsen, S. E., et al. (2019). Elevated serum uric acid is associated with greater risk for hypertension and diabetic kidney diseases in obese adolescents with type 2 diabetes: an observational analysis from the treatment options for type 2 diabetes in adolescents and youth (TODAY) study. Diabetes Care 42, 1120–1128. doi: 10.2337/dc18-2147
Cai, M., Lin, L., Jiang, F., Peng, Y., Li, S., Chen, L., et al. (2023). Gut microbiota changes in patients with hypertension: a systematic review and meta-analysis. J. Clin. Hypertens. 25, 1053–1068. doi: 10.1111/jch.14722
Cao, R., Gao, T., Yue, J., Sun, G., and Yang, X. (2024). Disordered gut microbiome and alterations in metabolic patterns are associated with hypertensive left ventricular hypertrophy. J. Am. Heart Assoc. 13:e034230. doi: 10.1161/JAHA.123.034230
Chen, X. F., Chen, X., and Tang, X. (2020). Short-chain fatty acid, acylation and cardiovascular diseases. Clin. Sci. 134, 657–676. doi: 10.1042/CS20200128
CNCB-NGDC Members and Partners (2025). Database resources of the national genomics data center, China national center for bioinformation database resources of the national genomics data center, China national center for bioinformation in 2025. Nucleic Acids Res. 53, D30–D44. doi: 10.1093/nar/gkae978
Devereux, R. B., Wachtell, K., Gerdts, E., Boman, K., Nieminen, M. S., Papademetriou, V., et al. (2004). Prognostic significance of left ventricular mass change during treatment of hypertension. JAMA 292, 2350–2356. doi: 10.1001/jama.292.19.2350
Djekic, D., Shi, L., Brolin, H., Carlsson, F., Särnqvist, C., Savolainen, O., et al. (2020). Effects of a vegetarian diet on cardiometabolic risk factors, gut microbiota, and plasma metabolome in subjects with ischemic heart disease: a randomized, crossover study. J. Am. Heart Assoc. 9:e016518. doi: 10.1161/JAHA.120.016518
Fan, L., Ren, J., Chen, Y., Wang, Y., Guo, Z., Bu, P., et al. (2022). Effect of fecal microbiota transplantation on primary hypertension and the underlying mechanism of gut microbiome restoration: protocol of a randomized, blinded, placebo-controlled study. Trials 23:178. doi: 10.1186/s13063-022-06086-2
Han, Y., Li, Y., Wu, Z., Pei, Y., Lu, S., Yu, H., et al. (2024). Progress in diagnosis and treatment of hypertension combined with left ventricular hypertrophy. Ann. Med. 56:2405080. doi: 10.1080/07853890.2024.2405080
Kaye, D. M., Shihata, W. A., Jama, H. A., Tsyganov, K., Ziemann, M., Kiriazis, H., et al. (2020). Deficiency of prebiotic fiber and insufficient signaling through gut metabolite-sensing receptors leads to cardiovascular disease. Circulation 141, 1393–1403. doi: 10.1161/CIRCULATIONAHA.119.043081
Koeth, R. A., Lam-Galvez, B. R., Kirsop, J., Wang, Z., Levison, B. S., Gu, X., et al. (2019). L-carnitine in omnivorous diets induces an atherogenic gut microbial pathway in humans. J. Clin. Invest. 129, 373–387. doi: 10.1172/JCI94601
Kundu, B. K., Zhong, M., Sen, S., Davogustto, G., Keller, S. R., and Taegtmeyer, H. (2015). Remodeling of glucose metabolism precedes pressure overload-induced left ventricular hypertrophy: review of a hypothesis. Cardiology 130, 211–220. doi: 10.1159/000369782
Leache, L., Gutiérrez-Valencia, M., Finizola, R. M., Infante, E., Finizola, B., Pardo Pardo, J., et al. (2021). Pharmacotherapy for hypertension-induced left ventricular hypertrophy. Cochrane Database Syst. Rev. 10:CD012039. doi: 10.1002/14651858.CD012039.pub3
Li, J., Wang, S. Y., Yan, K. X., Wang, P., Jiao, J., Wang, Y. D., et al. (2024). Intestinal microbiota by angiotensin receptor blocker therapy exerts protective effects against hypertensive damages. iMeta 3:e222. doi: 10.1002/imt2.222
Li, Z., Wu, Z., Yan, J., Liu, H., Liu, Q., Deng, Y., et al. (2019). Gut microbe-derived metabolite trimethylamine N-oxide induces cardiac hypertrophy and fibrosis. Lab. Investig. 99, 346–357. doi: 10.1038/s41374-018-0091-y
Liu, J., An, N., Ma, C., Li, X., Zhang, J., Zhu, W., et al. (2018). Correlation analysis of intestinal flora with hypertension. Exp. Ther. Med. 16, 2325–2330. doi: 10.3892/etm.2018.6500
Liu, Y., Sheng, S., Wu, L., Wang, H., Xue, H., and Wang, R. (2025). Flavonoid-rich extract of Paederia scandens (Lour.) Merrill improves hyperuricemia by regulating uric acid metabolism and gut microbiota. Food Chem. 471:142857. doi: 10.1016/j.foodchem.2025.142857
Mahgoup, E. M. (2025). “Gut microbiota as a therapeutic target for hypertension: challenges and insights for future clinical applications” “gut microbiota and hypertension therapy”. Curr. Hypertens. Rep. 27:14. doi: 10.1007/s11906-025-01331-w
Mähler, A., Wilck, N., Rauch, G., Dechend, R., and Müller, D. N. (2020). Effect of a probiotic on blood pressure in grade 1 hypertension (HYPRO): protocol of a randomized controlled study. Trials 21:1032. doi: 10.1186/s13063-020-04973-0
Mancia, G., Fagard, R., Narkiewicz, K., Redon, J., Zanchetti, A., Böhm, M., et al. (2013). 2013 ESH/ESC guidelines for the management of arterial hypertension: the Task Force for the Management of Arterial Hypertension of the European Society of Hypertension (ESH) and of the European Society of Cardiology (ESC). Eur. Heart J. 34, 2159–2219. doi: 10.1093/eurheartj/eht151
Moludi, J., Maleki, V., Jafari-Vayghyan, H., Vaghef-Mehrabany, E., and Alizadeh, M. (2020). Metabolic endotoxemia and cardiovascular disease: a systematic review about potential roles of prebiotics and probiotics. Clin. Exp. Pharmacol. Physiol. 47, 927–939. doi: 10.1111/1440-1681.13250
Qu, L., Dong, Z., Ma, S., Liu, Y., Zhou, W., Wang, Z., et al. (2022). Gut microbiome signatures are predictive of cognitive impairment in hypertension patients-a cohort study. Front. Microbiol. 13:841614. doi: 10.3389/fmicb.2022.841614
Seldin, M. M., Meng, Y., Qi, H., Zhu, W. F., Wang, Z., Hazen, S. L., et al. (2016). Trimethylamine N-oxide promotes vascular inflammation through signaling of mitogen-activated protein kinase and nuclear factor-κB. J. Am. Heart Assoc. 5:e002767. doi: 10.1161/JAHA.115.002767
Sharma, A., Kapur, S., Kancharla, P., and Yang, T. (2025). Sex differences in gut microbiota, hypertension, and cardiovascular risk. Eur. J. Pharmacol. 987:177183. doi: 10.1016/j.ejphar.2024.177183
Takagi, T., Naito, Y., Kashiwagi, S., Uchiyama, K., Mizushima, K., Kamada, K., et al. (2020). Changes in the gut microbiota are associated with hypertension, hyperlipidemia, and type 2 diabetes mellitus in Japanese subjects. Nutrients 12:2996. doi: 10.3390/nu12102996
Tsiavos, A., Antza, C., Trakatelli, C., and Kotsis, V. (2024). The microbial perspective: a systematic literature review on hypertension and gut microbiota. Nutrients 16:3698. doi: 10.3390/nu16213698
Weber, G. J., Pushpakumar, S., Tyagi, S. C., and Sen, U. (2016). Homocysteine and hydrogen sulfide in epigenetic, metabolic and microbiota related renovascular hypertension. Pharmacol. Res. 113, 300–312. doi: 10.1016/j.phrs.2016.09.002
Xue, Y., Cui, L., Qi, J., Ojo, O., Du, X., Liu, Y., et al. (2021). The effect of dietary fiber (oat bran) supplement on blood pressure in patients with essential hypertension: a randomized controlled trial. Nutr. Metab. Cardiovasc. Dis. 31, 2458–2470. doi: 10.1016/j.numecd.2021.04.013
Zhang, S., Chen, X., Jin, E., Wang, A., Chen, T., Zhang, X., et al. (2025). The GSA family in 2025: a broadened sharing platform for multi-omics and multimodal data. Genomics, Proteomics Bioinformatics. 23:qzaf072. doi: 10.1093/gpbjnl/qzaf072
Zhou, X., Li, J., Guo, J., Geng, B., Ji, W., Zhao, Q., et al. (2018). Gut-dependent microbial translocation induces inflammation and cardiovascular events after ST-elevation myocardial infarction. Microbiome 6:66. doi: 10.1186/s40168-018-0441-4
Zhu, W., Gregory, J. C., Org, E., Buffa, J. A., Gupta, N., Wang, Z., et al. (2016). Gut microbial metabolite TMAO enhances platelet hyperreactivity and thrombosis risk. Cell 165, 111–124. doi: 10.1016/j.cell.2016.02.011
Keywords: clinical indicators, high-throughput sequencing, hypertension, gut microbiota, left ventricular hypertrophy
Citation: Cai L, Liu G-Q, Zeng C-M, Xu W-F, Jiang R-N and Chen H-Y (2025) Clinical features and gut microbiota alterations in hypertensive individuals with left ventricular hypertrophy. Front. Microbiol. 16:1647668. doi: 10.3389/fmicb.2025.1647668
Edited by:
Zhangran Chen, Xiamen University, ChinaReviewed by:
Nar Singh Chauhan, Maharshi Dayanand University, IndiaZunji Shi, Lanzhou University, China
Copyright © 2025 Cai, Liu, Zeng, Xu, Jiang and Chen. This is an open-access article distributed under the terms of the Creative Commons Attribution License (CC BY). The use, distribution or reproduction in other forums is permitted, provided the original author(s) and the copyright owner(s) are credited and that the original publication in this journal is cited, in accordance with accepted academic practice. No use, distribution or reproduction is permitted which does not comply with these terms.
*Correspondence: Chun-Mei Zeng, emVuZ2NodW5tZWl6Y21AMTI2LmNvbQ==