 Marie C. Bordone
 Nuno L. Barbosa-Morais
- Instituto de Medicina Molecular João Lobo Antunes, Faculdade de Medicina, Universidade de Lisboa, Lisbon, Portugal
Alzheimer’s disease (AD) and Parkinson’s disease (PD) are the two most common neurodegenerative disorders worldwide, with age being their major risk factor. The increasing worldwide life expectancy, together with the scarcity of available treatment choices, makes it thus pressing to find the molecular basis of AD and PD so that the causing mechanisms can be targeted. To study these mechanisms, gene expression profiles have been compared between diseased and control brain tissues. However, this approach is limited by mRNA expression profiles derived for brain tissues highly reflecting their degeneration in cellular composition but not necessarily disease-related molecular states. We therefore propose to account for cell type composition when comparing transcriptomes of healthy and diseased brain samples, so that the loss of neurons can be decoupled from pathology-associated molecular effects. This approach allowed us to identify genes and pathways putatively altered systemically and in a cell-type-dependent manner in AD and PD brains. Moreover, using chemical perturbagen data, we computationally identified candidate small molecules for specifically targeting the profiled AD/PD-associated molecular alterations. Our approach therefore not only brings new insights into the disease-specific and common molecular etiologies of AD and PD but also, in these realms, foster the discovery of more specific targets for functional and therapeutic exploration.
Introduction
Alzheimer’s disease (AD) and Parkinson’s disease (PD) are the two most common neurodegenerative disorders worldwide. Although the etiology, affected brain region and clinical features are particular to each of these diseases, they nevertheless share common mechanisms such as mitochondria dysfunction, neuronal loss and tau protein accumulation (Zarow et al., 2003; Xie et al., 2014). The major risk factor for those disorders is aging (Niccoli and Partridge, 2012), the age of onset of both AD or PD being around 65 years old (Nussbaum and Ellis, 2003). Together, they account for 50 million cases worldwide (Feigin et al., 2017), a number expected to increase due to the fact that the world population is living longer than ever (Goedert, 2015; World Health Organization, 2020). Most of AD and PD cases are sporadic and, despite all the research during the last centuries to better understand their molecular nature, current treatments are still symptomatic (Yiannopoulou and Papageorgiou, 2013; Schulz et al., 2016). Therefore, the development of effective therapies requires a better comprehension of the diseases’ etiology and underlying mechanisms as well as finding disease-specific targets for drug discovery.
A common strategy to identify biological pathways and cellular processes altered in neurodegenerative disorders is to compare gene expression profiles between age-matched diseased and non-diseased post-mortem brain tissues (Wang et al., 2009; Srinivasan et al., 2016) or between diseased and non-diseased leukocytes (Soreq et al., 2013, 2014). However, the expression profiles derived from whole brain tissue mRNA highly reflect alterations in cellular composition, namely the well-known AD- or PD-associated loss of neurons, but not necessarily the disease-related molecular changes in brain cells (Srinivasan et al., 2016). The advent of single-cell transcriptomes has made it possible to tackle this limitation, enabling the determination of reference gene expression profiles for each major brain cell type (namely neurons, astrocytes, microglia and oligodendrocytes) (Darmanis et al., 2015; Lake et al., 2016, 2018; Mathys et al., 2019a; Schirmer et al., 2019; Velmeshev et al., 2019) that can then be used to computationally estimate the cell type-specific content of bulk brain sample’s in healthy and diseased conditions (Kuhn et al., 2012, 2015), decoupling the neuronal loss effect from the intrinsic systemic or cell type-specific disease effects (Capurro et al., 2015; Skene and Grant, 2016).
This approach has already been applied in determining the effects of age and psychiatric disorders on the cellular composition of human brain (Hagenauer et al., 2017), or the contribution of each cell type in shaping the pathological autism transcriptome (Yu and He, 2017). The same principle was applied in AD by modeling the expression of its risk genes as a function of estimated cellular composition of brain samples (Kelley et al., 2018). For instance, APP, PSEN1, APOE, and TREM2 had their expression levels associated with the relative abundance of, respectively, neurons, oligodendrocytes, astrocytes and microglia (Kelley et al., 2018). Additionally, two recent studies profiled single nuclei of major brain cell types in AD and non-AD post-mortem brain samples, unveiling cell type-specific transcriptional changes (Mathys et al., 2019a; Zhou et al., 2020). All these studies highlight the importance of charactering disease-associated cell type-specific phenotypes that can not only unveil the cellular and molecular bases of pathological mechanisms but also be therapeutically targeted.
However, some of these studies still lack independent validation and have not fully dissected the nature of transcriptomic alterations in AD brains. Moreover, to our knowledge, similar approaches have not yet been applied to PD, despite increasing evidence regarding the importance of modeling cellular composition in neurodegenerative disorders. We therefore used scRNA-seq data to derive gene expression signatures for the major human brain cell types (Darmanis et al., 2015) and estimate the cellular composition of idiopathic AD (Allen et al., 2016) and PD (Dumitriu et al., 2016) post-mortem brain samples from their bulk transcriptomes, investigating whether neuronal loss could be confounding or masking the intrinsic disease effects on gene expression, and validating the results in independent datasets. Additionally, since AD and PD might share the same mechanisms of disease progression (Nussbaum and Ellis, 2003), we also investigated the similarities between the transcriptomic alterations induced by AD and PD in human brain tissues.
This approach allowed the novel identification of genes and pathways whose activity in the brain is intrinsically altered by AD and PD in systemic and cell type-specific ways. Additionally, we pinpoint the genes that are commonly altered by these major neurodegenerative disorders as well as those specifically perturbed in each illness. Thus, we unveil a set of novel candidates that can potentially be targeted in AD and PD therapeutics. Moreover, we herein demonstrate the potential of modeling cellular composition in transcriptomics analyses in the discovery of therapeutic targets for other neurodegenerative diseases.
Materials and Methods
Data Availability
We obtained, through NCBI Gene Expression Omnibus (GEO), two single-cell RNA-seq datasets that we employed to derive gene expression signatures for the major brain cell types (i.e., astrocytes, microglia, neurons and oligodendrocytes), one from human temporal lobe [GSE67835 (Darmanis et al., 2015) – only cells from adult samples were used] and the other from mouse cortex [SRP135960 (Zeisel et al., 2015)]. We used a third single-cell RNA-seq dataset [GEO GSE73721 (Zhang et al., 2016)] to independently validate those signatures, considering only cells from the human cortex (12 astrocytes, 1 neuron, 4 oligodendrocytes, and 2 endothelial cells), for consistency.
The AD analysis was based on the temporal cortex RNA-seq dataset from the AMP-AD Knowledge Portal with accession syn3163039 (Allen et al., 2016). We used the table available therein, containing the pre-processed raw read counts for each gene in each sample, for the downstream analyses. We selected only the samples diagnosed as AD and non-AD with RNA integrity number (RIN) ≥8 (Ferrer et al., 2008). We also discarded a non-AD sample with a very low (<0.40) estimated proportion of neurons (Supplementary Figure 1A and Supplementary Table 1). In total, we used 71 AD and 32 non-AD samples.
We used AD dataset GEO GSE104704 (Nativio et al., 2018) for independent validation, less stringently requiring RIN ≥6 to keep enough samples for analysis. Three non-AD samples with abnormally low (<0.40) estimated proportion of neurons were discarded (Supplementary Figure 1B and Supplementary Table 1), leaving a total of 9 AD and 14 non-AD samples.
We fetched the PD RNA-seq dataset from GEO GSE68719 (Dumitriu et al., 2016) and kept samples with RIN ≥7 and from donors older than 60 years, for a better age match between control and diseased samples and given the reported onset of idiopathic PD at around 65 years of age (Nussbaum and Ellis, 2003). When performing principal component analysis (PCA) of the normalized gene expression data (see sections “Statistical Tests” and “Data Processing” below), we identified two samples (SRR2015728 and SRR2015748) with an outlying behavior (Supplementary Figures 2A,B). When clustering samples based on the correlation between their normalized gene expression profiles (see section “Statistical Tests” below), SRR2015728 and SRR2015748 are again shown to be outliers (Supplementary Figure 2C). Moreover, non-PD samples SRR2015714 and SRR2015728 are also those showing an abnormally low (<0.40) estimated neuronal proportion (Supplementary Figure 1C and Supplementary Table 1). As such, we conservatively discarded those three samples from the dataset, leaving 15 PD and 26 non-PD samples.
For independent validation, we used PD gene expression microarray dataset GEO GSE20168 (Zhang et al., 2005). Since the PD RNA-seq dataset only comprised males, we selected the 10 non-diseased and 8 PD male samples from the microarray dataset. Although RINs were not provided for this dataset, we were able to detect possible RNA degradation by using function AffyRNAdeg from the xps R package (Stratowa, 2020). We found some evidence for the expected neuronal loss in PD brains but differences in the distributions of estimated neuronal proportions between PD and non-PD samples are not statistically significant (Supplementary Figure 1D). Although one non-PD sample had a low (<0.40) estimated neuronal proportion, we decided to keep it due to the small number of samples in the dataset (Supplementary Table S1).
All datasets used are summarized in Table 1.
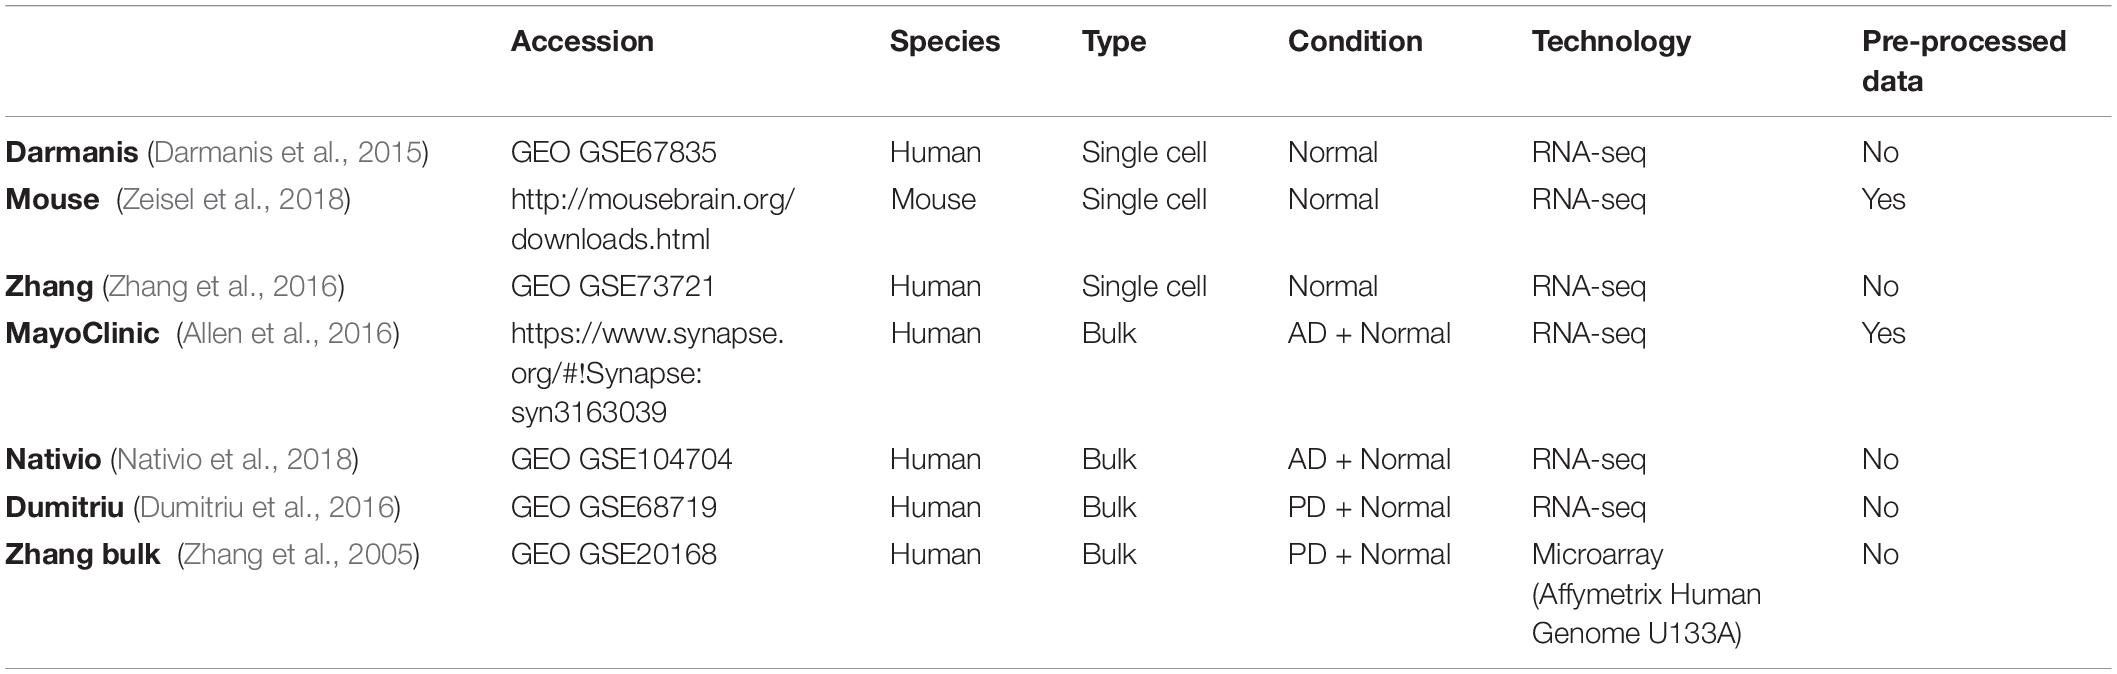
Table 1. Summary of transcriptomic datasets analyzed.
Statistical Tests
We performed all statistical analyses in R (programming language for statistics and graphics) (R Development Core Team, 2018), extensively using packages from Bioconductor (repository of R tools for the analysis of high-throughput biological data) (Gentleman et al., 2004). We used t-tests (Kalpić et al., 2011) to compare differences in expression of specific marker genes, as well as differences in age distributions between diseased and non-diseased groups. To compare differences in proportions of neural cell types between diseased and non-diseased brains, we used Wilcoxon-signed-rank tests (Rey and Neuhäuser, 2011), and to compare the neuronal proportion densities between diseased and non-diseased brains, we used the Kolmogorov-Smirnov test (Lopes, 2011). For correlation analysis, we used Pearson’s correlation, unless stated otherwise. We chose Euclidean distance for clustering samples based on gene expression correlation, having used the ComplexHeatmap package (Gu et al., 2016) for the purpose and to generate the associated heatmap in Supplementary Figure 2C.
Principal component analysis (PCA), enabling the identification of the linear combinations of variables that contribute the most to data variance (Ringnér, 2008), was implemented through the singular value decomposition (SVD) algorithm provided by the PCA function from R package FactoMineR (Lê et al., 2008).
Where applicable and not indicated otherwise, p-values were corrected for multiple testing using Benjamin-Hochberg’s False Discovery Rate (FDR).
Data Processing
For all the RNA-Seq datasets with no pre-processed data available (Table 1), we aligned the reads against the human transcriptome [hg38 Gencode annotation (Frankish et al., 2019)] with Kallisto (Bray et al., 2016) using the default parameters.
For both single-cell datasets, we performed state-of-the-art procedures for quality assessment (Lun et al., 2016b), such as checking for library size discrepancies between cells, the number of expressed genes per cell and the proportion of reads aligning to mitochondrial genes (Lun et al., 2016b; Supplementary Figures 3A,C). We removed low-quality cells that presented a median absolute deviation (MAD) <−3 for the library size, MAD < −3 for the number of expressed genes or a MAD > 3 for the proportion of mitochondrial reads. Additionally, we kept for downstream analysis only genes whose log10[average read counts per million (CPM)] > 0 (Supplementary Figures 3B,D) and whose variance in expression was significantly associated with the biological component (i.e., the cell type) as assessed through the usage of the decomposeVar function from the scran R package (Lun et al., 2016b). Briefly, the variance in expression for each gene was decomposed into their biological and technical components. The technical component is estimated by fitting the mean-dependent trend of the variance. The biological component of the variance is then calculated by subtracting the technical component from the overall variance (Lun et al., 2016b). This last step avoids prioritizing genes whose expression is highly variable due to technical factors such as sampling noise during RNA capture and library preparation (Lun et al., 2016b).
Furthermore, the t-Distributed Stochastic Neighbor Embedding (tSNE) (van der Maaten and Hinton, 2008) plot of human single-cell (Darmanis) gene expression shows a few cells not clustered together with those of their respective annotated type (Supplementary Figure 4A). Moreover, all of them appear to have been misclassified also based on single-cell trajectories [i.e., cells’ ordering according to their inferred biological state (Qiu et al., 2017b)] obtained with the monocle package (Trapnell et al., 2014; Qiu et al., 2017a, b; Supplementary Figure 4B) or the nearest shrunken centroid classification, implemented in R package pamr (Tibshirani et al., 2002; Supplementary Figures 4C,D). Therefore, they were discarded from our analysis (Supplementary Figure 4E). No potentially misclassified cells were detected in the mouse dataset (Supplementary Figure 4F).
After the filtering steps mentioned above, summed expression values across pools of cells were deconvolved in cell-based factors for normalization of the Darmanis and the mouse single-cell gene expression datasets (Lun et al., 2016a). All bulk RNA-seq datasets were quantile-normalized using the voom function, from the limma R package (Ritchie et al., 2015). The rma function from the affy R package (Gautier et al., 2004) was used to normalize and summarize the PD microarray dataset.
Moreover, we used the ComBat function from the sva package to correct for batch effects. This function requires possible technical effects to be encoded as categorical variables (Leek et al., 2012). Thus, for the AD MayoClinic dataset, RIN was defined as high if >8.5 and low if ≤8.5, in the AD Nativio dataset high if >7.3 and low if ≤7.3, and in the PD Dumitriu dataset it was defined as high if >7.8 and low if ≤7.8. For the PD Zhang dataset, the RNA degradation slope, derived from the average intensities per relative 5′–3′ position of probes in their target transcripts across probe sets (Draghici, 2012), was used and defined as low if ≤5 and high if >5.
We quantified gene expression from RNA-seq data in counts per million (CPM) and kept only genes with an average CPM higher of 10/L, where L is the minimum library size in million reads (Chen et al., 2016), in at least N samples, where N is the smallest sample size in our analyses (Supplementary Figure 5). For the microarray dataset, gene expression was quantified by normalized intensities.
Derivation of Gene Expression Signatures for the Major Brain Cell Types
We employed CIBERSORTx (Newman et al., 2019) to infer both human and mouse gene expression signatures for each of the major brain cell types (Supplementary Tables 2, 3) and subsequently used them to estimate the cellular composition of brain samples from their bulk transcriptomes.
We followed three different approaches to assess the accuracy of human and mouse CIBERSORTx-derived signatures in correctly identifying the major cell types in human brain samples:
(1) We split the Darmanis human dataset such that 80% of cells were used to infer cell type-specific gene expression signatures with CIBERSORTx. We used the remaining 20% of cells, with the same proportion of each cell type, to create 300 artificial mixture samples with a diverse range of known (i.e., pre-defined) cell-type proportions (Supplementary Figure 6A) by generating chimeric libraries of 35 million reads. In brief, all the reads from all cells of each cell type were pooled together. For each artificial sample, reads were randomly sampled from cell-type-specific pools according to its defined cell type proportion as in Supplementary Table 4. We treated the artificial mixture samples as bulk RNA-seq samples.
CIBERSORTx estimated the cell type proportions of the artificial mixtures, using the human (Darmanis) cell-type-specific gene expression signatures. Those estimates are generally concordant with the expected proportions, except for the systematic underestimation of microglia’s relative abundance (Supplementary Figure 6B). We repeated the deconvolution analysis in the same artificial mixtures but using the mouse cell-type signatures and got a similar, albeit noisier, concordance (Supplementary Figure 6C).
(2) We ran CIBERSORTx using the same human and mouse cell-type signatures, to classify samples from an independent human brain single-cell RNA-seq dataset (Zhang). Most cells were correctly classified with the human signature (Supplementary Figure 7A). With the mouse signature, most cells are classified as a mixture of cell types but with a dominant proportion of that expected (Supplementary Figure 7C).
(3) We generated artificial mixtures from the Zhang dataset as in (1). Those artificial mixtures were then deconvoluted with CIBERSORTx relying again on the derived human and mouse signatures. Both signatures yield significant concordances (all with p < 2.2e-16) between the expected and observed proportions, with the human signature being again, as expected, more accurate (Supplementary Figures 7B,D).
Estimation of Cellular Composition of Bulk AD, PD, and Non-diseased Brain Samples
We used CIBERSORTx deconvolution (Newman et al., 2019), relying on human and mouse gene expression signatures for the major brain cell types derived as described above, to estimate the cellular composition of all AD, PD, and non-diseased brain samples from their bulk transcriptomes. Moreover, as CIBERSORTx options, we enabled batch normalization, disabled quantile normalization and used 100 permutations for significance analysis. Following CIBERSORTx’s user guidelines, the B-mode batch normalization was chosen to perform deconvolution when using the human signature, since the single cell data used to derive it were generated with SMART-seq2 (Picelli et al., 2013), and the S-mode batch normalization when using the mouse signature, since it is tailored for signatures derived from data generated with the 10x Genomics Chromium platform, as was the case (Newman et al., 2019).
Differential Gene Expression
We performed differential gene expression using the limma (Ritchie et al., 2015) and edgeR (Dai et al., 2014) packages.
For each coefficient in the linear model, the magnitude of differences in gene expression was measured in log2 fold-change and their significance was given by the FDR-adjusted p-value of the moderated t-statistic (an ordinary t-statistic with its standard errors moderated across genes), along with the empirical Bayes statistic (B statistic - log-odds ratio of a gene being differentially expressed) (Smyth, 2004). Moreover, we also used the moderated t-statistic to assess the differential gene expression coherence between different datasets.
We linearly modeled gene expression in the AD datasets according to the following:
Here GEx is the expression of gene x; Disease is the sample’s centered disease status; RIN is the categorized sample’s RNA Integrity Number (1 for high and 0 for low); Neuronal proportion is given by the sample’s estimated proportion of neurons centered; Age is the age of the sample’s donor in years; Sex is the biological sex of the sample’s donor (1 for male and 0 for female); Interaction is the interaction between Disease and the Neuronal proportion effects, given by the product of the two and interpretable as the differential effect of the loss of neurons between AD and non-diseased samples or, equivalently, the part of AD effect that is dependent of the sample’s neuronal contents; βs are the unknown coefficients, to be estimated from fitting that linear model to the gene expression data, for each of the aforementioned variables hypothesized to impact gene expression; ε states the error of the model, that is the remaining variance not explained by the model. Disease and Neuronal proportion were centered to diminish the correlation between their associated estimated coefficients, thereby using a model more consistent with the purpose of estimating independent effects (Afshartous and Preston, 2011). We thus shifted the “prediction center” (i.e., the virtual reference) to the average sample (Afshartous and Preston, 2011) by turning the variables’ means to 0 through the usage of the scale function from the built-in R package base (R Development Core Team, 2018), with the scale argument turned to “false.”
Likewise, we modeled gene expression in the PD Dumitriu dataset as following:
Unknown batch corresponds to a batch effect of unknown source detected by PCA (Supplementary Figure S8) that was thereby adjusted for (Supplementary Figure 12C).
For validation with the independent PD microarray dataset (Zhang), we used the following linear model:
RNA degradation is given by its slope grouping for each sample (1 for high and 0 for low).
We considered a gene differentially expressed if FDR < 0.05, except for the Zhang PD microarray dataset, where we considered FDR < 0.11. This arbitrary cut-off was used to “rescue” a reasonable number genes for further analyses, given the small sample size of the Zhang dataset and the consequent lower statistical power of the associated differential expression analysis. This arbitrary looseness in specificity is dealt with by subsequent filtering (v. section on permutation analyses below).
Identification of Genes Reportedly Associated With AD and PD
Genes already reported to play a role in AD and PD were gathered from the DisGeNET database (Piñero et al., 2019). Only genes with a human gene-disease association (GDA) score >0.1 and an evidence index ≥0.9 (180 genes for AD and 112 genes for PD) were considered as such in our analyses.
Permutation Analyses
We performed permutation tests to identify genes with consistent differential expression ranking between datasets. For each gene, we multiplied its t-statistic values for the intrinsic disease effect (Disease in the linear models) in each of the two datasets (MayoClinic and Nativio for AD; Dumitriu and Zhang for PD) and compared that product with the distribution of those resulting from 5000 random permutations of the disease status labeling of samples. The proportion of random products more extreme than the empirical one was taken as its False Discovery Rate (FDR).
To assess the similarity between the intrinsic AD and PD Disease effects on gene expression, we compared the aforementioned FDRs. For each disease, when t-statistics for both datasets were positive, we used −log10(FDR), when both negative, we used log10(FDR), and when contradictory (i.e., showing different signs) we set this value to 0. When FDRs were originally zero, we equaled them to 1e-5 (half of the FDR resolution) to avoid infinite values when computing their logarithms. Then, for each gene, we multiplied those scores of AD and PD and compared this product with the distribution yielded by 1 000 000 permutations of randomly shuffled product scores. The proportion of random products more extreme than the empirical one was taken as its FDR (Figure 7A).
Gene Set Enrichment Analysis
We identified KEGG (Kanehisa et al., 2016) pathways dysregulated in AD and PD datasets using the Piano R package (Väremo et al., 2013) to perform gene set enrichment analysis (GSEA) (Mootha et al., 2003; Subramanian et al., 2005), by default on t-statistics, but also on B-statistics of differential gene expression for the AD Disease and Neuronal proportion effects. We also used the AD cell-type marker genes defined by Kelley et al. (2018) as a gene set. For GSEA on genes commonly changed in AD and PD (Figure 7B), we used −log10(FDR) when both AD and PD scores were positive, log10(FDR) when both negative, and zero when signs were contradictory.
Identifying Candidate Compounds for Reverting Disease-Associated Gene Expression Alterations
We used cTRAP (de Almeida et al., 2020) to compare the changes in gene expression induced by thousands of drugs in human cell lines, available in the Connectivity Map (CMap) (Subramanian et al., 2017), with those in human brains that we have inferred to be related to the intrinsic (i.e., systemic) AD and PD effects. As input for cTRAP, we used the aforementioned scores for the Disease and Neuronal proportion effects, thereby ranking changes that are coherent between the MayoClinic and Nativio datasets for AD and the Dumitriu and Zhang datasets for PD, as well as those coherent between AD and PD. The compounds, in clinical trials or launched, with their perturbation z-scores (Subramanian et al., 2017) exhibiting the 20 most negative and the 20 most positive average (across different cell lines) Spearman’s correlation with the Disease effect scores across common genes, and with an average absolute Spearman’s correlation with the Neuronal proportion effect scores <0.05 (to avoid confounding between effects), were selected for AD (Supplementary Figure 15A) and PD (Supplementary Figure 15B) as the top candidates for reversal or induction of disease-associated gene expression alterations for discussion. Noteworthily, cMap includes data for the same compounds tested with different concentrations and at different time points, as well as run in different plate types (ASG, CPD, HOG, etc.) (Supplementary Tables 16–18).
Results
The Cellular Composition of AD Brains Is Altered
Most neuronal markers [DCX (Tanapat, 2013), MAP2 (Tanapat, 2013), NEFM (Tanapat, 2013), NEFH (Tanapat, 2013), NEFL (Tanapat, 2013), RBFOX3 (Tanapat, 2013), SYP (Tanapat, 2013)] are significantly downregulated in AD temporal cortex samples from the MayoClinic dataset (Figure 1A). In contrast, all astrocytic [ALDH1L1 (Preston et al., 2019), GFAP (Preston et al., 2019)), SLC1A3 (Preston et al., 2019)] and a few microglial and oligodendrocytic markers [CD40 (Ponomarev et al., 2006), OLIG1 (Ligon et al., 2004) and OLIG2 (Ligon et al., 2004)] are significantly upregulated in AD brains.
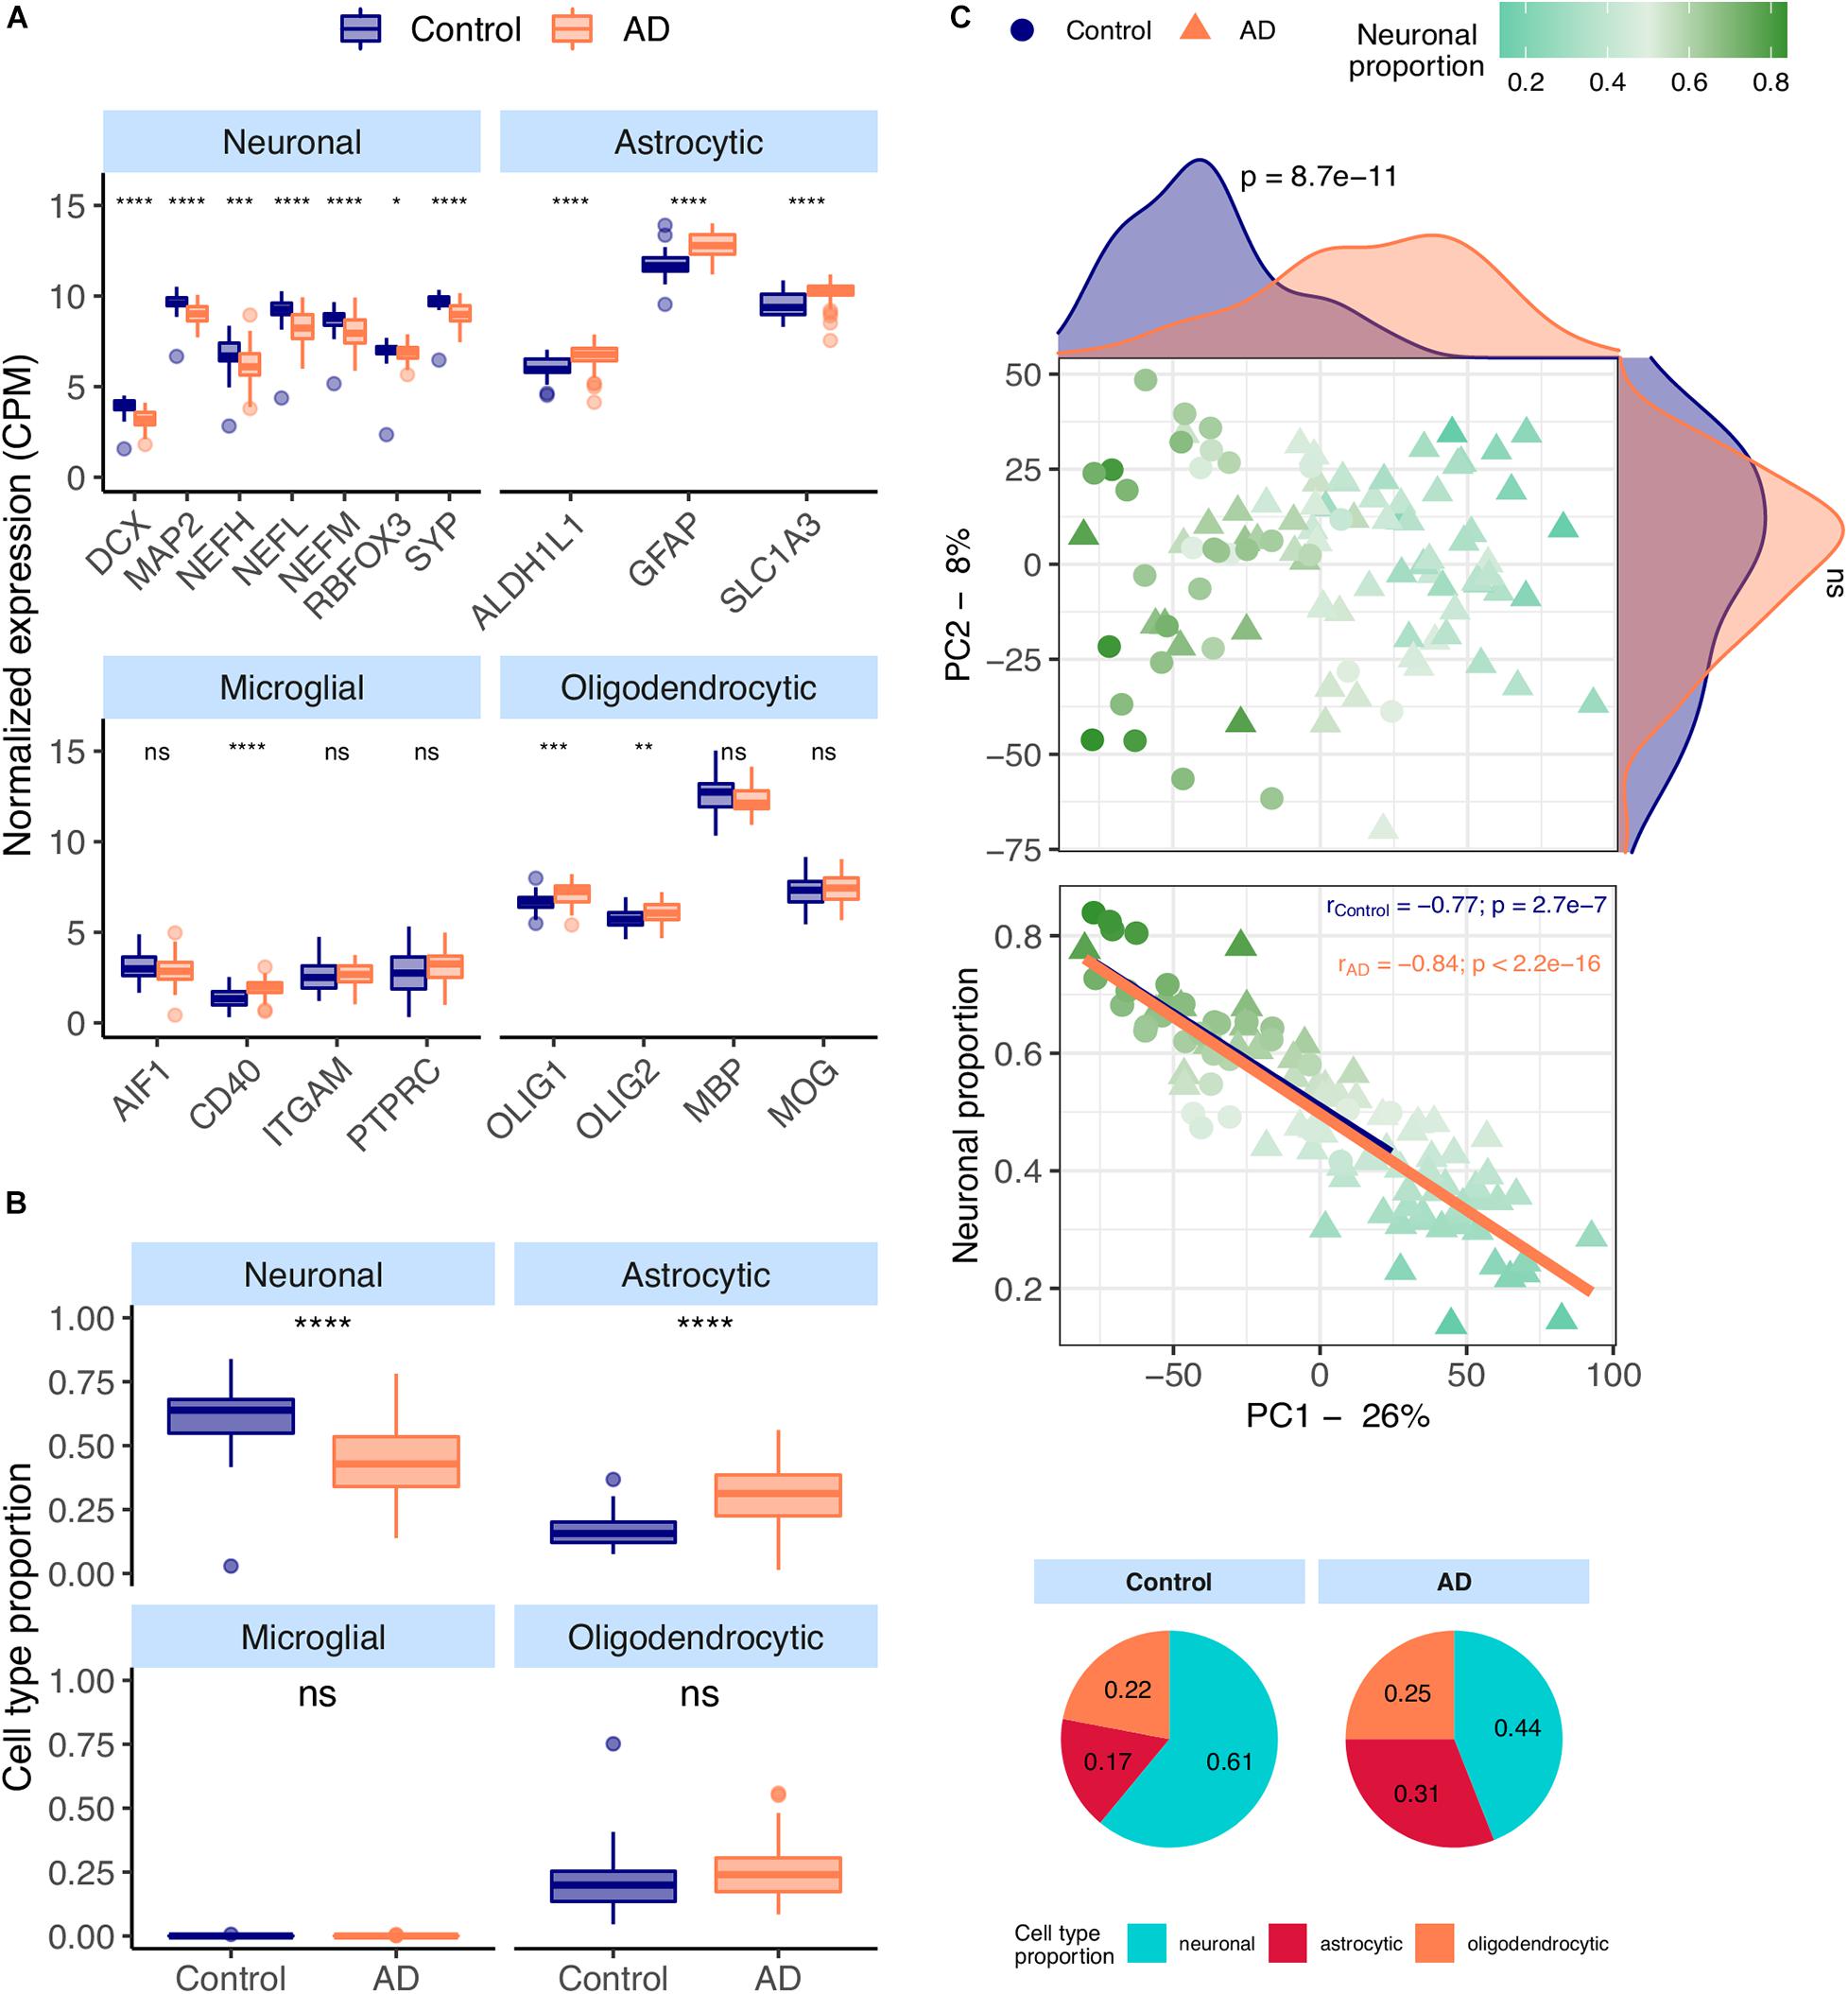
Figure 1. (A) Neuronal, astrocytic, microglial, and oligodendrocytic known markers’ expression in the MayoClinic samples. T-tests were used to compare gene expression mean differences between diseased (AD) and non-diseased (Control) samples. (B) Estimates of the composition of MayoClinic samples in each main cell type based on the human cell type gene expression signature. Wilcoxon signed-rank tests were used to compare differences in proportions between diseased (AD) and non-diseased (Control) samples. (C) Sample factorial map (upper plot) of components 1 (PC1) and 2 (PC2) of Principal Component Analysis (PCA) of the gene expression in MayoClinic samples, and their neuronal proportion related to PC1 loadings (lower plot). Indicated in the respective axes’ labels are the percentages of data variance explained by PC1 and PC2. Kolmogorov-Smirnov tests were used to compare the distributions of PC1 and PC2 loadings between AD and Control samples, illustrated by the smoothed histograms along the respective axes of the PCA plot. In the lower plots, the colored solid lines represent the linear regressions between neuronal proportions and PC1 loadings for AD and Control Samples. The respective Pearson’s correlation coefficients (r) and associated significance (p) are also indicated. Legend: ns: non-significant, ****p ≤ 0.0001, ***p ≤ 0.001, **p ≤ 0.01, *p ≤ 0.05.
CIBERSORTx (Newman et al., 2019), a tool that estimates cell type abundances in tissues from their bulk transcriptomes and machine learning-inferred cell-type-specific gene expression profiles, was used to derive the composition in major cell types (astrocytes, microglia, neurons and oligodendrocytes) of AD brain samples (see section “Materials and Methods”). These estimates (Figure 1B) are concordant with the observations in Figure 1A, including significant increase and decrease, respectively, in the proportions of astrocytes and neurons in AD brain samples. Despite the known differences in gene expression between mouse and human brain cells (Hodge et al., 2019), the same trends can be seen using the mouse signature (Supplementary Figures 9A,B). We also performed principal component analysis (PCA) on normalized gene expression in the MayoClinic brain samples. The neuronal composition, along with the disease effect, is correlated with the first principal component (PC1), i.e., that retaining the most data variance (Figure 1C – rho = −0.88; p < 2.2e-16). Sex also shows a strong association with PC1 (Supplementary Figure 9E) but there is no significant difference in age or neuronal proportion between female and male individuals (Supplementary Figure 9F).
AD Alters Cortical Gene Expression Independently From Neuronal Loss
We linearly modeled gene expression in the MayoClinic brain samples as a function of technical (RIN) and biological variables, such as neuronal proportion (reflecting neuronal loss), systemic AD, Age, Sex and interaction between neuronal proportion and AD (Supplementary Table 6, Figure 2, and Supplementary Figure 10A). We were thereby able to discriminate genes whose expression is significantly systemically affected by AD (Figures 2A,B) from those essentially showing a strong association with neuronal loss (Figures 2C,D). For instance, LIAS, CTB-171A8.1, COX18, and ETV4 exemplify genes that show a strong intrinsic AD effect, independent of neuronal proportion (Figure 2B). Moreover, genes that have previously been reported as playing a role in AD in the DisGeNet database, namely CDK5 (Liu et al., 2016), CDK5R1 (Moncini et al., 2017), FERMT2 (Shulman et al., 2014), and HSD17B10 (Marques et al., 2009), were actually found to be associated with neuronal loss rather than with the disease component (Figure 2D). Additionally, with the Interaction effect we were also able to detect genes, such as PNPLA5 and PTPN20A (Supplementary Figure 10C), whose expression was differentially altered with cellular composition in AD brains compared with non-AD samples. It is worth noting that AD genes specific of a cell type, as defined by Kelley et al. (2018), are also more related with the neuronal composition effect (pGSEA = 0.0001) than with the disease effect (pGSEA = 0.6) (Figures 2A,C). Additionally, most up-regulated AD-specific genes seem to be related with cell survival and immune pathways, whereas down-regulated ones with oxidative phosphorylation and Parkinson’s disease (Supplementary Figure 10C).
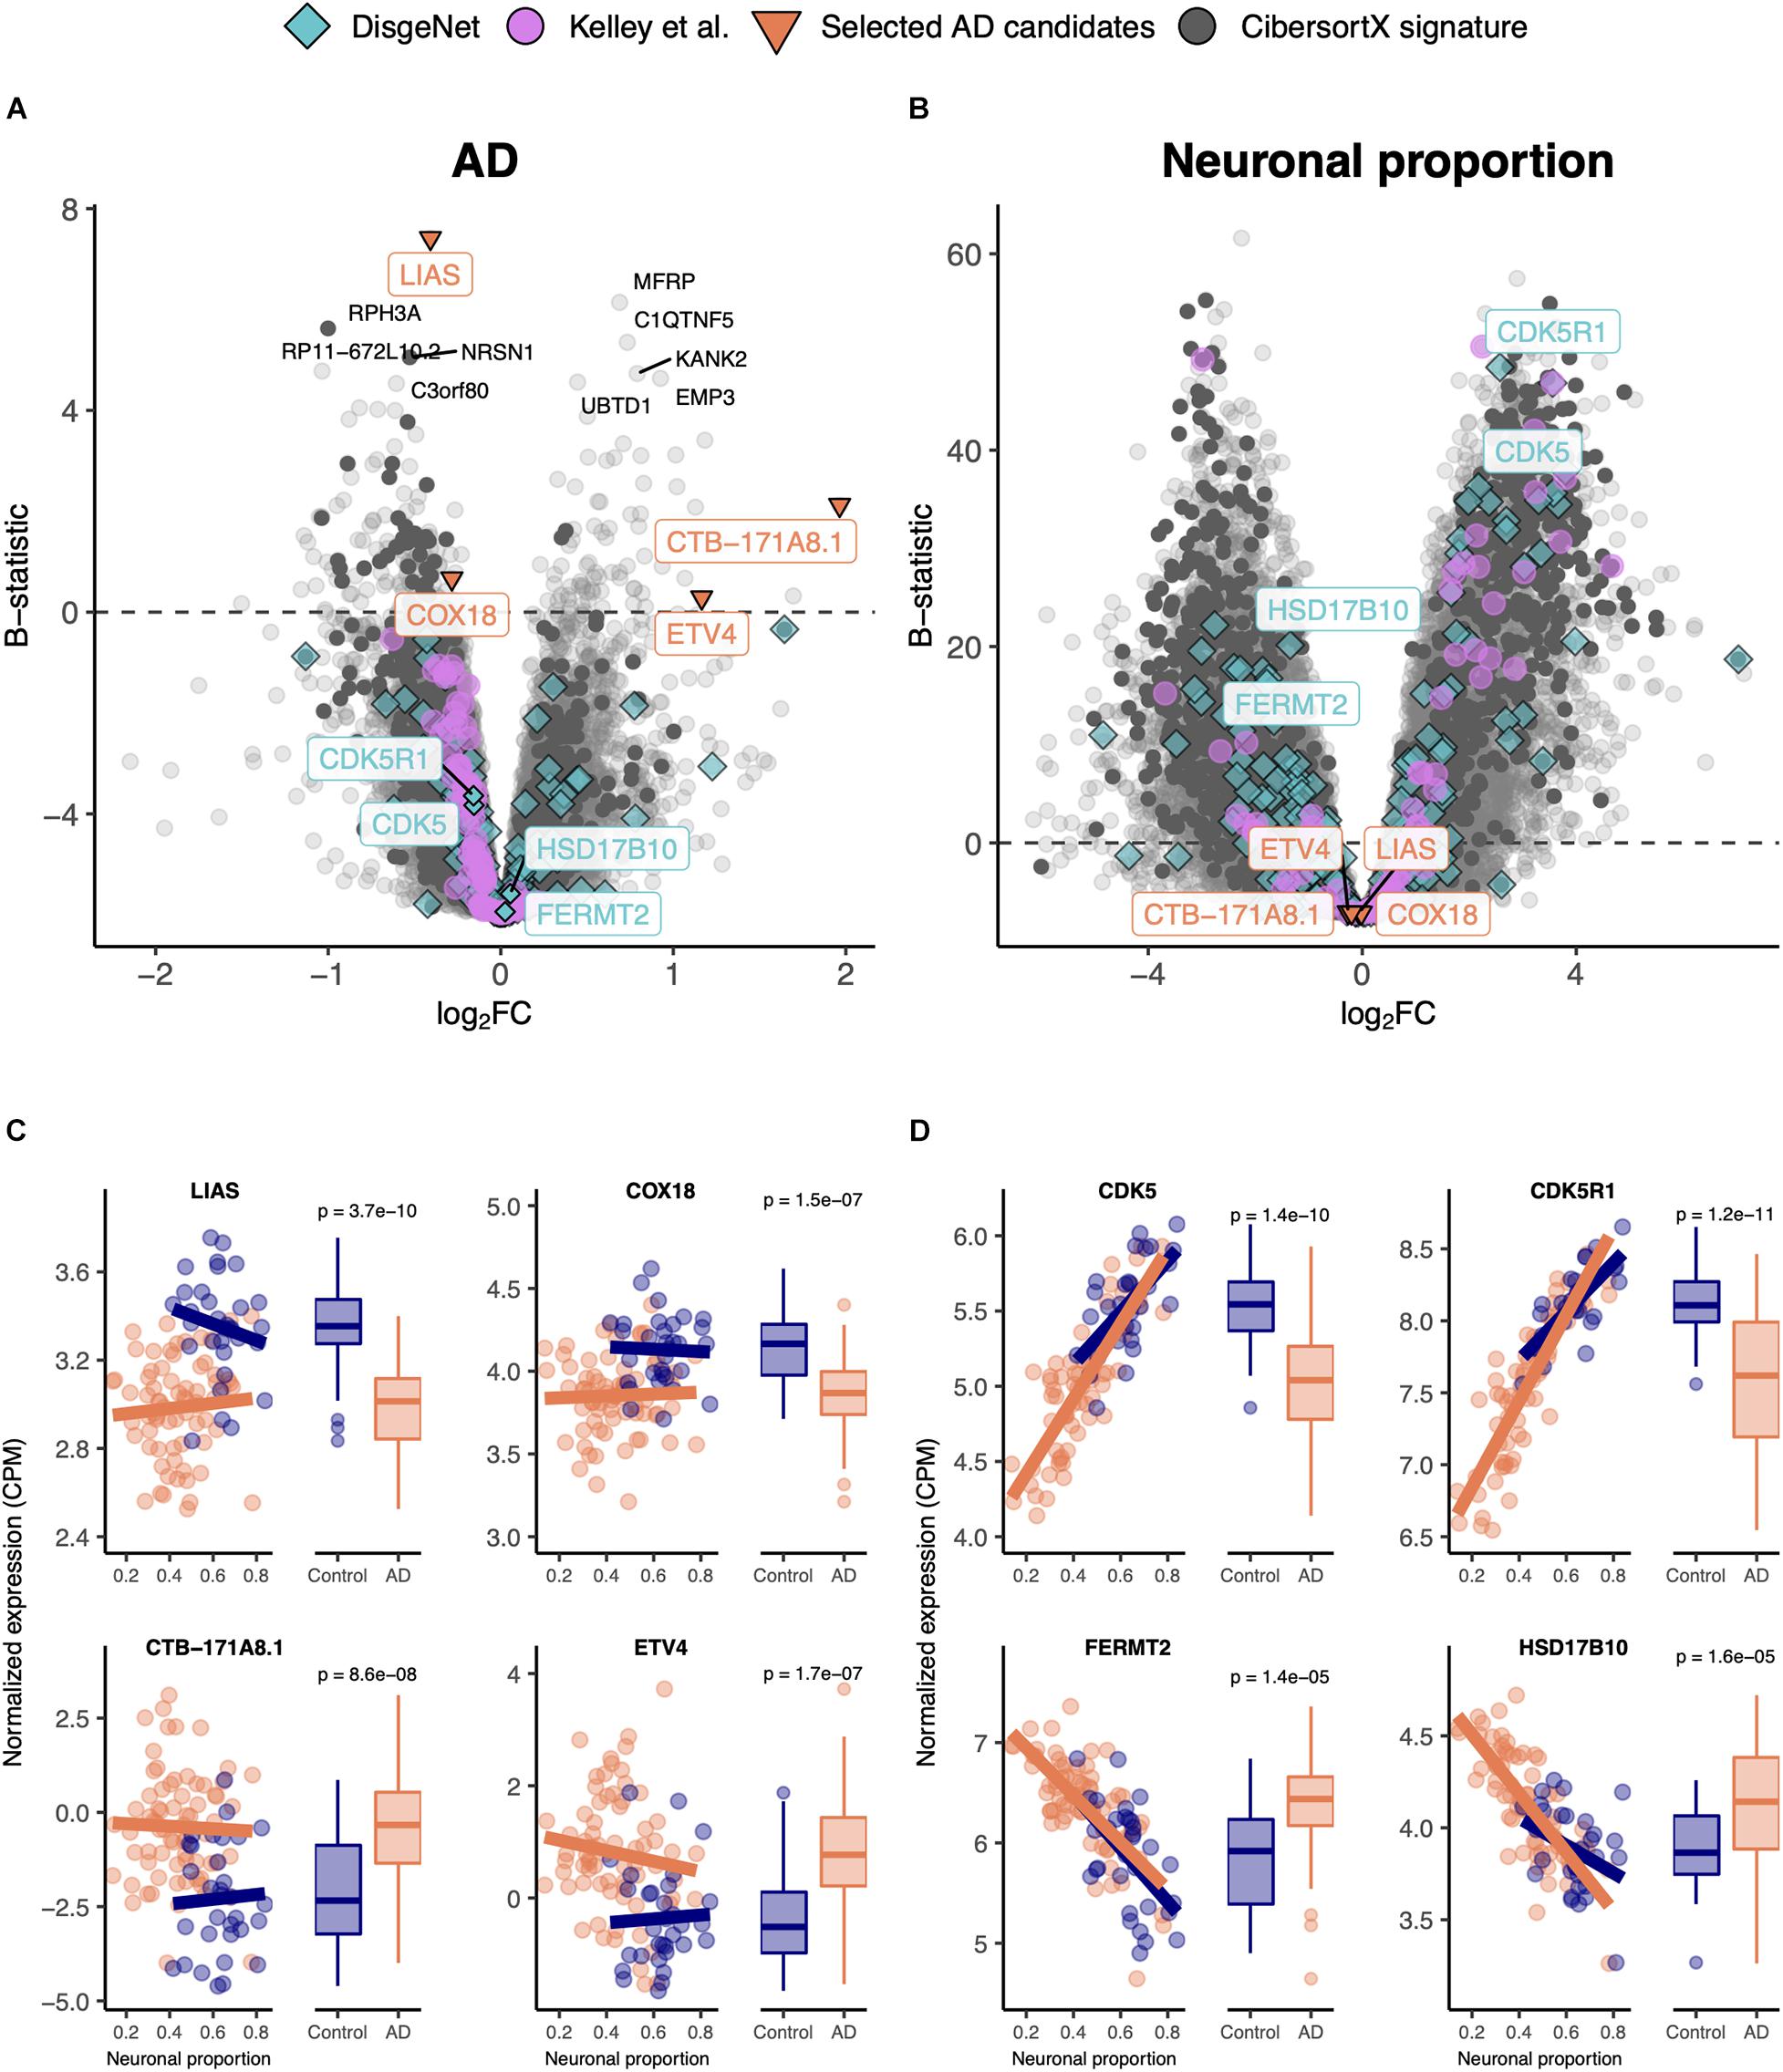
Figure 2. (A,B) Volcano plots, relating log2 fold-changes (log2FC) and B-statistics, of differential gene expression associated with the (A) AD and (B) Neuronal proportion effects in MayoClinic samples. Highlighted with larger colored dots are disease-associated genes from DisgeNet (Piñero et al., 2019) (light blue), genes reported by Kelley et al. (2018) as undergoing cell-type-specific changes in AD (pink), manually selected gene candidates for AD-specific alterations (orange), and genes included in the CIBERSORTx-derived expression signature for the major brain cell types (dark gray). Amongst all these, labeled are genes of particular interest, with individual expression profiles plotted in panels (C,D). The other labeled genes are the top 10 differentially expressed genes. (C) Expression of manually selected gene candidates for AD-specific alterations (labeled in orange in panels (A,B) in Control and AD samples – scatterplots against neuronal proportion on the left, boxplots of distribution by condition on the right. (D) Same as (C) for selected DisgeNet genes (labeled in light blue in panels A,B). Colored solid lines in panels C,D) represent linear regressions. T-tests, for which p-values are indicated, were used to compare gene expression mean differences between Control and AD samples.
AD-Specific Genes are Validated in an Independent Dataset
In order to validate those results, we used the independent AD RNA-seq dataset (lateral temporal lobe) (Nativio et al., 2018), herein named Nativio (Table 1), that we found to better match the larger MayoClinic dataset (temporal cortex) (Allen et al., 2016) in terms of brain area. Although the Nativio dataset did not present significant differences in cellular composition between AD and non-AD samples (Supplementary Figure 11A), its samples were from significantly younger donors (p = 2.7e-10) and the neuronal proportion of its AD samples is significantly different (p = 0.033) from MayoClinic AD samples’ (Supplementary Figure 11C), we found consistency in AD-associated gene expression changes between the MayoClinic and the Nativio datasets (Figure 3 and Supplementary Tables 7–9).
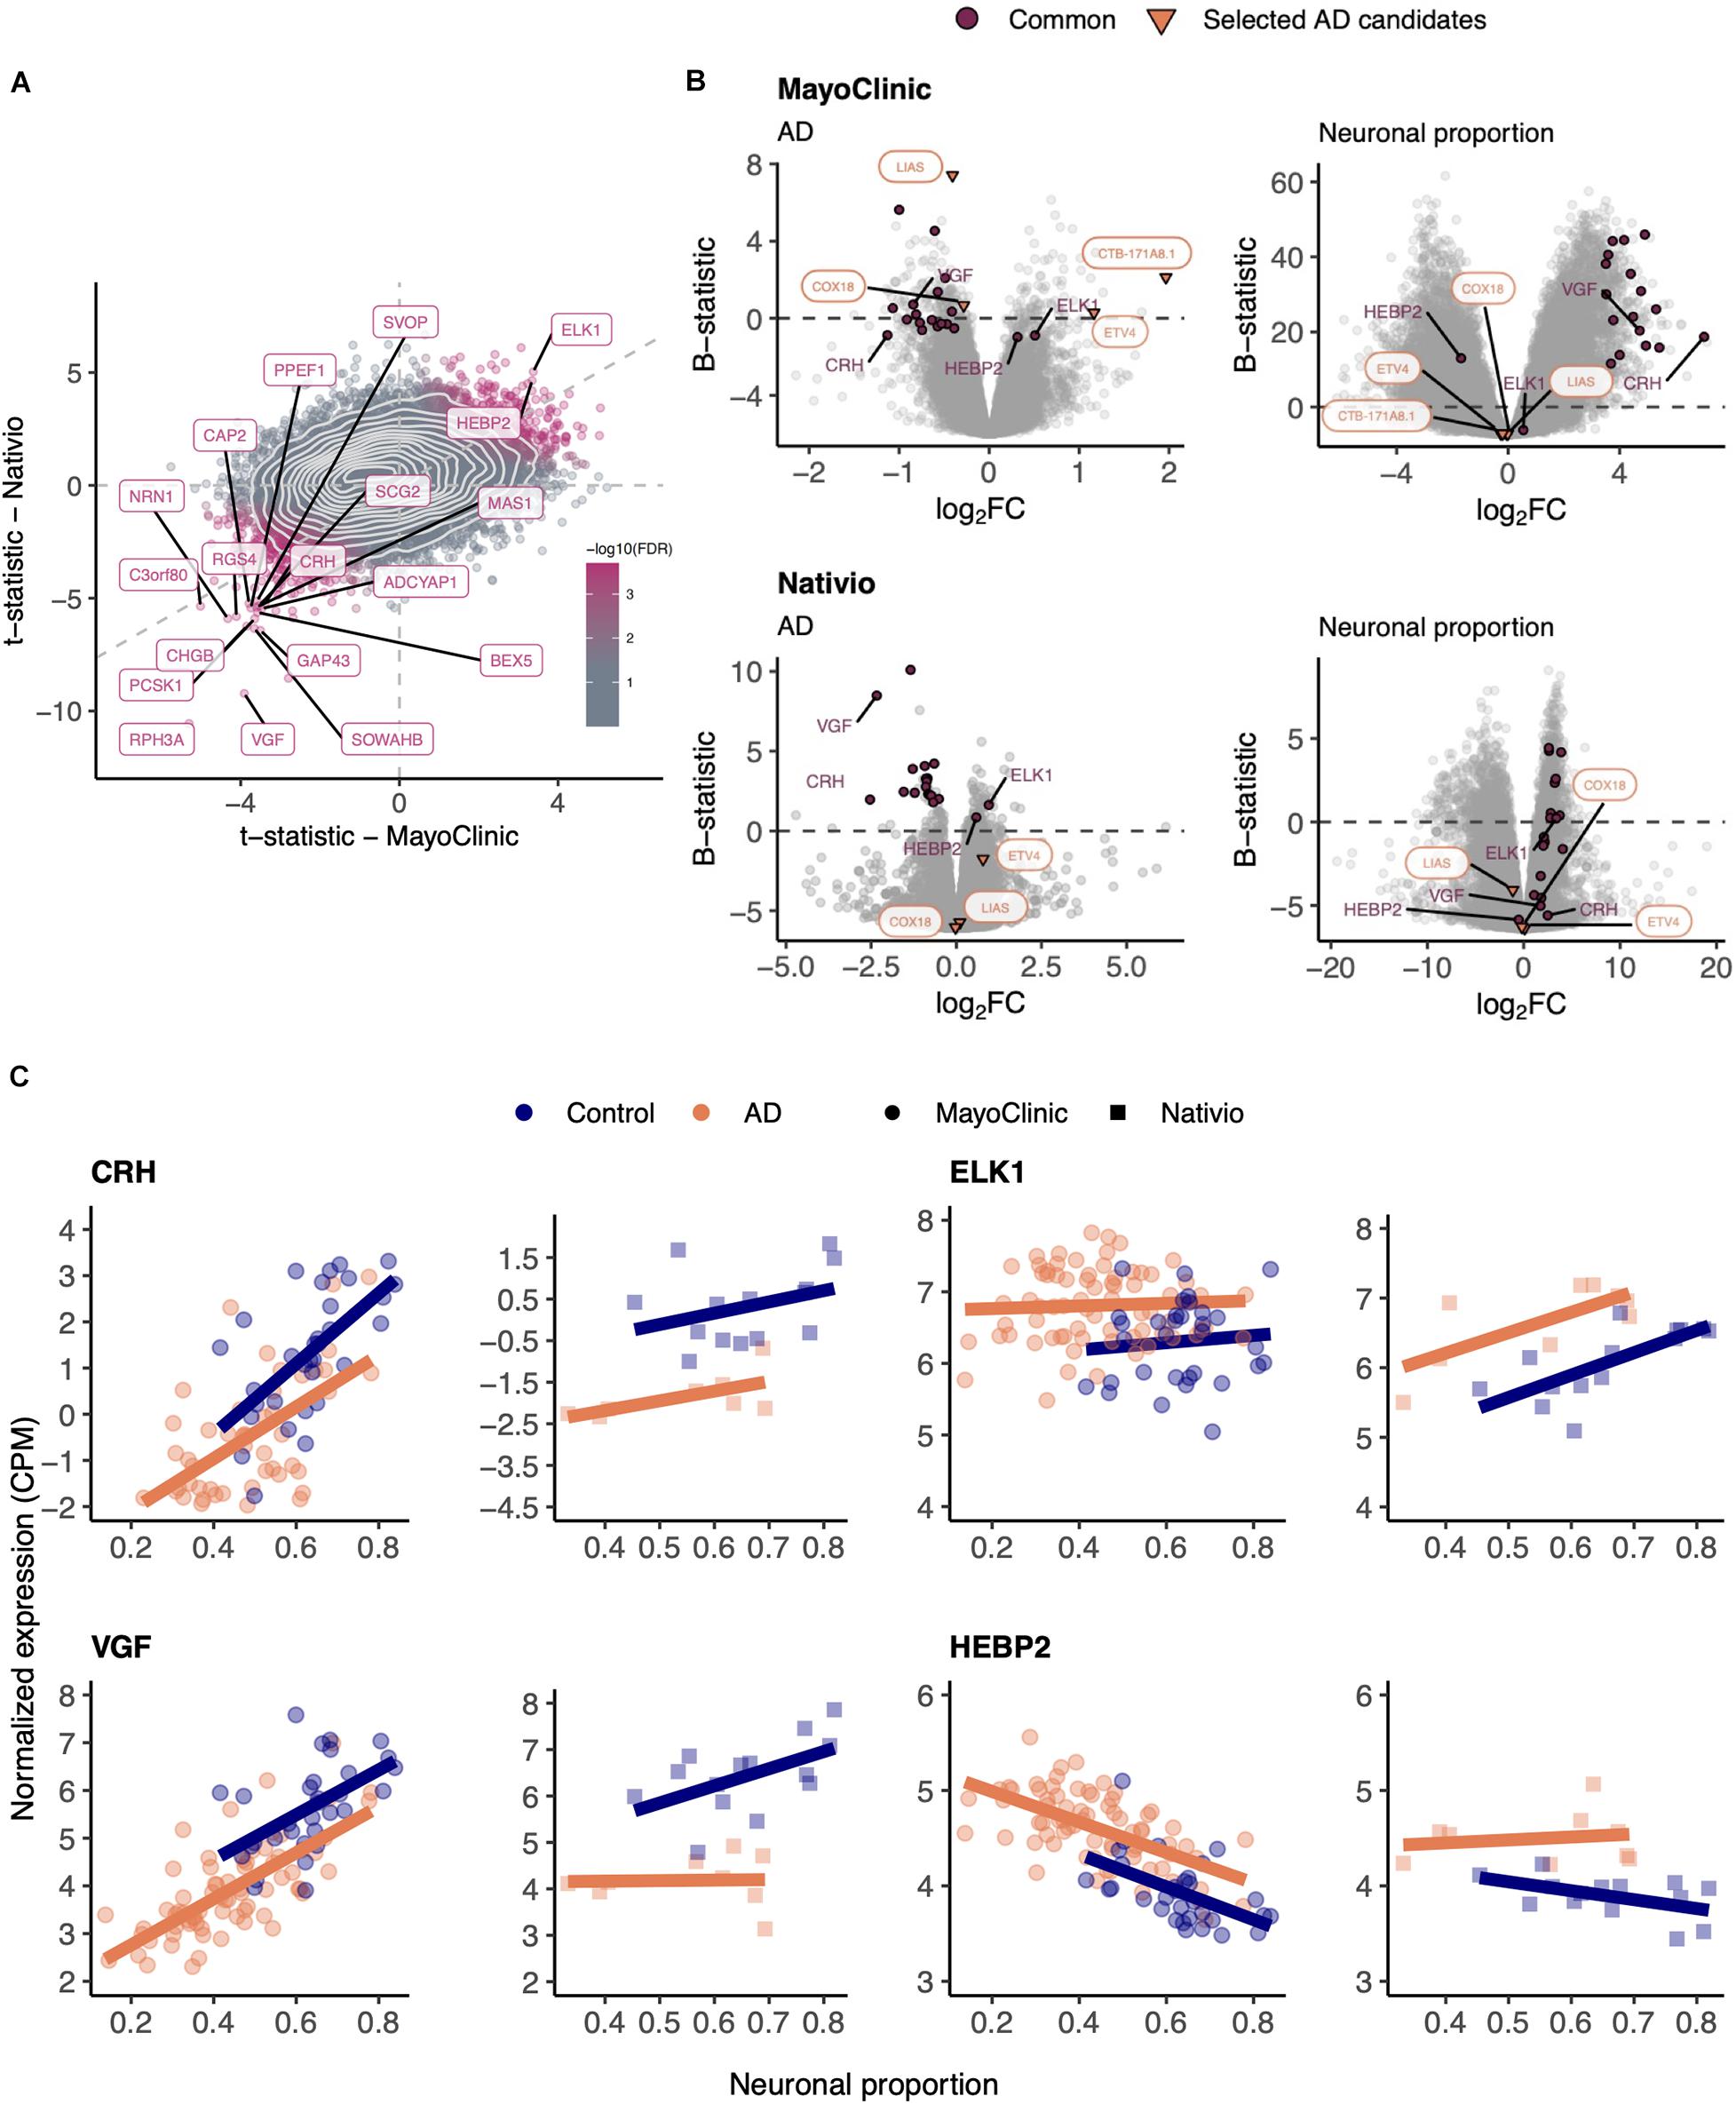
Figure 3. (A) Scatter plot comparing the t-statistics of differential gene expression associated with the AD effect in MayoClinic and Nativio samples. Points (genes) are colored according to the FDR of the random permutation test on the product of the t-statistics (section “Materials and Methods”). Labeled genes are those significantly differentially expressed (FDR < 0.05) in both datasets and significant in that permutation test (FDR < 0.05). Light gray dashed zero and identity lines, light gray solid contour density lines. (B) Volcano plots, relating log2 fold-changes (log2FC) and B-statistics, of differential gene expression associated with the of AD and Neuronal proportion effects in MayoClinic and Nativio samples. Genes highlighted in orange are those manually selected as candidates for AD-specific alterations already represented in Figure 2, those labeled in panel (A) are here highlighted in purple (“Common”), and those here labeled in purple are presented in panel (C). (C) Expression of manually selected “Common” genes in MayoClinic and Nativio samples. Colored solid lines represent linear regressions.
The Human Brain Cellular Composition Is Not Significantly Altered by PD
We analyzed the PD datasets following similar approaches to those used on AD transcriptomes. In the RNA-seq PD dataset (Dumitriu), only two neural (DCX and MAP2) and two microglial (CD40 and ITGAM) markers showed significant alterations between PD and non-PD samples (Figure 4A), concordantly with no significant differences in cellular composition as estimated by CIBERSORTx (Figure 4B) using both the human and the mouse signatures (Supplementary Figures 12A,B). However, the neuronal composition of samples, along with the disease effect, has a significant association with PC1 (Figure 4C – rho = −0.66; p = 3.2e-6) of gene expression. Age also shows a relationship with PC1 (Supplementary Figures 12C,E) but no significant age difference exists between PD and non-PD sample donors (Supplementary Figure 12F).
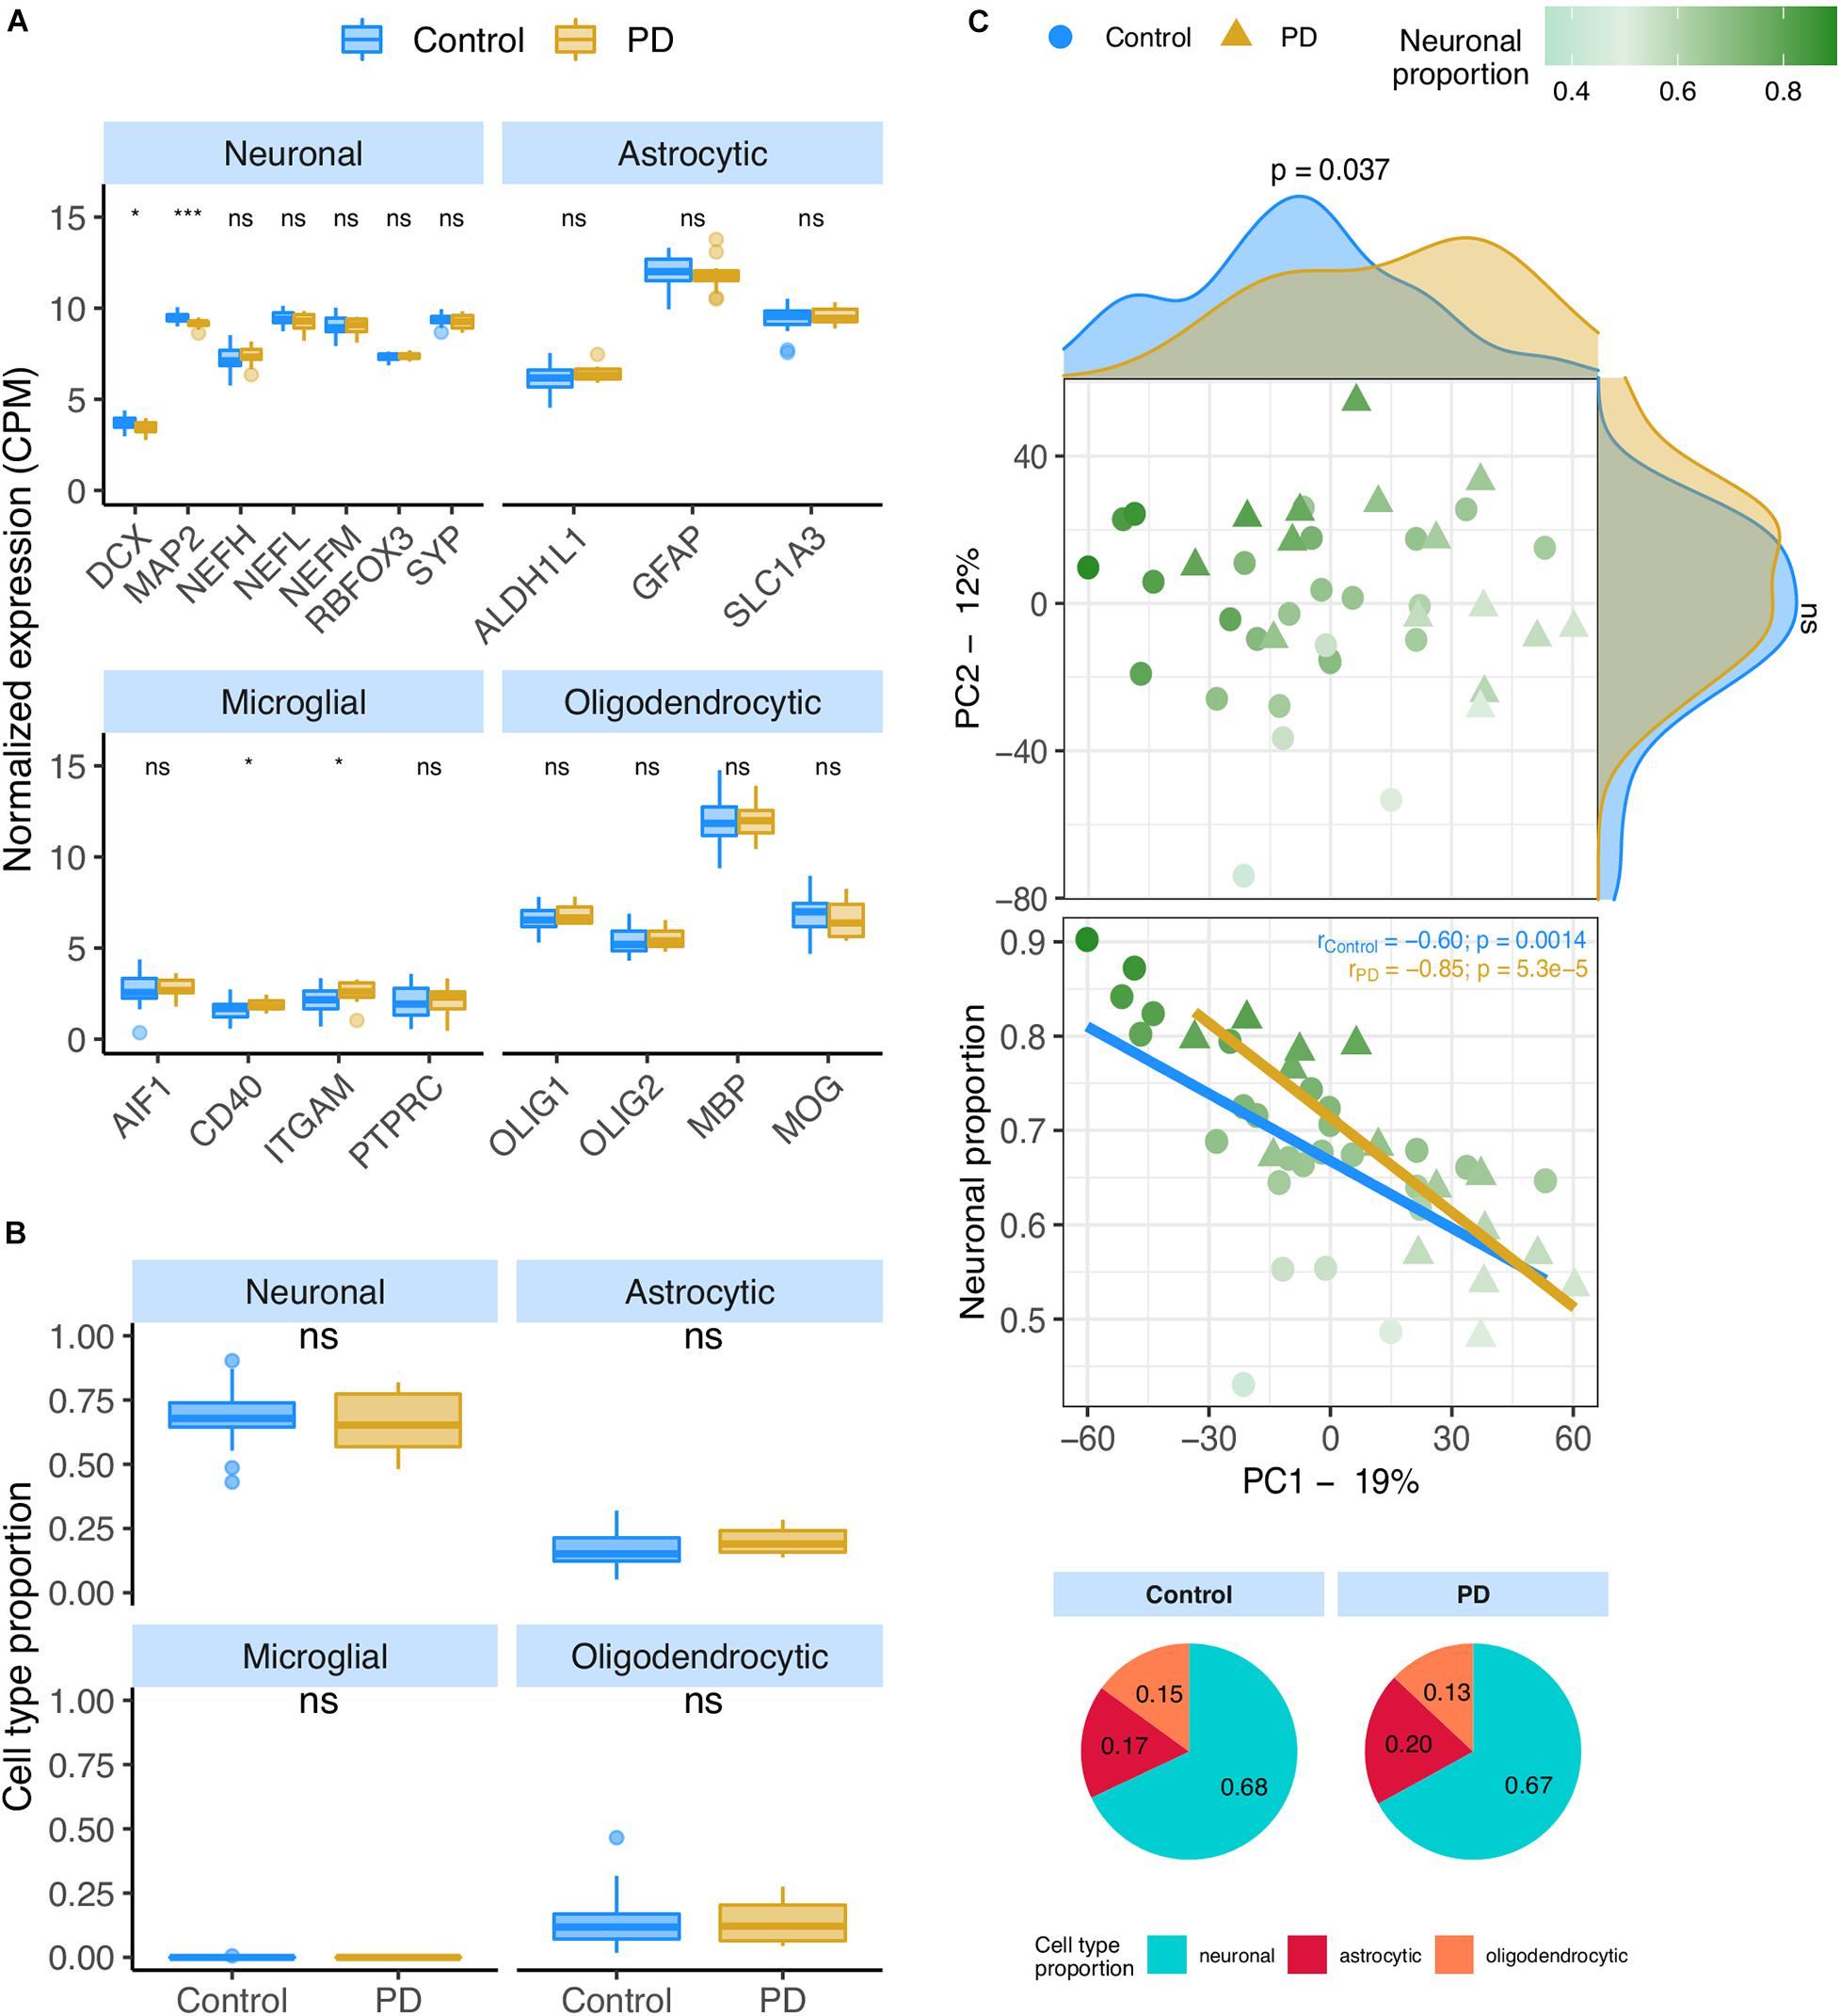
Figure 4. (A) Neuronal, astrocytic, microglial, and oligodendrocytic known markers’ expression in the Dumitriu samples. T-tests were used to compare gene expression mean differences between diseased (PD) and non-diseased (Control) samples. (B) Estimates of the composition of Dumitriu samples in each main cell type based on the human cell type gene expression signature. Wilcoxon signed-rank tests were used to compare differences in proportions between diseased (PD) and non-diseased (Control) samples. (C) Sample factorial map (upper plot) of components 1 (PC1) and 2 (PC2) of Principal Component Analysis (PCA) of the gene expression in Dumitriu samples, and their neuronal proportion related to PC1 loadings (lower plot). Indicated in the respective axes’ labels are the percentages of data variance explained by PC1 and PC2. Kolmogorov-Smirnov tests were used to compare the distributions of PC1 and PC2 loadings between PD and Control samples, illustrated by the smoothed histograms along the respective axes of the PCA plot. In the lower plots, the colored solid lines represent the linear regressions between neuronal proportions and PC1 loadings for PD and Control Samples. The respective Pearson’s correlation coefficients (r) and associated significance (p) are also indicated. Legend: ns: non-significant, ****p ≤ 0.0001, ***p ≤ 0.001, **p ≤0.01, *p ≤0.05.
PD Alters Cortical Gene Expression Independently From Neuronal Loss
Gene expression was modeled for each gene as a function of the technical variables (RIN and unknown confounder), neuronal proportion (i.e., neuronal loss), intrinsic PD and Age (Figure 5A, Supplementary Figure 13A and Supplementary Table 10). No PD-neuronal loss interaction effect was considered because no significant differences in cell type proportions between PD and non-PD samples were detected (Figure 4B). We were thereby able to discriminate genes with a strong disease effect (Figure 5B) from those essentially altered by neuronal loss (Figure 5D). In fact, according to our analysis, genes reported as playing a role in PD [ABL1 (Mahul-Mellier et al., 2014), COMT (Jiménez-Jiménez et al., 2014), GRK5 (Liu et al., 2010), and APT1A3 (Haq et al., 2019)] were found associated with neuronal loss rather than the disease itself (Figures 5A,C).
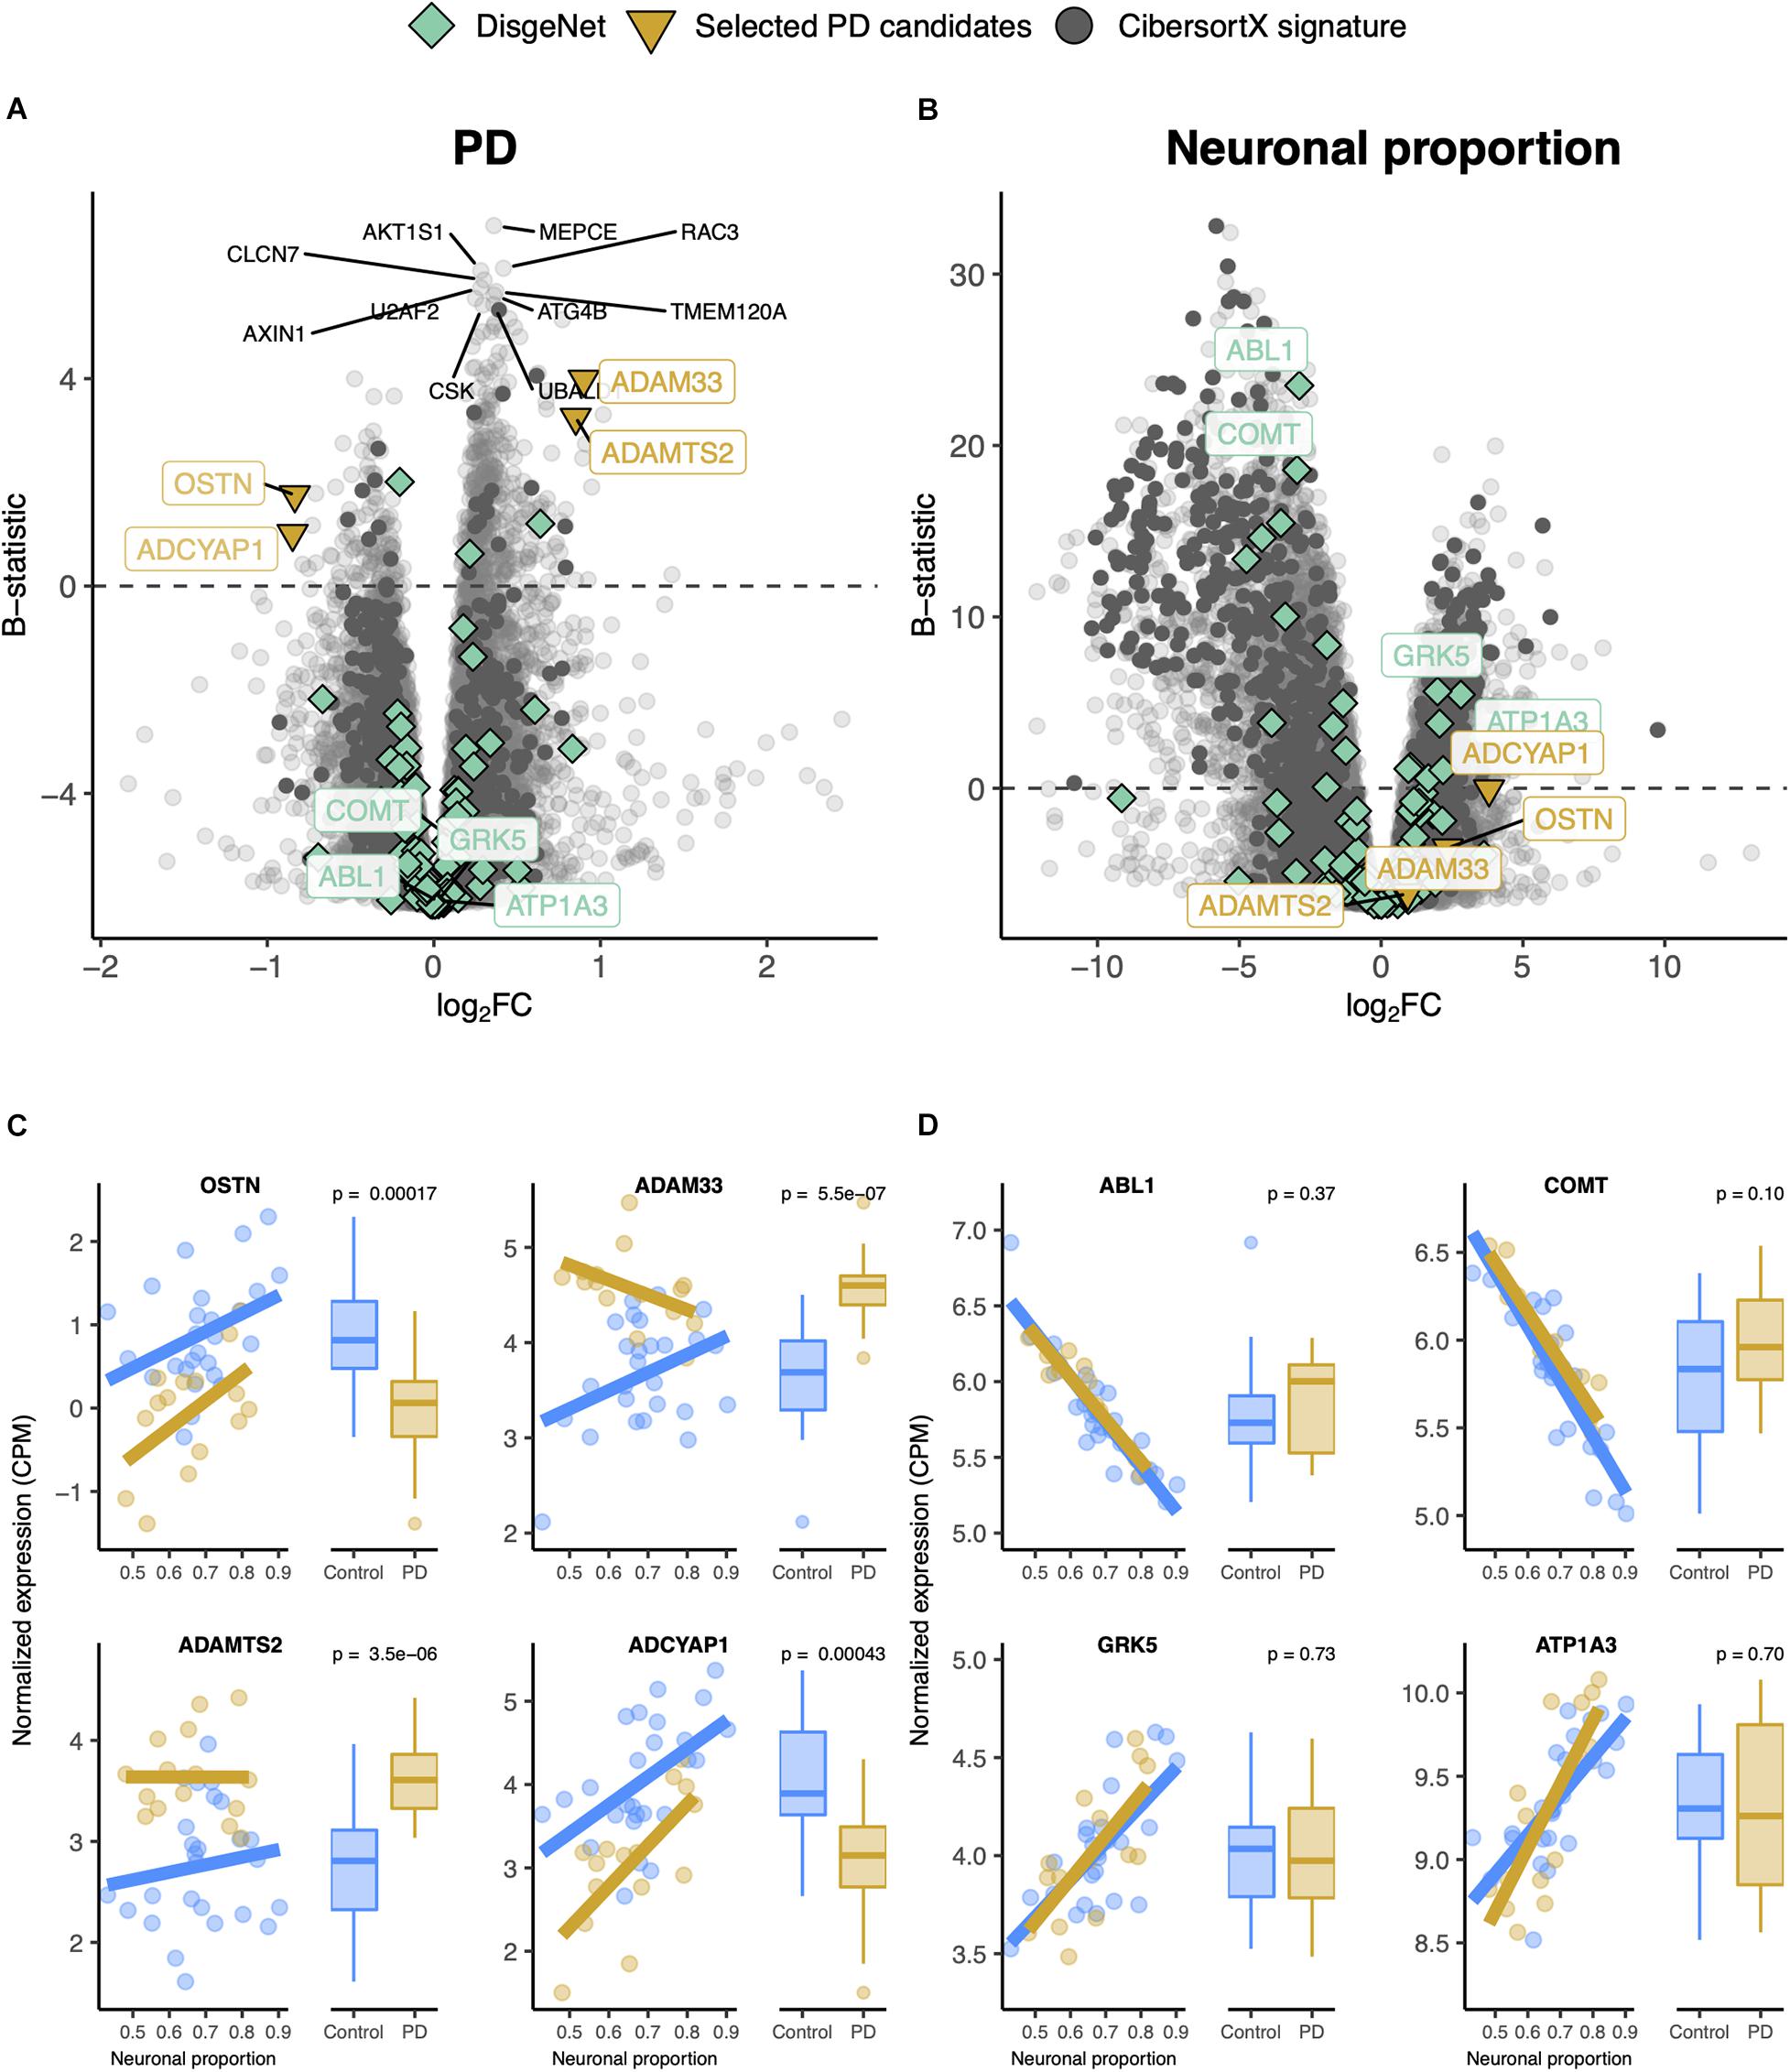
Figure 5. (A,B) Volcano plots, relating log2 fold-changes (log2FC) and B-statistics, of differential gene expression associated with the (A) PD and (B) Neuronal proportion effects in Dumitriu samples. Highlighted with larger colored dots are disease-associated genes from DisgeNet (Piñero et al., 2019) (light green), manually selected gene candidates for PD-specific alterations (yellow), and genes included in the CIBERSORTx-derived expression signature for the major brain cell types (dark gray). Amongst all these, labeled are genes of particular interest, with individual expression profiles plotted in panels (C,D). The other labeled genes are the top 10 differentially expressed genes. (C) Expression of manually selected gene candidates for PD-specific alterations (labeled in yellow in panels A,B) in Control and PD samples – scatterplots against neuronal proportion on the left, boxplots of distribution by condition on the right. (D) Same as (C) for selected DisgeNet genes (labeled in light green in panels A,B). Colored solid lines in panels (C,D) represent linear regressions. T-tests, for which p-values are indicated, were used to compare gene expression mean differences between Control and PD samples.
PD-Specific Genes are Validated in an Independent Dataset
Although RNA-seq provides a more precise quantification of gene expression than microarrays (Wang et al., 2009), we could not find any other independent PD RNA-seq dataset matching, in terms of brain region, the Dumitriu study and therefore resorted to the Zhang microarray study. This independent dataset did not present any significant cellular composition alteration between PD and non-PD samples (Supplementary Figure 14A) either. Additionally, we found no significant differences in neuronal proportion estimates or age between samples from the Dumitriu and Zhang studies (Supplementary Figure 14C). We find gene expression changes that are consistent between the two analyzed PD datasets (Figures 6A,B and Supplementary Tables 10–13), including for LRRC40 and ABCB6 (Figure 6C). However, from the selected PD candidates as examples shown in Figure 5, only ADAMTS2 and ADCYAP1 were profiled in the Zhang dataset and did not recapitulate the changes observed in the Dumitriu dataset (Figure 6B).
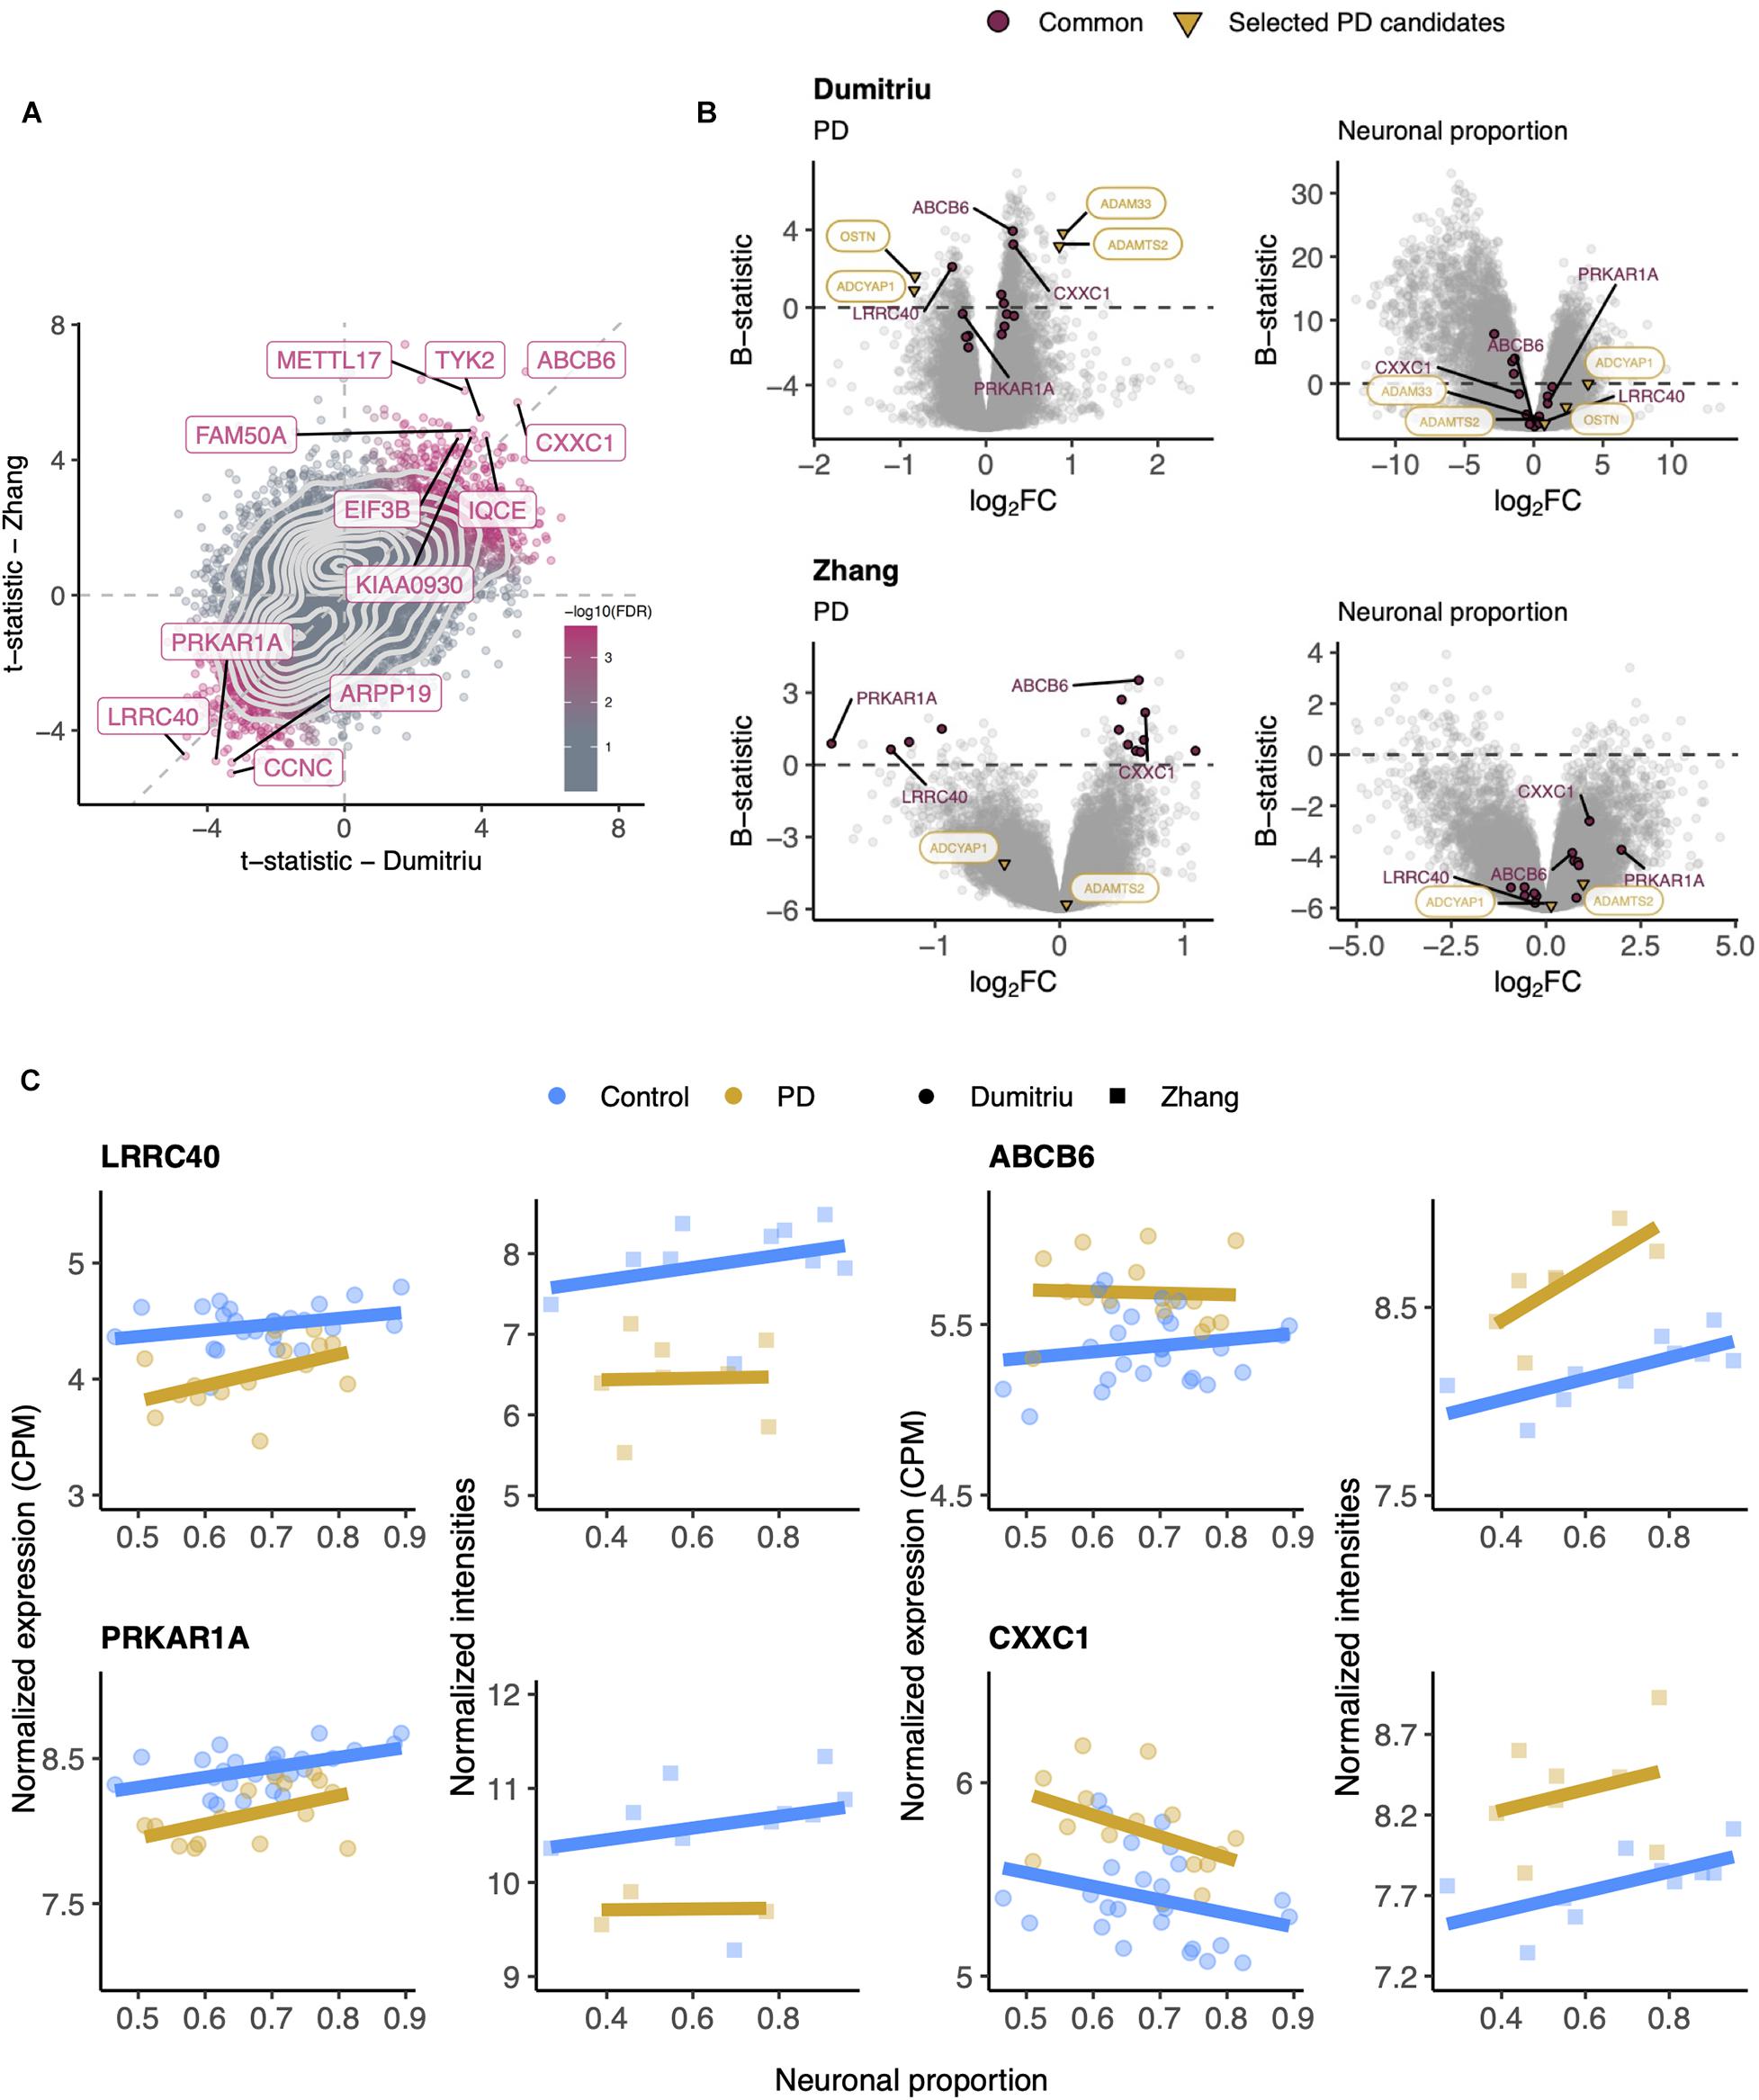
Figure 6. (A) Scatter plot comparing the t-statistics of differential gene expression associated with the PD effect in Dumitriu and Zhang samples. Points (genes) are colored according to the FDR of the random permutation test on the product of the t-statistics (section “Materials and Methods”). Labeled genes are those significantly differentially expressed (FDR < 0.05 – Dumitriu and FDR < 0.11 – Zhang, section “Materials and Methods”) in both datasets and significant in that permutation test (FDR < 0.05). Light gray dashed zero and identity lines, light gray solid contour density lines. (B) Volcano plots, relating log2 fold-changes (log2FC) and B-statistics, of differential gene expression associated with the of PD and Neuronal proportion effects in Dumitriu and Zhang samples. Genes highlighted in orange are those manually selected as candidates for PD-specific alterations already represented in Figure 5, those labeled in panel (A) are here highlighted in purple (“Common”), and those labeled in purple are presented in panel (C). (C) Expression of manually selected “Common” genes in Dumitriu and Zhang samples. Colored solid lines represent linear regressions.
Common AD- and PD-Associated Gene Expression Alterations are Related With Cell Survival and Metabolism
Alzheimer’s diseases and PD-associated gene expression changes in human brains are very correlated (Figure 7A and Supplementary Tables 14, 15), suggesting commonalities in the molecular mechanisms underlying both diseases. Although some neuronal markers are amongst the genes commonly altered by AD and PD, most of them are not, indicating effectivity in decoupling the neuronal loss effect on gene expression (Figure 7A). Genes consistently up-regulated in both diseases are linked to Wnt signaling (basal cell carcinoma pathway) and NF-KB signaling (acute myeloid leukemia) (Figure 7B). Indeed, the genes driving the basal cell carcinoma pathway are FZD9, FZD7, FZD2, DVL1, and AXIN1, all playing a role in the Wnt signaling pathway, which has already been linked to AD and PD (Harvey and Marchetti, 2014). The genes contributing the most to the acute myeloid leukemia pathway (RAF1, RELA, and IKBKB) are related with NF-KB signaling, a process already known to also play a role in AD and PD (Mattson and Meffert, 2006). Genes consistently down-regulated in both diseases are linked essentially to cell metabolism (Figure 7B). Although the magnitude of disease-induced changes in gene expression is generally modest (as expected, as samples from the same type of tissue are being compared), reassuringly they are overall quite independent from the neuronal composition of the brain samples (Figure 7C).
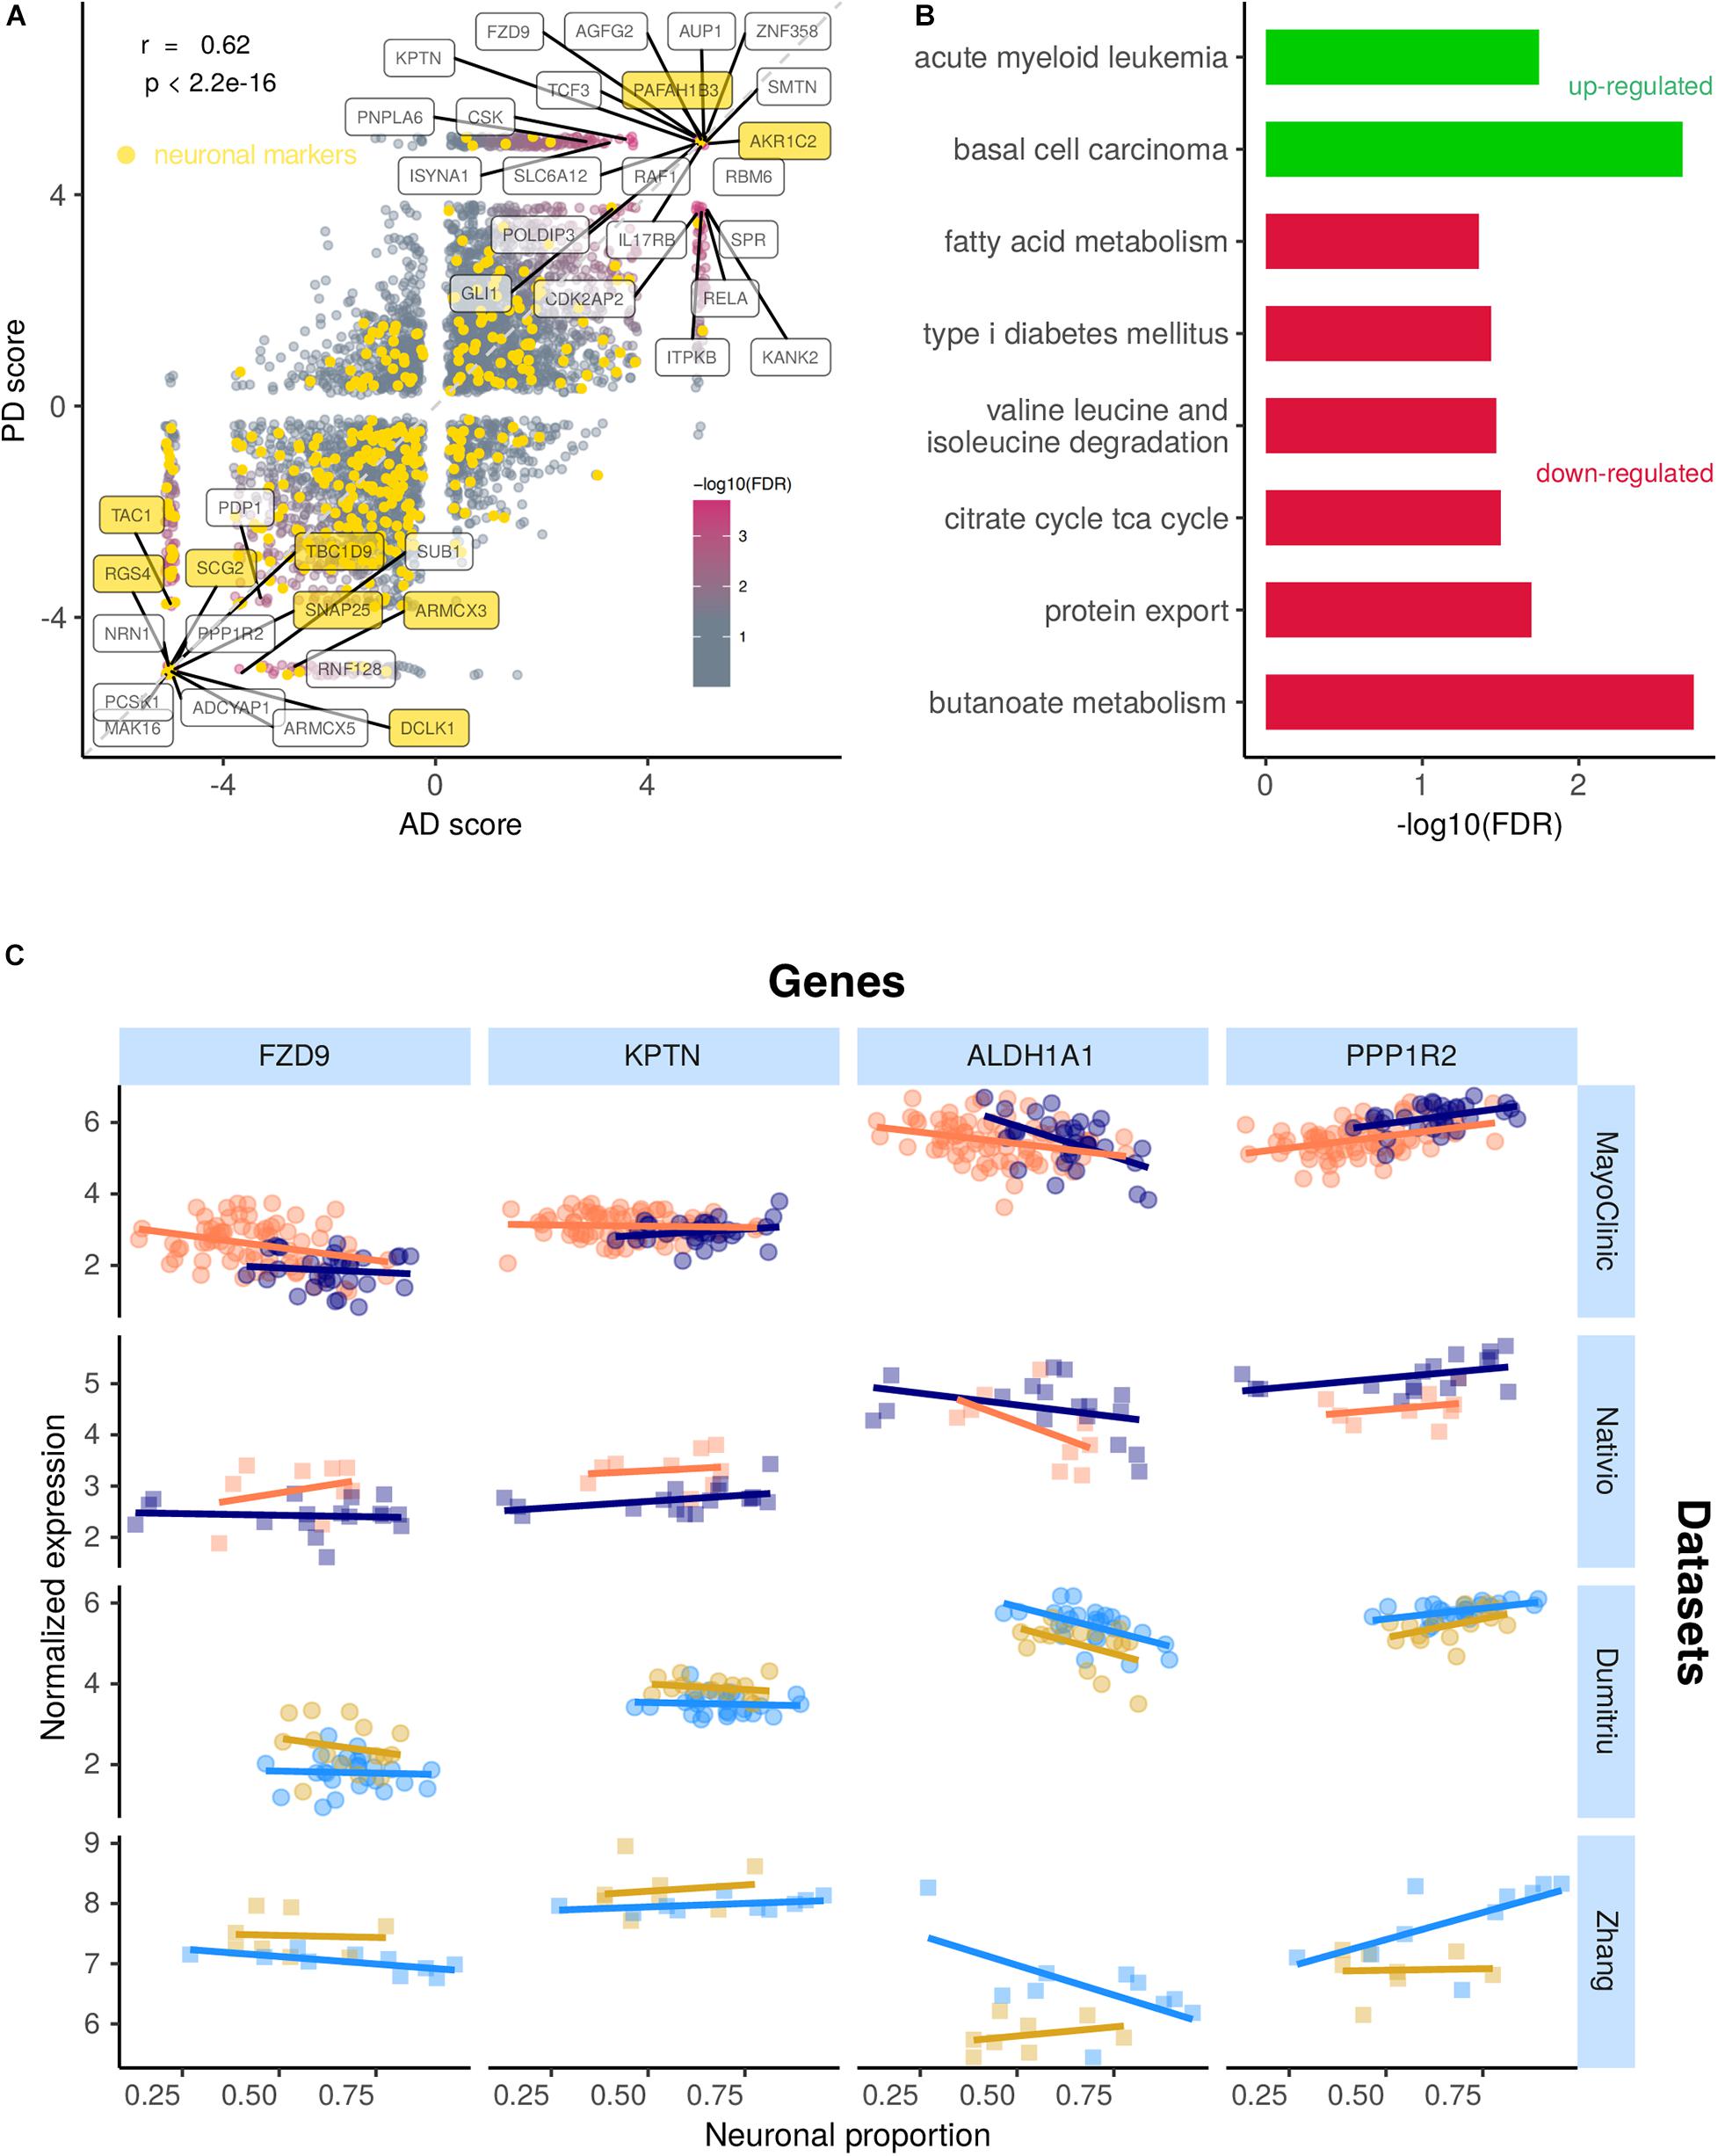
Figure 7. (A) Scatter plot comparing the combined scores of differential gene expression (section “Materials and Methods”) associated with the AD and the PD effects. Labeled genes are those highly significant (FDR < 0.0005) in the random permutation test of the product of scores (section “Materials and Methods”). The Pearson’s correlation coefficient (r) between scores and associated significance (p) are also indicated. Neuronal gene markers included in the CIBERSORTx-derived cell-type expression signature depicted in yellow. Identity line in dashed gray. (B) Significance of enrichment of KEGG pathways in genes up-regulated (green) and down-regulated (red) in both AD and PD (section “Materials and Methods”). (C) Expression of selected genes commonly altered in AD and PD in samples from all analyzed datasets against their neuronal proportion.
Metaraminol Administration Is Inversely Correlated with the AD- and PD-Gene Expression Phenotype
We used cTRAP (de Almeida et al., 2020) to identify drugs that, when delivered to human cell lines, cause similar (correlated) or opposite (anti-correlated) gene expression changes to those we observed as intrinsically associated to AD and PD (Figures 8A,C). Interestingly, gene expression perturbations induced by drugs known to be used in the clinic to treat AD (Siavelis et al., 2016) (donepezil, galantamine, memantine, and rivastigmine) and PD (Zahoor et al., 2018) (amantadine, bromocriptine, cabergoline, carbidopa, entacapone, levodopa, lisuride, and selegiline) were not amongst the most correlated with those by the respective target diseases (Figures 8A,B and Supplementary Tables 16–18). Siavelis et al. (2016) had followed a similar approach, although they did not decouple the neuronal loss effect, having identified 27 drugs linked to the AD phenotype (Figure 8A). Chloroquine and scriptaid seem promising drug candidates for AD since their known targets are indeed overexpressed in AD and vary very little with neuronal loss (Figure 8B). Scriptaid also seems promising for PD therapeutics for similar reasons (Figure 8D). Additionally, gene expression changes upon metaraminol administration showed up as being the most anti-correlated with those commonly induced by AD and PD (Figure 9), being metaraminol therefore a potential candidate drug to be tested for repurposing. Gene expression changes upon wortmannin administration are, in a dose dependent manner, the most correlated with those commonly induced by AD and PD (Figure 9).
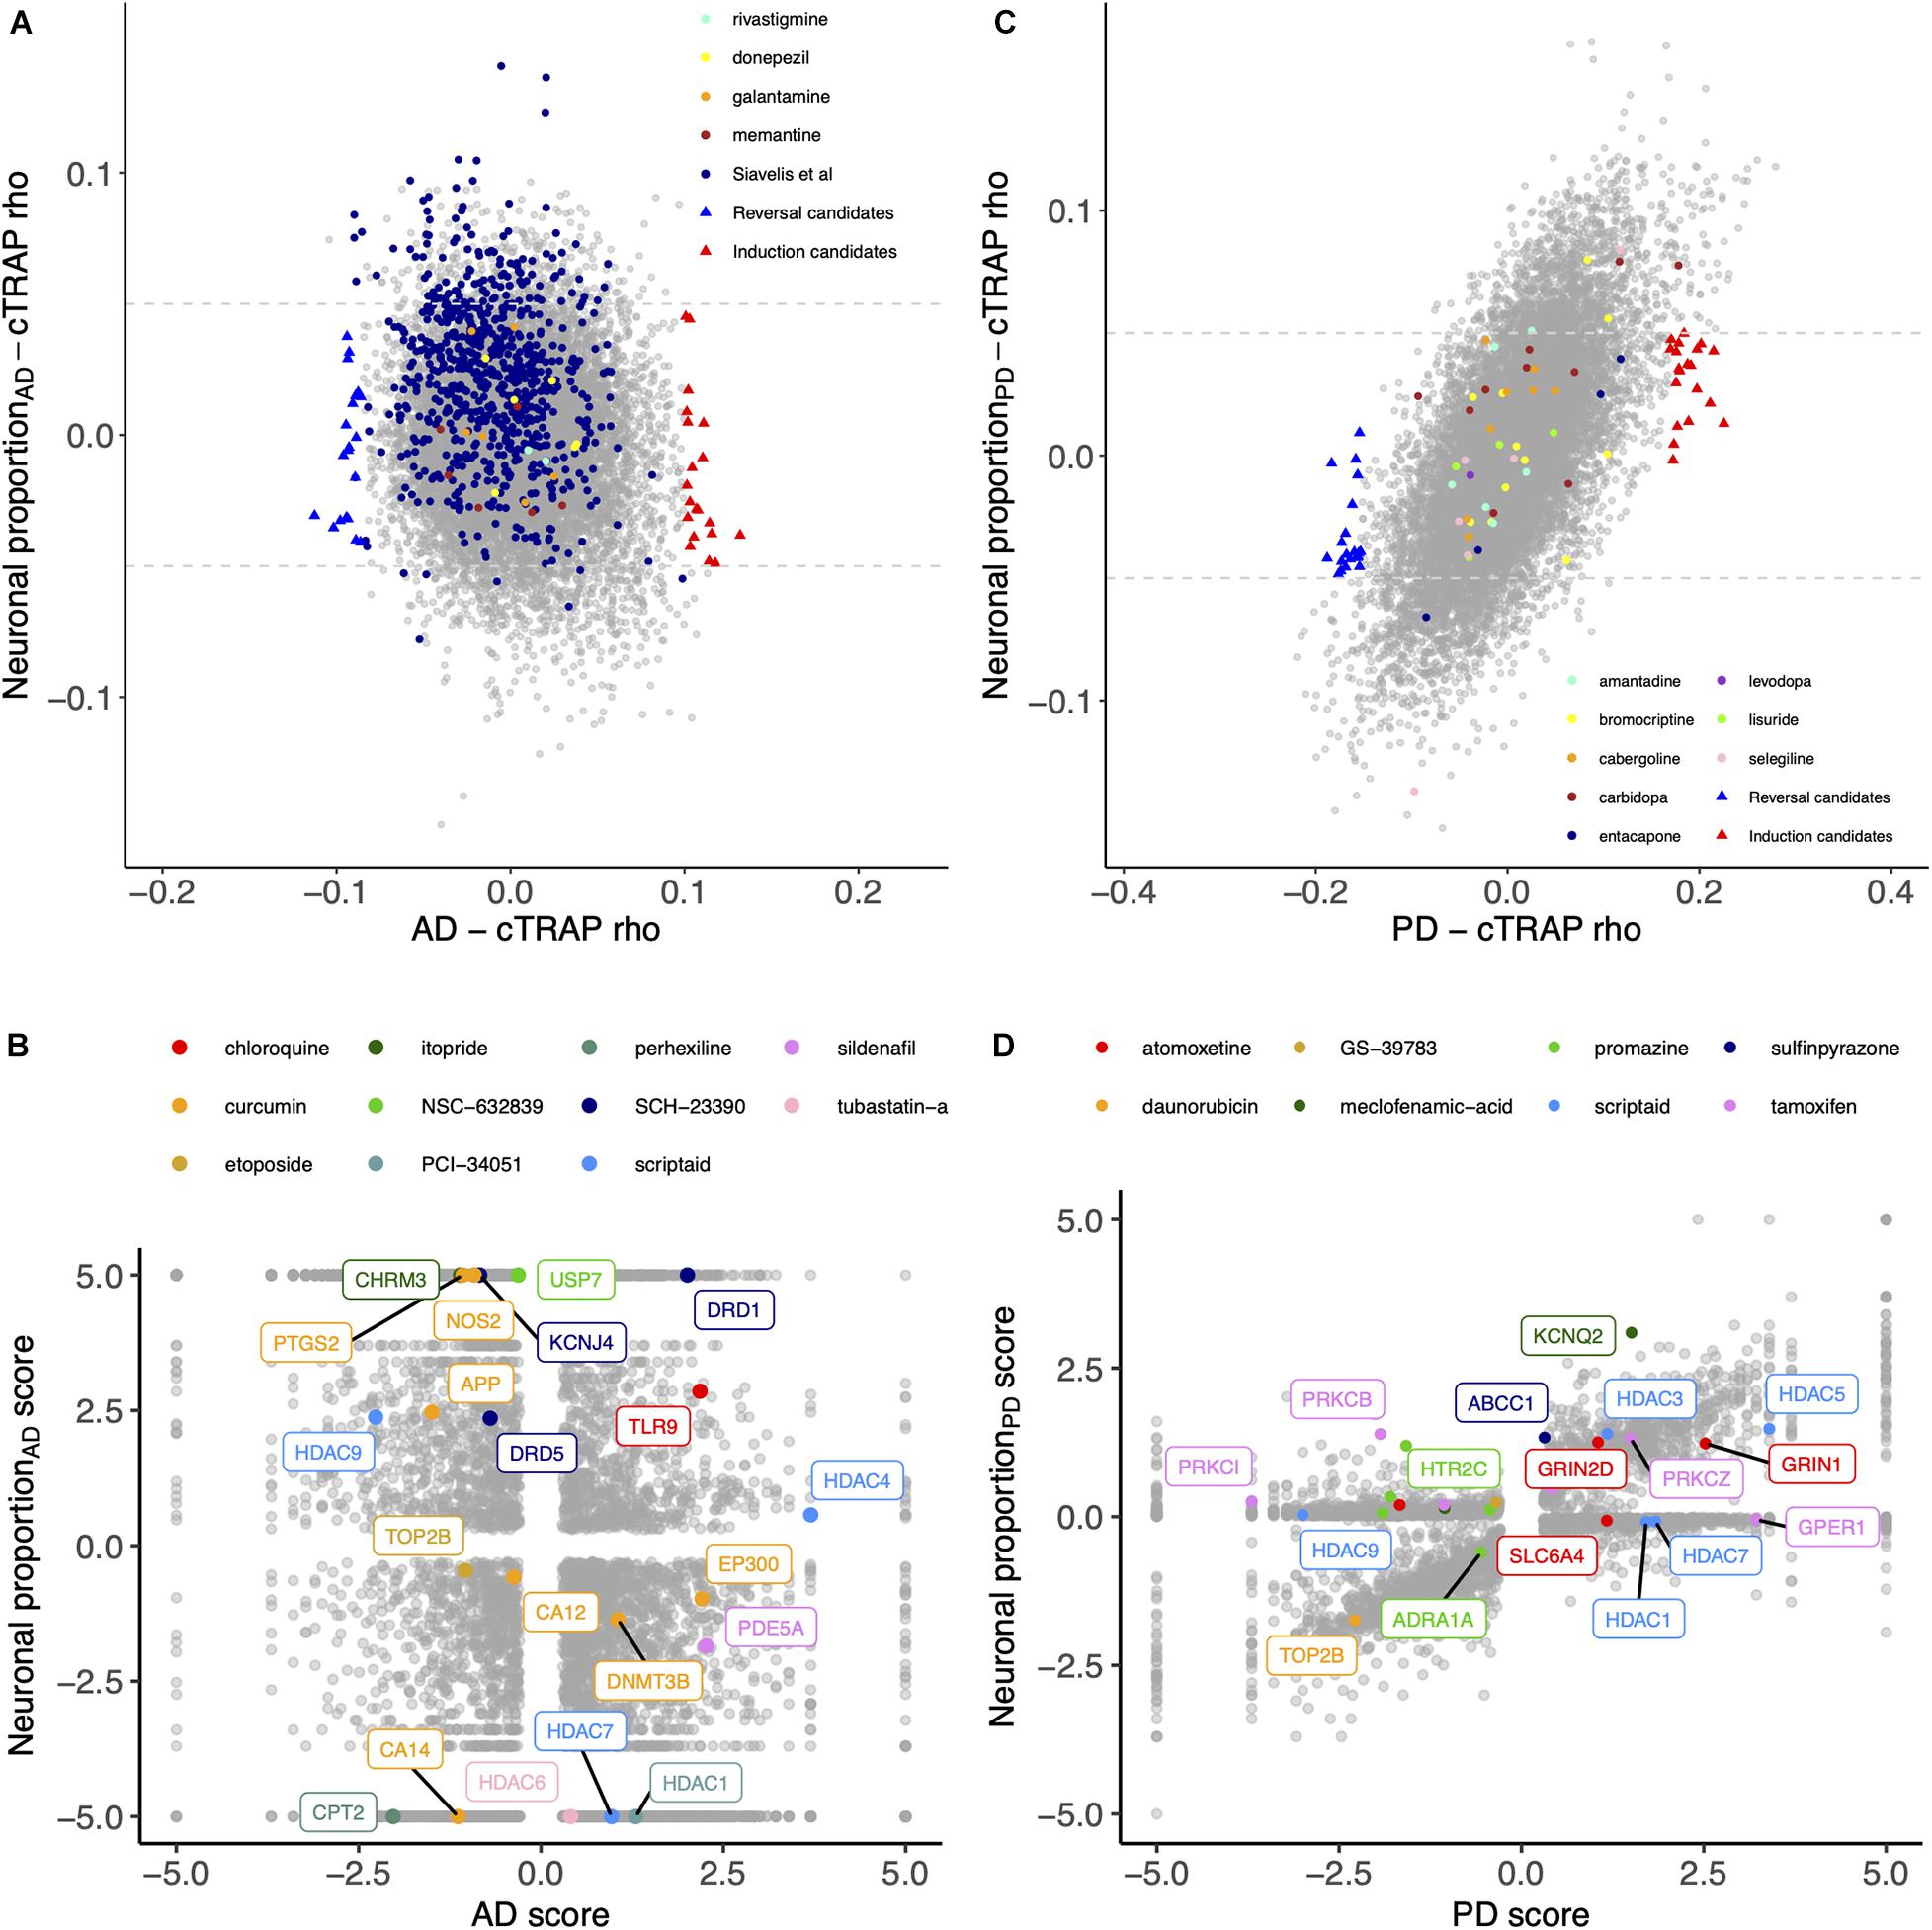
Figure 8. (A) Scatter plot comparing, between the AD and the Neuronal proportion effects, the cTRAP-derived cross-gene Spearman’s correlation coefficients (rho) of their differential expression combined scores with perturbation z-scores for cMap compounds. Highlighted with blue and red triangles are compounds selected as top candidates for, respectively, reversal and induction of AD-associated gene expression alterations (Supplementary Figure 15A; section “Materials and Methods”). Colored circles highlight compounds in use for AD treatments, including those listed by Siavelis et al. (2016). (B) Scatter plot comparing the combined scores of differential gene expression between the AD and the Neuronal proportion effects. Highlighted genes are known targets of selected candidate compounds for reversal of AD-associated gene expression alterations (Supplementary Figure 15A). (C) Scatter plot comparing, between the PD and the Neuronal proportion effects, the cTRAP-derived cross-gene Spearman’s correlation coefficients (rho) of their differential expression combined scores with perturbation z-scores for cMap compounds. Highlighted with blue and red triangles are compounds selected as top candidates for, respectively, reversal and induction of PD-associated gene expression alterations (Supplementary Figure 15B; section “Materials and Methods”). Colored circles highlight compounds in use for PD treatments. (D) Scatter plot comparing the combined scores of differential gene expression between the PD and the Neuronal proportion effects. Highlighted genes are known targets of selected candidate compounds for reversal of PD-associated gene expression alterations (Supplementary Figure 15B).
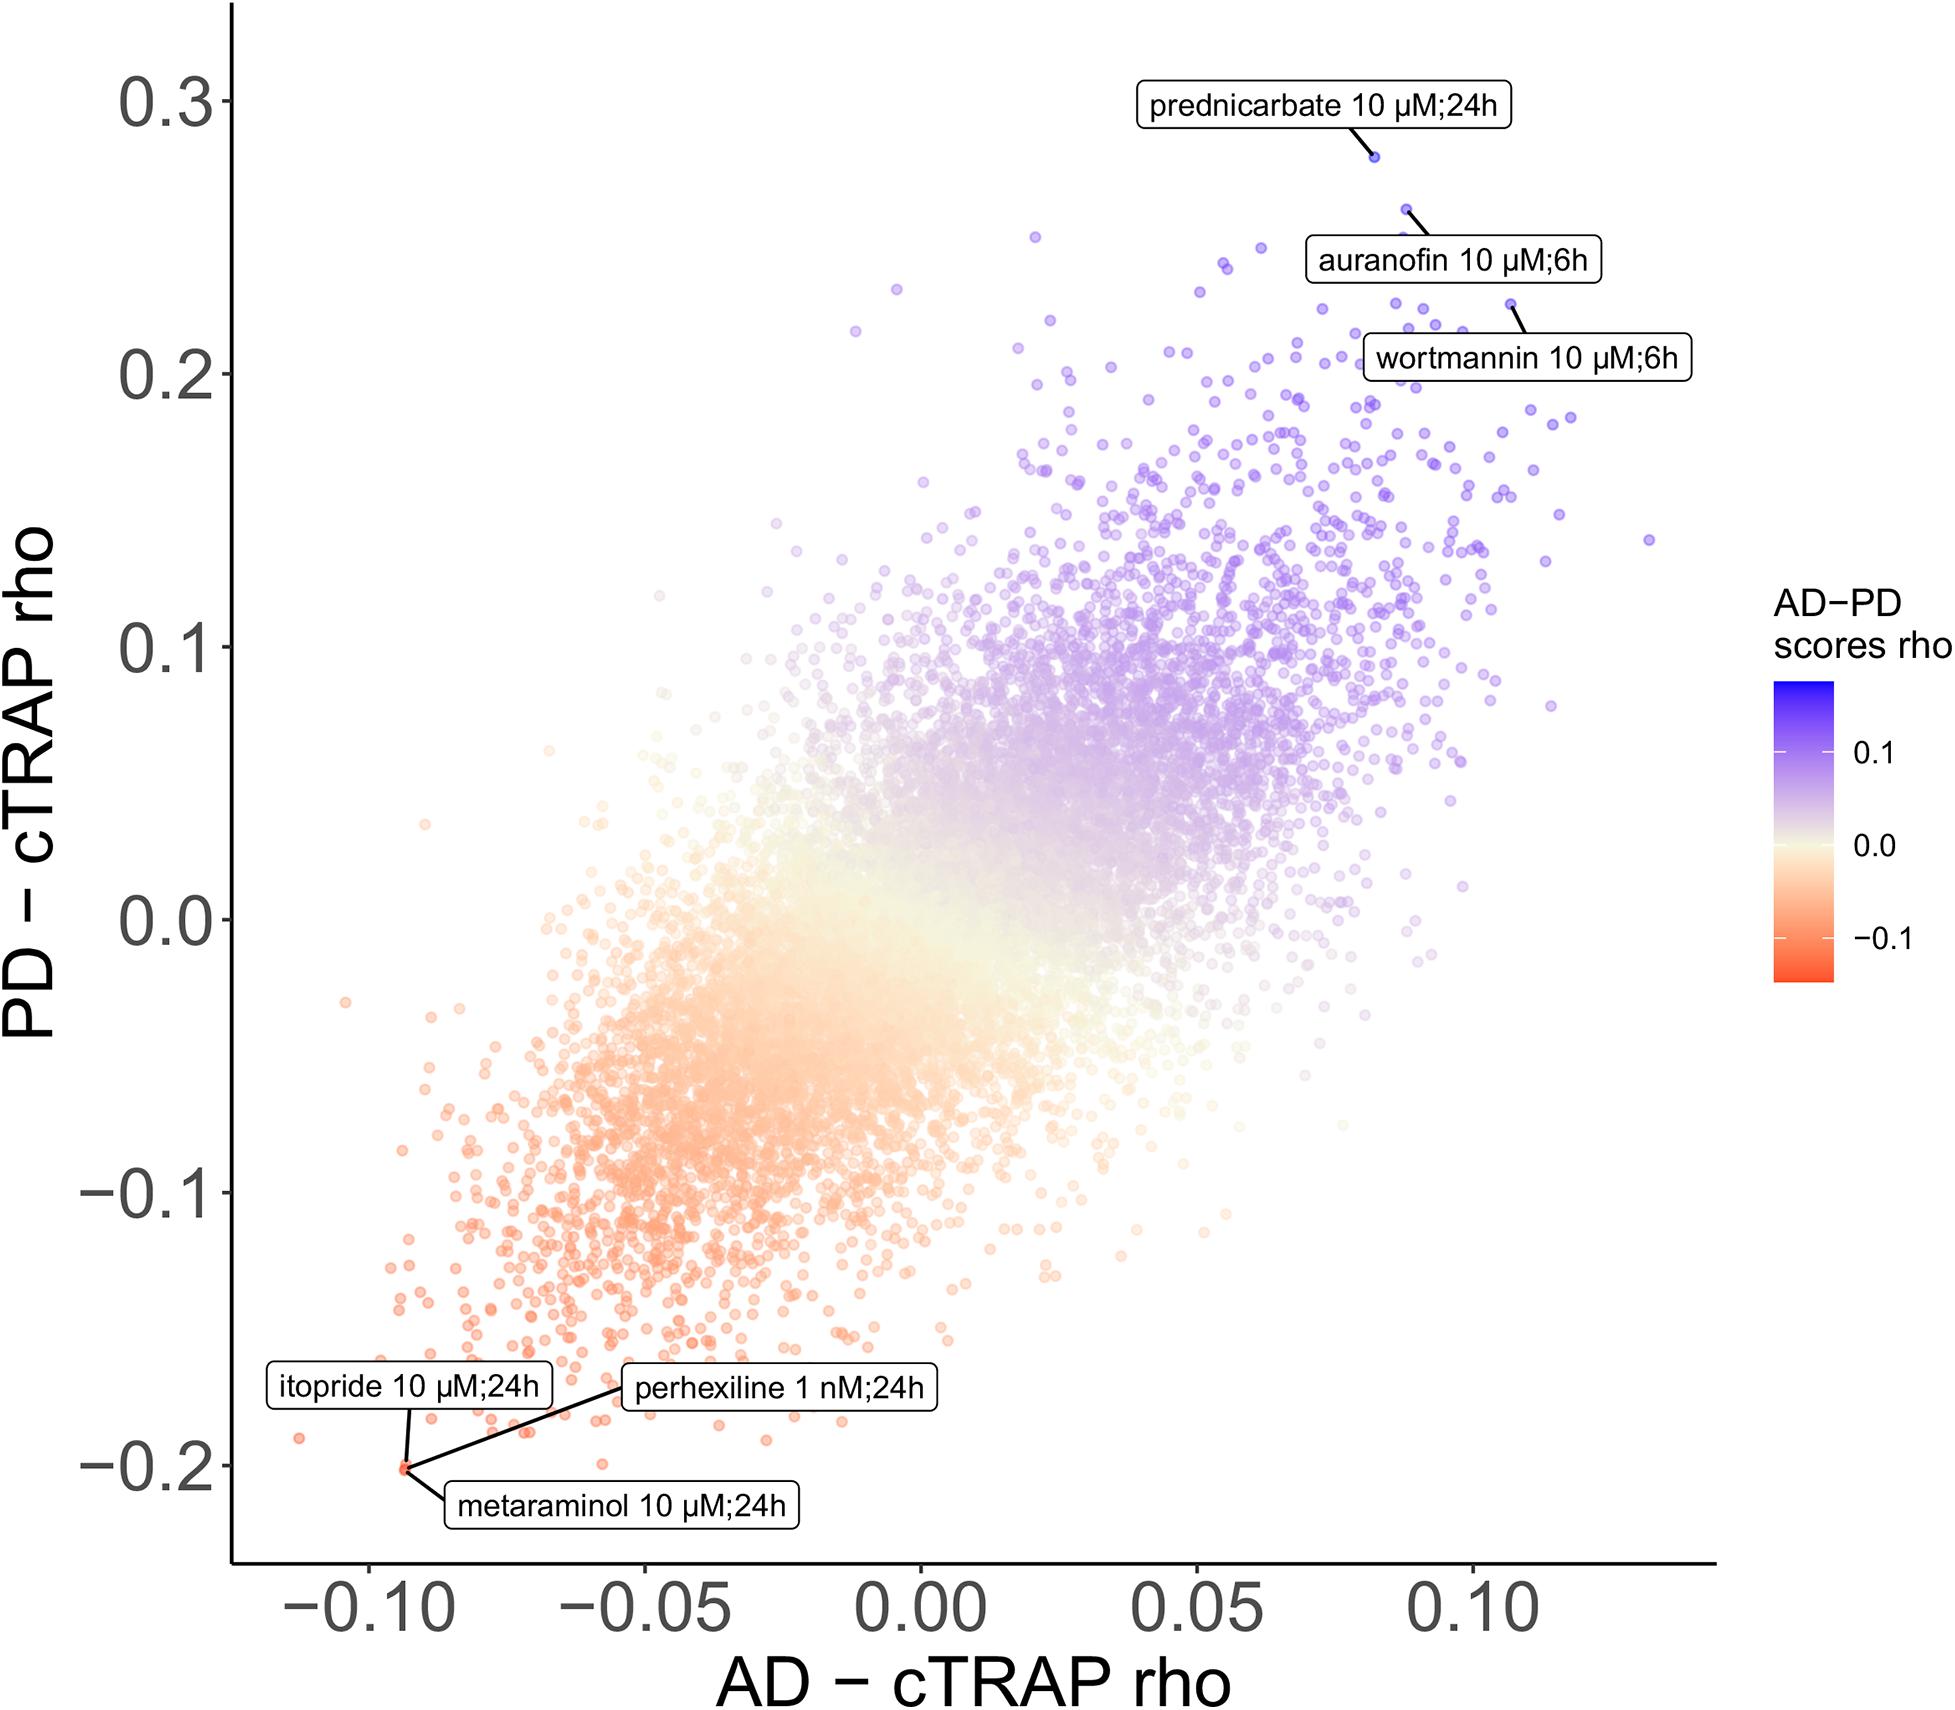
Figure 9. Scatter plot comparing, between the AD and the PD effects, the cTRAP-derived cross-gene Spearman’s correlation coefficients (rho) of their differential expression combined scores with perturbation z-scores for cMap compounds. Points (compounds) are colored according to the cross-gene Spearman’s correlation coefficients of their perturbation z-scores with the scores for common AD-PD differential expression (section “Materials and Methods”). Labeled compounds are the three most correlated and the three most anti-correlated compounds.
Discussion
In this study, we investigated the impact of cellular composition on Alzheimer’s and Parkinson’s diseases’ molecular effects in human brains. AD and PD brains are characterized by a loss of neurons and an increase of astrocytic reactivity when compared to age-matched healthy brain samples (Gomez-Isla et al., 1997; MacDonald and Halliday, 2002; Verkhratsky et al., 2010; Booth et al., 2017). Signatures of these changes will be confounded with disease-intrinsic molecular alterations, both systemic and cell type-specific, in any differential expression analysis between diseased and healthy brains. We confirmed this by looking at the expression of known neuronal, astrocytic, oligodendrocytic and microglial markers in AD and PD transcriptomic datasets. We indeed found neuronal and astrocytic markers significantly downregulated and upregulated, respectively, in MayoClinic AD samples compared to controls (Figure 1A). Although microglia were reported to be involved in AD (Solito and Sastre, 2012) and PD (Le et al., 2016), we only observed a significant increase in one (CD40) out of four microglial markers tested in AD (Figure 1A) and in two (CD40 and ITGAM) in PD samples (Figure 4A). Since microglia represent a small subset of human brain cells [5 to 15% of human brain cells (Pelvig et al., 2008)], there were likely too few microglial cells in the profiled brain sections for their transcriptomic signal to be properly detected, as suggested by our digital cytometry estimates (Figures 1B, 4B). Still, the detection of a significant increase in CD40 and ITGAM microglial markers in PD samples needs further investigation, as the highest concentration of microglia in the brain is located in the substantia nigra (Block et al., 2007), the first region affected by the loss of dopaminergic neurons in PD (Badger et al., 2014). This could then induce a more reactive response of microglia in PD cortices.
Based on the evidence that cellular composition was altered in AD and PD brain samples, we computationally estimated therein the proportion of the main brain cell types: neurons, astrocytes, microglia and oligodendrocytes. We derived a gene expression signature (1 962 genes – Supplementary Table 2) from a publicly available single-cell RNA-seq dataset of human adult cortical samples (Darmanis et al., 2015) to distinguish those four cell types. To test the specificity of those signatures, we used CIBERSORTx (Newman et al., 2019) to estimate the composition of samples from an independent single-cell RNA-seq dataset (Zhang et al., 2016) of human neurons, microglia, astrocytes and oligodendrocytes. Each of these cells was mostly assigned to its respective pre-annotated cell type (Supplementary Figure 7A). Some oligodendrocyte samples showed a small presence of the other three cell types that might be related with the myelin of oligodendrocytes having some debris of astrocytes, microglia and neurons attached, given that oligodendrocytes closely interact with those cells (Domingues et al., 2016). With the further advances in scRNA-seq technologies and the accumulation of human brain single-cell datasets in healthy and diseased conditions (Mathys et al., 2019b), the major brain cell type signatures will be further improved and allow an increase in sensitivity of digital cytometry.
After validating the cell type signatures, we used them to estimate the proportion of neurons, astrocytes, microglia and oligodendrocytes in AD and PD brain samples from their bulk transcriptomes. In line with differences in expression in canonical markers illustrated in Figure 1A, the estimated neuronal proportion was significantly lower in AD compared with control brains (Figure 1B). Some samples reached up to 60–90% of neurons, much higher than estimates based on cell counting (Pelvig et al., 2008; Herculano-Houzel, 2009). This is likely related with the neuronal RNA content being up to 2-fold as much as that of glial cells (Filipchenko et al., 1976). In this study we are therefore estimating the relative contribution by each cell type to the total amount of mRNA in the bulk samples and not their actual proportion of the total number of cells.
Linear models are a commonly used statistical approach to model gene expression as a function of relevant explanatory variables. Here, these were potential technical biases (RIN and an unknown confounder variable), age, sex (for AD datasets), estimated neuronal proportion (neuronal loss), disease (categorical AD or PD) and, for the AD datasets, interaction between neuronal proportion and disease. Considering that AD and PD are age-related neurodegenerative disorders, it is expected that most of their associated gene expression changes in the brain are result from the loss of neurons and aging, therefore the need to estimate their independent effects and decouple them from the intrinsic molecular effects of the diseases that we are interested in. Using those models, we identified genes whose expression was significantly affected by the intrinsic (systemic) disease effect (Figures 2, 5), as well as genes whose expression was mostly explained by the other effects (Supplementary Figures 10A, 13A). However, we were not able to completely decouple the explanatory variables, as the associated moderated t statistics of differential expression were to some extent correlated with each other (Supplementary Figures 10D, 13C). The correlations between RIN and the intrinsic disease and neuronal loss effects may be explained by potential agonal conditions, such as patients being in a coma or their brains undergoing hypoxia just before death, preceding the collection of post-mortem samples (Tomita et al., 2004). For AD, with the Interaction effect, we were able to detect genes whose expression varies differently upon neuronal loss in AD samples (Supplementary Figure 10C). For example, the PNPLA5 gene is involved in lipid metabolism (Kim et al., 2016) and is thought to play a role in the autophagy biogenesis (Dupont et al., 2014). Those processes have been implicated in AD (Li et al., 2017; Zarrouk et al., 2018) and a variant in PNPLA5 was reported to be associated with the APOE genotype directly linked to AD (Cruchaga et al., 2012). Another example is PTPN20A, encoding a phosphatase with a dynamic subcellular distribution that targets sites of actin polymerization, a fundamental cellular process (Fodero-Tavoletti et al., 2005). Although, to our knowledge, no reports have linked PTPN20A to AD, it might indicate that, concomitant with the loss of other neurons, AD neurons suffer more structural changes than non-AD neurons.
The importance of decoupling the intrinsic disease effect from others can be seen in Figures 2B, 5B. Looking at some of the genes already reported as potentially playing a role in AD [e.g., CDK5 (Liu et al., 2016)] or PD [e.g., COMT (Jiménez-Jiménez et al., 2014)], we observed that alterations in their expression were mostly driven by neuronal loss, i.e., by changes in cellular composition, but not so much by an intrinsic cell type-independent disease effect. This suggests that some genes previously reported as candidates for playing a role in AD or PD may be “false positives” for their association with the diseases’ etiology and, given their cell-type specificity, have been found dysregulated due to changes in cellular composition (Kelley et al., 2018).
As shown in Figures 3A, 6A, the results of differential expression analyses are significantly correlated between independent datasets. Although some genes initially selected as candidates for intrinsic disease markers, such as ETV4 and LIAS for AD, were not found to behave consistently in both datasets, others previously described as playing a role in AD and PD, such as RPH3A (Tan et al., 2014) and CXXC1 (Diao et al., 2013), were consistent. We identified genes such as HEBP2 and PRKAR1A to be, respectively, AD and PD-specific (Figures 3C, 6C) and, to our knowledge, they had not been previously linked with the disorders. HEBP2 is known to play a role in mitochondria and its inhibition has been shown to be important for HeLa cells survival upon oxidative stress (Szigeti et al., 2010). Considering that HEBP2 is upregulated in our AD samples, its overexpression may contribute to the sudden death of neuronal cells upon the AD-characteristic high oxidative stress environment (Tönnies and Trushina, 2017). Moreover, although HEBP2 has not yet been linked to AD, its homologs HEBP1 has been described as potentially playing a role in neurons’ ability to sense cytotoxicity over the course of the disease (Yagensky et al., 2019). When PRKAR1A, the cAMP-dependent protein kinase type I-alpha regulatory subunit, is not working properly, it causes an hyperactivation of PKA signaling and its loss of function has been shown to cause cell death and muscle impairment (Gangoda et al., 2014), two PD-related phenotypes.
Being the two most common neurodegenerative disorders in the world, it has already been suggested that AD and PD could share a common mechanism of neurodegeneration (Calne et al., 1986; Xie et al., 2014). For instance, Greenfield and Vaux (2002) proposed that the common mechanism may be associated with the aberrant activation of a developmental process involving a non-classical, non-enzymatic action of acetylcholinesterase. Our results suggest that the genes whose expression is commonly altered in AD and PD are essentially related with cell metabolism and NF-KB and Wnt signaling pathways (Figure 7B), which were already reported as playing a role in PD (Mattson and Meffert, 2006; Cai et al., 2012; Harvey and Marchetti, 2014; Seo and Park, 2019). Another study, that used mice with a deletion of the vesicular acetylcholine transporter in the forebrain, suggests that cholinergic failure causes changes in RNA metabolism that can facilitate Alzheimer’s-like murine pathology (Kolisnyk et al., 2016). Oxidative phosphorylation and Parkinson’s disease pathways were significantly altered in both diseases but enriched in genes downregulated in the MayoClinic AD samples (Supplementary Figure 10B) and upregulated in Dumitriu PD samples (Supplementary Figure 13B). The putative upregulation of the oxidative phosphorylation pathway in PD is mostly driven by NADH dehydrogenase genes such as NDUFS8, NDUFS7, and NDUFA11, which take part in mitochondria’s complex I, already reported to be impaired in PD (Keeney, 2006). Oxidative phosphorylation’s apparent downregulation in AD is mostly driven by COX genes such as COX11 and COX15. The most consistent defect in mitochondrial electron transport enzymes in AD is indeed a deficiency in COX (Kish et al., 1992), mitochondria complex IV (Kish et al., 1992). Genes highlighted in Figure 7A should also be considered as candidate targets for functional manipulation in both AD- and PD-related studies, since they may unveil mechanisms that are disrupted in similar ways in both disorders.
Drug discovery for human diseases is a slow and costly process (Insa, 2013), drug repurposing being therefore seen as a faster, safer and cheaper alternative (Siavelis et al., 2016). Using cTRAP (de Almeida et al., 2020), we identified drugs, already in clinical trials or launched, that potentially induce gene expression changes that are significantly anti-correlated with those caused by AD and PD (Figures 8A,C). For AD, we identified compounds already linked with the disease. For instance, chloroquine, an antimalarial drug, was shown to increase tau proteolysis (Zhang et al., 2009) as well as to be neuroprotective upon brain injury by diminishing inflammation and neuronal autophagic death (Cui et al., 2015). Tubastatin-a, an HDAC6 inhibitor, was used in AD mice leading to alleviated behavioral deficits, alterations on amyloid-beta load and reduced tau phosphorylation (Zhang et al., 2014). Sildenafil, usually used to treat erectile dysfunction, is currently being investigated in AD therapeutics (Sanders, 2020). Amisulpride and citalopram, two antipsychotic drugs, have been used in AD (Mauri et al., 2006; Porsteinsson et al., 2014). Curcumin has been implicated in AD therapeutics, apparently decreasing beta-amyloid plaques as well as slowing neurodegeneration and acting as an anti-inflammatory (Chen et al., 2018). Doxycycline is a compound known to cross the blood-brain barrier and a very promising candidate since it reduced amyloid-beta oligomers and neuroinflammation in AD mouse models (Balducci and Forloni, 2019). Etoposide needs to be further explored, given a study reporting it as an inducer of cellular senescence and mitochondrial dysfunction in cultured rat astrocytes (Bang et al., 2019) but knowing that rat cell lines may not recapitulate all the molecular cues of the human brain microenvironment. To our knowledge, no research has been reported on the use of interesting candidates panobinostat, dimenhydrinate and perhexiline in AD. Indeed, perhexiline is involved in the inhibition of mTOR pathway which is related with autophagy, a process known to be altered in AD (Jaeger and Wyss-Coray, 2010), and panobinostat acts as an HDAC inhibitor, leading to the hypothesis that it may play a role similar to that of tubastatin-a. For PD, we also identified compounds previously linked to the disease. Atomoxetine, an inhibitor of the norepinephrine reuptake, has been studied in PD therapeutics since the noradrenergic system is involved in executive functions impaired in PD (Warner et al., 2018). Meclofenamic acid, a non-steroid anti-inflammatory drug, has been shown to have an anti-fibrillogenic effect on alpha-synuclein fibrils in vitro (Hirohata et al., 2008). Tamoxifen, an estrogen modulator, has also been related with PD treatment but is associated with controversial findings. Although tamoxifen demonstrated neuroprotective effects in some animal and in vitro studies (Lee et al., 2009; Mosquera et al., 2014), it has been shown in some cohorts of female breast cancer patients that its usage may increase PD risk (Latourelle et al., 2010; Hong et al., 2017). However, given that our PD analyses were performed only in male samples, our results could suggest a sex-specific mode of action of tamoxifen in PD. Additionally, myricetin has neuroprotective effects in different PD Drosophila and rat models (Dhanraj et al., 2018; Huang et al., 2018). To our knowledge, other drugs such as genipin and praziquantel have not yet been related to PD and could be interesting to further explore for repurposing in that context. For instance, genipin is the main component of a Chinese medicinal herb and was shown to have anti-inflammatory and neuroprotective effects that could be beneficial for neurogenerative diseases such as PD (Li et al., 2016). Praziquantel, an anthelmintic compound, could be a very interesting candidate since niclosamide, another anthelmintic drug, has been suggested to be beneficial in PD through the activation of the PINK1 pathway that is usually impaired in PD (Barini et al., 2018).
Metaraminol, an adrenergic agonist that also stimulates the release of norepinephrine and primarily used as a vasoconstrictor in the treatment of hypotension (National Center for Biotechnology Information, 2020. PubChem Database.), induces the gene expression changes most anti-correlated with those by both AD and PD (Figure 9). To our knowledge, there is no association between metaraminol and AD and PD therapeutics. However, adrenergic agonists can decrease noradrenergic degeneration, a characteristic condition of AD patients (Gannon et al., 2015). As for PD, using adrenergic agonists along with levodopa treatment has been shown to lead to a diminishment in parkinsonian symptoms (Alexander et al., 1994). Perhexiline can act as an inhibitor of mTORC1, a protein kinase involved in autophagy, and is able to stimulate autophagy (Balgi et al., 2009). One common shared feature between AD and PD is indeed autophagy decrease (Fujikake et al., 2018), which might explain the anti-correlation between its transcriptomic impact and the expression profiles changes induced by AD and PD (Figure 9). Itopride, a dopamine D2 antagonist with acetylcholinesterase inhibitory actions (National Center for Biotechnology Information, 2020. PubChem Database.), has already been studied as a potential drug for AD given its very similar structure to curcumin, shown to decrease the accumulation of Aß aggregates (Ngo et al., 2016). Moreover, it is also used for increasing gastrointestinal motility, a symptom that is prominent in PD patients, although it also seems to induce parkinsonism (Shin and Chung, 2012). We also found scriptaid (Figures 8A,C), a histone deacetylase (HDAC) inhibitor. HDAC enzymes have already been linked to neurodegenerative diseases and there are already several applications of HDAC inhibitors being tested in such context (Gupta et al., 2020). Interestingly, gene expression changes induced by wortmannin, auranofin and prednicarbate, were the most correlated with those by AD and PD. Indeed, wortmannin has been shown to increase Alzheimer-like tau phosphorylation in vivo (Liu and Wang, 2002; Xu et al., 2005) and to diminish the effect of an anti-apoptotic compound in an in vitro PD model (Limboonreung et al., 2020). Auranofin, a drug used as an antirheumatic agent, has indeed been linked with AD and PD, but not as an inducer of both disorders (Roder and Thomson, 2015). This result needs to be further explored as, for instance, auranofin seems to act through glial cells but does not stop cytokines secretion from astrocytes (Madeira et al., 2013, 2014). Additionally, these findings result from work in cell lines (Madeira et al., 2014) and mice (Madeira et al., 2013), models that do not recapitulate all the molecular cues of the human brain microenvironment. To our knowledge, there is no association between prednicarbate, a corticosteroid drug with an anti-inflammatory action, and AD and PD therapeutics besides the recommendation of not being used together with memantine, one of the few FDA approved drugs for AD, since it inhibits its action (Wishart et al., 2018). These results show the potential of using in silico tools to find existing drugs that could be tested as candidates for the treatment of neurodegenerative diseases.
To our knowledge, this is the first study that decouples the effects of cellular composition, aging and sex from the intrinsic disease effect of AD and PD on gene expression in human brains. However, our study has limitations. We focused on the four major brain cell types but our approach is not sensitive enough to estimate the relative amount of mRNA contributed by microglia, therefore missing the transcriptomic signal of their physiology. Moreover, although we validated our results using independent public datasets, an additional local experimental validation is not feasible due to extreme difficulty in having access to human samples that would be suitable independent replicates of those used to generate the analyzed datasets. Additionally, drugs currently used for AD and PD treatment were not among those our analysis deemed more likely able to revert the AD-/PD-specific gene expression changes. This likely reflects the differences between gene expression changes induced by drugs in cancer cell lines [i.e., those available in CMap (Subramanian et al., 2017), on which cTRAP (de Almeida et al., 2020) relies] and those the same drugs would induce in brain cells.
We expect the permanent development of single-cell technologies to help increase the resolution of our understanding of the nuances in each human brain cell type, as well as which molecular perturbations therein are critical to the onset and progression of neurodegenerative diseases such as AD and PD. In fact, there are already some studies using single-cell RNA-seq to characterize the cellular composition in normal brains (Darmanis et al., 2015; Lake et al., 2016; Hagenauer et al., 2017), in neurogenesis and somatic reprogramming to neurons (Shin et al., 2015; Treutlein et al., 2016), as well as in AD brains (Grubman et al., 2019; Mathys et al., 2019a). Nevertheless, as single-cell data are still accumulating and there are several bulk transcriptomes available for brains affected by neurodegenerative disorders, approaches like ours could help in the meantime to unveil some of cellular and molecular complexity associated with neurodegeneration in humans.
In summary, our results show the relevance of modeling and accounting for cell type composition when analyzing molecular alterations associated with neurodegenerative disorders, thereby helping to identify candidate gene targets that are related with the disease itself rather than the consequent loss of neurons. They also illustrate the interest of performing in silico analysis of chemical perturbagens as preliminary screens for drug repurposing, helping to find new, more effective drug therapies that could mitigate, or even reverse, some of those neurodegenerative disorders’ phenotypes.
Data Availability Statement
Publicly available datasets were analyzed in this study. This data can be found here: Darmanis dataset – GEO GSE67835 https://www.ncbi.nlm.nih.gov/geo/query/acc.cgi?acc=GSE67835; Mouse dataset – http://mousebrain.org/downloads.html; Zhang dataset – GEO GSE73721 https://www.ncbi.nlm.nih.gov/geo/query/acc.cgi?acc=GSE73721; MayoClinic dataset – https://www.synapse.org/#!Synapse:syn3163039; Nativio dataset – GEO GSE104704 https://www.ncbi.nlm.nih.gov/geo/query/acc.cgi?acc=GSE104704; Dumitriu dataset – GEO GSE68719 https://www.ncbi.nlm.nih.gov/geo/query/acc.cgi?acc=GSE68719; Zhang dataset – GEO GSE20168 https://www.ncbi.nlm.nih.gov/geo/query/acc.cgi?acc=GSE20168.
Author Contributions
Both authors contributed to the design and implementation of the research, to the analysis of the results and to the writing of the manuscript.
Funding
This work was supported by European Molecular Biology Organization (EMBO Installation Grant 3057 to NB-M), Fundação para a Ciência e a Tecnologia (FCT Investigator Starting Grant IF/00595/2014 and CEEC Individual Assistant Researcher contract CEECIND/00436/2018 to NB-M, Ph.D. Studentship PD/BD/105854/2014 to MB), and GenomePT project (POCI-01-0145-FEDER-022184), supported by COMPETE 2020 – Operational Programme for Competitiveness and Internationalization (POCI), Lisboa Portugal Regional Operational Programme (Lisboa2020), Algarve Portugal Regional Operational Programme (CRESC Algarve2020), under the PORTUGAL 2020 Partnership Agreement, through the European Regional Development Fund (ERDF), and by Fundação para a Ciência e a Tecnologia (FCT).
Conflict of Interest
The authors declare that the research was conducted in the absence of any commercial or financial relationships that could be construed as a potential conflict of interest.
Acknowledgments
We would like to thank Mariana Ascensão-Ferreira and Nuno Saraiva-Agostinho for providing valuable feedback on the manuscript.
Supplementary Material
The Supplementary Material for this article can be found online at: https://www.frontiersin.org/articles/10.3389/fnins.2020.607215/full#supplementary-material
References
Afshartous, D., and Preston, R. A. (2011). Key results of interaction models with centering. J. Stat. Educ. 19, 1–24. doi: 10.1080/10691898.2011.11889620
Alexander, G. M., Schwartzman, R. J., Nukes, T. A., Grothusen, J. R., and Hooker, M. D. (1994). 2-Adrenergic agonist as adjunct therapy to levodopa in Parkinson’s disease. Neurology 44, 1511–1511. doi: 10.1212/WNL.44.8.1511
Allen, M., Carrasquillo, M. M., Funk, C., Heavner, B. D., Zou, F., Younkin, C. S., et al. (2016). Human whole genome genotype and transcriptome data for Alzheimer’s and other neurodegenerative diseases. Sci. Data 3, 1–10. doi: 10.1038/sdata.2016.89
Badger, J. L., Cordero-Llana, O., Hartfield, E. M., and Wade-Martins, R. (2014). Parkinson’s disease in a dish–using stem cells as a molecular tool. Neuropharmacology 76(Pt A), 88–96. doi: 10.1016/j.neuropharm.2013.08.035
Balducci, C., and Forloni, G. (2019). Doxycycline for Alzheimer’s disease: fighting β-Amyloid oligomers and neuroinflammation. Front. Pharmacol. 10:738. doi: 10.3389/fphar.2019.00738
Balgi, A. D., Fonseca, B. D., Donohue, E., Tsang, T. C. F., Lajoie, P., Proud, C. G., et al. (2009). Screen for chemical modulators of autophagy reveals novel therapeutic inhibitors of mTORC1 signaling. PLoS One 4:e7124. doi: 10.1371/journal.pone.0007124
Bang, M., Kim, D. G., Gonzales, E. L., Kwon, K. J., and Shin, C. Y. (2019). Etoposide induces mitochondrial dysfunction and cellular senescence in primary cultured rat astrocytes. Biomol. Ther. (Seoul). 27, 530–539. doi: 10.4062/biomolther.2019.151
Barini, E., Miccoli, A., Tinarelli, F., Mulholland, K., Kadri, H., Khanim, F., et al. (2018). The anthelmintic drug niclosamide and its analogues activate the Parkinson’s disease associated protein kinase PINK1. ChemBioChem 19, 425–429. doi: 10.1002/cbic.201700500
Block, M. L., Zecca, L., and Hong, J.-S. (2007). Microglia-mediated neurotoxicity: uncovering the molecular mechanisms. Nat. Rev. Neurosci. 8, 57–69. doi: 10.1038/nrn2038
Booth, H. D. E., Hirst, W. D., and Wade-Martins, R. (2017). The role of astrocyte dysfunction in Parkinson’s disease pathogenesis. Trends Neurosci. 40, 358–370. doi: 10.1016/j.tins.2017.04.001
Bray, N. L., Pimentel, H., Melsted, P., and Pachter, L. (2016). Near-optimal probabilistic RNA-seq quantification. Nat. Biotechnol. 34, 525–527. doi: 10.1038/nbt.3519
Cai, H., Cong, W., Ji, S., Rothman, S., Maudsley, S., and Martin, B. (2012). Metabolic dysfunction in Alzheimers disease and related neurodegenerative disorders. Curr. Alzheimer Res. 9, 5–17. doi: 10.2174/156720512799015064
Calne, D. B., Eisen, A., McGeer, E., and Spencer, P. (1986). Alzheimer’s disease, parkinson’s disease, and motoneurone disease: abiotropic interaction between ageing and environment? Lancet 22, 1067–1070. doi: 10.1016/s0140-6736(86)90469-1
Capurro, A., Bodea, L. G., Schaefer, P., Luthi-Carter, R., and Perreau, V. M. (2015). Computational deconvolution of genome wide expression data from Parkinson’s and Huntington’s disease brain tissues using population-specific expression analysis. Front. Neurosci. 9:441. doi: 10.3389/fnins.2014.00441
Chen, M., Du, Z.-Y., Zheng, X., Li, D.-L., Zhou, R.-P., and Zhang, K. (2018). Use of curcumin in diagnosis, prevention, and treatment of Alzheimer’s disease. Neural Regen. Res. 13:742. doi: 10.4103/1673-5374.230303
Chen, Y., Lun, A. T. L., and Smyth, G. K. (2016). From reads to genes to pathways: differential expression analysis of RNA-Seq experiments using Rsubread and the edgeR quasi-likelihood pipeline. F1000Research 5:1438. doi: 10.12688/f1000research.8987.2
Cruchaga, C., Kauwe, J. S. K., Nowotny, P., Bales, K., Pickering, E. H., Mayo, K., et al. (2012). Cerebrospinal fluid APOE levels: an endophenotype for genetic studies for Alzheimer’s disease. Hum. Mol. Genet. 21, 4558–4571. doi: 10.1093/hmg/dds296
Cui, C.-M., Gao, J.-L., Cui, Y., Sun, L.-Q., Wang, Y.-C., Wang, K.-J., et al. (2015). Chloroquine exerts neuroprotection following traumatic brain injury via suppression of inflammation and neuronal autophagic death. Mol. Med. Rep. 12, 2323–2328. doi: 10.3892/mmr.2015.3611
Dai, Z., Sheridan, J. M., Gearing, L. J., Moore, D. L., Su, S., Dickins, R. A., et al. (2014). shRNA-seq data analysis with edgeR. F1000Research 3:95. doi: 10.12688/f1000research.4204
Darmanis, S., Sloan, S. A., Zhang, Y., Enge, M., Caneda, C., Shuer, L. M., et al. (2015). A survey of human brain transcriptome diversity at the single cell level. Proc. Natl. Acad. Sci. U.S.A. 112, 7285–7290. doi: 10.1073/pnas.1507125112
de Almeida, B., Saraiva-Agostinho, N., and Barbosa-Morais, N. L. (2020). cTRAP: identification of candidate causal perturbations from differential gene expression data. Bioconductor doi: 10.18129/B9.bioc.cTRAP
Dhanraj, V., Karuppaiah, J., Balakrishnan, R., and Elangovan, N. (2018). Myricetin attenuates neurodegeneration and cognitive impairment in Parkinsonism. Front. Biosci. (Elite Ed) 10:481–494. doi: 10.2741/e835
Diao, H., Li, X., and Hu, S. (2013). The identification of dysfunctional crosstalk of pathways in Parkinson disease. Gene 515, 159–162. doi: 10.1016/j.gene.2012.11.003
Domingues, H. S., Portugal, C. C., Socodato, R., and Relvas, J. B. (2016). Oligodendrocyte, astrocyte, and microglia crosstalk in myelin development, damage, and repair. Front. Cell Dev. Biol. 4:71. doi: 10.3389/fcell.2016.00071
Draghici, S. (2012). Statistics and Data Analysis for Microarrays Using R and Bioconductir, Second Edn. London: Chapman and Hall/CRC Press.
Dumitriu, A., Golji, J., Labadorf, A. T., Gao, B., Beach, T. G., Myers, R. H., et al. (2016). Integrative analyses of proteomics and RNA transcriptomics implicate mitochondrial processes, protein folding pathways and GWAS loci in Parkinson disease. BMC Med. Genomics 9:5. doi: 10.1186/s12920-016-0164-y
Dupont, N., Chauhan, S., Arko-Mensah, J., Castillo, E. F., Masedunskas, A., Weigert, R., et al. (2014). Neutral lipid stores and lipase PNPLA5 contribute to autophagosome biogenesis. Curr. Biol. 24, 609–620. doi: 10.1016/j.cub.2014.02.008
Feigin, V. L., Abajobir, A. A., Abate, K. H., Abd-Allah, F., Abdulle, A. M., Abera, S. F., et al. (2017). Global, regional, and national burden of neurological disorders during 1990–2015: a systematic analysis for the Global Burden of Disease Study 2015. Lancet Neurol. 16, 877–897. doi: 10.1016/S1474-4422(17)30299-5
Ferrer, I., Martinez, A., Boluda, S., Parchi, P., and Barrachina, M. (2008). Brain banks: benefits, limitations and cautions concerning the use of post-mortem brain tissue for molecular studies. Cell Tissue Bank 9, 181–194. doi: 10.1007/s10561-008-9077-0
Filipchenko, R. E., Pevzner, L. Z., and Slonim, A. D. (1976). RNA content in the neurons and glia of the hypothalamic nuclei after intermittent cooling. Neurosience Behav. Physiol. 223, 69–71. doi: 10.1007/bf01148751
Fodero-Tavoletti, M. T., Hardy, M. P., Cornell, B., Katsis, F., Sadek, C. M., Mitchell, C. A., et al. (2005). Protein tyrosine phosphatase hPTPN20a is targeted to sites of actin polymerization. Biochem. J. 389, 343–354. doi: 10.1042/BJ20041932
Frankish, A., Diekhans, M., Ferreira, A.-M., Johnson, R., Jungreis, I., Loveland, J., et al. (2019). GENCODE reference annotation for the human and mouse genomes. Nucleic Acids Res. 47, D766–D773. doi: 10.1093/nar/gky955
Fujikake, N., Shin, M., and Shimizu, S. (2018). Association between autophagy and neurodegenerative diseases. Front. Neurosci 12:255. doi: 10.3389/fnins.2018.00255
Gangoda, L., Doerflinger, M., Srivastava, R., Narayan, N., Edgington, L. E., Orian, J., et al. (2014). Loss of Prkar1a leads to Bcl-2 family protein induction and cachexia in mice. Cell Death Differ. 21, 1815–1824. doi: 10.1038/cdd.2014.98
Gannon, M., Che, P., Chen, Y., Jiao, K., Roberson, E. D., and Wang, Q. (2015). Noradrenergic dysfunction in Alzheimer’s disease. Front. Neurosci. 9:220. doi: 10.3389/fnins.2015.00220
Gautier, L., Cope, L., Bolstad, B. M., and Irizarry, R. A. (2004). Affy - Analysis of Affymetrix GeneChip data at the probe level. Bioinformatics 20, 307–315. doi: 10.1093/bioinformatics/btg405
Gentleman, R. C., Gentleman, R. C., Carey, V. J., Carey, V. J., Bates, D. M., Bates, D. M., et al. (2004). Bioconductor: open software development for computational biology and bioinformatics. Genome Biol. 5:R80. doi: 10.1186/gb-2004-5-10-r80
Goedert, M. (2015). Alzheimer’s and Parkinson’s diseases: the prion concept in relation to assembled Aβ, tau, and α-synuclein. Science 349:1255555. doi: 10.1126/science.1255555
Gomez-Isla, T., Hollister, R., West, H., Mui, S., Growdon, J. H., Petersen, R. C., et al. (1997). Neurond loss correlates with but exceeds neurofibrillary tangles in Alzheimer’s disease. Ann. Neurol. 41, 17–24. doi: 10.1002/ana.410410106
Greenfield, S., and Vaux, D. (2002). Parkinson’s disease, Alzheimer’s disease and motor neurone disease: identifying a common mechanism. Neuroscience 113, 485–492. doi: 10.1016/S0306-4522(02)00194-X
Grubman, A., Chew, G., Ouyang, J. F., Sun, G., Choo, X. Y., McLean, C., et al. (2019). A single-cell atlas of entorhinal cortex from individuals with Alzheimer’s disease reveals cell-type-specific gene expression regulation. Nat. Neurosci. 22, 2087–2097. doi: 10.1038/s41593-019-0539-4
Gu, Z., Eils, R., and Schlesner, M. (2016). Complex heatmaps reveal patterns and correlations in multidimensional genomic data. Bioinformatics 32, 2847–2849. doi: 10.1093/bioinformatics/btw313
Gupta, R., Ambasta, R. K., and Kumar, P. (2020). Pharmacological intervention of histone deacetylase enzymes in the neurodegenerative disorders. Life Sci. 243:117278. doi: 10.1016/j.lfs.2020.117278
Hagenauer, M. H., Schulmann, A., Li, J. Z., Vawter, M. P., Walsh, D. M., Thompson, R. C., et al. (2017). Inference of cell type composition from human brain transcriptomic datasets illuminates the effects of age, manner of death, dissection, and psychiatric diagnosis. PLoS One, 13:e0200003. doi: 10.1371/journal.pone.0200003
Haq, I. U., Snively, B. M., Sweadner, K. J., Suerken, C. K., Cook, J. F., Ozelius, L. J., et al. (2019). Revising rapid−onset dystonia–parkinsonism: broadening indications for ATP1A3 testing. Mov. Disord. 34, 1528–1536. doi: 10.1002/mds.27801
Harvey, K., and Marchetti, B. (2014). Regulating Wnt signaling: a strategy to prevent neurodegeneration and induce regeneration. J. Mol. Cell Biol. 6, 1–2. doi: 10.1093/jmcb/mju002
Herculano-Houzel, S. (2009). The human brain in numbers: a linearly scaled-up primate brain. Front. Hum. Neurosci. 3:31. doi: 10.3389/neuro.09.031.2009
Hirohata, M., Ono, K., Morinaga, A., and Yamada, M. (2008). Non-steroidal anti-inflammatory drugs have potent anti-fibrillogenic and fibril-destabilizing effects for α-synuclein fibrils in vitro. Neuropharmacology 54, 620–627. doi: 10.1016/j.neuropharm.2007.11.010
Hodge, R. D., Bakken, T. E., Miller, J. A., Smith, K. A., Barkan, E. R., Graybuck, L. T., et al. (2019). Conserved cell types with divergent features in human versus mouse cortex. Nature 573, 61–68. doi: 10.1038/s41586-019-1506-7
Hong, C.-T., Chan, L., Hu, C.-J., Lin, C.-M., Hsu, C.-Y., and Lin, M.-C. (2017). Tamoxifen and the risk of Parkinson’s disease in female patients with breast cancer in Asian people: a nationwide population-based study. J. Breast Cancer 20:356. doi: 10.4048/jbc.2017.20.4.356
Huang, B., Liu, J., Ma, D., Chen, G., Wang, W., and Fu, S. (2018). Myricetin prevents dopaminergic neurons from undergoing neuroinflammation-mediated degeneration in a lipopolysaccharide-induced Parkinson’s disease model. J. Funct. Foods 45, 452–461. doi: 10.1016/j.jff.2018.04.018
Insa, R. (2013). Drug repositioning: bringing new life to shelved assets and existing drugs. Edited by Michael J. Barratt and Donald E. Frail. ChemMedChem 8, 336–337. doi: 10.1002/cmdc.201200552
Jaeger, P. A., and Wyss-Coray, T. (2010). Beclin 1 complex in autophagy and Alzheimer disease. Arch. Neurol 67, 1181–1184. doi: 10.1001/archneurol.2010.258
Jiménez-Jiménez, F. J., Alonso-Navarro, H., García-Martín, E., and Agúndez, J. A. G. (2014). COMT gene and risk for Parkinson’s disease. Pharmacogenet. Genomics 24, 331–339. doi: 10.1097/FPC.0000000000000056
Kalpić, D., Hlupić, N., and Lovrić, M. (2011). “Student’s t-Tests,” in International Encyclopedia of Statistical Science, ed. M. Lovric (Berlin: Springer Berlin Heidelberg), 1559–1563. doi: 10.1007/978-3-642-04898-2_641
Kanehisa, M., Sato, Y., Kawashima, M., Furumichi, M., and Tanabe, M. (2016). KEGG as a reference resource for gene and protein annotation. Nucleic Acids Res. 44, D457–D462. doi: 10.1093/nar/gkv1070
Keeney, P. M. (2006). Parkinson’s disease brain mitochondrial complex I has oxidatively damaged subunits and is functionally impaired and misassembled. J. Neurosci. 26, 5256–5264. doi: 10.1523/JNEUROSCI.0984-06.2006
Kelley, K. W., Nakao-Inoue, H., Molofsky, A. V., and Oldham, M. C. (2018). Variation among intact tissue samples reveals the core transcriptional features of human CNS cell classes. Nat. Neurosci. 21, 1171–1184. doi: 10.1038/s41593-018-0216-z
Kim, K.-Y., Jang, H.-J., Yang, Y. R., Park, K.-I., Seo, J., Shin, I.-W., et al. (2016). SREBP-2/PNPLA8 axis improves non-alcoholic fatty liver disease through activation of autophagy. Sci. Rep. 6:35732. doi: 10.1038/srep35732
Kish, S. J., Bergeron, C., Rajput, A., Dozic, S., Mastrogiacomo, F., Chang, L.-J., et al. (1992). Brain cytochrome oxidase in Alzheimer’s disease. J. Neurochem. 59, 776–779. doi: 10.1111/j.1471-4159.1992.tb09439.x
Kolisnyk, B., Al-Onaizi, M., Soreq, L., Barbash, S., Bekenstein, U., Haberman, N., et al. (2016). Cholinergic surveillance over hippocampal RNA metabolism and Alzheimer’s-like pathology. Cereb. Cortex 27:bhw177. doi: 10.1093/cercor/bhw177
Kuhn, A., Capurro, A., and Luthi-Carter, R. (2015). “Gene expression-based approaches to understanding Huntington’s disease and new tools for the interpretation of expression datasets,” in Neuromethods, ed. K. K. Jain (New York, NY: Springer New York), 61–91. doi: 10.1007/978-1-4939-2247-5_2
Kuhn, A., Kumar, A., Beilina, A., Dillman, A., Cookson, M. R., and Singleton, A. B. (2012). Cell population-specific expression analysis of human cerebellum. BMC Genomics 13:610. doi: 10.1186/1471-2164-13-610
Lake, B. B., Ai, R., Kaeser, G. E., Salathia, N. S., Yung, Y. C., Liu, R., et al. (2016). Neuronal subtypes and diversity revealed by single-nucleus RNA sequencing of the human brain. Science 352, 1586–1590. doi: 10.1126/science.aaf1204
Lake, B. B., Chen, S., Sos, B. C., Fan, J., Kaeser, G. E., Yung, Y. C., et al. (2018). Integrative single-cell analysis of transcriptional and epigenetic states in the human adult brain. Nat. Biotechnol. 36, 70–80. doi: 10.1038/nbt.4038
Latourelle, J. C., Dybdahl, M., Destefano, A. L., Myers, R. H., and Lash, T. L. (2010). Risk of Parkinson’s disease after tamoxifen treatment. BMC Neurol. 10:23. doi: 10.1186/1471-2377-10-23
Lê, S., Josse, J., and Husson, F. (2008). FactoMineR: an R package for multivariate analysis. J. Stat. Softw. 25, 1–18. doi: 10.18637/jss.v025.i01
Le, W., Wu, J., and Tang, Y. (2016). Protective microglia and their regulation in Parkinson’s disease. Front. Mol. Neurosci. 9:89. doi: 10.3389/fnmol.2016.00089
Lee, E.-S. Y., Yin, Z., Milatovic, D., Jiang, H., and Aschner, M. (2009). Estrogen and Tamoxifen protect against Mn-induced toxicity in rat cortical primary cultures of neurons and astrocytes. Toxicol. Sci. 110, 156–167. doi: 10.1093/toxsci/kfp081
Leek, J. T., Johnson, W. E., Parker, H. S., Jaffe, A. E., and Storey, J. D. (2012). The sva package for removing batch effects and other unwanted variation in high-throughput experiments. Bioinformatics 28, 882–883. doi: 10.1093/bioinformatics/bts034
Li, Q., Liu, Y., and Sun, M. (2017). Autophagy and Alzheimer’s disease. Cell. Mol. Neurobiol. 37, 377–388. doi: 10.1007/s10571-016-0386-8
Li, Y., Li, L., and Hölscher, C. (2016). Therapeutic potential of Genipin in central neurodegenerative diseases. CNS Drugs 30, 889–897. doi: 10.1007/s40263-016-0369-9
Ligon, K. L., Alberta, J. A., Kho, A. T., Weiss, J., Kwaan, M. R., Nutt, C. L., et al. (2004). The oligodendroglial lineage marker OLIG2 is universally expressed in diffuse gliomas. J. Neuropathol. Exp. Neurol. 63, 499–509. doi: 10.1093/jnen/63.5.499
Limboonreung, T., Tuchinda, P., and Chongthammakun, S. (2020). Chrysoeriol mediates mitochondrial protection via PI3K/Akt pathway in MPP+ treated SH-SY5Y cells. Neurosci. Lett. 714:134545. doi: 10.1016/j.neulet.2019.134545
Liu, P., Wang, X., Gao, N., Zhu, H., Dai, X., Xu, Y., et al. (2010). G protein-coupled receptor kinase 5, overexpressed in the α-synuclein up-regulation model of Parkinson’s disease, regulates bcl-2 expression. Brain Res. 1307, 134–141. doi: 10.1016/j.brainres.2009.10.036
Liu, S.-J., and Wang, J.-Z. (2002). Alzheimer-like tau phosphorylation induced by wortmannin in vivo and its attenuation by melatonin. Acta Pharmacol. Sin. 23, 183–187.
Liu, S.-L. L., Wang, C., Jiang, T., Tan, L., Xing, A., and Yu, J.-T. T. (2016). The role of Cdk5 in Alzheimer’s disease. Mol. Neurobiol. 53, 4328–4342. doi: 10.1007/s12035-015-9369-x
Lopes, R. H. C. (2011). “Kolmogorov-smirnov test,” in International Encyclopedia of Statistical Science, ed. M. Lovric (Berlin: Springer Berlin Heidelberg), 718–720. doi: 10.1007/978-3-642-04898-2_326
Lun, A. T. L., Bach, K., and Marioni, J. C. (2016a). Pooling across cells to normalize single-cell RNA sequencing data with many zero counts. Genome Biol. 17:75. doi: 10.1186/s13059-016-0947-7
Lun, A. T. L., McCarthy, D. J., and Marioni, J. C. (2016b). A step-by-step workflow for low-level analysis of single-cell RNA-seq data. F1000Research 5:2122. doi: 10.12688/f1000research.9501.1
MacDonald, V., and Halliday, G. M. (2002). Selective loss of pyramidal neurons in the pre-supplementary motor cortex in Parkinson’s disease. Mov. Disord. 17, 1166–1173. doi: 10.1002/mds.10258
Madeira, J. M., Bajwa, E., Stuart, M. J., Hashioka, S., and Klegeris, A. (2014). Gold drug auranofin could reduce neuroinflammation by inhibiting microglia cytotoxic secretions and primed respiratory burst. J. Neuroimmunol. 276, 71–79. doi: 10.1016/j.jneuroim.2014.08.615
Madeira, J. M., Renschler, C. J., Mueller, B., Hashioka, S., Gibson, D. L., and Klegeris, A. (2013). Novel protective properties of auranofin: inhibition of human astrocyte cytotoxic secretions and direct neuroprotection. Life Sci. 92, 1072–1080. doi: 10.1016/j.lfs.2013.04.005
Mahul-Mellier, A.-L., Fauvet, B., Gysbers, A., Dikiy, I., Oueslati, A., Georgeon, S., et al. (2014). c-Abl phosphorylates α-synuclein and regulates its degradation: implication for α-synuclein clearance and contribution to the pathogenesis of Parkinson’s disease. Hum. Mol. Genet. 23, 2858–2879. doi: 10.1093/hmg/ddt674
Marques, A., Fernandes, P., and Ramos, M. (2009). ABAD: a potential therapeutic target for abeta-induced mitochondrial dysfunction in Alzheimers disease. Mini Rev. Med. Chem. 9, 1002–1008. doi: 10.2174/138955709788681627
Mathys, H., Davila-Velderrain, J., Peng, Z., Gao, F., Mohammadi, S., Young, J. Z., et al. (2019b). Single-cell transcriptomic analysis of Alzheimer’s disease. Nature 571:E1. doi: 10.1038/s41586-019-1329-6
Mathys, H., Davila-Velderrain, J., Peng, Z., Gao, F., Mohammadi, S., Young, J. Z., et al. (2019a). Single-cell transcriptomic analysis of Alzheimer’s disease. Nature 570, 332–337. doi: 10.1038/s41586-019-1195-2
Mattson, M. P., and Meffert, M. K. (2006). Roles for NF-κB in nerve cell survival, plasticity, and disease. Cell Death Differ. 13, 852–860. doi: 10.1038/sj.cdd.4401837
Mauri, M., Mancioli, A., Rebecchi, V., Corbetta, S., Colombo, C., and Bono, G. (2006). Amisulpride in the treatment of behavioural disturbances among patients with moderate to severe Alzheimer’s disease. Acta Neurol. Scand. 114, 97–101. doi: 10.1111/j.1600-0404.2006.00660.x
Moncini, S., Lunghi, M., Valmadre, A., Grasso, M., Del Vescovo, V., Riva, P., et al. (2017). The miR-15/107 family of microRNA genes regulates CDK5R1/p35 with Implications for Alzheimer’s disease pathogenesis. Mol. Neurobiol. 54, 4329–4342. doi: 10.1007/s12035-016-0002-4
Mootha, V. K., Lindgren, C. M., Eriksson, K.-F., Subramanian, A., Sihag, S., Lehar, J., et al. (2003). PGC-1alpha-responsive genes involved in oxidative phosphorylation are coordinately downregulated in human diabetes. Nat. Genet. 34, 267–273. doi: 10.1038/ng1180
Mosquera, L., Colón, J. M., Santiago, J. M., Torrado, A. I., Meléndez, M., Segarra, A. C., et al. (2014). Tamoxifen and estradiol improved locomotor function and increased spared tissue in rats after spinal cord injury: their antioxidant effect and role of estrogen receptor alpha. Brain Res. 1561, 11–22. doi: 10.1016/j.brainres.2014.03.002
National Center for Biotechnology Information (2020). PubChem Database. Metaraminol, CID=5906. Available online at: https://pubchem.ncbi.nlm.nih.gov/compound/Metaraminol (accessed November 15, 2020).
Nativio, R., Donahue, G., Berson, A., Lan, Y., Amlie-Wolf, A., Tuzer, F., et al. (2018). Dysregulation of the epigenetic landscape of normal aging in Alzheimer’s disease. Nat. Neurosci. 21, 497–505. doi: 10.1038/s41593-018-0101-9
Newman, A. M., Steen, C. B., Liu, C. L., Gentles, A. J., Chaudhuri, A. A., Scherer, F., et al. (2019). Determining cell type abundance and expression from bulk tissues with digital cytometry. Nat. Biotechnol. 37, 773–782. doi: 10.1038/s41587-019-0114-2
Ngo, S. T., Fang, S.-T., Huang, S.-H., Chou, C.-L., Huy, P. D. Q., Li, M. S., et al. (2016). Anti-arrhythmic medication propafenone a potential drug for Alzheimer’s disease inhibiting aggregation of Aβ: in silico and in vitro studies. J. Chem. Inf. Model. 56, 1344–1356. doi: 10.1021/acs.jcim.6b00029
Niccoli, T., and Partridge, L. (2012). Ageing as a risk factor for disease. Curr. Biol. 22, R741–R752. doi: 10.1016/j.cub.2012.07.024
Nussbaum, R., and Ellis, C. E. (2003). Alzheimer’s and Parkinson’s disease. N. Engl. J. Med. 348, 1356–1364. doi: 10.1056/NEJM2003ra020003
Pelvig, D. P., Pakkenberg, H., Stark, A. K., and Pakkenberg, B. (2008). Neocortical glial cell numbers in human brains. Neurobiol. Aging 29, 1754–1762. doi: 10.1016/j.neurobiolaging.2007.04.013
Picelli, S., Björklund, ÅK., Faridani, O. R., Sagasser, S., Winberg, G., and Sandberg, R. (2013). Smart-seq2 for sensitive full-length transcriptome profiling in single cells. Nat. Methods 10, 1096–1098. doi: 10.1038/nmeth.2639
Piñero, J., Ramírez-Anguita, J. M., Saüch-Pitarch, J., Ronzano, F., Centeno, E., Sanz, F., et al. (2019). The DisGeNET knowledge platform for disease genomics: 2019 update. Nucleic Acids Res. 48, D845–D855. doi: 10.1093/nar/gkz1021
Ponomarev, E. D., Shriver, L. P., and Dittel, B. N. (2006). CD40 expression by microglial cells is required for their completion of a two-step activation process during central nervous system autoimmune inflammation. J. Immunol. 176, 1402–1410. doi: 10.4049/jimmunol.176.3.1402
Porsteinsson, A. P., Drye, L. T., Pollock, B. G., Devanand, D. P., Frangakis, C., Ismail, Z., et al. (2014). Effect of citalopram on agitation in Alzheimer disease. JAMA 311:682. doi: 10.1001/jama.2014.93
Preston, A. N., Cervasio, D. A., and Laughlin, S. T. (2019). Visualizing the brain’s astrocytes. Methods Enzymol. 622, 129–151. doi: 10.1016/bs.mie.2019.02.006
Qiu, X., Hill, A., Packer, J., Lin, D., Ma, Y.-A., and Trapnell, C. (2017a). Single-cell mRNA quantification and differential analysis with Census. Nat. Methods 14, 309–315. doi: 10.1038/nmeth.4150
Qiu, X., Mao, Q., Tang, Y., Wang, L., Chawla, R., Pliner, H. A., et al. (2017b). Reversed graph embedding resolves complex single-cell trajectories. Nat. Methods 14, 979–982. doi: 10.1038/nmeth.4402
R Development Core Team (2018). R. R: A Language and Environment for Statistical Computing. Available online at: www.R-project.org (accessed February 29, 2020).
Rey, D., and Neuhäuser, M. (2011). “Wilcoxon-signed-rank test,” in International Encyclopedia of Statistical Science, ed. M. Lovric (Berlin: Springer Berlin Heidelberg), 1658–1659. doi: 10.1007/978-3-642-04898-2_616
Ringnér, M. (2008). What is principal component analysis? Nat. Biotechnol. 26, 303–304. doi: 10.1038/nbt0308-303
Ritchie, M. E., Phipson, B., Wu, D., Hu, Y., Law, C. W., Shi, W., et al. (2015). limma powers differential expression analyses for RNA-sequencing and microarray studies. Nucleic Acids Res. 43, 1–13. doi: 10.1093/nar/gkv007
Roder, C., and Thomson, M. J. (2015). Auranofin: repurposing an old drug for a golden new age. Drugs R. D. 15, 13–20. doi: 10.1007/s40268-015-0083-y
Sanders, O. (2020). Sildenafil for the treatment of Alzheimer’s disease: a systematic review. J. Alzheimer’s Dis. Reports 4, 91–106. doi: 10.3233/ADR-200166
Schirmer, L., Velmeshev, D., Holmqvist, S., Kaufmann, M., Werneburg, S., Jung, D., et al. (2019). Neuronal vulnerability and multilineage diversity in multiple sclerosis. Nature 573, 75–82. doi: 10.1038/s41586-019-1404-z
Schulz, J. B., Hausmann, L., and Hardy, J. (2016). 199 years of Parkinson disease - what have we learned and what is the path to the future? J. Neurochem. 139, 3–7. doi: 10.1111/jnc.13733
Seo, J., and Park, M. (2019). Molecular crosstalk between cancer and neurodegenerative diseases. Cell. Mol. Life Sci. 77, 2659–2680. doi: 10.1007/s00018-019-03428-3
Shin, H.-W., and Chung, S. J. (2012). Drug-induced parkinsonism. J. Clin. Neurol. 8:15. doi: 10.3988/jcn.2012.8.1.15
Shin, J., Berg, D. A., Zhu, Y., Shin, J. Y., Song, J., Bonaguidi, M. A., et al. (2015). Single-Cell RNA-Seq with waterfall reveals molecular cascades underlying adult neurogenesis. Cell Stem Cell 17, 360–372. doi: 10.1016/j.stem.2015.07.013
Shulman, J. M., Imboywa, S., Giagtzoglou, N., Powers, M. P., Hu, Y., Devenport, D., et al. (2014). Functional screening in Drosophila identifies Alzheimer’s disease susceptibility genes and implicates Tau-mediated mechanisms. Hum. Mol. Genet. 23, 870–877. doi: 10.1093/hmg/ddt478
Siavelis, J. C., Bourdakou, M. M., Athanasiadis, E. I., Spyrou, G. M., and Nikita, K. S. (2016). Bioinformatics methods in drug repurposing for Alzheimer’s disease. Brief. Bioinform. 17, 322–335. doi: 10.1093/bib/bbv048
Skene, N. G., and Grant, S. G. N. (2016). Identification of vulnerable cell types in major brain disorders using single cell transcriptomes and expression weighted cell type enrichment. Front. Neurosci. 10:16. doi: 10.3389/fnins.2016.00016
Smyth, G. K. (2004). Linear models and empirical bayes methods for assessing differential expression in microarray experiments. Stat. Appl. Genet. Mol. Biol. 3, 1–25. doi: 10.2202/1544-6115.1027
Solito, E., and Sastre, M. (2012). Microglia function in Alzheimer’s disease. Front. Pharmacol. 3:14. doi: 10.3389/fphar.2012.00014
Soreq, L., Guffanti, A., Salomonis, N., Simchovitz, A., Israel, Z., Bergman, H., et al. (2014). Long non-coding RNA and alternative splicing modulations in Parkinson’s leukocytes identified by RNA sequencing. PLoS Comput. Biol. 10:e1003517. doi: 10.1371/journal.pcbi.1003517
Soreq, L., Salomonis, N., Bronstein, M., Greenberg, D. S., Israel, Z., Bergman, H., et al. (2013). Small RNA sequencing-microarray analyses in Parkinson leukocytes reveal deep brain stimulation-induced splicing changes that classify brain region transcriptomes. Front. Mol. Neurosci. 6:10. doi: 10.3389/fnmol.2013.00010
Srinivasan, K., Friedman, B. A., Larson, J. L., Lauffer, B. E., Goldstein, L. D., Appling, L. L., et al. (2016). Untangling the brain’s neuroinflammatory and neurodegenerative transcriptional responses. Nat. Commun. 7:11295. doi: 10.1038/ncomms11295
Stratowa, C. (2020). xps: processing and analysis of affymetrix oligonucleotide arrays including exon arrays, whole genome arrays and plate arrays. R package version 1.50.0. Bioconductor doi: 10.18129/B9.bioc.xps
Subramanian, A., Narayan, R., Corsello, S. M., Peck, D. D., Natoli, T. E., Lu, X., et al. (2017). A next generation connectivity map: L1000 platform and the first 1,000,000 Profiles. Cell 171, 1437–1452.e17. doi: 10.1016/j.cell.2017.10.049
Subramanian, A., Tamayo, P., Mootha, V. K., Mukherjee, S., Ebert, B. L., Gillette, M., et al. (2005). Gene set enrichment analysis: a knowledge-based approach for interpreting genome-wide expression profiles. Proc. Natl. Acad. Sci. U.S.A 102, 15545–15550. doi: 10.1073/pnas.0506580102
Szigeti, A., Hocsak, E., Rapolti, E., Racz, B., Boronkai, A., Pozsgai, E., et al. (2010). Facilitation of mitochondrial outer and inner membrane permeabilization and cell death in oxidative stress by a novel Bcl-2 homology 3 domain protein. J. Biol. Chem. 285, 2140–2151. doi: 10.1074/jbc.M109.015222
Tan, M. G. K., Lee, C., Lee, J. H., Francis, P. T., Williams, R. J., Ramírez, M. J., et al. (2014). Decreased rabphilin 3A immunoreactivity in Alzheimer’s disease is associated with Aβ burden. Neurochem. Int. 64, 29–36. doi: 10.1016/j.neuint.2013.10.013
Tibshirani, R., Hastie, T., Narasimhan, B., and Chu, G. (2002). Diagnosis of multiple cancer types by shrunken centroids of gene expression. Proc. Natl. Acad. Sci. U.S.A. 99, 6567–6572. doi: 10.1073/pnas.082099299
Tomita, H., Vawter, M. P., Walsh, D. M., Evans, S. J., Choudary, P. V., Li, J., et al. (2004). Effect of agonal and postmortem factors on gene expression profile: quality control in microarray analyses of postmortem human brain. Biol. Psychiatry 55, 346–352. doi: 10.1016/j.biopsych.2003.10.013
Tönnies, E., and Trushina, E. (2017). Oxidative stress, synaptic dysfunction, and Alzheimer’s disease. J. Alzheimer’s Dis. 57, 1105–1121. doi: 10.3233/JAD-161088
Trapnell, C., Cacchiarelli, D., Grimsby, J., Pokharel, P., Li, S., Morse, M., et al. (2014). The dynamics and regulators of cell fate decisions are revealed by pseudotemporal ordering of single cells. Nat. Biotechnol. 32, 381–386. doi: 10.1038/nbt.2859
Treutlein, B., Lee, Q. Y., Camp, J. G., Mall, M., Koh, W., Shariati, S. A. M., et al. (2016). Dissecting direct reprogramming from fibroblast to neuron using single-cell RNA-seq. Nature 534, 391–395. doi: 10.1038/nature18323
van der Maaten, L., and Hinton, G. (2008). Visualizing data using t-SNE. J. Mach. Learn. Res. 9, 2579–2605.
Väremo, L., Nielsen, J., and Nookaew, I. (2013). Enriching the gene set analysis of genome-wide data by incorporating directionality of gene expression and combining statistical hypotheses and methods. Nucleic Acids Res. 41, 4378–4391. doi: 10.1093/nar/gkt111
Velmeshev, D., Schirmer, L., Jung, D., Haeussler, M., Perez, Y., Mayer, S., et al. (2019). Single-cell genomics identifies cell type–specific molecular changes in autism. Science 364, 685–689. doi: 10.1126/science.aav8130
Verkhratsky, A., Olabarria, M., Noristani, H. N., Yeh, C., and Rodriguez, J. J. (2010). Astrocytes in Alzheimer’s disease. Neurotherapeutics 7, 399–412.
Wang, Z., Gerstein, M., and Snyder, M. (2009). RNA-Seq: a revolutionary tool for transcriptomics. Nat. Rev. Genet. 10, 57–63. doi: 10.1038/nrg2484
Warner, C. B., Ottman, A. A., and Brown, J. N. (2018). The role of atomoxetine for Parkinson disease–related executive dysfunction. J. Clin. Psychopharmacol. 38, 627–631. doi: 10.1097/JCP.0000000000000963
Wishart, D. S., Feunang, Y. D., Guo, A. C., Lo, E. J., Marcu, A., Grant, J. R., et al. (2018). DrugBank 5.0: a major update to the DrugBank database for 2018. Nucleic Acids Res. 46, D1074–D1082. doi: 10.1093/nar/gkx1037
World Health Organization (2020). Available online at: http://www.who.int/ageing/en/ (accessed September 1, 2020).
Xie, A., Gao, J., Xu, L., and Meng, D. (2014). Shared mechanisms of neurodegeneration in alzheimer’s disease and parkinson’s disease. Biomed Res. Int. 2014:648740. doi: 10.1155/2014/648740
Xu, G.-G., Deng, Y.-Q., Liu, S.-J., Li, H.-L., and Wang, J.-Z. (2005). Prolonged Alzheimer-like Tau hyperphosphorylation induced by simultaneous inhibition of phosphoinositol-3 kinase and protein kinase C in N2a cells. Acta Biochim. Biophys. Sin. 37, 349–354. doi: 10.1111/j.1745-7270.2005.00050.x
Yagensky, O., Kohansal-Nodehi, M., Gunaseelan, S., Rabe, T., Zafar, S., Zerr, I., et al. (2019). Increased expression of heme-binding protein 1 early in Alzheimer’s disease is linked to neurotoxicity. eLife 8:e47498. doi: 10.7554/eLife.47498
Yiannopoulou, K. G., and Papageorgiou, S. G. (2013). Current and future treatments for Alzheimer’s disease. Ther. Adv. Neurol. Disord. 6, 19–33. doi: 10.1177/1756285612461679
Yu, Q., and He, Z. (2017). Comprehensive investigation of temporal and autism-associated cell type composition-dependent and independent gene expression changes in human brains. Sci. Rep. 7, 1–12. doi: 10.1038/s41598-017-04356-7
Zahoor, I., Shafi, A., and Haq, E. (2018). Pharmacological Treatment of Parkinson’s Disease. Available online at: http://www.ncbi.nlm.nih.gov/pubmed/30702845 (accessed December 21, 2018).
Zarow, C., Lyness, S. A., Mortimer, J. A., and Chui, H. C. (2003). Neuronal loss is greater in the locus coeruleus than nucleus basalis and substantia nigra in Alzheimer and Parkinson diseases. Arch. Neurol. 60:337. doi: 10.1001/archneur.60.3.337
Zarrouk, A., Debbabi, M., Bezine, M., Karym, E. M., Badreddine, A., Rouaud, O., et al. (2018). Lipid biomarkers in Alzheimer’s disease. Curr. Alzheimer Res. 15, 303–312. doi: 10.2174/1567205014666170505101426
Zeisel, A., Hochgerner, H., Lönnerberg, P., Johnsson, A., Memic, F., van der Zwan, J., et al. (2018). Molecular architecture of the mouse nervous system. Cell 174, 999–1014.e22. doi: 10.1016/j.cell.2018.06.021
Zeisel, A., Munoz-Manchado, A. B., Codeluppi, S., Lonnerberg, P., La Manno, G., Jureus, A., et al. (2015). Cell types in the mouse cortex and hippocampus revealed by single-cell RNA-seq. Science 347, 1138–1142. doi: 10.1126/science.aaa1934
Zhang, J., Peng, C., Shi, H., Wang, S., Wang, Q., and Wang, J. (2009). Inhibition of autophagy causes tau proteolysis by activating calpain in rat brain. J. Alzheimer’s Dis. 16, 39–47. doi: 10.3233/JAD-2009-0908
Zhang, L., Liu, C., Wu, J., Tao, J., Sui, X., Yao, Z., et al. (2014). Tubastatin A/ACY-1215 improves cognition in Alzheimer’s disease transgenic mice. J. Alzheimer’s Dis. 41, 1193–1205. doi: 10.3233/JAD-140066
Zhang, Y., James, M., Middleton, F. A., and Davis, R. L. (2005). Transcriptional analysis of multiple brain regions in Parkinson’s disease supports the involvement of specific protein processing, energy metabolism, and signaling pathways, and suggests novel disease mechanisms. Am. J. Med. Genet. Neuropsychiatr. Genet 137, 5–16. doi: 10.1002/ajmg.b.30195
Zhang, Y., Sloan, S. A., Clarke, L. E., Grant, G. A., Gephart, M. G. H., Barres Correspondence, B. A., et al. (2016). Purification and characterization of progenitor and mature human astrocytes reveals transcriptional and functional differences with mouse. Neuron 89, 37–53. doi: 10.1016/j.neuron.2015.11.013
Keywords: Alzheimer’s disease, Parkinson’s disease, neurodegeneration, cellular deconvolution, digital cytometry, single-cell RNA-seq, chemo-transcriptomics
Citation: Bordone MC and Barbosa-Morais NL (2020) Unraveling Targetable Systemic and Cell-Type-Specific Molecular Phenotypes of Alzheimer’s and Parkinson’s Brains With Digital Cytometry. Front. Neurosci. 14:607215. doi: 10.3389/fnins.2020.607215
Received: 16 September 2020; Accepted: 17 November 2020;
Published: 09 December 2020.
Edited by:
David F. Clayton, Clemson University, United StatesReviewed by:
Lilach Soreq, University College London, United KingdomXue Wang, Mayo Clinic Florida, United States
Copyright © 2020 Bordone and Barbosa-Morais. This is an open-access article distributed under the terms of the Creative Commons Attribution License (CC BY). The use, distribution or reproduction in other forums is permitted, provided the original author(s) and the copyright owner(s) are credited and that the original publication in this journal is cited, in accordance with accepted academic practice. No use, distribution or reproduction is permitted which does not comply with these terms.
*Correspondence: Nuno L. Barbosa-Morais, bm1vcmFpc0BtZWRpY2luYS51bGlzYm9hLnB0