 Angeles Alvarez Secord1*
 Marcus Q. Bernardini1Gloria Broadwater2Lisa A. Grace1
 Zhiqing Huang1Tsukasa Baba1,3Eiji Kondoh1,3Gregory Sfakianos1Laura J. Havrilesky1
 Susan K. Murphy1
- 1Department of Obstetrics and Gynecology, Division of Gynecologic Oncology, Duke Cancer Institute, Duke University Medical Center, Durham, NC, USA
- 2Biostatistics, Cancer Center Biostatistics, Duke Cancer Institute, Duke University Medical Center, Durham, NC, USA
- 3Department of Gynecology and Obstetrics, Graduate School of Medicine, Kyoto University, Kyoto, Japan
Objectives: To elucidate the association between thrombospondin1 (THBS1) expression and TP53 status and THBS1 promoter methylation in epithelial ovarian cancer (EOC).
Methods: Epithelial ovarian cancer cell lines with known TP53 status were analyzed for THBS1 gene expression using Affymetrix U133 microarrays and promoter methylation by pyrosequencing. THBS1 mRNA expression was obtained pre- and post-exposure to radiation and hypoxia treatment in A2780 parent wild-type (wt) and mutant (m)TP53 cells. THBS1 expression was compared to tumor growth properties.
Results: THBS1 gene expression was higher in cells containing a wtTP53 gene or null TP53 mutation (p = 0.005) and low or absent p53 protein expression (p = 0.008) compared to those harboring a missense TP53 gene mutation and exhibiting high p53 protein expression. Following exposure to radiation, there was a 3.4-fold increase in THBS1 mRNA levels in the mTP53 versus wtTP53 A2780 cells. After exposure to hypoxia, THBS1 mRNA levels increased approximately fourfold in both wtTP53 and mTP53 A2780 cells. Promoter methylation levels were low (median = 8.6%; range = 3.5–88.8%). There was a non-significant inverse correlation between THBS1 methylation and transcript levels. There was no association between THBS1 expression and population doubling time, invasive capacity, or anchorage-independent growth.
Conclusion: THBS1 expression may be regulated via the TP53 pathway, and induced by hypoxic tumor microenvironment conditions. Overall low levels of THBS1 promoter methylation imply that methylation is not the primary driver of THBS1 expression in EOC.
Introduction
Thrombospondin1 (THBS1) is a potent modulator of angiogenesis that has been shown to have both stimulatory (1–6) and inhibitory effects (7, 8) on the process of tumor neovascularization, proliferation, invasiveness, and progression. We previously demonstrated that THBS1 protein expression was associated with clinical outcome in women with advanced epithelial ovarian cancer (EOC) who were treated with taxane and platinum-based chemotherapy regimens (9). Specifically, women whose cancers had high compared to low THBS1 protein expression had worse progression-free (PFS) and overall survival (OS). THBS1 was shown to provide independent prognostic value after adjusting for clinical characteristics and p53 overexpression. Moreover, exploratory adjusted Cox regression modeling revealed that women whose cancers overexpressed p53 protein, which reflects the presence of missense TP53 mutations, and expressed high THBS1 had a threefold elevation in the risk of disease progression and death compared with women whose cancers didn’t overexpress p53 or those that overexpressed p53 and expressed low THBS1 (9).
The TP53 tumor-suppressor pathway has been implicated in the regulation of THBS1 gene and protein expression (1, 9). Dameron and colleagues demonstrated that TP53 positively regulated THBS1 promoter sequences and induced endogenous THBS1 gene expression in fibroblasts (1). The exact regulatory mechanism is unknown, however, the TP53 gene has numerous functions including transcription factor, cell cycle arrest activation, apoptosis, DNA damage repair, and protein–protein interactions. In addition, TP53 has been shown to regulate other angiogenic factors via promoter methylation (10). The methylation of promoter-associated CpG islands has been linked to the transcriptional activity of multiple genes involved in carcinogenesis (11). Oshiro et al. proposed that wild-type (wt) TP53 DNA-binding activity to promoters prevents aberrant methylation (10). Upon mutation the wt p53 DNA-binding activity is lost and the TP53 target regions are vulnerable to de novo cytosine methylation. TP53 mutations are present in over 90% of high-grade serous ovarian cancers (12) and represent a plausible mechanism of controlling epigenetic regulation of gene transcription.
The objective of the present study was to evaluate the relationships between THBS1 protein expression, TP53 status, and THBS1 promoter methylation in EOC cell lines. We also sought to determine if induced TP53 transcription or hypoxia was associated with increased THBS1 mRNA transcription. Our primary hypothesis was that inactivation of the TP53 tumor-suppressor gene pathway modulates THBS1 transcription and expression in ovarian cancers through aberrant promoter hypermethylation. Furthermore, we evaluated whether THBS1 expression was associated with population doubling time, invasive capacity, anchorage-independent growth as well as cisplatin and paclitaxel induced growth inhibition.
Materials and Methods
Ovarian Cancer Cell Lines
Cell culture
Twenty-one immortalized ovarian cancer cell lines were included. Nineteen ovarian cancer cell lines were evaluated for THBS1 expression and promoter methylation status, while two A2780 ovarian cancer cell lines (wt parent and mutant TP53 daughter lines) were used to evaluate the effect of radiation and hypoxia treatment on THBS1 mRNA expression. The cells were grown in monolayer culture in RPMI1640 media (Sigma-Aldrich Co., St. Louis, MO, USA) supplemented with penicillin and streptomycin (100 U/mL penicillin, 100 μg/mL streptomycin; Invitrogen, Carlsbad, CA, USA) and 10% heat inactivated fetal bovine serum (v/v; Invitrogen) in an atmosphere of 5% CO2 at 37°C.
The short tandem repeat (STR) genotypes of all ovarian cancer cell lines were analyzed to authenticate the cell lines using the AmpFLSTR® Identifiler® Plus PCR Amplification Kit (Applied Biosystems, Carlsbad, CA, USA) at the University of Colorado Cancer Center, DNA Sequencing, and Analysis Core (13). The STR genotypes of ovarian cancer cell lines that are available from the American Type Culture Collection or the RIKEN BioResource Center Cell Bank were identical to the source genotypes as reported within their respective STR databases and all other non-commercially available cell lines were shown to be derived from females with unique genotypes.
Protein extractions were performed as previously described (14) and RNA extractions were performed using the RNeasy Mini Kit following the manufacturer’s protocol (Qiagen, Inc.; Valencia, CA, USA). For cDNA synthesis, 1 μg of total RNA was incubated for 60 min at 42°C with oligo (dT) primers and 20 units of AMV reverse transcriptase in 1× reverse transcriptase buffer supplemented with 5 mM of MgCl2, 1 mM of each dNTP, and 25 units of RNase inhibitor in a final volume of 20 μl (Roche Diagnostics Cooperation, Indianapolis, IN, USA). Methodologies for determining TP53 mutation status and immunohistochemical protein expression, population doubling time of the cells, invasive capacity, and chemotherapy-induced growth inhibition have been previously described (15–18). Western blot analysis of TP53 protein was also performed before and after exposure to radiation and hypoxia. Ten micrograms of total cellular protein for each specimen were separated by 7.5% SDS polyacrylamide gel electrophoresis and transferred to a nitrocellulose membrane (Schleicher and Schuell). Membranes were first incubated with primary antibodies against TP53 (1:3000 DO-1, mouse monoclonal, Santa Cruz Biotechnology, Inc., Santa Cruz, CA, USA) overnight at 4°C or β-actin (1:3000) A4700, mouse monoclonal, SIGMA, St. Louis, MO, USA) for 1.5 h at room temperature, and then with an anti-mouse secondary antibody (1:7500 115-035-062, Jackson ImmunoResearch, West Grove, PA, USA) for 1 h at room temperature. Antibody interactions were visualized using chemiluminescence (Perkin Elmer Western Lightning™ Chemiluminescence ECL Reagent, Shelton, CT, USA). TP53 and β-actin expression were quantified by densitometric scanning using Scion Image software (Scion Corporation, Frederick, MD, USA). Results were then normalized to the β-actin content in each lane to correct for relative expression.
Anchorage-independent growth
Assays for colony formation in soft agar were performed as described. (19) Briefly, 2× RPMI media was prepared from powder and supplemented with fetal bovine serum and antibiotics (Invitrogen; Carlsbad, CA, USA), and 1% agarose was made with the RPMI media using low-melting-temperature agarose (Invitrogen). One milliliter of 0.5% agarose was placed into each well of six-well tissue culture dishes and overlayed with 1 mL of 0.33% agarose prepared in 1× RPMI and containing 2 × 10⁴ cells. After 3 weeks incubation at 37°C in a humidified chamber with 5% atmospheric CO2, colonies larger than 100 μm in diameter were counted. The colony number formed for each cell line was determined by averaging the number of colonies >100 μm that were counted in 10−20 microscopic fields at 100× magnification.
Hypoxia treatment of cell lines
A2780 cell lines were grown to 80% confluence in T150 flasks and exposed to hypoxic conditions using 0.5% O2 0.5% O2 0.5% O2 0.5% O2 0.5% O2 in a Bactron Anaerobic Chamber (Sheldon Manufacturing: Cornelius, OH, USA) for 8 or 24 h prior to harvesting through trypsinization.
Radiation treatment of cell lines
Ionizing radiation was used to stimulate TP53 induction (20). A2780 cell lines were plated in 60 mm dishes, grown to 80% confluence, and exposed to 5 Gy of ionizing radiation using the Gamma cell 1000 (MDS Nordion ON, Canada), and harvested at 0, 2, 4, 6, 8, 24, and 48 h post-exposure. To validate our model we irradiated the A2780 wild-type TP53 (A2780wtTP53) ovarian cancer cell line to 5 Gy and then subjected cell lysates to immunoblot to assess p53 protein expression.
THBS1 mRNA and protein expression
The genomic array and Western blot analysis were performed as previously described (9, 21) (NCBI Accession Series GSE25428; www.ncbi.nlm.nih.gov/geo). Three probes (201108_s_at, 201109_s_at, and 201110_s_at) on the Affymetrix U133 chip were used to assay the cell lines for THBS1 expression in 19 cell lines. Expression levels were RMA-normalized, and the average expression probe value was calculated.
Real-time quantitative PCR (RQ-PCR) was used to analyze mRNA expression in eight immortalized ovarian cancer cell lines (OVCA429, OVCA433 DOV13, OVCAR3, OVCA432, SKOV3, A2780wtTP53, and A2780 mutant TP53 (A2780mTP53). Quantification of THBS1 mRNA expression was obtained by RQ-PCR using fluorescent TaqMan methodology (ABI Prism 7900HT Sequence Detection System; Applied BioSystems; Foster City, CA, USA). RQ-PCR was performed using 7.25 μl 1:15 dilute cDNA, 12.5 μl Taqman Universal PCR Master Mix (Applied Biosystem; Foster City, CA, USA), 1.25 μl primer assay in a final volume of 25 μl. Primers and probes for THBS1 (Hs00170236_m1) and GAPDH (human 402869) were obtained from Applied Biosystems (Foster City, CA, USA). The thermal cycling conditions were: 50°C for 2 min and 95°C for 10 min followed by 50 cycles of 95°C for 15 s and 60°C for 1 min. The comparative cycle threshold method was used to calculate the relative expression of THBS1 mRNA normalized to GAPDH run in parallel (22).
Thrombospondin1 protein expression was quantified by densitometric scanning (Scion Corporation, Frederick, MD, USA) and normalized to the β-actin content to correct for relative expression.
Methylation analyses
Bisulfite pyrosequencing was used to evaluate THBS1 promoter methylation status in the cell lines on a PyroMark Q96 MD pyrosequencing instrument (Qiagen; Valencia, CA, USA). Genomic DNA (800 ng) was modified with sodium bisulfite as previously described (23) to convert unmethylated cytosines to uracils. Methylated cytosines are protected from this conversion. PCR amplification prior to pyrosequencing was performed with the HotStar Taq PCR Kit (Qiagen) using 40 ng of bisulfite modified DNA (assuming complete recovery) in a 25 μl reaction volume with 1.5 mM MgCl2 and 100 nM each of forward primer 5′-AGT TTT TTT TAG GGA TGT TTT GTT GAT-3′ and reverse primer 5′-(biotin)-CCA AAC TTA AAA ACA CTA AAA CTT CTC A-3′. PCR conditions were 95°C for 15 min, followed by touchdown PCR using 55 total cycles with a 30 s denaturation at 94°C, a 30 s annealing step (5 cycles at 69°C, 5 cycles at 66°C, 5 cycles at 63°C, 5 cycles at 60°C, and 40 cycles at 57°C) and a 30 s extension step at 72°C, followed by a final 10 min extension step at 72°C. The extended cycle number is required to fully incorporate the biotin-tagged primer, which is used to isolate the single stranded amplicon used as the template for the pyrosequencing reaction, which was done with sequencing primer 5′-GGG ATG TTT GTT GAT TAT-3′. Pyrosequencing was performed using PyroMark Gold Q96 reagents (Qiagen) per the manufacturer’s recommendations. The mean methylation value for the seven CpGs within the sequenced region was used for analysis. Low methylation was arbitrarily defined as <15% methylated, and high methylation as >15%. The pyrosequencing assay was validated using mixtures of bisulfite modified universally methylated DNA (CpGenome; Promega; Madison, WI, USA) and normal leukocyte DNA with the methylated DNA comprising 0, 20, 40, 60, 80, and 100% of the total input. There was a linear relationship between the amount of methylated DNA present in the reactions and that measured by pyrosequencing, with a correlation coefficient of 0.98.
Statistical analysis
Spearman’s correlation coefficient test was used to assess the association between THBS1 gene expression and population doubling time of the cells; invasive capacity; anchorage-independent growth index; as well as cisplatin and paclitaxel IC50 values. The Wilcoxon rank sum test was used to compare the continuous representation of THBS1 gene expression and promoter methylation in various groups defined by TP53 gene mutation and protein expression. All tests were two-sided and p < 0.05 was considered statistically significant.
Results
THBS1 Expression and Promoter Methylation Status in Ovarian Cancer Cell Lines
In the panel of 19 ovarian cancer cell lines, THBS1 gene expression (median 9.5; range = 4.8–13.2) was associated with TP53 gene mutation status and protein expression. Specifically THBS1 gene expression was higher in cells containing a wild-type TP53 gene or null or frameshift TP53 mutation compared to those harboring a missense TP53 gene mutation (p = 0.005) (Table 1; Figure 1). THBS1 gene expression was also higher in cells with low p53 protein expression (0 or 1+) compared to those exhibiting high p53 protein expression (2+) (p = 0.008) (Table 1). Pyrosequencing revealed a wide distribution of promoter methylation across the cell lines, but the majority showed low methylation levels (median = 8.6; range = 3.5–88.8). Cells with low levels of promoter methylation (≤5% methylated) exhibited higher THBS1 gene expression (>5), while those with high levels of promoter methylation (>15% methylated) had low THBS1 gene expression (<5) (Figure 2A). Since only three observations have THBS1 gene expression values less than five the group is too small to use a statistical test for comparison. There was no association between THBS1 promoter methylation and TP53 gene mutation status (p = 1.0) or p53 protein expression (p = 1.0). All of the cells with promoter methylation >15% harbored a missense TP53 gene mutation.
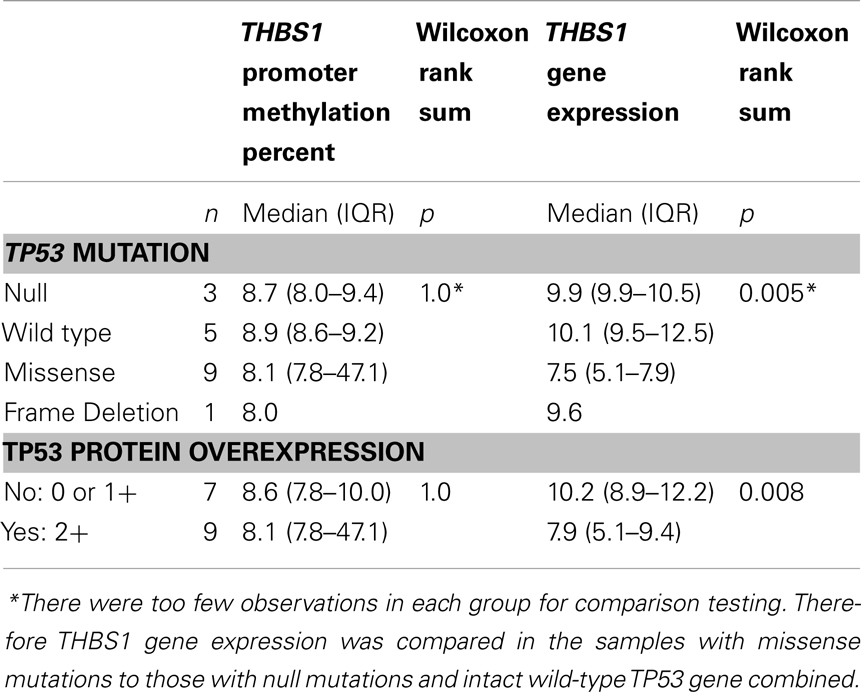
Table 1. Relationship between THBS1 differential gene expression, promoter methylation, mRNA expression, and TP53 mutations in ovarian cancer cell lines.
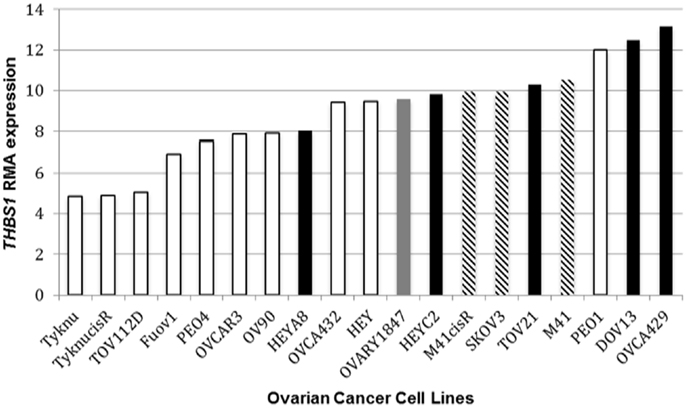
Figure 1. THBS1 RMA expression and TP53 status. Ovarian cancer cell lines harboring a TP53 missense mutation bars had lower THBS1 RMA expression compared to cell lines with an intact wild-type (wt) TP53 gene. TP53 missense mutation  ; TP53 frameshift mutation
  ; null mutation
  ; wt TP53 gene
  . Expression values are given as log2-transformed RMA-normalized values from the Affymetrix U133A gene chip.
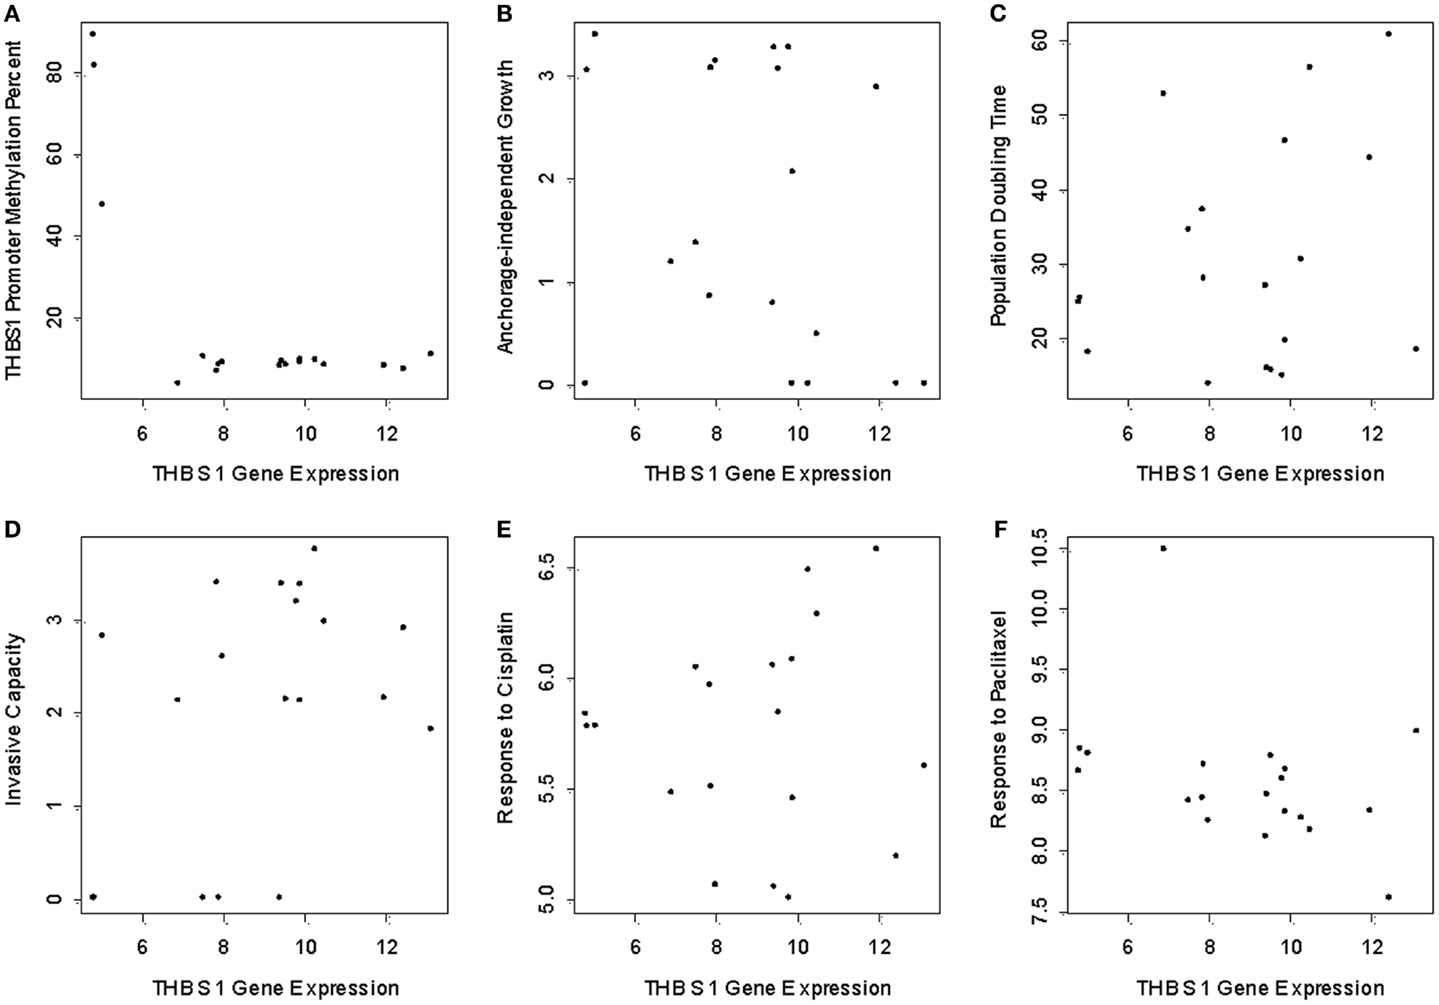
Figure 2. THBS1 gene expression, THBS1 promoter methylation, tumor growth properties, and chemotherapy-induced growth inhibition. Pyrosequencing shows low levels of methylation in the cell lines (median = 8.6%; range = 3.5 to 88.8%). (A) Cells with low levels of promoter methylation exhibited higher THBS1 gene expression, while those with high levels of promoter methylation had low THBS1 gene expression. There was no association between THBS1 gene expression with anchorage-independent growth; (B) population doubling time (C) invasive capacity; (D) or cisplatin; (E) and paclitaxel; (F) IC50 values.
There was no association between THBS1 gene expression and population doubling time of the cells, invasive capacity, anchorage-independent growth or cisplatin and paclitaxel IC50 values (Figures 2B–F).
We evaluated THBS1 gene, mRNA, and protein expression in a subset of six ovarian cancer cell lines. Relative THBS1 gene expression was higher in the wild-type cell lines (OVCA429, 13.6; DOV13, 12.4; OVCA433,14.0) compared to three cell lines harboring a TP53 mutation (OVCAR 3, 7.6; SKOV3, 9.6; OVCA432, 9.5) (RMA-normalized values given are an average of Affymetrix U133 probes 201108_s_at, 201109_s_at, and 201110_s_at). We observed that the cells containing a wtTP53 gene tended to express higher levels of THBS1 mRNA (110–114), but lower relative protein expression (absent to 1.7). Conversely, mutant TP53 cell lines had lower levels of THBS1 mRNA expression (83–91) and higher levels of relative protein expression (2.5–4.6) (Figure 3).
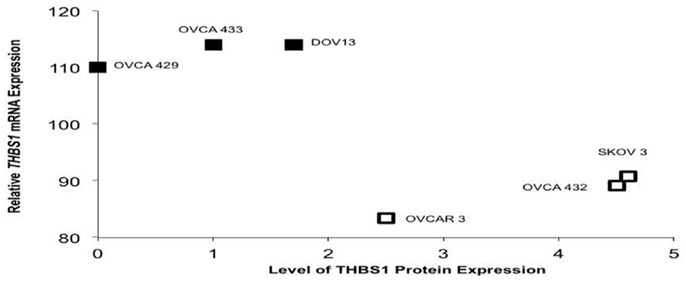
Figure 3. TP53 mutation status in select ovariancancer cell lines and THBS1 mRNA and protein expression. The three ovarian cancer cell lines with wt TP53 demonstrated higher levels of THBS1 mRNA, but lower relative protein expression. Conversely, mutant TP53 cell lines had lower levels of THBS1 mRNA expression and higher levels of relative protein expression. TP53 missense mutation ; wt TP53 gene .
The effect of radiation and hypoxia treatment on THBS1 mRNA expression in the A2780 ovarian cancer cell lines
After treatment with radiation, the A2780wtTP53 cells demonstrated a 3.6-fold increase in THBS1 mRNA levels at 24 h while the A2780mTP53 cells had a 4.5-fold increase at 24 h and a 9.5-fold increase at 48 h (Figure 4A). There was a 3.4-fold greater increase in THBS1 mRNA levels in the A2780mTP53 cell line compared to wild-type (Figure 4A). Similarly, when compared to non-irradiated cells, irradiated cells demonstrated a 3.3-fold increase in p53 protein expression 48 h after exposure (Figure 5A).
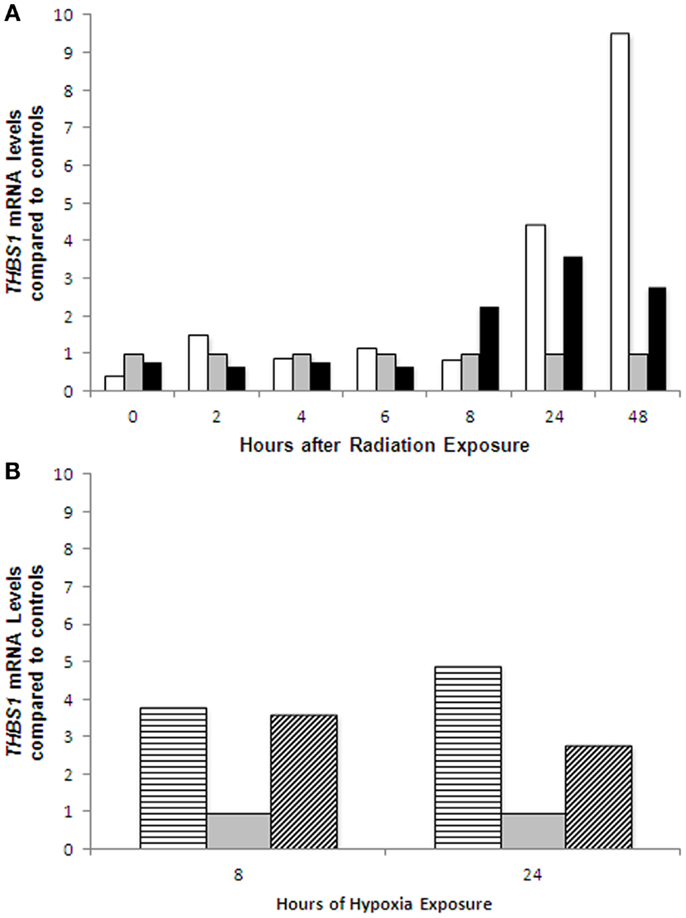
Figure 4. THBS1 mRNA expression in ovarian cancer cell lines following radiation and hypoxia treatment. Induction of THBS1 transcription in the parent A2780wtTP53 cells and A2780mTP53 cells following radiation treatment (A); and hypoxia exposure (B). After treatment with radiation, the A2780wtTP53 cells demonstrated a 3.6-fold increase at 24 h while the A2780mTP53 cells had a 4.5-fold increase at 24 h and a 9.5-fold increase at 48 h. There was a 3.4-fold greater increase in THBS1 levels at 48 h in the A2780mTP53 cell line compared to wild type. There was an approximately fourfold increase in THBS1 levels in the A2780wt cells at 8 and 24 h. In the A2780m there was a 4.6-fold increase at 8 h, and a 2.8-fold increase at 24 h. Controls  ; radiated A2780wtTP53 cells ; radiated A2780mTP53 cells ; hypoxia treated A2780wtTP53 cells
  ; and hypoxia treated A2780mTP53 cells
  .
.
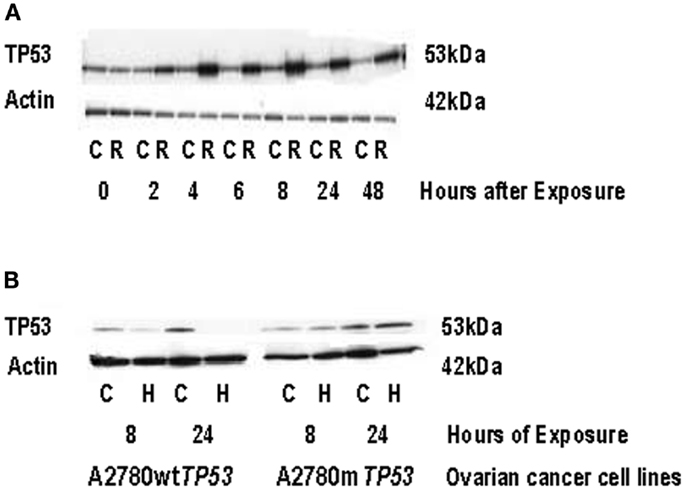
Figure 5. TP53 protein expression in ovarian cancer cell lines following radiation and hypoxia treatment. (A) Induction of TP53 protein expression in A2780wtTP53 cells following radiation treatment. Irradiated cells demonstrated a 3.3-fold increase in TP53 expression at 48 h compared to non-irradiated cells. (B) Induction of p53 protein expression in the parent A2780wtTP53 cells and A2780mTP53 cells following hypoxia exposure. TP53 exposure was absent in the A2780wtTP53 cells at 24 h of hypoxia exposure. There was no significant increase in p53 expression in the A2780mTP53 cells after hypoxia. C, control; R, radiation; H, hypoxia.
Following exposure to hypoxia, the THBS1 mRNA levels increased approximately fourfold in A2780wtTP53 cells at 8 and 24 h. There was a similar increase in THBS1 mRNA levels in the A2780mTP53 cells with a 4.6-fold increase at 8 h and a 2.8-fold increase at 24 h (Figure 4B). In contrast, p53 expression was absent in the A2780wtTP53 cells at 24 h and there was no significant increase in p53 expression in the A2780mTP53 cells after exposure to hypoxia (Figure 5B).
Discussion
The function of THBS1, its prognostic effect in various cancers, and its regulation are controversial. Dameron et al. previously reported that THBS1 may be regulated by TP53 based on studies of fibroblasts from patients with Li Fraumeni syndrome (1). Our data from immortalized ovarian cell lines indicate that THBS1 expression is associated with TP53 status and is consistent with the hypothesis that THBS1 gene expression is regulated via a TP53-dependent pathway. The ovarian cancer cell lines containing wt TP53 expressed higher levels of THBS1 mRNAs. In contrast, the cell lines harboring missense mutant TP53 expressed low THBS1 mRNA levels. Furthermore, induction with radiation, known to stimulate TP53 transcription, was associated with a distinct increase in THBS1 mRNA levels.
Wild-type TP53 may bind to the THBS1 promoter resulting in gene transcription. Alternatively, wtTP53 is normally degraded and expressed at low levels, potentially allowing for a secondary factor to bind to the promoter site. Interestingly, radiation induced THBS1 expression was most pronounced in the mutated TP53 cell line, and we don’t have a clear explanation for this finding. The A2780 daughter cell line carries a missense TP53 mutation. However, the effect of the mutation on p53 function and DNA-binding activity is unknown. In general, TP53 mutations change the amino acid encoded within the affected codon, act in a “dominant negative” fashion and can neutralize the function of the normal intact TP53 allele. Specifically, missense p53 protein can bind with wt p53 protein and prevent it from forming homotetramers and/or interacting with DNA, or if it does interact with DNA, the presence of the mutant protein may impede interaction with other secondary factors required to drive induction of transcription (Figure 6). Missense and null TP53 mutations and proteins may have different effects on gene transcription. Interestingly, the cell lines with null TP53 mutations (those that lead to complete loss of function of the gene, which can include some truncation mutations that prematurely terminate the polypeptide, some non-sense mutations that introduce a stop codon through point mutation and prematurely truncate the polypeptide, and some frameshift mutations resulting from insertion or deletion of non-multiple-of-three nucleotides within the coding sequence that shift the open reading frame, leading to premature truncation of the polypeptide), demonstrated similar levels of THBS1 expression as the wt TP53 cell lines. Our findings suggest that missense, but not null TP53 mutations, may interfere with THBS1 regulation.
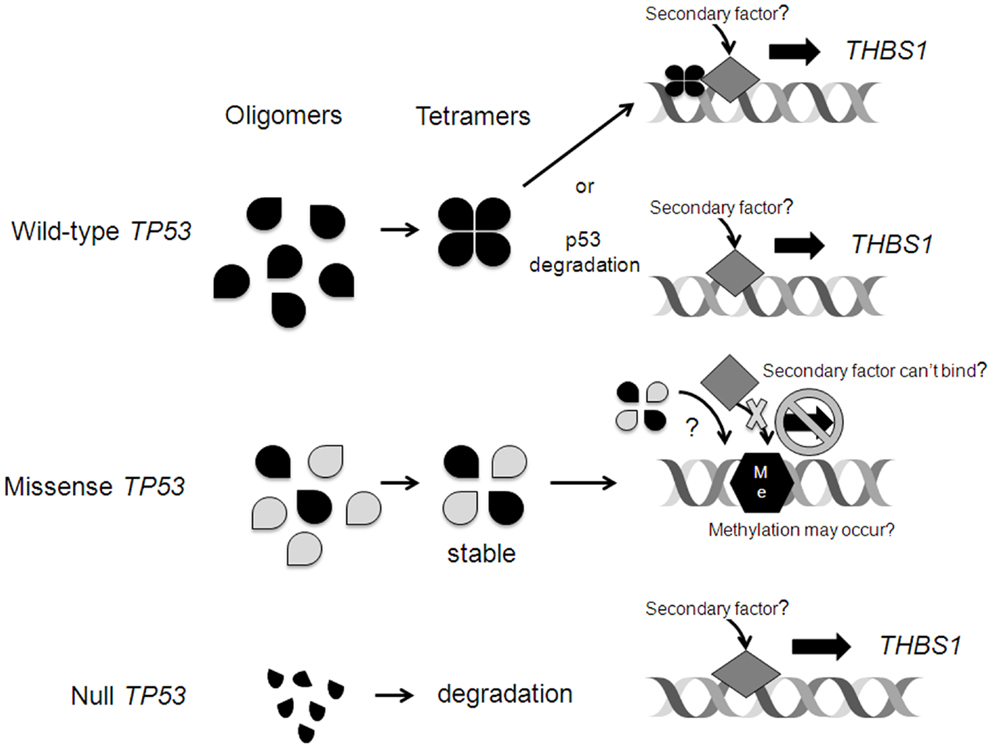
Figure 6. Possible mechanisms of TP53 regulation of THBS1 expression. Wild-type (wt) TP53 may bind to the THBS1 promoter resulting in gene transcription. Alternatively, wtTP53 is normally degraded and expressed at low levels allowing for a secondary factor to bind to the promoter site. Missense p53 protein can bind with wt p53 protein and prevent it from forming homotetramers and/or interacting with DNA, or if it does interact with DNA, the presence of the mutant protein may impede interaction with other secondary factors required to drive induction of transcription. In rare cases, upon mutation the wt p53 DNA-binding activity is lost and the p53 target regions are vulnerable to de novo cytosine methylation (Me) that inhibits transcription. Null TP53 mutations lead to complete loss of function of the gene and abnormal p53 fragments that are degraded. This may allow for a secondary factor to bind and induce THBS1 transcription.
It is unlikely that methylation plays a significant role in the regulation of THBS1 gene expression, given the overall low levels of THBS1 promoter methylation detected in the vast majority of the cell lines analyzed. However, we did find that all of the cells with higher levels of promoter methylation (>15% methylated) harbored a missense TP53 gene mutation and had the lowest THBS1 gene expression. These findings suggest that THBS1 gene expression may be silenced in association with aberrant cytosine methylation of its promoter (Figure 6). Transcriptional repression of MASPIN, a tumor-suppressor gene involved in angiogenesis, and desmocollin 3 (DSC3), an inhibitor of cell motility, by aberrant DNA methylation has been reported (10, 24). In these cases, the wt TP53 gene binds to its consensus DNA-binding sites within the promoter, prevents aberrant de novo cytosine methylation therefore protecting the potential for gene activation. However, when the TP53 gene is mutated, its DNA-binding activity is lost and the TP53 target regions are vulnerable to methylation; thus the ability to activate transcription is repressed (10). Hypermethylation of the THBS1 promoter in tumor specimens has been associated with worse clinical outcome in patients with neuroblastomas (25) and penile cancers (26) and an aggressive phenotype in those with gastric cancers (27). In melanoma cell lines, exposure to a demethylating agent reversed THBS1 promoter hypermethylation, increased THBS1 expression, and reduced angiogenesis in vivo (28). However, Miyamoto et al. reported that THBS1 methylation was more frequent in gastric cancers with wt TP53 compared to those with mutant TP53 (27). The association between THBS1 promoter methylation and survival in patients with EOC has not yet been explored. However, our findings in ovarian cancer cell lines, which may or may not be representative of the situation in primary tumor tissues, indicate that THBS1 promoter methylation is relatively low and that the regulation of THBS1 is probably not primarily driven by differences in methylation, at least in these cells.
Hu and colleagues recently reported that THBS1 promoter methylation was induced in the setting of oxygen-glucose deprivation (29). Oxygen–glucose deprivation-induced THBS1 promoter methylation was associated with a reduction in THBS1 mRNA and protein expression. According to Wang et al. glucose up-regulates THBS1 gene transcription through antagonism of cGMP-dependent protein kinase repression via upstream stimulatory factor 2 (30). All of our experiments were conducted in glucose-based media that may have interfered with the methylation process. We also found that hypoxia induced THBS1 mRNA expression, which was not expected. Furthermore, hypoxia exposure did not elicit an increase in p53 protein expression, suggesting that the increase in THBS1 expression was not mediated by the TP53 pathway. We hypothesized that hypoxia would lead to reduced THBS1 expression to confer a favorable angiogenic environment. However, others have also reported that hypoxia increases THBS1 expression. Ortiz-Masia and colleagues found that hypoxia exposure resulted in hypoxia-inducible factor-1 (HIF1) dependent up-regulation of THBS1 (31). HIF1 binds to the HRE sequence in the THBS1 promoter. The HIF1 pathway represents another venue of THBS1 regulation. Other mechanisms of THBS1 regulation may include epigenetic modulation via histone modifications, transcriptional repressors and enhancers that augment or inhibit binding and activity or regulation via other tumor-suppressor genes (30, 32, 33).
We also noted a paradoxical relationship between THBS1 relative gene, mRNA, and protein expression. The ovarian cancer cell lines harboring mutant TP53 genes had lower relative THBS1 mRNA levels, but expressed higher THBS1 protein. In contrast, ovarian cancer cell lines with wt TP53 had higher relative THBS1 gene and mRNA levels, but expressed lower THBS1 protein levels. Sundaram and colleagues observed a similar paradoxical relationship in a colorectal cancer cell line (34). While TP53 stimulated THBS1 transcription, there was not an associated increase in THBS1 protein levels. They discovered that TP53 upregulated a microRNA, miR-194, in THBS1 retrovirus-transduced HCT116 cells, leading to decreased THBS1 levels. The removal of the miR-194 complementary site in the THBS1 3′-untranslated region, led to THBS1 reactivation, impaired angiogenesis in Matrigel plugs, and reduced growth of HCT116 xenografts. In contrast, transient overexpression of miR-194 increased angiogenesis in HCT116/THBS1 cells, and increased microvascular densities and vessel sizes in vivo. The findings indicate that miR-194 is involved in the post-transcriptional regulation of THBS1. However, their findings do differ from ours in that they also reported that TP53 stimulated THBS1 transcription did not increase with THBS1 mRNA levels. Further analysis is needed to understand the THBS1 post-transcriptional modifications in ovarian cancer.
Moreover, post-translational modifications may be critical in altering THBS1 protein expression (35). Thrombospondins are large trimeric polypeptides and known targets of proteolysis. The THBS1 and 2 activities are uniquely determined by exposure to the microenvironment. Proteolytic cleavage transforms their structure and alters their activity in a tissue- and pathophysiological-specific manner (35). THBS1 protein can be cleaved by cathepsins, leukocyte elastases, and plasmin. It was beyond the scope of our project to explore post-transcriptional or translational modifications to account for our findings.
Of note, we did not find an association between THBS1 expression in vitro and tumor growth properties or cisplatin/paclitaxel induced growth inhibition. However, THBS1’s angiogenic effect and interaction with cytotoxic agents may not be adequately elucidated using in vitro studies. The in vitro nature of this investigation limits the application of these results and does not account for the role of the tumor microenvironment. Specifically cell lines are cancer cells only and the adjacent stroma that is integral to evaluate mesenchymal remodeling and tumor angiogenesis was not assessed in this model. Other limitations of our study included the use of a simplistic model of ionizing radiation to simulate TP53 induction. To validate our model we irradiated ovarian cancer cell line A2780wtTP53 to 5 Gy and then subjected cell lysates to immunoblot to assess total protein expression. When compared to non-irradiated cells, irradiated cells demonstrated a 3.3-fold increase in p53 expression 48 h after exposure. We acknowledge that ionizing radiation may also induce other genes in addition to TP53 and these unidentified genes may also play a role in angiogenesis. We are continuing to evaluate THBS1 expression and promoter methylation in ovarian cancer specimens that contain cancer cells as well as the surrounding stroma.
In conclusion, THBS1 expression may be regulated via the TP53 pathway and induced by hypoxic tumor microenvironment conditions. Overall low levels of THBS1 promoter methylation imply that methylation is not the primary driver of THBS1 expression in EOC. THBS1 expression does not appear to be associated with tumor growth properties.
Conflict of Interest Statement
The authors declare that the research was conducted in the absence of any commercial or financial relationships that could be construed as a potential conflict of interest.
Acknowledgments
This study was supported by the American Association of Obstetricians and Gynecologists Foundation, and the Berlex Scholar Award in Basic Science.
References
1. Dameron KM, Volpert OV, Tainsky MA, Bouck N. Control of angiogenesis in fibroblasts by p53 regulation of thrombospondin-1. Science (1994) 265(5178):1582–4. doi: 10.1126/science.7521539
2. Grossfeld GD, Ginsberg DA, Stein JP, Bochner BH, Esrig D, Groshen S, et al. Thrombospondin-1 expression in bladder cancer: association with p53 alterations, tumor angiogenesis, and tumor progression. J Natl Cancer Inst (1997) 89:219–27. doi:10.1093/jnci/89.3.219
3. Wong SY, Purdie AT, Han P. Thrombospondin and other possible related matrix proteins in malignant and benign breast disease. An immunohistochemical study. Am J Pathol (1992) 140(6):1473–82.
4. Tuszynski GP, Gasic TB, Rothman VL, Knudsen KA, Gasic GJ. Thrombospondin, a potentiator of tumor cell metastasis. Cancer Res (1987) 47(15):4130–3.
5. Wang TN, Qian X, Granick MS, Solomon MP, Rothman VL, Berger DH, et al. Thrombospondin-1 (TSP-1) promotes the invasive properties of human breast cancer. J Surg Res (1996) 63(1):39–43. doi:10.1006/jsre.1996.0219
6. Taraboletti G, Morbidelli L, Donnini S, Parenti A, Granger HJ, Giavazzi R, et al. The heparin binding 25 kDa fragment of thrombospondin-1 promotes angiogenesis and modulates gelatinase and TIMP-2 production in endothelial cells. FASEB J (2000) 14(12):1674–6. doi:10.1096/fj.99-0931fje
7. Zabrenetzky V, Harris CC, Steeg PS, Roberts DD. Expression of the extracellular matrix molecule thrombospondin inversely correlates with malignant progression in melanoma, lung and breast carcinoma cell lines. Int J Cancer (1994) 59(2):191–5. doi:10.1002/ijc.2910590209
8. Weinstat-Saslow DL, Zabrenetzky VS, VanHoutte K, Frazier WA, Roberts DD, Steeg PS. Transfection of thrombospondin 1 complementary DNA into a human breast carcinoma cell line reduces primary tumor growth, metastatic potential, and angiogenesis. Cancer Res (1994) 54(24):6504–11.
9. Secord AA, Darcy KM, Hutson A, Lee PS, Havrilesky LJ, Grace LA, et al. Co-expression of angiogenic markers and associations with prognosis in advanced epithelial ovarian cancer: a Gynecologic Oncology Group study. Gynecol Oncol (2007) 106(1):221–32. doi:10.1016/j.ygyno.2007.03.021
10. Oshiro MM, Watts GS, Wozniak RJ, Junk DJ, Munoz-Rodriguez JL, Domann FE, et al. Mutant p53 and aberrant cytosine methylation cooperate to silence gene expression. Oncogene (2003) 22(23):3624–34.
11. Ting AH, McGarvey KM, Baylin SB. The cancer epigenome – components and functional correlates. Genes Dev (2006) 20(23):3215–31. doi:10.1101/gad.1464906
12. Network TCGAR. Integrated genomic analyses of ovarian carcinoma. Nature (2011) 474:609–15. doi:10.1038/nature10166
13. Korch C, Spillman MA, Jackson TA, Jacobsen BM, Murphy SK, Lessey BA, et al. DNA profiling analysis of endometrial and ovarian cell lines reveals misidentification, redundancy and contamination. Gynecol Oncol (2012) 127(1):241–8. doi:10.1016/j.ygyno.2012.06.017
14. Havrilesky LJ, Alvarez AA, Whitaker RS, Marks JR, Berchuck A. Loss of expression of the p16 tumor suppressor gene is more frequent in advanced ovarian cancers lacking p53 mutations. Gynecol Oncol (2001) 83(3):491–500. doi:10.1006/gyno.2001.6464
15. Bernardini MQ, Baba T, Lee PS, Barnett JC, Sfakianos GP, Secord AA, et al. Expression signatures of TP53 mutations in serous ovarian cancers. BMC Cancer (2010) 10:237. doi:10.1186/1471-2407-10-237
16. Havrilesky L, Darcy KM, Hamdan H, Priore RL, Leon J, Bell J, et al. Prognostic significance of p53 mutation and p53 overexpression in advanced epithelial ovarian cancer: a Gynecologic Oncology Group Study. J Clin Oncol (2003) 21(20):3814–25. doi:10.1200/JCO.2003.11.052
17. Kondoh E, Mori S, Yamaguchi K, Baba T, Matsumura N, Cory Barnett J, et al. Targeting slow-proliferating ovarian cancer cells. Int J Cancer (2010) 126(10):2448–56. doi:10.1002/ijc.24919
18. Baba T, Mori S, Matsumura N, Kariya M, Murphy SK, Kondoh E, et al. Trophinin is a potent prognostic marker of ovarian cancer involved in platinum sensitivity. Biochem Biophys Res Commun (2007) 360(2):363–9. doi:10.1016/j.bbrc.2007.06.070
19. Matsumura N, Mandai M, Miyanishi M, Fukuhara K, Baba T, Higuchi T, et al. Oncogenic property of acrogranin in human uterine leiomyosarcoma: direct evidence of genetic contribution in in vivo tumorigenesis. Clin Cancer Res (2006) 12(5):1402–11. doi:10.1158/1078-0432.CCR-05-2003
20. Siddik ZH, Mims B, Lozano G, Thai G. Independent pathways of p53 induction by cisplatin and X-rays in a cisplatin-resistant ovarian tumor cell line. Cancer Res (1998) 58(4):698–703.
21. Matsumura N, Huang Z, Mori S, Baba T, Fujii S, Konishi I, et al. Epigenetic suppression of the TGF-beta pathway revealed by transcriptome profiling in ovarian cancer. Genome Res (2011) 21(1):74–82. doi:10.1101/gr.108803.110
22. Schmittgen TD, Livak KJ. Analyzing real-time PCR data by the comparative CT method. Nat Protoc (2008) 3:1101–8. doi:10.1038/nprot.2008.73
23. Huang ZQ, Wen YQ, Shandilya R, Marks JR, Berchuck A, Murphy SK. High throughput detection of M6P/IGF2R intronic hypermethylation and LOH in ovarian cancer. Nucleic Acids Res (2006) 34(2):555–63. doi:10.1093/nar/gkj468
24. Alvarez Secord A, Darcy KM, Hutson A, Huang Z, Lee PS, Jewell EL, et al. The regulation of MASPIN expression in epithelial ovarian cancer: association with p53 status, and MASPIN promoter methylation: a gynecologic oncology group study. Gynecol Oncol (2011) 123(2):314–9. doi:10.1016/j.ygyno.2011.08.003
25. Lau DT, Hesson LB, Norris MD, Marshall GM, Haber M, Ashton LJ. Prognostic significance of promoter DNA methylation in patients with childhood neuroblastoma. Clin Cancer Res (2012) 18(20):5690–700. doi:10.1158/1078-0432.CCR-12-0294
26. Guerrero D, Guarch R, Ojer A, Casas JM, Ropero S, Mancha A, et al. Hypermethylation of the thrombospondin-1 gene is associated with poor prognosis in penile squamous cell carcinoma. BJU Int (2008) 102(6):747–55. doi:10.1111/j.1464-410X.2008.07603.x
27. Miyamoto N, Yamamoto H, Taniguchi H, Miyamoto C, Oki M, Adachi Y, et al. Differential expression of angiogenesis-related genes in human gastric cancers with and those without high-frequency microsatellite instability. Cancer Lett (2007) 254(1):42–53. doi:10.1016/j.canlet.2007.02.004
28. Lindner DJ, Wu Y, Haney R, Jacobs BS, Fruehauf JP, Tuthill R, et al. Thrombospondin-1 expression in melanoma is blocked by methylation and targeted reversal by 5-Aza-deoxycytidine suppresses angiogenesis. Matrix Biol (2012) 32:123–32. doi:10.1016/j.matbio.2012.11.010
29. Hu CJ, Chen SD, Yang DI, Lin TN, Chen CM, Huang TH, et al. Promoter region methylation and reduced expression of thrombospondin-1 after oxygen-glucose deprivation in murine cerebral endothelial cells. J Cereb Blood Flow Metab (2006) 26(12):1519–26. doi:10.1038/sj.jcbfm.9600304
30. Wang S, Skorczewski J, Feng X, Mei L, Murphy-Ullrich JE. Glucose up-regulates thrombospondin 1 gene transcription and transforming growth factor-beta activity through antagonism of cGMP-dependent protein kinase repression via upstream stimulatory factor 2. J Biol Chem (2004) 279(33):34311–22. doi:10.1074/jbc.M401629200
31. Ortiz-Masia D, Diez I, Calatayud S, Hernandez C, Cosin-Roger J, Hinojosa J, et al. Induction of CD36 and thrombospondin-1 in macrophages by hypoxia-inducible factor 1 and its relevance in the inflammatory process. PLoS ONE (2012) 7(10):e48535. doi:10.1371/journal.pone.0048535
32. Framson P, Bornstein P. A serum response element and a binding site for NF-Y mediate the serum response of the human thrombospondin 1 gene. J Biol Chem (1993) 268(7):4989–96.
33. Hsu SC, Volpert OV, Steck PA, Mikkelsen T, Polverini PJ, Rao S, et al. Inhibition of angiogenesis in human glioblastomas by chromosome 10 induction of thrombospondin-1. Cancer Res (1996) 56(24):5684–91.
34. Sundaram P. p53-responsive miR-194 inhibits thrombospondin-1 and promotes angiogenesis in colon cancers. Cancer Res (2011) 71(24):7490–501. doi:10.1158/0008-5472.CAN-11-1124
Keywords: Thrombospondin1, ovarian carcinoma, methylation, TP53, angiogenesis
Citation: Alvarez Secord A, Bernardini MQ, Broadwater G, Grace LA, Huang Z, Baba T, Kondoh E, Sfakianos G, Havrilesky LJ and Murphy SK (2013) TP53 status is associated with thrombospondin1 expression in vitro. Front. Oncol. 3:269. doi: 10.3389/fonc.2013.00269
Received: 14 August 2013; Accepted: 14 October 2013;
Published online: 29 October 2013.
Edited by:
Ivan Garcia-Bassets, University of California San Diego, USAReviewed by:
Miriam Reuschenbach, University Hospital Heidelberg, GermanyTamara Louise Kalir, The Mount Sinai School of Medicine, USA
Copyright: © 2013 Alvarez Secord, Bernardini, Broadwater, Grace, Huang, Baba, Kondoh, Sfakianos, Havrilesky and Murphy. This is an open-access article distributed under the terms of the Creative Commons Attribution License (CC BY). The use, distribution or reproduction in other forums is permitted, provided the original author(s) or licensor are credited and that the original publication in this journal is cited, in accordance with accepted academic practice. No use, distribution or reproduction is permitted which does not comply with these terms.
*Correspondence: Angeles Alvarez Secord, Division of Gynecologic Oncology, Duke University Medical Center, DUMC 3079, Durham, NC 27710, USA e-mail:c2Vjb3IwMDJAbWMuZHVrZS5lZHU=