 Itamar Kanter
 Tomer Kalisky
- Faculty of Engineering, Institute of Nanotechnology, Bar-Ilan University, Ramat Gan, Israel
Traditionally, gene expression measurements were performed on “bulk” samples containing populations of thousands of cells. Recent advances in genomic technology have made it possible to measure gene expression in hundreds of individual cells at a time. As a result, cellular properties that were previously masked in “bulk” measurements can now be observed directly. In this review, we will survey emerging technologies for single cell transcriptomics, and describe how they are used to study complex disease such as cancer, as well as other biological phenomena such as tissue regeneration, embryonic development, and immune response.
Introduction
Since the late 1980s, the invention of PCR (1), the microarray (2, 3), and more recently, next generation RNA sequencing (4) has provided enormous amounts of gene expression data. These technologies, along with the information revolution, have reshaped biology as a quantitative and computationally intensive science, and are expected to pave the way for personalized therapy of cancer, auto-immune disease, and other complex genetic conditions. An early demonstration of the power of high throughput genomics can be seen in the work of Sorlie et al. (5), who used gene expression microarrays and hierarchical clustering to group 85 breast tissues and tumors into subtypes based on their gene expression patterns. Each breast cancer subtype was found to have a distinct “molecular portrait,” prognosis, and recommended treatment. In another work, Whitfield et al. (6) used microarrays to measure gene expression in synchronized HeLa cells over time, and found >850 genes that were periodically expressed during the cell cycle. By hierarchically clustering gene expression patterns, they identified co-expressed groups of genes known to be involved in various cell cycle processes such as DNA replication and chromosome segregation, along with genes of previously uncharacterized function.
To provide sensitive and reliable measurements, microarrays typically require 1–2 μg of total RNA, which corresponds to a “bulk” of ~100,000 cells. This requirement has limited genomic studies to “whole tissue” measurements, providing an expression profile that was “averaged” over all the cells in that tissue. However, multicellular organisms consist of different cell types, each having a different role and a different corresponding transcriptional profile. Furthermore, even cells in more homogeneous systems such as a bacterial colony or a mammalian tissue culture vary according to intrinsic stochastic variation (7–9) and extrinsic variation governed by differences in the cell cycle stage or their local environment (10). Thus, “bulk” measurements often “average out” information that is critical to proper understanding of fundamental biological phenomena and complex disease.
In the last decade, rapid advances in genomics have led to the development of high throughput technologies that allow for hundreds – or even thousands of genes – to be measured simultaneously in hundreds of individual cells. To date, single cell transcriptomic technologies have been used to characterize rare cell populations like circulating tumor cells (11), cancer stem cells in solid tumors (12, 13), and embryonic stem cells (ESCs) in mammalian blastocysts (14). Furthermore, single cell technologies allowed direct measurement of gene expression variability originating from the stochastic nature of gene expression (7, 9, 15, 16) or from other more extrinsic sources such as the cell cycle (17) or the circadian rhythm (18).
In this manuscript, we will briefly review some of the latest developments in single cell transcriptomic analysis and their applications to biology and medicine.
Methods for Single Cell Transcriptomics
We will describe three methods that are widely used for measuring single cell gene expression: mRNA in situ hybridization, single cell quantitative PCR (qPCR), and single cell RNA sequencing (Figure 1).
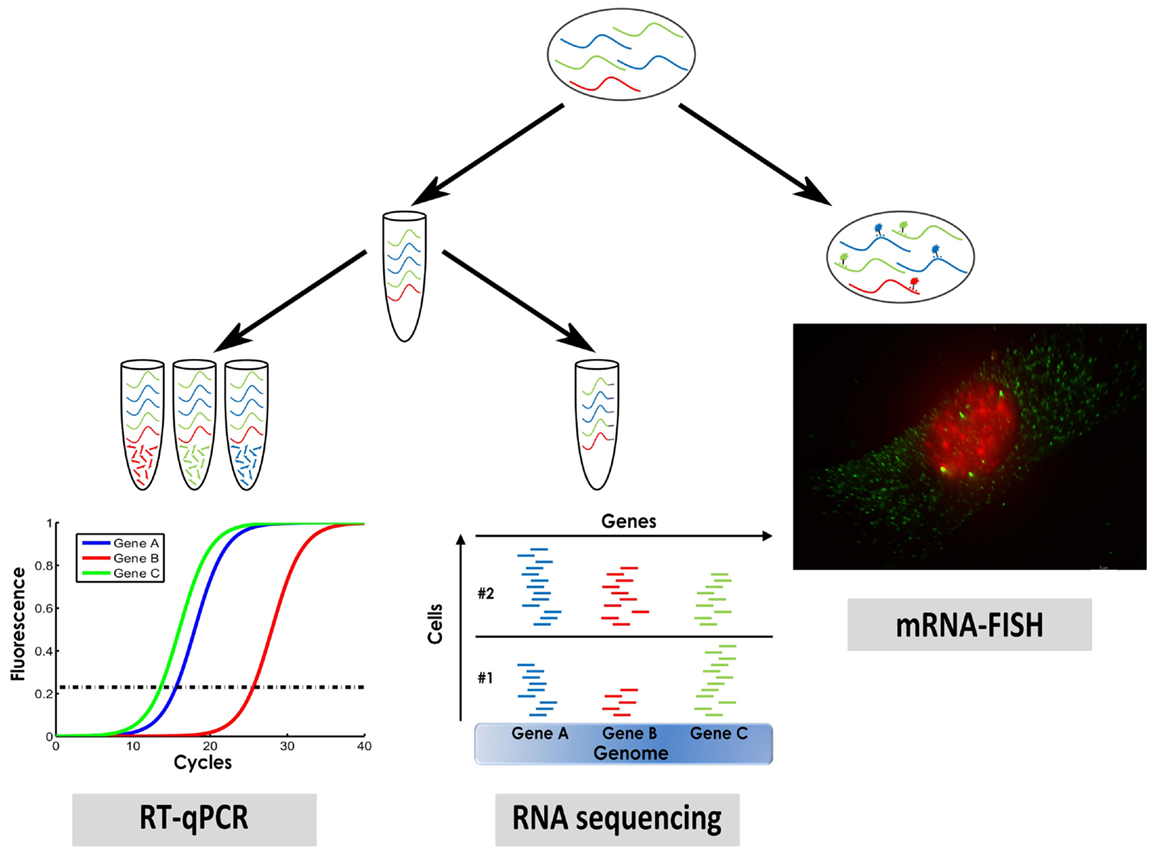
Figure 1. A sketch of three methods for measuring single cell gene expression that were described in this manuscript: mRNA fluorescence in situ hybridization (mRNA–FISH), single cell qPCR, and single cell RNA sequencing.
Single Molecule mRNA Fluorescence In situ Hybridization Allows to Count Single Transcripts in Individual Cells within an Intact Tissue
Single molecule mRNA–FISH is a technology for fluorescently labeling and counting mRNA molecules in fixed cells or tissues. In the first step, probes are designed to target specific mRNA molecules. The probes are oligonucleotides that are covalently bound to fluorochromes and whose sequence complements the sequence of the target mRNA transcript. When the probes are mixed with a chemically fixed cell or tissue sample, they hybridize to the target mRNA molecules inside it. By proper image analysis, individual mRNA molecules can be visualized as fluorescent spots under a microscope and the number of transcripts can be automatically determined by counting (19). Multiple sets of spectrally separated fluorochromes can be combined in order to count two to three mRNA species (i.e., genes) simultaneously (20). The main limitation of mRNA–FISH is the relatively small number of genes than can be simultaneously measured. However, super-resolution microscopy can used to increase the detection capacity to 32 genes simultaneously (21), or even more by sequential rounds of hybridization and washing (22). Since mRNA–FISH is based on imaging, it also provides spatial information regarding the sub-cellular localization and distribution of the transcripts (23). For example, transcription sites can be identified as enlarged spots and the number of nascent mRNA molecules can be estimated (24). Furthermore, when implementing mRNA–FISH on tissues, it is possible to obtain single cell gene expression along with the original tissue microstructure (25) such as colon crypts (26) and nephrons (27).
Microfluidic Single Cell qPCR is a Sensitive Tool for Measuring the Expression of Multiple Genes in Hundreds of Individual Cells
Quantitative PCR is widely used to measure gene expression. Following cell lysis, RNA purification, and reverse transcription, copies of chosen transcripts – as defined by specific primers – are repeatedly replicated and their quantity is monitored over time by a fluorescent reporter dye. The primers are short oligonucleotides specifically designed to bind the target transcript at the 5′ and 3′ ends, thus enabling the DNA polymerase to initiate reverse transcription and replication. Since qPCR is based on amplification, it highly sensitive and can detect even single molecules (28). Single cell measurements typically require thousands of reactions per experiment (e.g., 100 cells × 100 genes = 10,000 reactions). In order to overcome this limitation, microfluidic single cell qPCR uses PDMS microfluidic chips with matrix-like architecture to combinatorially mix up to 96 individual cells and 96 primer pairs into 9,216 independent qPCR reactions on a single chip (29, 30). Single cell isolation is typically done by flow cytometry or micromanipulation (31). In contrast to “bulk” qPCR, in single cell qPCR no purification steps are possible due to the low amount of starting material (32). Thus, all steps following single cell sorting such as cell lysis, reverse transcription, and target transcript amplification must be performed sequentially in a single tube.
From our experience, the main limitation of single cell qPCR is the need to choose in advance which genes to measure – which limits our ability to discover novel biomarkers without some prior knowledge, and the fact that spatial information of the tissue structure is lost. On the other hand, those ~100 genes that are chosen can be measured in hundreds – or even thousands – of individual cells in a relatively high dynamic range (5–7 orders of magnitude for most genes), provided that the primers are chosen carefully to account for varying reverse transcription efficiencies.
Sequencing all mRNA Molecules in a Single Cell Enables Us to Measure Thousands of Genes Simultaneously and to Discover Novel Biomarkers
The first steps in RNA sequencing are cell capture and lysis, followed by reverse transcription, whole transcriptome amplification, and next generation sequencing. The expression levels of a gene can be inferred from the number of sequencing reads that align to the genome in the location of that gene. A variety of priming methods exist, the majority of which use either random or poly-A primers. Likewise, different amplification schemes are available based on PCR or linear amplification. Recent developments include “barcoding” of individual samples (cells) with unique sequences in the priming step, which allows the barcoded cDNA to be pooled, amplified, and sequenced in a single sequencer run. Later, each read is in silico attributed to its original cell according to its barcode (33–37). Similar barcoding can be done on single transcripts allowing for direct counting of molecules (38–40).
A major challenge in the field of single cell genomics is to develop sensitive, precise, and reliable technologies for sequencing the whole transcriptome from hundreds – or even thousands – of individual cells. At present, RNA sequencing is still too expensive and work-intensive for high throughput single cell measurements. Furthermore, the amplification step introduces large measurement noise and uncharacterized bias, especially in low abundance transcripts (41). Two remarkable technologies are emerging for automated isolation, lysis, and whole transcriptome amplification from individual cells at high capacity. The first approach uses automated microfluidic chips (42, 43) with nano-liter chambers for 96 individual cells. The use of nano-liter volumes has been shown to result in more accurate measurements and decreased amplification bias when compared to tube-based preparations of single cells. The second approach uses droplet microfluidics (44) for ultra-fast (~1 kHz) isolation of single cells in separate sub pico-liter drops immersed in oil. Each drop is then further processed automatically through the next steps that include cell lysis, whole transcriptome amplification, and barcoding. The emulsion can then be broken, sequenced, and individual cells can later be de-multiplexed computationally according to their barcode.
Applications of Single Cell Transcriptomics
Characterization of the Cell Sub-Population Repertoire of Tissues and Tumors is Essential for Understanding How Tissues Regenerate and for Designing New Targeted Therapies for Cancer
Many tissues in the human body such as the skin, the inner lining of the intestine, and the blood and immune systems are constantly regenerating. These tissues are dynamic systems composed of different cell types including stem cells, progenitors, and differentiated cells of various phenotypes. The stem cells are long lived cells that maintain the regenerative potential of the tissue. Some of their progeny become progenitors, cells that rapidly divide and proliferate. These in turn differentiate into cells with more and more specialized functions. Turnover times range from 4 to 5 days in the intestinal epithelium (45) to a few months in the blood (46). Abnormalities in this process presumably result in tumors. For example, it was found that many tumors have a small sub-population of “cancer stem cells,” i.e., cells with tumorigenic potential that can regenerate a new tumor when transplanted into an immune-deficient mouse (12, 47, 48).
Since the stem cell population is a small minority (<1%), single cell analysis is required in order to identify, isolate, and molecularly characterize them. Transcriptional profiling of the various cell types in tissues and their corresponding tumors will allow for better understanding of the process of tissue regeneration and tumor formation. Furthermore, molecular characterization of the stem cell population will enable design of more efficient anti-cancer drugs that will specifically target the stem cells of the tumor while leaving all other cells viable.
Example: Regeneration in the Intestinal Epithelial Crypt
The epithelial lining of the mammalian small intestine and colon is organized into glands called the crypts of Lieberkühn. Each crypt is a regenerating unit in which the stem cells reside at the bottom, and their progeny migrate upwards as they proliferate and differentiate (see Figure 2). In the colon, there are two main cell lineages: enterocytes, which reabsorb fluids and electrolytes, and goblet cells, which secrete protective mucus and other growth factors (45). Although studied for decades, the gene circuits that govern the regeneration of the intestinal crypt, as well as the distortions that lead to colon cancer, are not well understood.
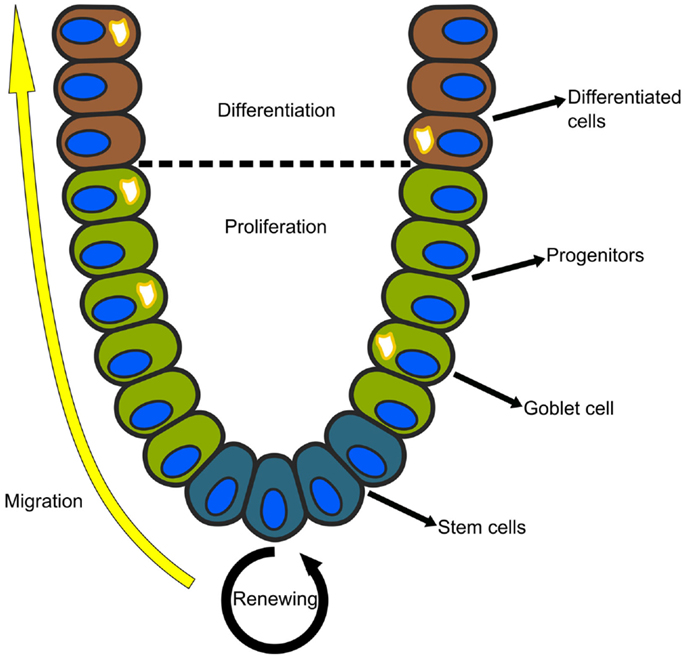
Figure 2. Each crypt in the mammalian small intestine or colon is an independently regenerating unit. The stem cells reside at the bottom and their progeny migrate upwards as they proliferate and differentiate. In the colon, there are two main cell lineages: absorptive enterocytes and secretory goblet cells.
In order to better characterize the repertoire of cell sub-populations in intestinal tissues and tumors, we used a combination of flow cytometry and microfluidic single cell qPCR to molecularly profile the cellular composition of primary human colon cancer epithelia (13), and showed that human colon cancer tissues contain distinct cell populations whose transcriptional identities mirror those of the different cellular lineages of normal colon. We also showed that single cells from human xenografts implanted in immune-deficient mice can regenerate a similar but distorted cell population repertoire of the parent tumor. In another work (49), we applied similar methods to the mouse colon epithelium and found a previously unknown sub-population of goblet cells that were interdigitated with the Lgr5(+) stem cells and which secrete growth factors that maintain stem cell homeostasis, similar to Paneth cells in the small intestine.
Although single cell qPCR can measure up to 96 genes simultaneously, it is limited by the fact that all information regarding tissue microstructure is lost. To overcome this, mRNA–FISH can be used to study spatio-temporal processes in tissue regeneration. Itzkovitz et al. (26) applied three color single molecule mRNA–FISH to follow the expression level of a set of putative stem cell markers in the intestinal crypt. They revealed that all the markers overlapped in the bottom of the crypt and co-expressed with Lgr5(+) cells. These results support the hypothesis of the existence of only one stem cell population residing at the crypt base. In a later study (50), the authors used a combination of lineage tracing and single molecule mRNA–FISH to study the design principles of crypt formation in the small intestine of infant mice, and found that in the first stages of development, there is a surge of symmetric stem cell divisions, which are later followed by a transition to asymmetric stem cell divisions as the crypts continued to grow.
A Detailed Picture of the Early Stages of Embryonic Development Emerges from Transcriptional Characterization at the Single Cell Level
Embryogenesis involves complex growth and differentiation events by which new tissues and organs are formed. Subtle but essential differences in gene expression between seemingly homogeneous cells at early stages can have a dramatic long-term effect on their fate and that of the organism as a whole. Often, sharp boundaries are formed by direct interaction between adjacent cells (51). In order to understand the regulatory changes that govern this process, and in particular, the failsafe mechanisms that ensure normal embryogenesis under varying and “noisy” conditions (52), transcriptional profiling of individual cells is required, rather than whole embryos or whole tissues (53).
In early human embryogenesis following fertilization, the single cell zygote undergoes early cleavage divisions to form the morula – an apparently non-differentiated mass of 8–16 cells (see Figure 3). The morula then differentiates into two cells types: the outer layer, also called the trophoblast or trophectoderm (TE), which is responsible for implantation of the embryo into the wall of the maternal uterus and which will later develop into the placenta, and the inner cell mass (ICM), from which ESCs are derived. The resulting structure is called the blastocyst and consists of 32–64 cells. The ICM then further differentiates into two additional layers: the primitive endoderm (PE), which provides developmental cues to the embryo, and the epiblast (EPI), which will become the embryo itself (54).
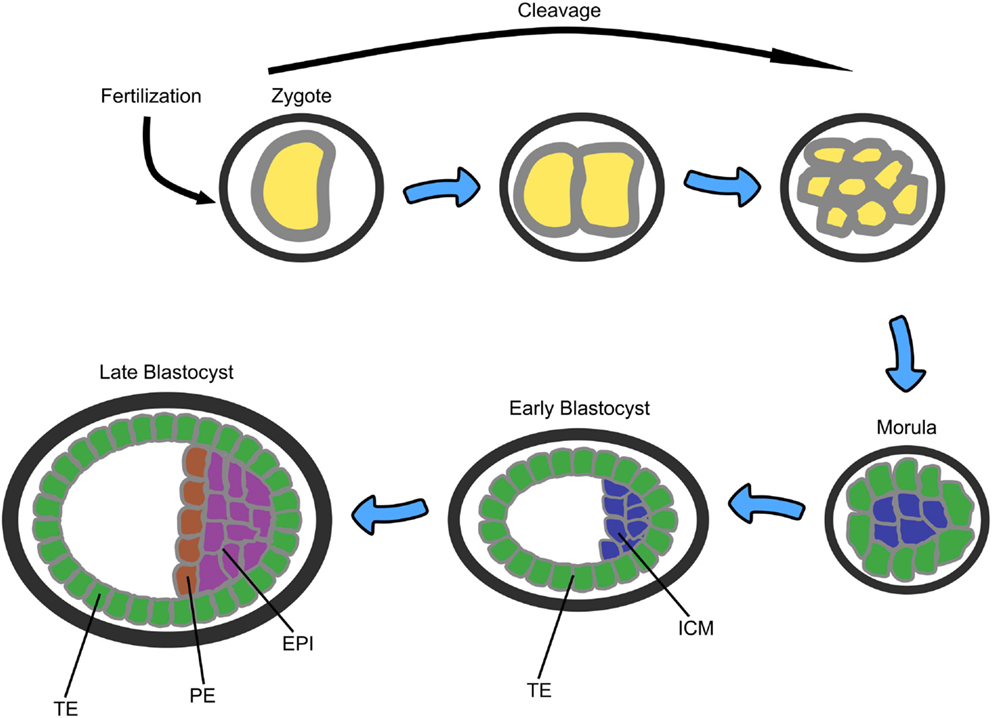
Figure 3. A sketch of the early stages of mammalian embryonic development starting from zygote, through morula (8–16 cells), to blastocyst (32–64 cells). TE, trophectoderm; ICM, inner cell mass; PE, primitive endoderm; EPI, epiblast (53).
In order characterize the transcriptional changes during this process, Kurimoto et al. (55) used single cell qPCR and whole transcriptome amplification followed by microarray analysis to measure single cell gene expression in a mouse blastocyst. They isolated ~20 single cells from the ICM, a population of undifferentiated pluripotent cells that give rise to all embryonic lineages and which is also the source of ESCs, and found that even in rather early stages of the blastocyst (E3.5, ~32 cells), where the cells are morphologically homogeneous, two populations of cells could be discerned: one with PE-like gene expression and the other with pluripotent EPI-like gene expression. The genes that were differentially expressed between these two populations were found to be preserved in the morphologically differentiated PE and EPI in the embryos 1 day later (E4.5).
Guo et al. (14, 53) used microfluidic single cell qPCR to measure the expression level of 48 genes in parallel from >500 individual cells from different stages of mouse pre-implantation development, from the 1-celled zygote through to the 64-celled blastocyst. They found that even at the 16-cell stage morula, the inversely correlated genes Id2 and Sox2 could discern between the inner part of the morula (Id2low/Sox2high), which further develops into the ICM, and the outer part that develops into the TE and that could be specifically stained by a cell-membrane labeling fluorescent dye prior to embryo dissociation. They also observed expression heterogeneity within the early ICM of the 32-cell blastocyst, for example, in the anti-correlated ligand–receptor pair Fgf4 and Frfr2. Later on at the 64-cell ICM, Fgf4 becomes restricted to the EPI and Fgfr2 to the PE.
Tang et al. (56) studied the process by which cells from the ICM, cultured in vitro, transform into ESCs and obtain infinite capacity for self-renewal and pluripotency. By performing single cell qPCR and single cell RNA sequencing at different time points, they were able to identify clusters of genes and microRNA’s whose expression increased or decreased during this process, as well as genes that gradually lost cell–cell heterogeneity (e.g., c-Myc) and genes whose splicing was modified. Xue et al. (57) used single cell RNA sequencing and weighted gene co-expression network analysis (WGCNA) to study cross correlations between genes during development from oocyte to morula in mammals. They were able to identify 25 distinct modules of co-expressed genes, each with a defined function. Nine of these modules were found to be stage specific, indicating that transcriptional changes occur in step-wise fashion throughout development. Furthermore, they found that these modules were similar in human and mouse, but diverged in their time of activation.
Similar works were done in other organisms. Recently, Hashimshony et al. (37) used single cell RNA sequencing to characterize lineage specific gene expression in the very first stages of development of a C. elegans embryo. By learning to identify differential gene expression among sister cells (blastomeres) during cleavage, they produced a classifier based on a small set of key informative genes that could distinguish between closely related sister cells. Later stages of development in specific tissues were also studied at the single cell level. For example, Treutlein et al. (58) used microfluidic single cell mRNA sequencing to follow the development of lung alveolar epithelial cells in a mouse embryo. Using unsupervised clustering, they were able to identify and characterize five epithelial cell types, four of which were associated with previously reported cell types. Based on the expression of specific marker genes, they reconstructed the differentiation pathway of progenitor cells into separate alveolar cell lineages.
Single Cell Measurements Can Reveal New Dimensions of Heterogeneity as Well as Transcriptome-Wide Relations between Genes
According to the central dogma of molecular biology, formulated by Francis Crick in 1970s (59), the transcription of genes from DNA to RNA is the first stage of information flow in the cell. However, it was recently realized that transcription is an inherently “noisy” process (15). Due to the relatively small number of molecules involved (DNA, RNA polymerase, etc.), even genetically identical cells will have different expression levels of the same gene (60). This “randomness” has an essential role in key cellular activities (61) as well as implications on gene expression measurements, whereby single cell measurements yield a more detailed and deeper understanding of many intra-cellular processes that were masked or “averaged out” by traditional “bulk” techniques. For instance, new cell states and cell types in tissues can be resolved by identifying groups of individual cells having distinct expression profiles (62). Furthermore, due to the inherent variability between cells, every cell for which we measure the expression of multiple genes is essentially a different “experiment” that reveals new information about the relations between different genes (63, 64). Thus, measuring the expression of multiple genes simultaneously in hundreds of individual cells can be used to identify pairwise correlations between them and to reconstruct transcription regulation networks (65). Comparison between these networks in normal and disease states can provide deeper mechanistic insight to the underlying effects of disease (66).
Gandhi et al. (67) explored the degree of gene expression coordination between genes in individual cells of Saccharomyces cerevisiae. They used multicolor FISH labels to measure expression levels of related and unrelated pairs of genes and found very high coordination between functionally related genes that were temporally induced by the sugar galactose (GAL). In contrast, other more constitutive genes – even those that were functionally related or that had identical promoters – were found to have low correlation to each other, most likely due to stochastic fluctuations independently affecting individual genes.
Shalek et al. (68) used single cell RNA sequencing and mRNA–FISH to provide a more accurate and detailed description to the response of a seemingly homogeneous population of cells to external stimuli. They examined the response of mouse bone-marrow-derived dendritic cells (BMDCs) to lipopolysaccharide (LPS), a toxin found in the outer membrane of Gram-negative bacteria that elicits a strong immune response, and found that 185 of the 241 most variable genes had bimodal expression patterns. They also found that many key genes involved in the immune response that are highly expressed at the population level actually exhibit a bimodal expression pattern at the single cell level. In addition, they found cell to cell heterogeneity in splicing patterns, whereby genes that had multiple splicing isoforms at the population level exhibited predominantly only one pattern in any specific individual cell.
Another dimension of heterogeneity was revealed by Hansen et al. (69), who studied allele-specific gene expression in single cells by using mRNA–FISH probes that were designed to distinguish between different alleles (paternal vs. maternal) of the same gene according to their single-nucleotide variants (SNVs). Using this method, allelic expression imbalance of the genes Nanog and Chd4 was measured in a mouse ESC line. For example, they found that although under certain conditions (such as changing the growth medium to 2i medium – a medium with minimal requirements for self-renewal) the total number of expressed transcripts increased, the proportion of cells exhibiting mono-allelic expression remained the same. A more transcriptome-wide approach was taken by Deng et al. (70), who used single cell RNA sequencing to measure allele-specific expression in mouse pre-implantation embryos of mixed background. They showed that a large fraction (~25%) of all autosomal genes was expressed in mono-allelic fashion, which appeared to be stochastic and independent.
The effect of variations in the DNA on gene expression was further investigated by Weinstein et al. (71), who devised a method combining single cell qPCR and Sanger sequencing for simultaneously measuring gene expression profiles in hundreds of individual B-cells as well as the mutations in genes coding for their antibody heavy and light-chains. By measuring both expression and mutations in B-cells of mice following immunization, they were able to probe the relation between B-cell activation, proliferation, and differentiation and antibody mutation during “affinity maturation” – the process by which B-cells are stimulated to divide and hyper-mutate in order to increase their affinity for a specific antigen. A different aspect of the relation between the genome and transcriptome was investigated by Wills et al. (72), who used microfluidic single cell qPCR to associate single-nucleotide polymorphisms (SNPs) with gene expression phenotypes. By measuring the expression levels of specific genes from the Wnt pathway along with their associated SNPs in hundreds of single cells derived from 15 individuals, they were able to show that SNP’s have considerable effect on the expression level statistics of each individual. This feature can only be observed at the single cell level, and is “masked out” in bulk experiments where many cells are averaged.
Measuring the Spatial Distribution of mRNA Molecules within a Cell Uncovers Fundamental Mechanisms Involved in Cell Motility and Development
Sub-cellular localization of mRNA provides a mechanism to spatially control gene expression and protein distribution within the cell. Differential localization was observed in mRNA transcripts encoding cytoskeletal proteins (73) and embryonic morphogens (74). In a more recent study, Lécuyer et al. used mRNA–FISH to perform comprehensive analysis of mRNA localization in early Drosophila embryos (75). Their observations showed that a high fraction of genes – 71% out of 3,370 genes analyzed – were expressed in spatially distinct patterns. Furthermore, they found a strong correlation between mRNA distribution and subsequent protein localization and function. Taken together, transcript abundance measurements along with spatial information and patterning over many cells will provide a richer description of transcript properties as well as better understanding of the functional interactions between genes (23).
Outlook
Single cell transcriptomic technologies are still developing and we believe that they have not yet reached their full potential. One intriguing development is the ability to perform transcriptomic measurements while preserving the tissue context and sub-cellular localizations, for example, by cryo-sectioning tissues into thin slices and sequencing the whole transcriptome in each slice independently (76, 77), or even by sequencing every single transcript in primary tissue under a microscope while maintaining spatial information as to the location of each transcript within each individual cell (78). Another challenge is to increase the number of single cells that can be analyzed: many thousands of cells are required to gain thorough understanding of complex biological processes such as cancer or the development of an embryo (62, 79). Similar capabilities have recently been developed to quantify proteins by combining mass spectrometry and flow cytometry (80). In the next few years, we expect all these novel technologies to provide a new wealth of data. Parallel progress will be required to develop computational tools to visualize and analyze this data and deduce testable hypotheses (81–85).
Conflict of Interest Statement
Tomer Kalisky is co-inventor of a patent application licensed by Stanford University to Quanticel Pharmaceuticals Inc. and was awarded shares in Quanticel Pharmaceuticals Inc. as a result of this licensing agreement. Itamar Kanter declares that the research was conducted in the absence of any commercial or financial relationships that could be construed as a potential conflict of interest.
Acknowledgments
We thank the Israel Science Foundation (ICORE no. 1902/12 and Grants no. 1634/13 and 2017/13) and the Israel Cancer Association (Grant no. 20140071) for generous support. We wish to thank Irena Bronshtein for the mRNA–FISH micrograph, and all members of our lab for useful comments and suggestions.
References
1. Saiki RK, Scharf S, Faloona F, Mullis KB, Horn GT, Erlich HA, et al. Enzymatic amplification of beta-globin genomic sequences and restriction site analysis for diagnosis of sickle cell anemia. Science (1985) 230:1350–4. doi: 10.1126/science.2999980
2. Schena M, Shalon D, Davis RW, Brown PO. Quantitative monitoring of gene expression patterns with a complementary DNA microarray. Science (1995) 270:467–70. doi:10.1126/science.270.5235.467
Pubmed Abstract | Pubmed Full Text | CrossRef Full Text | Google Scholar
3. Schena M, Shalon D, Heller R, Chai A, Brown PO, Davis RW. Parallel human genome analysis: microarray-based expression monitoring of 1000 genes. Proc Natl Acad Sci U S A (1996) 93:10614–9. doi:10.1073/pnas.93.20.10614
Pubmed Abstract | Pubmed Full Text | CrossRef Full Text | Google Scholar
4. Brenner S, Johnson M, Bridgham J, Golda G, Lloyd DH, Johnson D, et al. Gene expression analysis by massively parallel signature sequencing (MPSS) on microbead arrays. Nat Biotechnol (2000) 18:630–4. doi:10.1038/76469
Pubmed Abstract | Pubmed Full Text | CrossRef Full Text | Google Scholar
5. Sørlie T, Perou CM, Tibshirani R, Aas T, Geisler S, Johnsen H, et al. Gene expression patterns of breast carcinomas distinguish tumor subclasses with clinical implications. Proc Natl Acad Sci U S A (2001) 98:10869–74. doi:10.1073/pnas.191367098
Pubmed Abstract | Pubmed Full Text | CrossRef Full Text | Google Scholar
6. Whitfield ML, Sherlock G, Saldanha AJ, Murray JI, Ball CA, Alexander KE, et al. Identification of genes periodically expressed in the human cell cycle and their expression in tumors. Mol Biol Cell (2002) 13:1977–2000. doi:10.1091/mbc.02-02-0030
7. Elowitz MB, Levine AJ, Siggia ED, Swain PS. Stochastic gene expression in a single cell. Science (2002) 297:1183–6. doi:10.1126/science.1070919
8. Golding I, Paulsson J, Zawilski SM, Cox EC. Real-time kinetics of gene activity in individual bacteria. Cell (2005) 123:1025–36. doi:10.1016/j.cell.2005.09.031
Pubmed Abstract | Pubmed Full Text | CrossRef Full Text | Google Scholar
9. Raj A, Peskin CS, Tranchina D, Vargas DY, Tyagi S. Stochastic mRNA synthesis in mammalian cells. PLoS Biol (2006) 4:e309. doi:10.1371/journal.pbio.0040309
Pubmed Abstract | Pubmed Full Text | CrossRef Full Text | Google Scholar
10. Swain PS, Elowitz MB, Siggia ED. Intrinsic and extrinsic contributions to stochasticity in gene expression. Proc Natl Acad Sci U S A (2002) 99:12795–800. doi:10.1073/pnas.162041399
Pubmed Abstract | Pubmed Full Text | CrossRef Full Text | Google Scholar
11. Ramsköld D, Luo S, Wang Y-C, Li R, Deng Q, Faridani OR, et al. Full-length mRNA-Seq from single-cell levels of RNA and individual circulating tumor cells. Nat Biotechnol (2012) 30:777–82. doi:10.1038/nbt.2282
Pubmed Abstract | Pubmed Full Text | CrossRef Full Text | Google Scholar
12. Dalerba P, Dylla SJ, Park I-K, Liu R, Wang X, Cho RW, et al. Phenotypic characterization of human colorectal cancer stem cells. Proc Natl Acad Sci U S A (2007) 104:10158–63. doi:10.1073/pnas.0703478104
Pubmed Abstract | Pubmed Full Text | CrossRef Full Text | Google Scholar
13. Dalerba P, Kalisky T, Sahoo D, Rajendran PS, Rothenberg ME, Leyrat AA, et al. Single-cell dissection of transcriptional heterogeneity in human colon tumors. Nat Biotechnol (2011) 29:1120–7. doi:10.1038/nbt.2038
Pubmed Abstract | Pubmed Full Text | CrossRef Full Text | Google Scholar
14. Guo G, Huss M, Tong GQ, Wang C, Li Sun L, Clarke ND, et al. Resolution of cell fate decisions revealed by single-cell gene expression analysis from zygote to blastocyst. Dev Cell (2010) 18:675–85. doi:10.1016/j.devcel.2010.02.012
Pubmed Abstract | Pubmed Full Text | CrossRef Full Text | Google Scholar
15. Raj A, van Oudenaarden A. Nature, nurture, or chance: stochastic gene expression and its consequences. Cell (2008) 135:216–26. doi:10.1016/j.cell.2008.09.050
Pubmed Abstract | Pubmed Full Text | CrossRef Full Text | Google Scholar
16. Blake WJ, KAErn M, Cantor CR, Collins JJ. Noise in eukaryotic gene expression. Nature (2003) 422:633–7. doi:10.1038/nature01546
17. Chabot JR, Pedraza JM, Luitel P, van Oudenaarden A. Stochastic gene expression out-of-steady-state in the cyanobacterial circadian clock. Nature (2007) 450:1249–52. doi:10.1038/nature06395
Pubmed Abstract | Pubmed Full Text | CrossRef Full Text | Google Scholar
18. Zopf CJ, Quinn K, Zeidman J, Maheshri N. Cell-cycle dependence of transcription dominates noise in gene expression. PLoS Comput Biol (2013) 9:e1003161. doi:10.1371/journal.pcbi.1003161
Pubmed Abstract | Pubmed Full Text | CrossRef Full Text | Google Scholar
19. Femino AM, Fay FS, Fogarty K, Singer RH. Visualization of single RNA transcripts in situ. Science (1998) 280:585–90. doi:10.1126/science.280.5363.585
Pubmed Abstract | Pubmed Full Text | CrossRef Full Text | Google Scholar
20. Raj A, Bogaard P, Van Den B, Rifkin SA, van Oudenaarden A, Tyagi S. Imaging individual mRNA molecules using multiple singly labeled probes. Nat Methods (2008) 5:877–9. doi:10.1038/nmeth.1253
Pubmed Abstract | Pubmed Full Text | CrossRef Full Text | Google Scholar
21. Lubeck E, Cai L. Single-cell systems biology by super-resolution imaging and combinatorial labeling. Nat Methods (2012) 9:743–8. doi:10.1038/nmeth.2069
Pubmed Abstract | Pubmed Full Text | CrossRef Full Text | Google Scholar
22. Lubeck E, Coskun AF, Zhiyentayev T, Ahmad M, Cai L. Single-cell in situ RNA profiling by sequential hybridization. Nat Methods (2014) 11:360–1. doi:10.1038/nmeth.2892
23. Battich N, Stoeger T, Pelkmans L. Image-based transcriptomics in thousands of single human cells at single-molecule resolution. Nat Methods (2013) 10:1127–33. doi:10.1038/nmeth.2657
Pubmed Abstract | Pubmed Full Text | CrossRef Full Text | Google Scholar
24. Mueller F, Senecal A, Tantale K, Marie-Nelly H, Ly N, Collin O, et al. FISH-quant: automatic counting of transcripts in 3D FISH images. Nat Methods (2013) 10:277–8. doi:10.1038/nmeth.2406
25. Lyubimova A, Itzkovitz S, Junker JP, Fan ZP, Wu X, van Oudenaarden A. Single-molecule mRNA detection and counting in mammalian tissue. Nat Protoc (2013) 8:1743–58. doi:10.1038/nprot.2013.109
Pubmed Abstract | Pubmed Full Text | CrossRef Full Text | Google Scholar
26. Itzkovitz S, Lyubimova A, Blat IC, Maynard M, van Es J, Lees J, et al. Single-molecule transcript counting of stem-cell markers in the mouse intestine. Nat Cell Biol (2012) 14:106–14. doi:10.1038/ncb2384
Pubmed Abstract | Pubmed Full Text | CrossRef Full Text | Google Scholar
27. Barker N, Rookmaaker MB, Kujala P, Ng A, Leushacke M, Snippert H, et al. Lgr5(+ve) stem/progenitor cells contribute to nephron formation during kidney development. Cell Rep (2012) 2:540–52. doi:10.1016/j.celrep.2012.08.018
Pubmed Abstract | Pubmed Full Text | CrossRef Full Text | Google Scholar
28. Warren L, Bryder D, Weissman IL, Quake SR. Transcription factor profiling in individual hematopoietic progenitors by digital RT-PCR. Proc Natl Acad Sci U S A (2006) 103:17807–12. doi:10.1073/pnas.0608512103
Pubmed Abstract | Pubmed Full Text | CrossRef Full Text | Google Scholar
29. Zhong JF, Chen Y, Marcus JS, Scherer A, Quake SR, Taylor CR, et al. A microfluidic processor for gene expression profiling of single human embryonic stem cells. Lab Chip (2008) 8:68–74. doi:10.1039/b712116d
Pubmed Abstract | Pubmed Full Text | CrossRef Full Text | Google Scholar
30. White AK, VanInsberghe M, Petriv OI, Hamidi M, Sikorski D, Marra MA, et al. High-throughput microfluidic single-cell RT-qPCR. Proc Natl Acad Sci U S A (2011) 108:13999–4004. doi:10.1073/pnas.1019446108
Pubmed Abstract | Pubmed Full Text | CrossRef Full Text | Google Scholar
31. Bonner RF. Cell sampling: laser capture microdissection: molecular analysis of tissue. Science (1997) 278:1481–3. doi:10.1126/science.278.5342.1481
32. Ståhlberg A, Kubista M, Aman P. Single-cell gene-expression profiling and its potential diagnostic applications. Expert Rev Mol Diagn (2011) 11:735–40. doi:10.1586/erm.11.60
Pubmed Abstract | Pubmed Full Text | CrossRef Full Text | Google Scholar
33. Brennecke P, Anders S, Kim JK, Kołodziejczyk AA, Zhang X, Proserpio V, et al. Accounting for technical noise in single-cell RNA-seq experiments. Nat Methods (2013) 10:1093–5. doi:10.1038/nmeth.2645
Pubmed Abstract | Pubmed Full Text | CrossRef Full Text | Google Scholar
34. Tang F, Barbacioru C, Nordman E, Li B, Xu N, Bashkirov VI, et al. RNA-Seq analysis to capture the transcriptome landscape of a single cell. Nat Protoc (2010) 5:516–35. doi:10.1038/nprot.2009.236
Pubmed Abstract | Pubmed Full Text | CrossRef Full Text | Google Scholar
35. Picelli S, Björklund ÅK, Faridani OR, Sagasser S, Winberg G, Sandberg R. Smart-seq2 for sensitive full-length transcriptome profiling in single cells. Nat Methods (2013) 10:1096–8. doi:10.1038/nmeth.2639
Pubmed Abstract | Pubmed Full Text | CrossRef Full Text | Google Scholar
36. Islam S, Kjällquist U, Moliner A, Zajac P, Fan J-B, Lönnerberg P, et al. Characterization of the single-cell transcriptional landscape by highly multiplex RNA-seq. Genome Res (2011) 21:1160–7. doi:10.1101/gr.110882.110
Pubmed Abstract | Pubmed Full Text | CrossRef Full Text | Google Scholar
37. Hashimshony T, Wagner F, Sher N, Yanai I. CEL-Seq: single-cell RNA-seq by multiplexed linear amplification. Cell Rep (2012) 2:666–73. doi:10.1016/j.celrep.2012.08.003
Pubmed Abstract | Pubmed Full Text | CrossRef Full Text | Google Scholar
38. Fu GK, Hu J, Wang P-H, Fodor SPA. Counting individual DNA molecules by the stochastic attachment of diverse labels. Proc Natl Acad Sci U S A (2011) 108:9026–31. doi:10.1073/pnas.1017621108
Pubmed Abstract | Pubmed Full Text | CrossRef Full Text | Google Scholar
39. Shiroguchi K, Jia TZ, Sims PA, Xie XS. Digital RNA sequencing minimizes sequence-dependent bias and amplification noise with optimized single-molecule barcodes. Proc Natl Acad Sci U S A (2012) 109:1347–52. doi:10.1073/pnas.1118018109
Pubmed Abstract | Pubmed Full Text | CrossRef Full Text | Google Scholar
40. Fan HC, Fu GK, Fodor SP. Expression profiling. Combinatorial labeling of single cells for gene expression cytometry. Science (2015) 347:1258367–1258367. doi:10.1126/science.1258367
Pubmed Abstract | Pubmed Full Text | CrossRef Full Text | Google Scholar
41. Raj A, van Oudenaarden A. Single-molecule approaches to stochastic gene expression. Annu Rev Biophys (2009) 38:255–70. doi:10.1146/annurev.biophys.37.032807.125928
Pubmed Abstract | Pubmed Full Text | CrossRef Full Text | Google Scholar
42. Wu AR, Neff NF, Kalisky T, Dalerba P, Treutlein B, Rothenberg ME, et al. Quantitative assessment of single-cell RNA-sequencing methods. Nat Methods (2014) 11:41–6. doi:10.1038/nmeth.2694
Pubmed Abstract | Pubmed Full Text | CrossRef Full Text | Google Scholar
43. Streets AM, Zhang X, Cao C, Pang Y, Wu X, Xiong L, et al. Microfluidic single-cell whole-transcriptome sequencing. Proc Natl Acad Sci U S A (2014) 111:7048–53. doi:10.1073/pnas.1402030111
Pubmed Abstract | Pubmed Full Text | CrossRef Full Text | Google Scholar
44. Guo MT, Rotem A, Heyman JA, Weitz DA. Droplet microfluidics for high-throughput biological assays. Lab Chip (2012) 12:2146–55. doi:10.1039/c2lc21147e
Pubmed Abstract | Pubmed Full Text | CrossRef Full Text | Google Scholar
45. Van der Flier LG, Clevers H. Stem cells, self-renewal, and differentiation in the intestinal epithelium. Annu Rev Physiol (2009) 71:241–60. doi:10.1146/annurev.physiol.010908.163145
Pubmed Abstract | Pubmed Full Text | CrossRef Full Text | Google Scholar
46. Shemin D, Rittenberg D. The life span of the human red blood cell. J Biol Chem (1946) 166:627–36.
47. Turner NC, Reis-Filho JS. Genetic heterogeneity and cancer drug resistance. Lancet Oncol (2012) 13:e178–85. doi:10.1016/S1470-2045(11)70335-7
Pubmed Abstract | Pubmed Full Text | CrossRef Full Text | Google Scholar
48. Reya T, Morrison SJ, Clarke MF, Weissman IL. Stem cells, cancer, and cancer stem cells. Nature (2001) 414:105–11. doi:10.1038/35102167
49. Rothenberg ME, Nusse Y, Kalisky T, Lee JJ, Dalerba P, Scheeren F, et al. Identification of a cKit(+) colonic crypt base secretory cell that supports Lgr5(+) stem cells in mice. Gastroenterology (2012) 142:1195.e–205.e. doi:10.1053/j.gastro.2012.02.006
Pubmed Abstract | Pubmed Full Text | CrossRef Full Text | Google Scholar
50. Itzkovitz S, Blat IC, Jacks T, Clevers H, van Oudenaarden A. Optimality in the development of intestinal crypts. Cell (2012) 148:608–19. doi:10.1016/j.cell.2011.12.025
Pubmed Abstract | Pubmed Full Text | CrossRef Full Text | Google Scholar
51. Sprinzak D, Lakhanpal A, Lebon L, Santat LA, Fontes ME, Anderson GA, et al. Cis-interactions between notch and delta generate mutually exclusive signalling states. Nature (2010) 465:86–90. doi:10.1038/nature08959
Pubmed Abstract | Pubmed Full Text | CrossRef Full Text | Google Scholar
52. Eldar A, Dorfman R, Weiss D, Ashe H, Shilo B-Z, Barkai N. Robustness of the BMP morphogen gradient in Drosophila embryonic patterning. Nature (2002) 419:304–8. doi:10.1038/nature01061
Pubmed Abstract | Pubmed Full Text | CrossRef Full Text | Google Scholar
53. Marks H, Veenstra GJC, Stunnenberg HG. Insightful tales from single embryonic cells. Cell Stem Cell (2010) 6:397–8. doi:10.1016/j.stem.2010.04.008
Pubmed Abstract | Pubmed Full Text | CrossRef Full Text | Google Scholar
54. Rossant J, Tam PPL. Blastocyst lineage formation, early embryonic asymmetries and axis patterning in the mouse. Development (2009) 136:701–13. doi:10.1242/dev.017178
Pubmed Abstract | Pubmed Full Text | CrossRef Full Text | Google Scholar
55. Kurimoto K, Yabuta Y, Ohinata Y, Ono Y, Uno KD, Yamada RG, et al. An improved single-cell cDNA amplification method for efficient high-density oligonucleotide microarray analysis. Nucleic Acids Res (2006) 34:e42. doi:10.1093/nar/gkl050
Pubmed Abstract | Pubmed Full Text | CrossRef Full Text | Google Scholar
56. Tang F, Barbacioru C, Bao S, Lee C, Nordman E, Wang X, et al. Tracing the derivation of embryonic stem cells from the inner cell mass by single-cell RNA-Seq analysis. Cell Stem Cell (2010) 6:468–78. doi:10.1016/j.stem.2010.03.015
Pubmed Abstract | Pubmed Full Text | CrossRef Full Text | Google Scholar
57. Xue Z, Huang K, Cai C, Cai L, Jiang C, Feng Y, et al. Genetic programs in human and mouse early embryos revealed by single-cell RNA sequencing. Nature (2013) 500:593–7. doi:10.1038/nature12364
Pubmed Abstract | Pubmed Full Text | CrossRef Full Text | Google Scholar
58. Treutlein B, Brownfield DG, Wu AR, Neff NF, Mantalas GL, Espinoza FH, et al. Reconstructing lineage hierarchies of the distal lung epithelium using single-cell RNA-seq. Nature (2014) 509:371–5. doi:10.1038/nature13173
Pubmed Abstract | Pubmed Full Text | CrossRef Full Text | Google Scholar
60. Li G-W, Xie XS. Central dogma at the single-molecule level in living cells. Nature (2011) 475:308–15. doi:10.1038/nature10315
Pubmed Abstract | Pubmed Full Text | CrossRef Full Text | Google Scholar
61. Eldar A, Elowitz MB. Functional roles for noise in genetic circuits. Nature (2010) 467:167–73. doi:10.1038/nature09326
62. Jaitin DA, Kenigsberg E, Keren-Shaul H, Elefant N, Paul F, Zaretsky I, et al. Massively parallel single-cell RNA-seq for marker-free decomposition of tissues into cell types. Science (2014) 343:776–9. doi:10.1126/science.1247651
Pubmed Abstract | Pubmed Full Text | CrossRef Full Text | Google Scholar
63. Stewart-Ornstein J, Weissman JS, El-Samad H. Cellular noise regulons underlie fluctuations in Saccharomyces cerevisiae. Mol Cell (2012) 45:483–93. doi:10.1016/j.molcel.2011.11.035
Pubmed Abstract | Pubmed Full Text | CrossRef Full Text | Google Scholar
64. Junker JP, van Oudenaarden A. When noisy neighbors are a blessing: analysis of gene expression noise identifies coregulated genes. Mol Cell (2012) 45:437–8. doi:10.1016/j.molcel.2012.02.002
Pubmed Abstract | Pubmed Full Text | CrossRef Full Text | Google Scholar
65. Moignard V, Macaulay IC, Swiers G, Buettner F, Schütte J, Calero-Nieto FJ, et al. Characterization of transcriptional networks in blood stem and progenitor cells using high-throughput single-cell gene expression analysis. Nat Cell Biol (2013) 15:363–72. doi:10.1038/ncb2709
Pubmed Abstract | Pubmed Full Text | CrossRef Full Text | Google Scholar
66. Saadatpour A, Guo G, Orkin SH, Yuan G-C. Characterizing heterogeneity in leukemic cells using single-cell gene expression analysis. Genome Biol (2014) 15:525. doi:10.1186/s13059-014-0525-9
Pubmed Abstract | Pubmed Full Text | CrossRef Full Text | Google Scholar
67. Gandhi SJ, Zenklusen D, Lionnet T, Singer RH. Transcription of functionally related constitutive genes is not coordinated. Nat Struct Mol Biol (2011) 18:27–34. doi:10.1038/nsmb.1934
Pubmed Abstract | Pubmed Full Text | CrossRef Full Text | Google Scholar
68. Shalek AK, Satija R, Adiconis X, Gertner RS, Gaublomme JT, Raychowdhury R, et al. Single-cell transcriptomics reveals bimodality in expression and splicing in immune cells. Nature (2013) 498:236–40. doi:10.1038/nature12172
Pubmed Abstract | Pubmed Full Text | CrossRef Full Text | Google Scholar
69. Hansen CH, van Oudenaarden A. Allele-specific detection of single mRNA molecules in situ. Nat Methods (2013) 10:869–71. doi:10.1038/nmeth.2601
Pubmed Abstract | Pubmed Full Text | CrossRef Full Text | Google Scholar
70. Deng Q, Ramsköld D, Reinius B, Sandberg R. Single-cell RNA-seq reveals dynamic, random monoallelic gene expression in mammalian cells. Science (2014) 343:193–6. doi:10.1126/science.1245316
Pubmed Abstract | Pubmed Full Text | CrossRef Full Text | Google Scholar
71. Weinstein JA, Zeng X, Chien Y-H, Quake SR. Correlation of gene expression and genome mutation in single B-cells. PLoS One (2013) 8:e67624. doi:10.1371/journal.pone.0067624
Pubmed Abstract | Pubmed Full Text | CrossRef Full Text | Google Scholar
72. Wills QF, Livak KJ, Tipping AJ, Enver T, Goldson AJ, Sexton DW, et al. Single-cell gene expression analysis reveals genetic associations masked in whole-tissue experiments. Nat Biotechnol (2013) 31:748–52. doi:10.1038/nbt.2642
Pubmed Abstract | Pubmed Full Text | CrossRef Full Text | Google Scholar
73. Lawrence JB, Singer RH. Intracellular localization of messenger RNAs for cytoskeletal proteins. Cell (1986) 45:407–15. doi:10.1016/0092-8674(86)90326-0
Pubmed Abstract | Pubmed Full Text | CrossRef Full Text | Google Scholar
74. Driever W, Nüsslein-Volhard C. The bicoid protein determines position in the Drosophila embryo in a concentration-dependent manner. Cell (1988) 54:95–104. doi:10.1016/0092-8674(88)90182-1
Pubmed Abstract | Pubmed Full Text | CrossRef Full Text | Google Scholar
75. Lécuyer E, Yoshida H, Parthasarathy N, Alm C, Babak T, Cerovina T, et al. Global analysis of mRNA localization reveals a prominent role in organizing cellular architecture and function. Cell (2007) 131:174–87. doi:10.1016/j.cell.2007.08.003
Pubmed Abstract | Pubmed Full Text | CrossRef Full Text | Google Scholar
76. Crosetto N, Bienko M, van Oudenaarden A. Spatially resolved transcriptomics and beyond. Nat Rev Genet (2015) 16:57–66. doi:10.1038/nrg3832
Pubmed Abstract | Pubmed Full Text | CrossRef Full Text | Google Scholar
77. Junker JP, Noël ES, Guryev V, Peterson KA, Shah G, Huisken J, et al. Genome-wide RNA tomography in the zebrafish embryo. Cell (2014) 159:662–75. doi:10.1016/j.cell.2014.09.038
Pubmed Abstract | Pubmed Full Text | CrossRef Full Text | Google Scholar
78. Lee JH, Daugharthy ER, Scheiman J, Kalhor R, Yang JL, Ferrante TC, et al. Highly multiplexed subcellular RNA sequencing in situ. Science (2014) 343:1360–3. doi:10.1126/science.1250212
Pubmed Abstract | Pubmed Full Text | CrossRef Full Text | Google Scholar
79. Pollen AA, Nowakowski TJ, Shuga J, Wang X, Leyrat AA, Lui JH, et al. Low-coverage single-cell mRNA sequencing reveals cellular heterogeneity and activated signaling pathways in developing cerebral cortex. Nat Biotechnol (2014) 32:1053–8. doi:10.1038/nbt.2967
Pubmed Abstract | Pubmed Full Text | CrossRef Full Text | Google Scholar
80. Bendall SC, Simonds EF, Qiu P, Amir ED, Krutzik PO, Finck R, et al. Single-cell mass cytometry of differential immune and drug responses across a human hematopoietic continuum. Science (2011) 332:687–96. doi:10.1126/science.1198704
Pubmed Abstract | Pubmed Full Text | CrossRef Full Text | Google Scholar
81. Amir ED, Davis KL, Tadmor MD, Simonds EF, Levine JH, Bendall SC, et al. viSNE enables visualization of high dimensional single-cell data and reveals phenotypic heterogeneity of leukemia. Nat Biotechnol (2013) 31:545–52. doi:10.1038/nbt.2594
Pubmed Abstract | Pubmed Full Text | CrossRef Full Text | Google Scholar
82. Feigelman J, Theis FJ, Marr C. MCA: multiresolution correlation analysis, a graphical tool for subpopulation identification in single-cell gene expression data. BMC Bioinformatics (2014) 15:240. doi:10.1186/1471-2105-15-240
Pubmed Abstract | Pubmed Full Text | CrossRef Full Text | Google Scholar
83. Bendall SC, Davis KL, Amir E-AD, Tadmor MD, Simonds EF, Chen TJ, et al. Single-cell trajectory detection uncovers progression and regulatory coordination in human B cell development. Cell (2014) 157:714–25. doi:10.1016/j.cell.2014.04.005
Pubmed Abstract | Pubmed Full Text | CrossRef Full Text | Google Scholar
84. Armond JW, Saha K, Rana AA, Oates CJ, Jaenisch R, Nicodemi M, et al. A stochastic model dissects cell states in biological transition processes. Sci Rep (2014) 4:3692. doi:10.1038/srep03692
Pubmed Abstract | Pubmed Full Text | CrossRef Full Text | Google Scholar
85. Hart Y, Sheftel H, Hausser J, Szekely P, Ben-Moshe NB, Korem Y, et al. Inferring biological tasks using pareto analysis of high-dimensional data. Nat Methods (2015) 12:233–5. doi:10.1038/nmeth.3254
Pubmed Abstract | Pubmed Full Text | CrossRef Full Text | Google Scholar
Keywords: gene expression, single cell, qPCR, RNA sequencing, FISH
Citation: Kanter I and Kalisky T (2015) Single cell transcriptomics: methods and applications. Front. Oncol. 5:53. doi: 10.3389/fonc.2015.00053
Received: 09 December 2014; Accepted: 14 February 2015;
Published online: 10 March 2015.
Edited by:
Saumyadipta Pyne, CRRAO Advanced Institute of Mathematics, Statistics and Computer Science (AIMSCS), IndiaReviewed by:
Daniel Christian Hoessli, International Center for Chemical and Biological Sciences (ICCBS), SwitzerlandJames C. Neil, University of Glasgow, UK
Copyright: © 2015 Kanter and Kalisky. This is an open-access article distributed under the terms of the Creative Commons Attribution License (CC BY). The use, distribution or reproduction in other forums is permitted, provided the original author(s) or licensor are credited and that the original publication in this journal is cited, in accordance with accepted academic practice. No use, distribution or reproduction is permitted which does not comply with these terms.
*Correspondence: Itamar Kanter, Faculty of Engineering and Institute for Nanotechnology and Advanced Materials, Bar-Ilan University, Ramat Gan 5290002, Israel e-mail:aXRhbWFyLmthbnRlckBiaXUuYWMuaWw=