 Junlong Wu1,2†
 Shengming Jin1,2†
 Weijie Gu1,2†Fangning Wan1,2Hailiang Zhang1,2Guohai Shi1,2
 Yuanyuan Qu1,2*Dingwei Ye1,2*
- 1Department of Urology, Fudan University Shanghai Cancer Center, Shanghai, China
- 2Department of Oncology, Shanghai Medical College, Fudan University, Shanghai, China
Purpose: Aim of this study was to develop a multi-gene signature to help better predict prognosis for stage III renal cell carcinoma (RCC) patients.
Methods: Fourteen pairs of stage III tumor and normal tissues mRNA expression data from GSE53757 and 16 pairs mRNA expression data from TCGA clear cell RCC database were used to analyze differentially expressed genes between tumor and normal tissues. Common different expressed genes in both datasets were used for further modeling. Lasso Cox regression analysis was performed to select and build prognostic multi-gene signature in TCGA stage III kidney cancer patients (N = 122). Then, the multi-gene signature was validated in stage III renal cancer cases in Fudan University Shanghai Cancer Center (N = 77). C-index and time-dependent ROC were used to test the efficiency of this signature in predicting overall survival.
Results: In total, 1,370 common different expressed genes were found between tumor and normal tissues in both datasets. After Lasso Cox modeling, nine mRNAs were finally identified to build a classifier. Using this classifier, we could classify stage III clear cell RCC patients into high-risk group and low-risk group. Prognosis was significantly different between these groups in discovery TCGA cohort, validation FUSCC cohort and entire set (All P < 0.001). Multivariate cox regression in entire set (N = 199) revealed that risk group classified by 9-gene signature, age of diagnosis, pN stage and ISUP grade were independent prognostic factor of overall survival in stage III kidney cancer patients.
Conclusion: We developed a robust multi-gene classifier that can effectively classify stage III RCC patients into groups with low and high risk of poor prognosis. This signature may help select high-risk patients who require more aggressive adjuvant target therapy or immune therapy.
Introduction
Kidney cancer is one of the most common urological tumors worldwide, and nearly 65,340 new cases and 14,970 deaths were estimated in the United States in 2018 (1). The morbidity of renal cell carcinoma (RCC) is also increasing in China (2). At present, prognostic prediction is mainly based on pathological stages of RCC patients (3).
Currently, the tumor node metastasis (TNM) classification system is recommended for tumor staging in clinical practice (4). However, obvious survival differences exist between the subgroups of stage III RCC patients (T3N0M0, 5-year survival: 20–70%; T1-3N1M0, 5-year survival: 0–20%) (5). Although the latest edition (8th) of the UICC/AJCC TNM staging system has been released, this problem remains unsolved, and thus limits the application of this system in estimating prognosis to direct clinical practice. Therefore, better signatures are required to help predict prognosis for stage III RCC patients.
In addition, systemic treatment for patients with stage III RCC is still in development. Several studies have claimed that stage III patients receiving sorafenib or sunitinib after surgery had better disease-free survival (DFS) but a similar overall survival (OS) compared with placebo (6–8). Pazopanib and nivolumab were reported to be effective in metastatic RCC patients, while a clinical trial of pazopanib vs. placebo for adjuvant therapy in locally advanced RCC patients did not show protection (9–12). Adjuvant and neoadjuvant nivolumab clinical trials are ongoing, but hopefully they will show a good response. Use of ipilimumab may also be promising (13, 14). Therefore, a more accurate prognosis classification system for stage III RCC patients is important to direct better management strategies.
Clear cell renal cell carcinoma (ccRCC) is the most common subtype of RCC (15). A study at our center demonstrated that 88.9% of RCC patients have a clear cell subtype in coastal Chinese areas, consistent with results (87.4%) from the SEER (2004–2012) database (16). Furthermore, it was reported that ccRCC patients have more malignant characteristics and worse prognosis. Further advancements are thus urgently required for ccRCC diagnosis and treatment (15). In our study, we focused on prognosis prediction for stage III ccRCC patients and constructed a nine-gene signature, using data from the Gene Expression Omnibus (GEO) and The Cancer Genome Atlas (TCGA) databases. We validated this signature in a cohort of stage III ccRCC patients who underwent radical nephrectomy at Fudan University Shanghai Cancer Center (FUSCC).
Materials and Methods
Patients and Public Datasets
Raw microarray mRNA expression data of 14 paired tumor and normal tissue samples from stage III ccRCC patients were downloaded from GEO (http://www.ncbi.nlm.nih.gov/geo/) with the identifier GSE53757. Expression data for a further 16 paired tumor and normal samples from stage III renal cancer patients in TCGA were obtained from UCSC (University of California, Santa Cruz) Xena (https://xenabrowser.net/datapages/). Gene expression data of paired samples from these two datasets were used to identify differentially expressed genes (DEGs) and perform cross-validation to ensure reliability.
At the discovery stage, 122 stage III ccRCC patients with full clinical and survival information along with gene expression data in tumor tissue were included in this study. Data for the discovery stage were used to build a multi-gene signature to predict prognosis in stage III renal cancer cases.
At the validation stage, we recruited 77 patients who underwent radical nephrectomy at Fudan University Shanghai Cancer Center from January 2007 to July 2013 (see detailed information in Supplementary Table 4). These patients all had stage III ccRCC, and total RNA of their tumor tissue were extracted. Data at the validation stage were used to test the efficiency of the multi-gene classifier established at the discovery stage.
For the entire set, 199 stage III renal cancer patients with clinical and gene expression data were included in this study, and all patients exhibited a clear cell pathological phenotype.
Processing of Public Datasets
Raw microarray data from GSE53757 was produced by the Affymetrix HG-U133 plus 2.0 platform. Data extraction and normalization was conducted using R Bioconductor with Affy and gcrma packages. All probes were mapped based on their Entrez Gene ID. When multiple probes were mapped to the same EntrezGeneID, the mean value was used to represent its average expression level. Gene expression data from TCGA was derived from RNA-sequencing, and pre-processed level 3 data were used in this project.
Identification of DEGs
Normalized mRNA expression data of 14 paired tumor and normal tissues from GSE53757 were compared using paired t-tests to identify DEGs. We undertook a significance analysis of the microarrays, with a false discovery rate of <0.01, P-values of <0.01, and fold-changes higher than 2. Level 3 gene expression data from TCGA were also analyzed using the procedures described above. Then, commonly upregulated and downregulated genes in tumor tissue from the two datasets were defined as DEGs. We used MeV version 4.2 to perform the data analysis.
RNA Extraction, Reverse Transcription, and qRT-PCR Analysis
In the FUSCC validation set, total RNA was isolated from 77 patients' samples using TRIzol reagent (15596-026, Invitrogen). A PrimeScript RP reagent kit (K1622, Thermo Scientific) was used to synthesize first-strand cDNA from total RNA. Then, SYBR Green real-time PCR was performed on the ABI 7900HT platform (Applied Biosystems, USA). We used ACTB mRNA as an internal reference. Primers of mRNAs tested in this study were synthesized by Sangon (Shanghai, China) and sequences are listed in Supplementary Tables 1, 2. Gene expression level was presented as ΔCt using the following formula:
Generally, the higher the ΔCt value, the lower the initial gene expression.
Calculation of Risk Score and Statistical Analysis
Overall survival (OS) was calculated from the date of surgery to the date of death or last follow-up for each cohort. Sex, ISUP (The International Society of Urological Pathology) grade (low vs. high), tumor laterality, pT stage, pN stage, adjuvant target therapy status, and risk group were deemed as categorical variables. Age at diagnosis and risk score were considered as continuous variables. Gene expression levels from GEO or TCGA databases and ΔCt value of certain genes were continuous variables. However, they were divided into high- or low-expression groups to construct and validate the multi-gene prognostic model using best cutoffs estimated by X-tile 3.6.1 (Yale University, New Haven, CT, USA).
After identifying DEGs between tumor and normal tissues, we used LASSO (least absolute shrinkage and selection operator) Cox regression analysis in the discovery stage to select a panel of genes, and then constructed a multi-gene signature for predicting prognosis in stage III ccRCC patients. LASSO Cox regression analysis was performed using the glmnet R package. Detailed R codes and parameters are presented in the Supplementary Files. Patients were divided into high-risk and low-risk groups by a specific risk score formula, using the median risk score in the discovery stage as the cutoff value. OS was calculated and the Kaplan-Meier method was used to test prognostic differences between high- and low-risk groups in the discovery, validation, and entire sets. Cox regression analysis was conducted to test whether risk group was an independent prognostic factor. Time-dependent receiver-operating characteristic (ROC) analysis was performed to assess the predictive accuracy of the risk score in each set. The C-index was calculated to represent the effect of some prognostic factors. A nomogram and related calibration curves were established based on the entire stage III ccRCC cohort for further clinical application. Statistical analyses were performed using R software. All tests were two-tailed, and a P-value of <0.05 was considered statistically significant.
Results
Clinical Characteristics of Patients in TCGA and FUSCC Cohorts
In TCGA discovery cohort, the median age of stage III patients was 64.5 years (range, 32–88 years). Male patients accounted for 65.6% of the cohort. Patients with ISUP III to IV grade tumors accounted for 71.3%. Among 122 patients, only nine (7.4%) were confirmed to have regional lymph node metastasis according to pathological results. Median follow-up time was 37.8 months.
In the FUSCC validation cohort, the median age was 58.0 years (range, 21–82 years). Among 77 stage III patients, 44 were male (57.1%) and 24 patients (31.2%) had lymph node metastasis. Twenty-five patients received adjuvant targeted therapy after surgery. Median follow-up time was 44.5 months. Detailed information of these two cohorts and comparisons between them are summarized in Table 1. A flow chart of our study design is shown in Figure 1A.
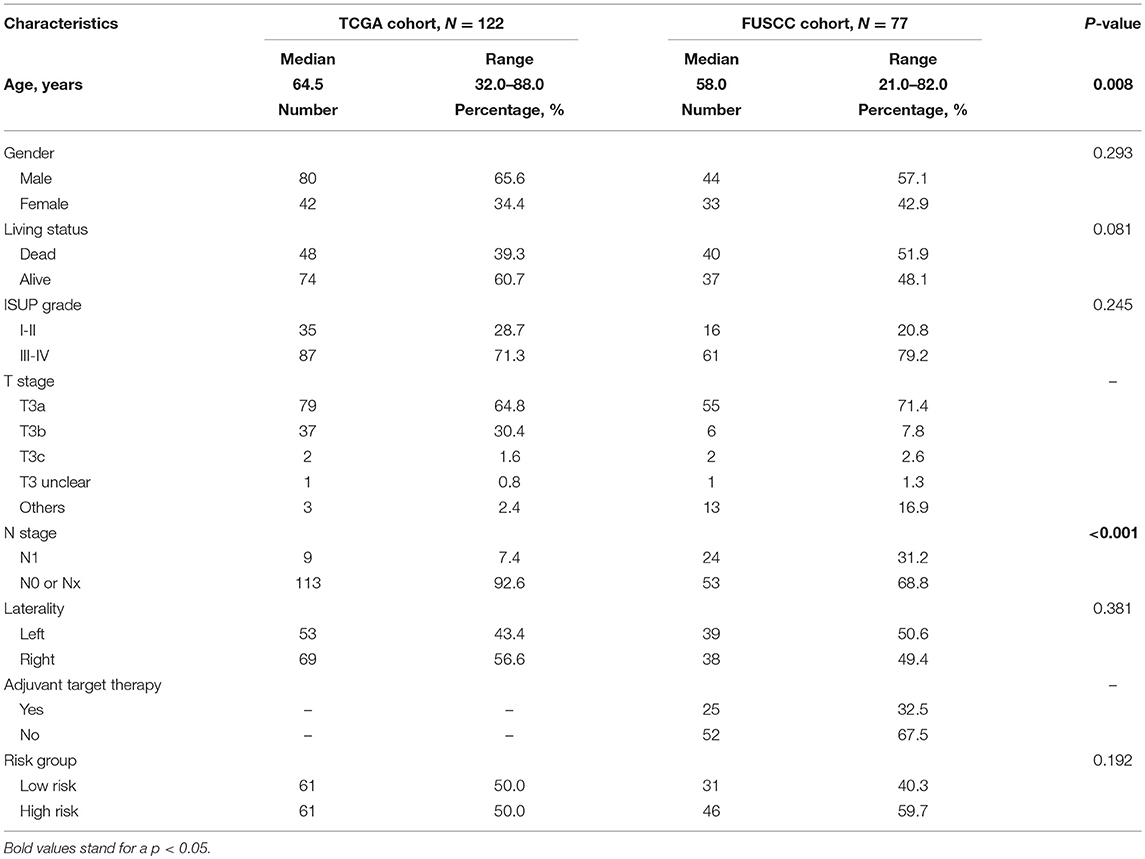
Table 1. Patient characteristics in discovery stage and validation stage.
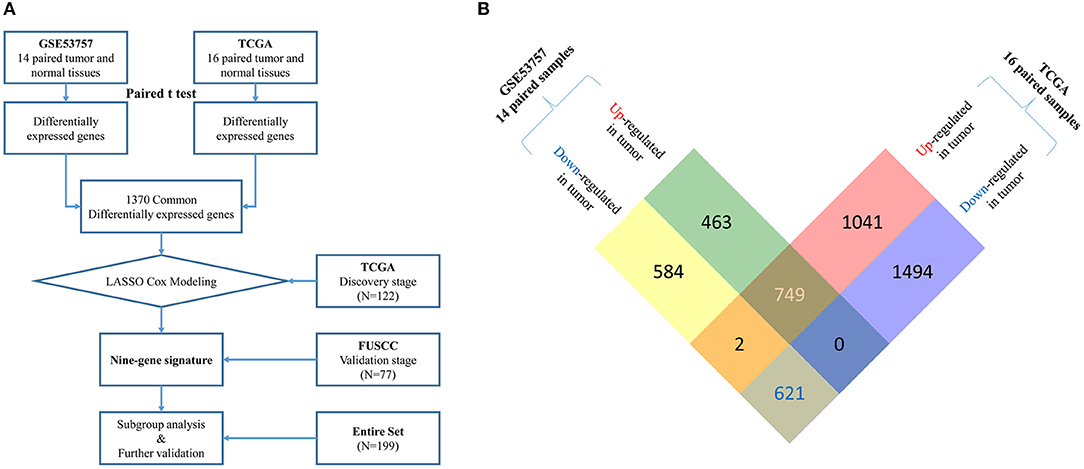
Figure 1. (A) Flow chart of multi-gene signature identification and validation.Raw microarray mRNA expression data of 14 and 16 paired tumor and normal tissue samples from stage III ccRCC patients was downloaded from GEO (GSE53757) and TCGA database, respectively. Differentially expressed genes (DEGs) were identified based on gene expression data of paired samples from these two datasets using paired t-test. 1370 common DEGs were found between two datasets (see more detail in B). Then, we used a LASSO cox regression model and selected nine genes highly associated with survival in these 1370 common DEGs in a TCGA discovery cohort (N = 122). Later, this nine-gene signature was further tested in the FUSCC validation cohort (N = 77). Finally, subgroup analysis and further validation were performed in the entire cohort (N = 199). (B) Identification of common up-regulated genes and down-regulated genes (DEGs) from two datasets. By analyzing 14 paired tumor and normal microarray mRNA expression data from stage III ccRCC patients in GSE53757, we identified 1,212 up-regulated and 1,207 down-regulated genes in tumor tissues. From 16 paired samples in TCGA, we identified 1,792 up-regulated and 2,115 down-regulated genes in tumor tissues. After analyzing the intersection of the two datasets, we finally located 749 common up-regulated genes and 621 common down-regulated genes (1,370 common DEGs).
Differentially Expressed Genes (DEGs)
By analyzing 14 paired tumor and normal microarray mRNA expression data from stage III ccRCC patients in GSE53757, we identified 1,212 upregulated and 1,207 downregulated genes in tumor tissues. From 16 paired samples in TCGA, we identified 1,792 upregulated and 2,115 downregulated genes in tumor tissues. By analyzing the intersection of the two datasets, we located 749 commonly upregulated genes and 621 commonly downregulated genes (Figure 1B). These common DEGs were used for construction of the prognostic signature.
Development of a Multi-Gene Classifier at the Discovery Stage
We used a LASSO Cox regression model to select proper genes highly associated with survival in 1,370 common DEGs in TCGA discovery cohort. LASSO coefficient profiles and a partial likelihood deviance plot are shown in Supplementary Figure 1. Finally, we selected nine genes that were highly associated with prognosis in stage III ccRCC patients (ATP6V1C2, PCSK1N, PREX1, ANK3, HLA-DRA, SELENBP1, TYRP1, GABRA2, and SERPINA5; see detailed information in Supplementary Table 2). Then we used X-tile to select the optimum cutoff for the expression of these nine genes based on the association with patients' OS in TCGA cohort. After that, the expression level of each gene was divided into high expression (status 1) and low expression (status 0). Then we derived a formula to calculate the risk score for predicting prognosis based on the expression levels of the nine genes in patients (high or low). The formula was as follows: risk score = (0.93*SELENBP1 status) + (0.74*SERPINA5 status) + (0.39*GABRA2 status) + (0.29 TYRP1 status) + (0.02 ATP6V1C2 status) - (1.54 PCSK1N status) – (1.24 PREX1 status) – (0.53 HLA-DRA status) – (0.47 ANK3 status).
Next, patients in the discovery stage were divided into low-risk (n = 61) and high-risk (n = 61) groups based on the median risk score (−1.73) as a cutoff. To better illustrate this, we adjusted the risk score formula as follows: risk score = (0.93*SELENBP1 status) + (0.74*SERPINA5 status) + (0.39*GABRA2 status) + (0.29 TYRP1 status) + (0.02 ATP6V1C2 status) - (1.54 PCSK1N status) – (1.24 PREX1 status) – (0.53 HLA-DRA status) – (0.47 ANK3 status) + 1.73. Using this formula, a risk score of <0 indicates low-risk while a risk score >1 indicates high-risk.
Prognostic Value of Nine-Gene Classifier
The distribution of risk score, risk group, and survival status in the discovery stage is shown in Figure 2A (left panel), which indicated that low-risk patients generally had better overall survival. Time-dependent ROC analyses were performed to evaluate the accuracy of the nine-gene classifier in predicting survival at 1, 3, and 5 years after surgery (Figure 2A, middle panel). A Kaplan-Meier plot indicated that patients in the high-risk group had significantly poor OS with a 5-year survival rate only 22.3% (P < 0.001, Figure 2A, right panel).
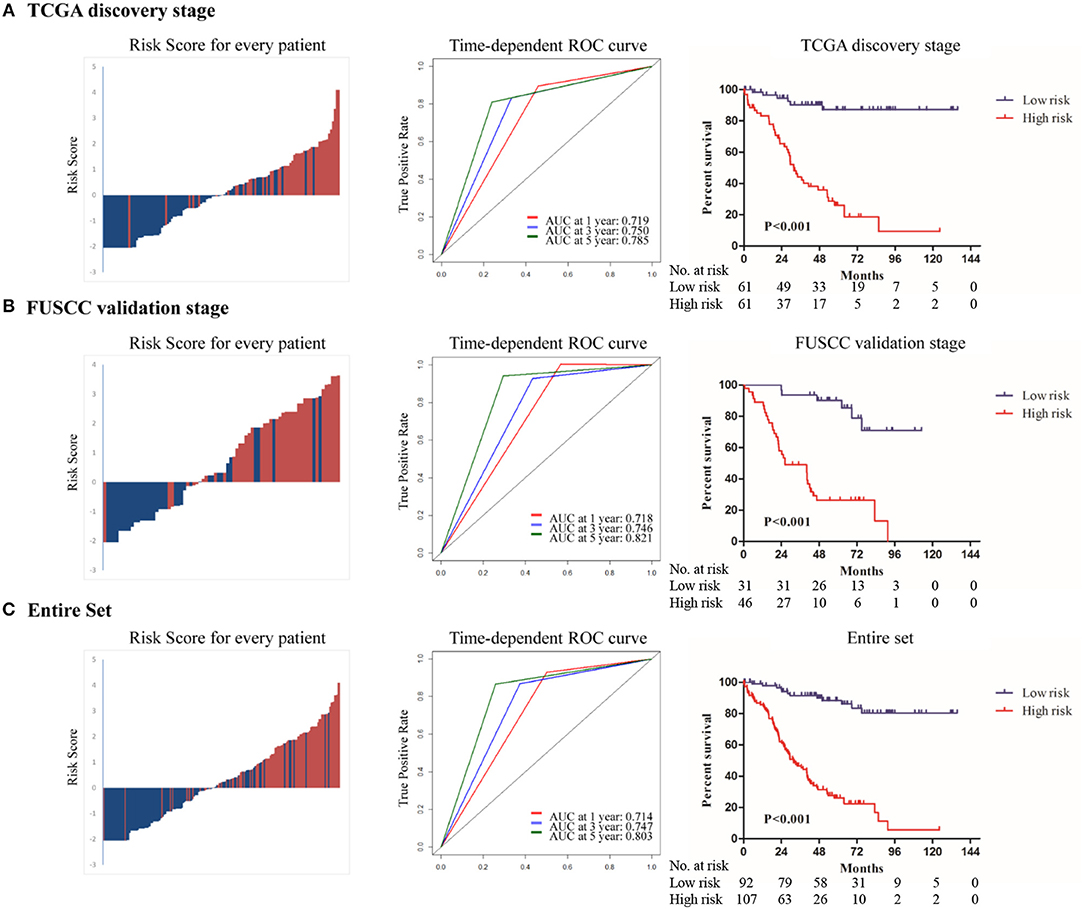
Figure 2. The distribution of risk score, risk group and survival status(left panel); Time dependent ROC analyses at 1, 3, and 5 year after surgery(middle panel); The Kaplan–Meier plot (low risk vs. high risk ccRCC cases) of 5 year overall survival in patients (right panel) in (A)TCGA discovery stage, (B) FUSCC validation stage, (C) the entire set.
To confirm whether the prognostic value of the nine-gene signature remained in other datasets, we validated it in the FUSCC stage III ccRCC cohort. Using the pre-established cutoff of risk score in the discovery stage, 31 patients were low-risk and 46 patients were high-risk in the FUSCC validation stage (Table 1). The same analyses were conducted at the validation stage and similar results were achieved. Details are shown in Figure 2B.
In the entire set analysis, the risk score-based classification yielded similar results (Figure 2C). Area under the curve at 1, 3, and 5 years was 0.714, 0.747, and 0.803 in the entire set, respectively. Five-year overall survival rates in low-risk patients and high-risk patients were 86.1 and 26.1%, respectively (P < 0.001).
Independence Analysis and Sub-Group Analysis
To examine whether the nine-gene signature-based risk group classifier was an independent prognostic factor, we performed multivariate Cox regression analysis at the discovery stage and validation stage and in the entire set by adjusting the available clinicopathological variables. We found that risk group (nine-gene signature-based) was an independent prognostic factor at the discovery stage (HR: 10.460; 95% CI: 4.252–25.734; P < 0.001), validation stage (HR: 10.204; 95% CI: 3.969–26.234; P < 0.001), and entire set (HR: 9.874; 95% CI: 5.234–18.629; P < 0.001). Laterality was also an independent prognostic factor (HR: 0.462; 95% CI: 0.251–0.850; P = 0.013) in the discovery stage. Additionally, in the entire cohort, we found that age (HR: 1.033; 95% CI: 1.012–1.055), ISUP grade (HR: 2.654; 95% CI: 1.447–4.867), and pN stage (HR: 3.143; 95% CI: 1.891–5.225) remained independent prognostic factors (Table 2).
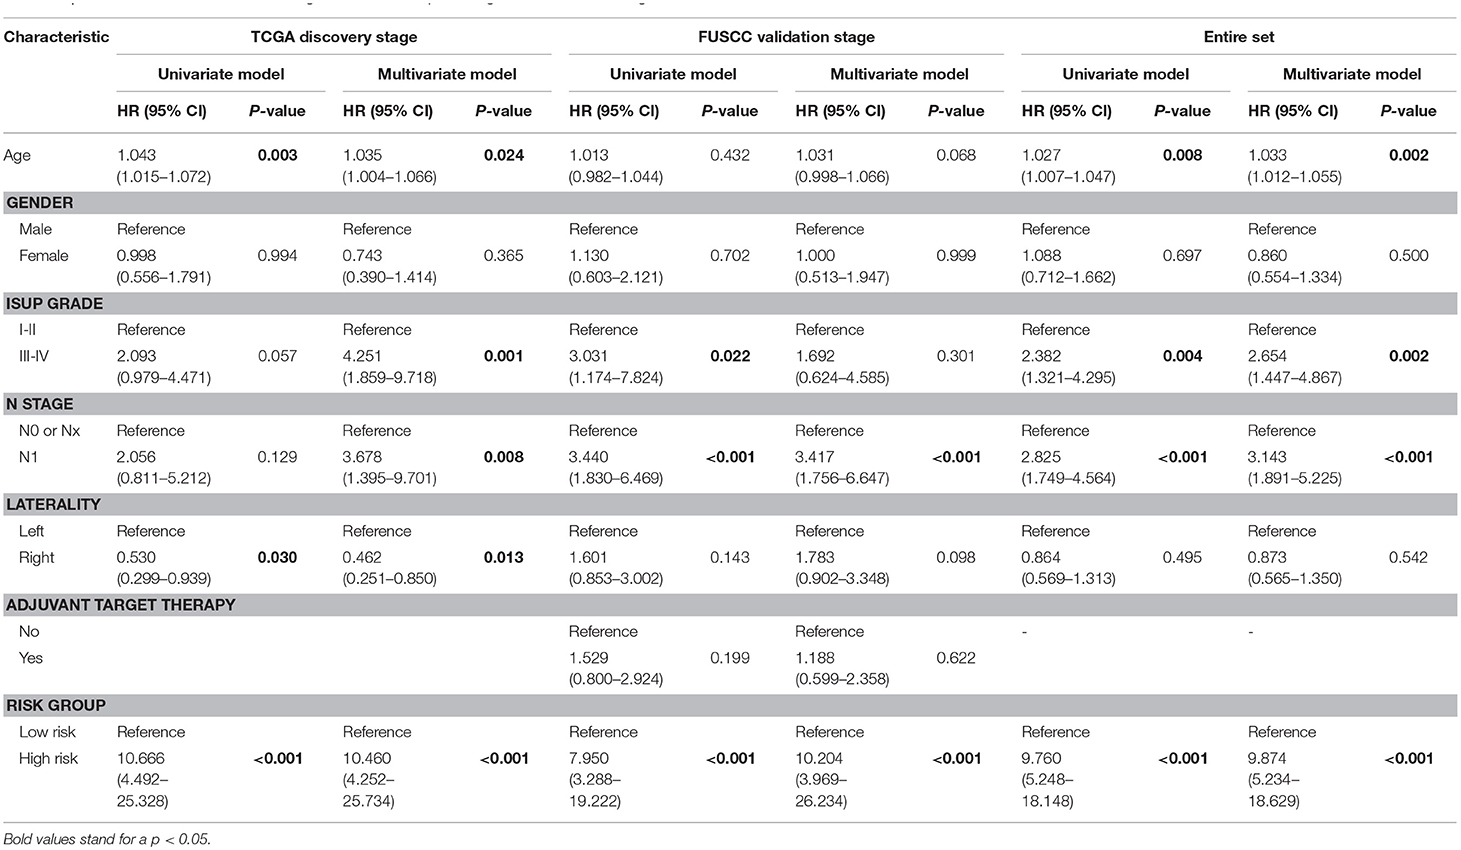
Table 2. Univariate and multivariate Cox regression model in predicting overall survival of stage III clear cell renal cell carcinoma.
Sub-group analysis showed that nine-gene signature-based risk group stratification was still a powerful tool in predicting OS in patients with low or high ISUP grade, patients with or without regional lymph node metastasis, older or younger, and male or female patients (Figure 3, Supplementary Figure 2).
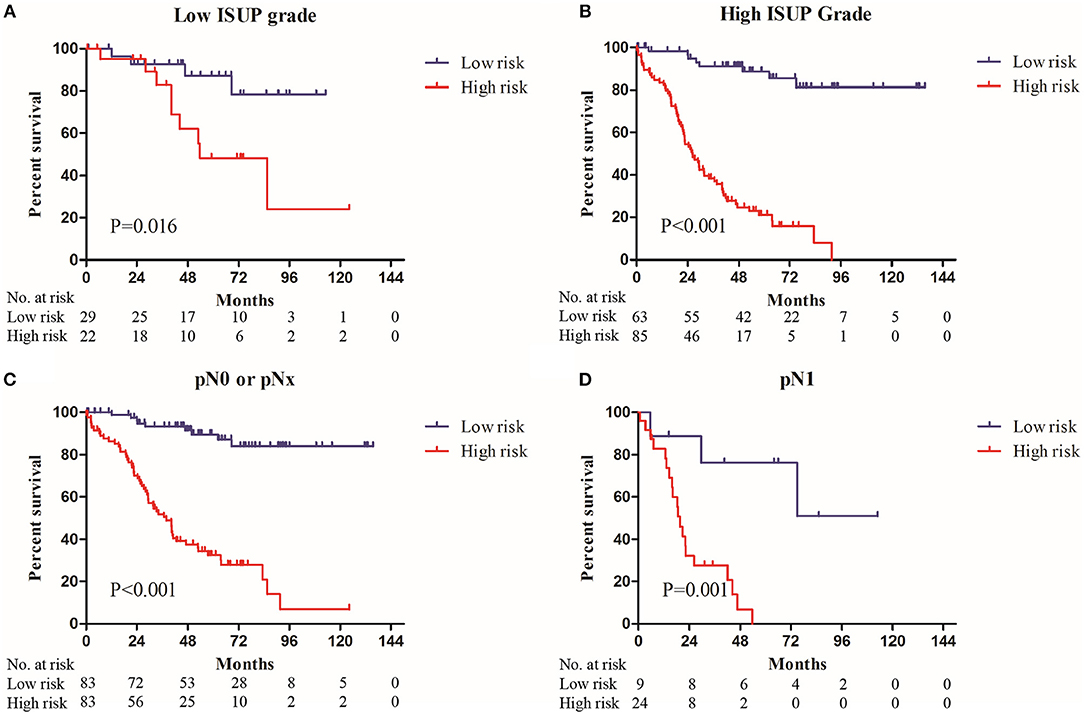
Figure 3. The Kaplan–Meier plot (low risk vs. high risk ccRCC cases) of 5 year overall survival in patients with (A) low ISUP grade, (B) high ISUP grade, (C) pN0 or pNx stage, (D) pN1 stage in the entire set.
Extension of Prognostic Models for Stage III ccRCC Patients
In the entire cohort, the multivariate Cox regression model revealed that age, ISUP grade, pN stage, and the nine-gene classifier were independent prognostic factors for stage III ccRCC patients. We calculated C-indexes to evaluate the power of these factors. The C-index of the risk group (nine-gene classifier) was 0.719 (95% CI: 0.678–0.761), which was higher than the three clinical factors combined (C-index: 0.690; 95% CI: 0.634–0.746). Then, when we combined the clinical factors and risk group, the C-index increased to 0.792 (95% CI: 0.749–0.835), which showed a better predictive power (Supplementary Table 3).
Based on the results derived from multivariate Cox regression of OS in the entire set, we developed a nomogram to predict survival probability at 3 and 5 years after surgery for clinical use (Figure 4A). Calibration curves for this nomogram are plotted in Figures 4B,C.
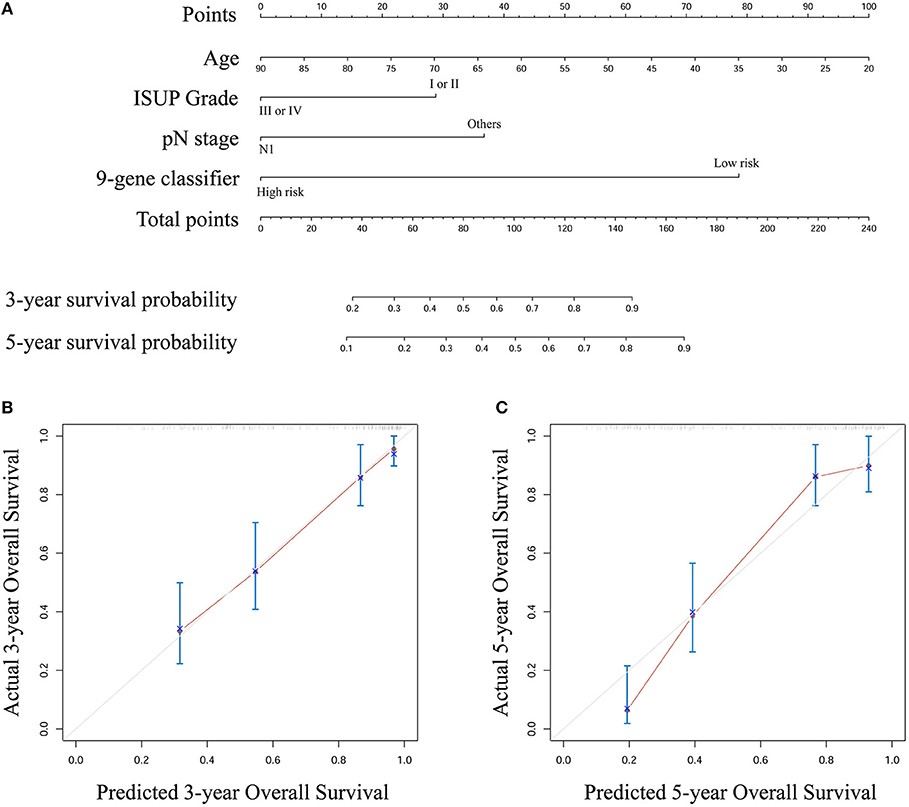
Figure 4. (A) A nomogram to predict survival probability at 3 and 5 year after surgery for stage III ccRCC patients based on the results deriving from the entire set (B) Calibration curve for the nomogram when predicting 3 year overall survival (C) Calibration curve for the nomogram when predicting 5 year overall survival.
Discussion
A nine-gene signature was generated using gene expression data from two public databases and was validated in two cohorts of patients with stage III ccRCC. Our results suggested that this model could properly classify patients into different risk groups. Furthermore, this nine-gene signature was also an independent prognosis factor for stage III ccRCC patients, with a better predictive ability than age, ISUP grade, and pN stage. Finally, we developed a nomogram that included these clinical factors and risk group.
Many prognosis models for RCC patients have previously been reported. In 2002, Frank et al. proposed the SSIGN score, which predicts the outcome of patients with ccRCC treated with radical nephrectomy, and is composed of TNM stage (the modified edition in 1997), tumor size, nuclear grade, and necrosis (3). Lam et al. reported a valid prognostic nomogram and risk stratification system in 2005, which was aimed at postoperative surveillance for patients with localized and locally-advanced RCC and included physical examination, complete blood count, serum chemistry, liver function tests, and chest and abdominal CT (17). In 2009, a preoperative prognostic model introduced by Karakiewic et al. for RCC patients treated with nephrectomy exceeded the accuracy of the existing pretreatment models (18). As for metastatic RCC (mRCC), the most used MSKCC model was based on a clinical trial involving patients treated with IFN-α. This model was further developed and now consists of Karnofsky performance status (KPS), serum lactate dehydrogenase (LDH) levels, corrected serum calcium levels and serum hemoglobin levels, and no history of nephrectomy (19). In this era of targeted therapy, Heng proposed another famous prognosis model for mRCC patients, the IMDC model, which played an important role in selecting eligible patients for many clinical trials (20). Although these models have covered all stages of RCC and have a good ability to predict prognosis, some drawbacks still exist. There are few models that specifically focus on stage III RCC patients, and prognosis is rather heterogeneous for these. However, these commonly-used models only incorporate clinical and pathological factors, without considering genetic characteristics. Thus, a more precise prognosis model for stage III RCC patients is necessary.
Recently, some powerful multi-gene signatures in predicting the prognosis of RCC patients were proposed. ClearCode34 is a classifier that can divide localized ccRCC patients into good risk (ccA) group and poor risk (ccB) groups using the expression levels of 34 genes to further analyze patient outcome (21). Additionally, Rini et al. proposed a 16-gene assay to predict recurrence after surgery in localized RCC patients (22). Morgan et al. developed a multi-gene signature based on cell cycle proliferation to improve prediction of mortality within 5 years for RCC patients who underwent radical nephrectomy (23). All three multi-gene signatures showed excellent performance in the training and validation cohorts. However, they all included stage I to stage III renal tumor patients and did not specify locally-advanced RCC patients. In addition, Morgan's signature prediction also included patients with papillary RCC or chromophobe carcinoma. Our study focused on predicting the prognosis of stage III renal cancer patients, and to better apply it to clinical treatment we only included patients with ccRCC. In this respect, our model is more focused and precise in predicting the prognosis of locally advanced clear cell RCC cases according to experimental design. However, whether our signature has predictive advantages over the abovementioned general models remains to be tested in large external stage III clear cell RCC cohorts.
Our model for patients with stage III ccRCC contains nine genes. Among them, PREX1 was upregulated in RCC tissues in this study. The P-Rex family are Dbl-type guanine-nucleotide exchange factors for Rac family small G proteins and PREX1 is involved in the inflammatory response. Upregulation of PREX1 expression occurs in many types of cancers, particularly in breast and prostate cancers and in melanoma (24). In addition, downregulation of PCSK1N, SELENBP1, SERPINA5, and ANK3 was discovered in RCC samples. PROSAAS is a protein encoded by PCSK1N (25), and is reported to play an important role in regulating body weight and glucose metabolism as a neuropeptide (25, 26). Thus, downregulation of PCSK1N may result in obesity, which is a risk factor for RCC (27). SELENBP1 (selenium-binding protein 1) has already been described as a tumor suppressor involved in the regulation of cell proliferation, senescence, migration, and apoptosis (28). Ha et al. reported that decreased SELENBP1 mRNA expression is associated with poor prognosis in RCC patients (29). Moreover, this was also confirmed in melanoma, colorectal, breast, prostate, pancreatic, hepatocellular, ovarian, nasopharyngeal, and esophageal carcinoma (28, 30–37). SERPINA5 (protein C inhibitor) is a member of the serine protease inhibitor family and is produced in tissues including the liver, kidney, and testis (38). SERPINA5 was reported to be deregulated in renal, breast, prostate, liver, and ovarian cancers (38–42) and have a protective role against tumor development, invasiveness, and metastasis (43). Hence, SERPINA5 might be a potential therapeutic target in RCC (38). ANK3 is mainly expressed in tissues such as kidney and gut epithelium (44), and encodes ankyrin-G isoforms that anchor membrane protein complexes to the cytoskeleton (45). It was discovered that ANK3 is implicated in renal magnesium handling (46) and polycystic kidney disease (47). Deregulation of ANK3 expression has been observed in multiple human cancers, and, while it contributes to poor prognosis (48), its mechanism remains unknown (49). Several researchers proposed a possible connection between ANK3 dysregulation and epithelial-to-mesenchymal transition (EMT) (48). In our future work, we plan to focus on several of the abovementioned genes to determine their roles in RCC patients.
According to the 2018 edition of the EAU guidelines for stage III ccRCC patients, various adjuvant therapeutic strategies are recommended. Thus far, no evidence from randomized phase III trials have confirmed if adjuvant therapy will lead to OS benefit (50). However, some ongoing clinical trials may provide evidence for the future adoption of adjuvant therapy such as new tyrosine kinase inhibitors and nivolumab. One study suggested that full-dose sunitinib could improve DFS in a subset analysis (51, 52). Therefore, we could expect the clinical results of several trials involving adjuvant new TKIs or combined with immune checkpoint inhibitors in the following years.
Few studies have reported laterality as an independent prognosis factor in ccRCC patients (Table 2). We speculated that it was due to the small sample size of the discovery cohort and potential selection bias. Moreover, in the entire set, laterality lost its prognostic power.
Some limitations still existed in this study. Firstly, the nine-gene signature for stage III ccRCC patients was generated using data derived from TCGA and GEO databases, in which most patients were Caucasian, African, or Afro-Caribbean. Secondly, this signature was only validated in the FUSCC cohort. Therefore, this model needs to be further validated in multiple centers across different populations.
Conclusion
Our study built a nine-gene signature for prognosis prediction in stage III ccRCC patients using data from GSE53757 and TCGA. Results from the validation cohort at FUSCC showed that this model had decent discriminative ability for stage III ccRCC patients and could complement the TNM staging system. However, this signature requires further validation at different centers.
Data Availability
The datasets generated and analyzed during the current study are available in the GEO database (http://www.ncbi.nlm.nih.gov/geo/) with an identifier GSE53757 and TCGA database obtained from UCSC Xena (https://xenabrowser.net/datapages/). Besides, The datasets from Fudan University Shanghai Cancer Center (FUSCC) are also available in supplementary material.
Ethics Statement
This study was carried out in accordance with the recommendations of the Research Ethics Committee of Shanghai Cancer Center, Fudan University, China according to the provisions of the Declaration of Helsinki (as revised in Fortaleza, Brazil, October 2013). The protocol was approved by the Research Ethics Committee of Shanghai Cancer Center, Fudan University, China. Written informed consent was obtained from all individual participants included in the validation cohort at FUSCC before they underwent surgery, in accordance with the Declaration of Helsinki. For the public GEO and TCGA databases, we did not need the informed consent of the patients. In addition, patients in the discovery and validation cohort were anonymous and other personal information was also erased.
Author Contributions
JW and SJ analyzed the data and drafted the manuscript. WG and FW helped interpreted the data. HZ and GS prepared all figures. JW and SJ edited all tables. YQ and DY designed the study. All authors read and approved the final manuscript.
Funding
This work is supported by Grants from the National Natural Science Foundation of China (No. 81802525), Science and Technology Municipal Commission of Shanghai (No. 16JC1405300), Shanghai Sailing Program (No. 17YF1402700), and the State Key Laboratory of Genetic Engineering (No. SKLGE-1605). The funding source provided financial support for the study and did not have any other involvement in this study.
Conflict of Interest Statement
The authors declare that the research was conducted in the absence of any commercial or financial relationships that could be construed as a potential conflict of interest.
Acknowledgments
We would like to thank patients in the FUSCC cohort and all the stuff in the department of urology in FUSCC. Besides, we would like to thank TCGA network and contributors of GSE53757 dataset. We also thank H. Nikki March, Ph.D., from Liwen Bianji, Edanz Editing China (www.liwenbianji.cn/ac), for editing the English text of a draft of this manuscript. Finally, we want to acknowledge that part of our work was accepted by the 38th Congress of the Society of International Urology (SIU 2018) and was included in the SIU 2018 abstract book (53).
Supplementary Material
The Supplementary Material for this article can be found online at: https://www.frontiersin.org/articles/10.3389/fonc.2019.00152/full#supplementary-material
Abbreviations
ccRCC, clear cell renal cell carcinoma; TCGA, The Cancer Genome Atlas; FUSCC, Fudan University Shanghai Cancer Center; TNM, Tumor Node Metastasis; DFS, disease-free survival; OS, overall survival; GEO, Gene Expression Omnibus; DEGs, differentially expressed genes; ROC, receiver-operating characteristic; HR, hazard ratio; CI, confidence interval; mRCC, metastatic renal cell carcinoma; TKI, tyrosine kinase inhibitor; KPS, Karnofsky performance status; LDH, serum lactate dehydrogenase.
References
1. Siegel RL, Miller KD, Jemal A. Cancer statistics, 2018. CA Cancer J Clin. (2018) 68:7–30. doi: 10.3322/caac.21442
2. Chen W, Zheng R, Baade PD, Zhang S, Zeng H, Bray F, et al. Cancer statistics in China, 2015. CA Cancer J Clin. (2016) 66:115–32. doi: 10.3322/caac.21338
3. Frank I, Blute ML, Cheville JC, Lohse CM, Weaver AL, Zincke H. An outcome prediction model for patients with clear cell renal cell carcinoma treated with radical nephrectomy based on tumor stage, size, grade and necrosis: the SSIGN score. J Urol. (2002) 168:2395–400. doi: 10.1016/S0022-5347(05)64153-5
4. Sobin LH GM, Wittekind C. TNM Classification of Malignant Tumors. UICC International Union Against Cancer. 7th ed. Hoboken,NJ: Wiley-Blackwell (2009).
5. Martinez-Salamanca JI, Huang WC, Millan I, Bertini R, Bianco FJ, Carballido JA, et al. Prognostic impact of the 2009 UICC/AJCC TNM staging system for renal cell carcinoma with venous extension. Euro Urol. (2011) 59:120–7. doi: 10.1016/j.eururo.2010.10.001
6. Zhao J, Zhu Y, Zhang C, Wang X, He H, Wang H, et al. Sorafenib or sunitinib as postoperative adjuvant therapy for Chinese patients with locally advanced clear cell renal cell carcinoma at high risk for disease recurrence. Urol Oncol. (2013) 31:1800–5. doi: 10.1016/j.urolonc.2012.04.019
7. Baker H. Sunitinib as adjuvant therapy for renal cell carcinoma. Lancet Oncol. (2016) 17:e485. doi: 10.1016/S1470-2045(15)00617-8
8. Ravaud A, Motzer RJ, Pandha HS, George DJ, Pantuck AJ, Patel A, et al. Adjuvant sunitinib in high-risk renal-cell carcinoma after nephrectomy. N Engl J Med. (2016) 375:2246–54. doi: 10.1056/NEJMoa1611406
9. Motzer RJ, Hutson TE, Cella D, Reeves J, Hawkins R, Guo J, et al. Pazopanib versus sunitinib in metastatic renal-cell carcinoma. N Engl J Med. (2013) 369:722–31. doi: 10.1056/NEJMoa1303989
10. Minguet J, Smith KH, Bramlage CP, Bramlage P. Targeted therapies for treatment of renal cell carcinoma: recent advances and future perspectives. Cancer Chemother Pharmacol. (2015) 76:219–33. doi: 10.1007/s00280-015-2770-3
11. Massari F, Santoni M, Ciccarese C, Santini D, Alfieri S, Martignoni G, et al. PD-1 blockade therapy in renal cell carcinoma: current studies and future promises. Cancer Treat Rev. (2015) 41:114–21. doi: 10.1016/j.ctrv.2014.12.013
12. Motzer RJ, Haas NB, Donskov F, Gross-Goupil M, Varlamov S, Kopyltsov E, et al. Randomized phase III trial of adjuvant pazopanib versus placebo after nephrectomy in patients with localized or locally advanced renal cell carcinoma. J Clin Oncol. (2017) 35:3916–23. doi: 10.1200/JCO.2017.73.5324
13. Rexer H. [Therapy of untreated local advanced or metastatic renal cell carcinoma. Phase III, randomized, open-label study of nivolumab combined with ipilimumab versus sunitinib monotherapy in subjects with previously untreated, local advanced or metastatic renal cell carcinoma (CheckMate 214 - AN 36/15 of the AUO)]. Der Urologe Ausg A. (2015) 54:1443–5. doi: 10.1007/s00120-015-3946-5
14. Jonasch E. Updates to the management of kidney cancer. J Natl Comprehen Cancer Net. (2018) 16(5S):639–41. doi: 10.6004/jnccn.2018.0039
15. Xu F, Chang K, Ma J, Qu Y, Xie H, Dai B, et al. The oncogenic role of COL23A1 in clear cell renal cell carcinoma. Sci Rep. (2017) 7:9846. doi: 10.1038/s41598-017-10134-2
16. Wu J, Zhang P, Zhang G, Wang H, Gu W, Dai B, et al. Renal cell carcinoma histological subtype distribution differs by age, gender, and tumor size in coastal Chinese patients. Oncotarget. (2017) 8:71797–804. doi: 10.18632/oncotarget.17894
17. Lam JS, Shvarts O, Leppert JT, Pantuck AJ, Figlin RA, Belldegrun AS. Postoperative surveillance protocol for patients with localized and locally advanced renal cell carcinoma based on a validated prognostic nomogram and risk group stratification system. J Urol. (2005) 174:466–72. doi: 10.1097/01.ju.0000165572.38887.da
18. Karakiewicz PI, Suardi N, Capitanio U, Jeldres C, Ficarra V, Cindolo L, et al. A preoperative prognostic model for patients treated with nephrectomy for renal cell carcinoma. Euro Urol. (2009) 55:287–95. doi: 10.1016/j.eururo.2008.07.037
19. Motzer RJ, Bacik J, Murphy BA, Russo P, Mazumdar M. Interferon-alfa as a comparative treatment for clinical trials of new therapies against advanced renal cell carcinoma. J Clin Oncol. (2002) 20:289–96. doi: 10.1200/JCO.2002.20.1.289
20. Heng DY, Xie W, Regan MM, Warren MA, Golshayan AR, Sahi C, et al. Prognostic factors for overall survival in patients with metastatic renal cell carcinoma treated with vascular endothelial growth factor-targeted agents: results from a large, multicenter study. J Clin Oncol. (2009) 27:5794–9. doi: 10.1200/JCO.2008.21.4809
21. Brooks SA, Brannon AR, Parker JS, Fisher JC, Sen O, Kattan MW, et al. ClearCode34: a prognostic risk predictor for localized clear cell renal cell carcinoma. Euro Urol. (2014) 66:77–84. doi: 10.1016/j.eururo.2014.02.035
22. Rini B, Goddard A, Knezevic D, Maddala T, Zhou M, Aydin H, et al. A 16-gene assay to predict recurrence after surgery in localised renal cell carcinoma: development and validation studies. Lancet Oncol. (2015) 16:676–85. doi: 10.1016/S1470-2045(15)70167-1
23. Morgan TM, Mehra R, Tiemeny P, Wolf JS, Wu S, Sangale Z, et al. A multigene signature based on cell cycle proliferation improves prediction of mortality within 5 Yr of radical nephrectomy for renal cell carcinoma. Euro Urol. (2018) 73:763–9. doi: 10.1016/j.eururo.2017.12.002
24. Welch HC. Regulation and function of P-Rex family Rac-GEFs. Small GTPases. (2015) 6:49–70. doi: 10.4161/21541248.2014.973770
25. Liu T, Zhao Y, Tang N, Feng R, Yang X, Lu N, et al. Pax6 directly down-regulates Pcsk1n expression thereby regulating PC1/3 dependent proinsulin processing. PLoS ONE. (2012) 7:e46934. doi: 10.1371/journal.pone.0046934
26. Morgan DJ, Wei S, Gomes I, Czyzyk T, Mzhavia N, Pan H, et al. The propeptide precursor proSAAS is involved in fetal neuropeptide processing and body weight regulation. J Neurochem. (2010) 113:1275–84. doi: 10.1111/j.1471-4159.2010.06706.x
27. Gati A, Kouidhi S, Marrakchi R, El Gaaied A, Kourda N, Derouiche A, et al. Obesity and renal cancer: Role of adipokines in the tumor-immune system conflict. Oncoimmunology. (2014) 3:e27810. doi: 10.4161/onci.27810
28. Schott M, de Jel MM, Engelmann JC, Renner P, Geissler EK, Bosserhoff AK, et al. Selenium-binding protein 1 is down-regulated in malignant melanoma. Oncotarget. (2018) 9:10445–56. doi: 10.18632/oncotarget.23853
29. Ha YS, Lee GT, Kim YH, Kwon SY, Choi SH, Kim TH, et al. Decreased selenium-binding protein 1 mRNA expression is associated with poor prognosis in renal cell carcinoma. World J Surg Oncol. (2014) 12:288. doi: 10.1186/1477-7819-12-288
30. Wang N, Chen Y, Yang X, Jiang Y. Selenium-binding protein 1 is associated with the degree of colorectal cancer differentiation and is regulated by histone modification. Oncol Rep. (2014) 31:2506–14. doi: 10.3892/or.2014.3141
31. Zhang S, Li F, Younes M, Liu H, Chen C, Yao Q. Reduced selenium-binding protein 1 in breast cancer correlates with poor survival and resistance to the anti-proliferative effects of selenium. PLoS ONE. (2013) 8:e63702. doi: 10.1371/journal.pone.0063702
32. Ansong E, Ying Q, Ekoue DN, Deaton R, Hall AR, Kajdacsy-Balla A, et al. Evidence that selenium binding protein 1 is a tumor suppressor in prostate cancer. PLoS ONE. (2015) 10:e0127295. doi: 10.1371/journal.pone.0127295
33. Caba O, Irigoyen A, Jimenez-Luna C, Benavides M, Ortuno FM, Gallego J, et al. Identification of gene expression profiling associated with erlotinib-related skin toxicity in pancreatic adenocarcinoma patients. Toxicol Appl Pharmacol. (2016) 311:113–6. doi: 10.1016/j.taap.2016.10.003
34. Raucci R, Colonna G, Guerriero E, Capone F, Accardo M, Castello G, et al. Structural and functional studies of the human selenium binding protein-1 and its involvement in hepatocellular carcinoma. Biochim Biophys Acta. (2011) 1814:513–22. doi: 10.1016/j.bbapap.2011.02.006
35. Chen F, Chen C, Qu Y, Xiang H, Ai Q, Yang F, et al. Selenium-binding protein 1 in head and neck cancer is low-expression and associates with the prognosis of nasopharyngeal carcinoma. Medicine. (2016) 95:e4592. doi: 10.1097/MD.0000000000004592
36. Silvers AL, Lin L, Bass AJ, Chen G, Wang Z, Thomas DG, et al. Decreased selenium-binding protein 1 in esophageal adenocarcinoma results from posttranscriptional and epigenetic regulation and affects chemosensitivity. Clin Cancer Res. (2010) 16:2009–21. doi: 10.1158/1078-0432.CCR-09-2801
37. Huang KC, Park DC, Ng SK, Lee JY, Ni X, Ng WC, et al. Selenium binding protein 1 in ovarian cancer. Int J Cancer. (2006) 118:2433–40. doi: 10.1002/ijc.21671
38. Wakita T, Hayashi T, Nishioka J, Tamaru H, Akita N, Asanuma K, et al. Regulation of carcinoma cell invasion by protein C inhibitor whose expression is decreased in renal cell carcinoma. Int J Cancer. (2004) 108:516–23. doi: 10.1002/ijc.11594
39. Jing Y, Jia D, Wong CM, Oi-Lin Ng I, Zhang Z, Liu L, et al. SERPINA5 inhibits tumor cell migration by modulating the fibronectin-integrin beta1 signaling pathway in hepatocellular carcinoma. Mol Oncol. (2014) 8:366–77. doi: 10.1016/j.molonc.2013.12.003
40. Asanuma K, Yoshikawa T, Hayashi T, Akita N, Nakagawa N, Hamada Y, et al. Protein C inhibitor inhibits breast cancer cell growth, metastasisand angiogenesis independently of its protease inhibitory activity. Int J Cancer. (2007) 121:955–65. doi: 10.1002/ijc.22773
41. Razavi M, Johnson LD, Lum JJ, Kruppa G, Anderson NL, Pearson TW. Quantification of a proteotypic peptide from protein C inhibitor by liquid chromatography-free SISCAPA-MALDI mass spectrometry: application to identification of recurrence of prostate cancer. Clin Chem. (2013) 59:1514–22. doi: 10.1373/clinchem.2012.199786
42. Bijsmans IT, Smits KM, de Graeff P, Wisman GB, van der Zee AG, Slangen BF, et al. Loss of SerpinA5 protein expression is associated with advanced-stage serous ovarian tumors. Modern Pathol. (2011) 24:463–70. doi: 10.1038/modpathol.2010.214
43. Yang H, Geiger M. Cell penetrating SERPINA5 (ProteinC inhibitor, PCI): More questions than answers. Semi Cell Dev Biol. (2017) 62:187–93. doi: 10.1016/j.semcdb.2016.10.007
44. Ignatiuk A, Quickfall JP, Hawrysh AD, Chamberlain MD, Anderson DH. The smaller isoforms of ankyrin 3 bind to the p85 subunit of phosphatidylinositol 3'-kinase and enhance platelet-derived growth factor receptor down-regulation. J Biol Chem. (2006) 281:5956–64. doi: 10.1074/jbc.M510032200
45. Hayashi A, Le Gal K, Sodersten K, Vizlin-Hodzic D, Agren H, Funa K. Calcium-dependent intracellular signal pathways in primary cultured adipocytes and ANK3 gene variation in patients with bipolar disorder and healthy controls. Mol Psychiatry. (2015) 20:931–40. doi: 10.1038/mp.2014.104
46. San-Cristobal P, Lainez S, Dimke H, de Graaf MJ, Hoenderop JG, Bindels RJ. Ankyrin-3 is a novel binding partner of the voltage-gated potassium channel Kv1.1 implicated in renal magnesium handling. Kidney Int. (2014) 85:94–102. doi: 10.1038/ki.2013.280
47. Bryda EC, Ling H, Rathbun DE, Burmeister M, Flaherty L. Fine genetic map of mouse chromosome 10 around the polycystic kidney disease gene, jcpk, and ankyrin 3. Genomics. (1996) 35:425–30. doi: 10.1006/geno.1996.0381
48. Del Vecchio F, Gallo F, Di Marco A, Mastroiaco V, Caianiello P, Zazzeroni F, et al. Bioinformatics approach to predict target genes for dysregulated microRNAs in hepatocellular carcinoma: study on a chemically-induced HCC mouse model. BMC Bioinformatics. (2015) 16:408. doi: 10.1186/s12859-015-0836-1
49. Wang T, Abou-Ouf H, Hegazy SA, Alshalalfa M, Stoletov K, Lewis J, et al. Ankyrin G expression is associated with androgen receptor stability, invasiveness, and lethal outcome in prostate cancer patients. J Mol Med. (2016) 94:1411–22. doi: 10.1007/s00109-016-1458-4
50. Sun M, Marconi L, Eisen T, Escudier B, Giles RH, Haas NB, et al. Adjuvant vascular endothelial growth factor-targeted therapy in renal cell carcinoma: a systematic review and pooled analysis. Euro Urol. (2018). doi: 10.1016/j.eururo.2018.05.002
51. Lenis AT, Donin NM, Johnson DC, Faiena I, Salmasi A, Drakaki A, et al. Adjuvant therapy for high risk localized kidney cancer: emerging evidence and future clinical trials. J Urol. (2018) 199:43–52. doi: 10.1016/j.juro.2017.04.092
52. Harshman LC, Xie W, Moreira RB, Bosse D, Ruiz Ares GJ, Sweeney CJ, et al. Evaluation of disease-free survival as an intermediate metric of overall survival in patients with localized renal cell carcinoma: a trial-level meta-analysis. Cancer. (2018) 124:925–33. doi: 10.1002/cncr.31154
Keywords: stage III, clear cell renal cell carcinoma, prognostic model, TCGA, GEO, multi-gene signature
Citation: Wu J, Jin S, Gu W, Wan F, Zhang H, Shi G, Qu Y and Ye D (2019) Construction and Validation of a 9-Gene Signature for Predicting Prognosis in Stage III Clear Cell Renal Cell Carcinoma. Front. Oncol. 9:152. doi: 10.3389/fonc.2019.00152
Received: 19 October 2018; Accepted: 22 February 2019;
Published: 19 March 2019.
Edited by:
Ana M. Molina, Cornell University, United StatesReviewed by:
Maik Werner Kschischo, Koblenz University of Applied Sciences, GermanyHiroaki Matsumoto, Yamaguchi University, Japan
Copyright © 2019 Wu, Jin, Gu, Wan, Zhang, Shi, Qu and Ye. This is an open-access article distributed under the terms of the Creative Commons Attribution License (CC BY). The use, distribution or reproduction in other forums is permitted, provided the original author(s) and the copyright owner(s) are credited and that the original publication in this journal is cited, in accordance with accepted academic practice. No use, distribution or reproduction is permitted which does not comply with these terms.
*Correspondence: Yuanyuan Qu, cXV5eTE5ODdAMTYzLmNvbQ==
Dingwei Ye, ZGluZ3dlaV95ZTE5NjNAMTYzLmNvbQ==
†These authors have contributed equally to this work