 Fabiola Lilí Sarmiento-Salinas1,2
 Alam Delgado-Magallón1,3José Benito Montes-Alvarado1
 Dalia Ramírez-Ramírez1Juan Carlos Flores-Alonso1Paulina Cortés-Hernández1Julio Reyes-Leyva1Irma Herrera-Camacho4Maricruz Anaya-Ruiz1
 Rosana Pelayo1
 Lourdes Millán-Pérez-Peña4
 Paola Maycotte5*
- 1Centro de Investigación Biomédica de Oriente, Instituto Mexicano del Seguro Social, Puebla, Mexico
- 2Posgrado en Ciencias Químicas, Benemérita Universidad Autónoma de Puebla, Puebla, Mexico
- 3Departamento de Bioquímica, Instituto Tecnológico de Acapulco, Acapulco de Juárez, Mexico
- 4Centro de Química, Instituto de Ciencias, Benemérita Universidad Autónoma de Puebla, Puebla, Mexico
- 5CONACYT-Centro de Investigación Biomédica de Oriente, Instituto Mexicano del Seguro Social, Puebla, Mexico
Due to their crucial role in cell metabolism and homeostasis, alterations in mitochondrial biology and function have been related to the progression of diverse diseases including cancer. One of the consequences associated to mitochondrial dysfunction is the production of reactive oxygen species (ROS). ROS are known to have a controversial role during cancer initiation and progression and although several studies have tried to manipulate intracellular ROS levels using antioxidants or pro-oxidation conditions, it is not yet clear how to target oxidation for cancer therapy. In this study, we found differences in mitochondrial morphology in breast cancer cells when compared to a non-tumorigenic cell line and differences in mitochondrial function among breast cancer subtypes when exploring gene-expression data from the TCGA tumor dataset. Interestingly, we found increased ROS levels in triple negative breast cancer (TNBC) cell lines and a dependency on ROS for survival since antioxidant treatment induced cell death in TNBC cells but not in an estrogen receptor positive (ER+) cell line. Moreover, we identified the mitochondria as the main source of ROS in TNBC cell lines. Our results indicate a potential use for ROS as a target for therapy in the TNBC subtype which currently has the worst prognosis among all breast cancers and remains as the only breast cancer subtype which lacks a targeted therapy.
Introduction
Breast cancer is a highly heterogeneous disease whose classification has proven to be central for proper patient management, follow-up, clinical trial selection and focus on translational research (1). Breast cancer classification has gradually shifted from a classification based on morphological findings into a more integrative approach which incorporates tumor biomarkers and molecular information. About 75% of breast tumors express the estrogen (ER) and/or progesterone (PgR) receptors and can be targeted with endocrine therapy. Hierarchical clustering of gene expression data of several tumors has led to the definition of molecular intrinsic tumor subgroups, classifying most ER+ tumors in the luminal subtype due to the expression of genes characteristic of luminal epithelial cells (2, 3). Patients with a low risk of relapse are found in the Luminal A subtype while patients in the Luminal B subgroup have a higher risk of relapse and their tumors express increased proliferation-related markers (1, 4, 5). More recently, integrative cluster classification based on DNA rearrangement patterns from whole genome sequencing data have further characterized ER+ tumors into 9 different subtypes with differences in clinical outcomes (1). About 10–15% of breast cancers over-express the HER2/erb2/neu receptor protein, a receptor tyrosine kinase that signals cellular proliferation and patients with HER2+ tumors used to have one of the worst prognoses until the advent of anti-HER2 targeted therapies (4). Molecularly, most of the HER2 enriched tumors are HER2+ by immunohistochemistry (4); and HER2+ tumors have been shown to have different combinations of mutations, supporting the existence of subclasses of HER2+ tumors and also indicating a high heterogeneity within this subgroup (1, 5). Finally, triple-negative breast cancer (TNBC), also classified as basal-like breast cancer, is defined by the absence of ER, PgR, and HER2 receptors and thus lacks a targeted therapy. Only chemotherapy options are available for this breast cancer subtype which has the worst prognosis in all cancer stages and also shows a great intrinsic diversity (6–8). Gene expression patterns have led to the identification of 6 different TNBC subgroups (6) and TNBC tumors show multiple copy number alterations affecting most of the chromosomes (1). Since basal-like breast cancers are identified by gene expression profiling and TNBC are characterized by analyzing the absence of receptors by immunohistochemistry, both terms are not strictly synonyms. It is known that approximately 25% of TNBC are not basal-like on gene expression, but it has also been shown that the TNBC phenotype enriches for basal-like cancer (9). Since TNBC cell lines used in this study have been defined as basal (10), both terms (TNBC and basal) are used for TNBC cell lines in this work.
So, despite recent advances in the classification of breast cancer that have led to effective targeted therapies for most patients, evidence suggests that there is a high heterogeneity in breast tumors even among the ones belonging to the same subtype and that patients would benefit the most from a precise classification and a targeted therapy for each individual tumor. On the other hand, finding targetable biological features for each breast cancer subtype has proven to be successful for ER(+)/luminal and HER2(+) patients (8), underscoring the need to find an effective, targeted therapy for TNBC patients.
One of the hallmarks of cancer cells is the de-regulation of cellular energetics in order to fuel cell growth and division (11). Otto Warburg first observed this anomaly in cancer cells which had a high glycolytic activity even in the presence of oxygen and proposed this metabolic shift to be a cancer driver. However, although multiple oncogenes commonly activated in cancer are known to activate glycolysis, they have been shown to also activate mitochondrial metabolism (12). These metabolic changes have brought attention to the role of mitochondria in tumorigenesis and tumor progression but there seems to be no simple explanation for the role of mitochondria in cancer. Instead, mitochondrial functions have been found to vary depending on genetic, environmental and tissue-of-origin differences between tumors (13). One of the characteristics associated with mitochondrial dysfunction is the production of ROS and sensitivity to ROS-induced apoptosis. In this regard, increased ROS have been found in diverse types of cancer and it has been suggested that increased ROS levels in non-transformed cells or in cancer cells could have pro-tumorigenic effects by damaging nucleic acids and promoting genomic instability. However, there is controversy in the literature regarding the role of ROS in tumor progression. While some studies indicate that ROS in cancer cells can activate pro-tumorigenic signaling pathways (14–16), other studies have shown that treatment with anti-oxidants accelerated tumor growth, metastasis and decreased survival in mouse models of cancer (17, 18). In this work, we studied differences in mitochondrial dynamics as well as in the production of ROS in breast cancer cell lines belonging to different subtypes of the disease with the purpose of identifying differences in mitochondrial-dynamics or ROS-related biomarkers which could work as molecular targets for therapy or lead to a better classification of the disease.
Materials and Methods
Hierarchical Clustering and Principal Component Analysis
Mitochondria-related genes were obtained from GSEA (19, 20) (mitochondria, OXPHOS signatures) and genes related to mitophagy and mitochondrial dynamics were added for a total of 167 different probes (Supplementary Table 1). ROS-related genes were selected from GSEA (GO_OXIDATION_REDUCTION_PROCESS; ANTIOXIDANT_ACTIVITY;andREACTOME_BIOLOGICAL_OXIDATIONS) as well as from a previously published ROS-signature and complemented with NOX-related genes for a total of 370 different probes (21) (Supplementary Table 1). Gene expression data was obtained from cbioportal.org using mRNA Expression Z scores from The Cancer Genome Atlas (TCGA); Nature, 2012 study (7). Molecular subtype classification in this sample set was performed according to the PAM50 gene signature assay. Samples with mutations were excluded from the mRNA expression analysis and after elimination of non-classified samples or non-available values, 518 samples were analyzed and Pearson hierarchical clustering as well as principal component analysis (PCA) was performed using Expander7 software (22).
Cell Culture
Breast cancer cell lines were cultured in the following media: MCF10A (DMEM/F12, Caisson DFP18-1LT, 5% horse serum, 0.5 μg/mL hydrocortisone, 20 ng/mL EGF, 100 ng/mL cholera toxin, 10 μg/mL insulin); MCF7 (Eagle's MEM, Caisson MEP-10X1LT, 10 μg/mL insulin, 10% fetal bovine serum, FBS); T47D (RPMI-1640, Caisson, RPP10-10XLT 7.5 μg/mL insulin, 10% FBS); MDAMB231 (DMEM/F12, 10% FBS); MDAMB468 (DMEM/F12, 10% FBS); BT549 (RPMI-1640, Caisson RPP10-10XLT, 7.5 μg/mL insulin, 10% FBS).
Mitotracker Labeling and Mitochondrial Classification
Mitochondria were labeled with Mitotracker Red CMXRos (ThermoFisher Scientific, M7512). Since fixation is known to disrupt the mitochondrial network (23), we used live cells for mitotracker labeling. Briefly, 100,000 cells were plated on coverslips and after 24 h stained with 250 nM Mitotracker Red in culture medium at 37°C, protected from light. After incubation, cells were washed twice, first with pre-warmed, serum free medium and then with complete medium. Live cells were mounted with 10 μl complete medium and immediately observed on a Zeiss Observer.Z1 microscope equipped with an Axiocam MRm camera and an Apotome illumination system with a 63X oil immersion objective. Cells were classified as completely tubular (I), tubular with some fragments (II), fragmented with some tubules (III), or completely fragmented (IV) as shown in Figure 2B by two independent observers.
For mitochondrial ROS labeling, cells grown in coverslips were incubated with 2 μM Mitosox Red (ThermoFisher Scientific, M36008) and 200 nM Mitotracker green (ThermoFisher Scientific, M7514) for 15 min in complete medium, washed with 1X PBS, mounted with 10 μl complete medium and immediately observed on a Zeiss Observer.Z1 microscope equipped with an Axiocam MRm camera and an Apotome illumination system with a 63X oil immersion objective.
ROS Measurement
ROS were evaluated by fluorescence microscopy and flow cytometry. For microscopy, 30,000 cells were plated in 24-well-plates and, after 24 h, stained with 10 μM dihydroethidium (Sigma Aldrich, D7008-10MG) in culture medium for 30 min at room temperature, protected from light. After incubation, cells were washed three times, first with pre-heated complete medium and then with PBS, fixed and stained with Hoechst. Stained cells were observed with 1 ml of PBS in a Zeiss Observer.Z1 microscope. ROS quantification was performed by flow cytometry. Briefly, 100,000 cells were plated on 6 well-plates and after 24 h stained with 10 μM DHE as previously described. After incubation, cells were washed tree times, first with pre-warmed complete medium and then with PBS, trypsinized and centrifuged at 2,500 rpm. The pellet was resuspended in PBS with 3% FBS for immediate analysis in a BD FACS Canto II flow cytometer. Graphs show mean fluorescence intensity minus autofluorescence control. For ROShigh and low populations, cells were analyzed according to the flow cytometry pipeline shown in Supplementary Figure 3 using Flow Jo V 10.0 software. For mitochondrial ROS evaluation cells were plated as for DHE staining but stained with 5 μM MitoSox Red in pre-warmed medium for 15 min at 37°C. After incubation, cells were washed twice, first with pre-warmed complete medium and then with PBS, trypsinized and centrifuged at 2,500 rpm, the pellet was resuspended in PBS with 3% FBS for immediate analysis in a BD FACS Canto II flow cytometer. Graphs show mean fluorescence intensity minus autofluorescence control.
Proliferation and Cell Death Assays
Cell proliferation was assessed in a live-cell Incucyte ZOOM System. Cells were plated at a density of 3,000–5,000 cells per well and after 24 h, treated with hydrogen peroxide (H2O2) or N- acetylcysteine at the indicated concentrations and imaged every 4 h for 24 h. Proliferation was evaluated using the Incucyte software and expressed as % confluency. Cell death was evaluated after 24 h with 10 μM propidium iodide (PI) staining for 10 min. Fluorescence images were taken in the Incucyte ZOOM system and cell death was expressed as % red (PI+) confluency/% total confluency.
Reagents
All reagents were purchased from Sigma Aldrich unless otherwise specified.
Statistical Analysis
Graphs show three or more independent experiments and every figure shows the mean ± standard error. T-tests, ANOVA and post-hoc tests were performed using GraphPad Prism 5 software. Tukey was performed when means were compared to every other mean and Dunnett's post-hoc was used for multiple-to one comparison in Figure 4. For two group mean comparison performed in Figure 4A, a student t-test was used.
Results
Mitochondrial Functional Status May Reveal Association With Breast Cancer Intrinsic Subtypes
Expression analysis of mitochondria-related genes in tumor samples from the TCGA dataset revealed clusters of samples related to molecular breast cancer subtypes, both when analyzed by unsupervised hierarchical clustering (Figure 1A) or principal component analysis (PCA, Figure 1B). Hierarchical clustering analysis revealed two major clusters (I and II). Cluster I was enriched in luminal samples while cluster II was more heterogeneous and two big sub-groups were observed. The first subgroup in cluster II was enriched in Basal-like tumors, which clustered together with HER2-enriched and some luminal samples. The other sub-group in cluster II had a small basal-like cluster, a HER-2 enriched cluster, a luminal B-enriched one and a big luminal cluster containing both Luminal A and B samples. Importantly, luminal tumors in cluster II, were more similar to basal and HER2-enriched tumors than to the other luminal samples in cluster I, evidencing Luminal tumors with potential differences in mitochondrial biology and function.
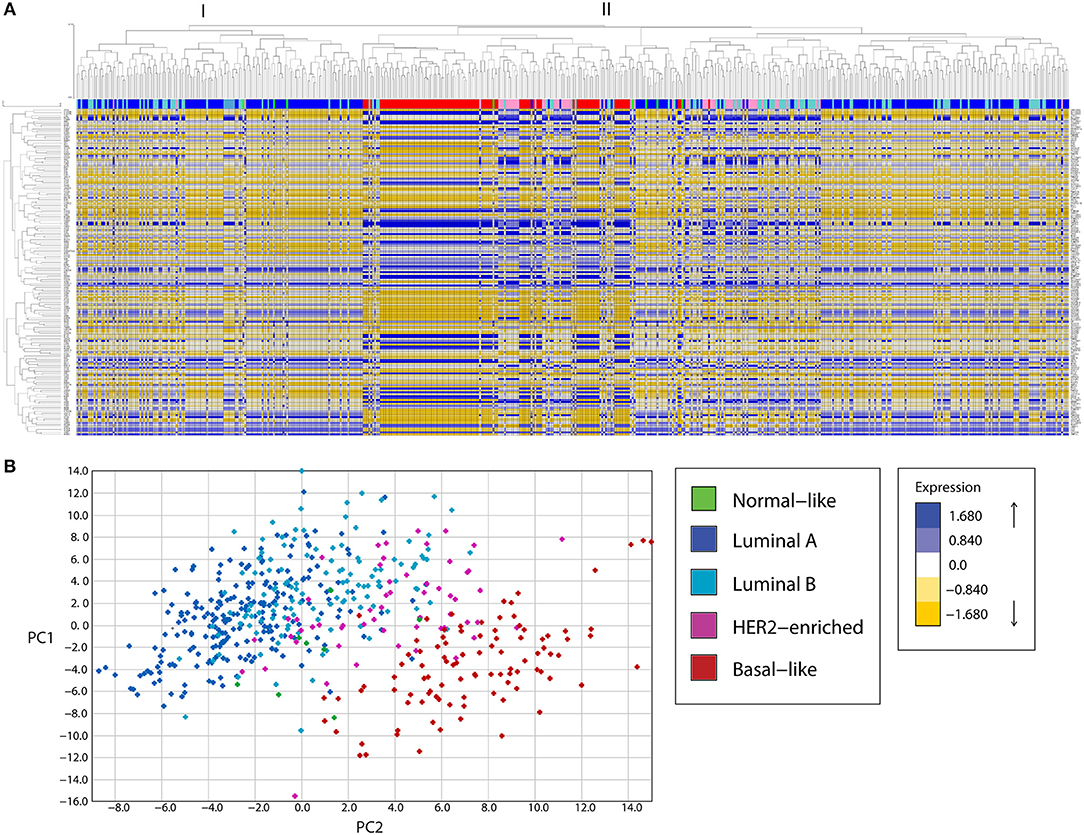
Figure 1. A mitochondria-related gene signature separates breast cancer tumor samples in clusters according to the tumor subtype, in a bioinformatic analysis of gene expression. (A) A mitochondria-related gene expression signature was analyzed in TCGA breast tumor samples using unsupervised hierarchical clustering analysis, revealing clusters of samples enriched in molecular subtypes. Two major clusters were found (I, II). Cluster I was enriched in luminal samples while cluster II showed two major sub-groups. The first subgroup was enriched in basal and HER-2 enriched samples while the other was heterogeneous with one sub-group enriched in luminal samples and another containing luminal B and HER2-enriched tumors. (B) Principal component analysis (PCA) revealed three main clusters, a cluster of Luminal A and B tumors (left), an intermediate group composed of HER2-enriched and some Luminal B samples and a Basal-like enriched cluster (right). PC, principal component.
Mitochondrial differences in breast cancer subtypes were more evident in a PCA analysis (Figure 1B) where a cluster of luminal A and B tumors was found to the left of the graph, followed by an intermediate group with HER2-enriched and luminal B samples and a well-defined Basal-like enriched cluster to the right of the graph which also included some HER2-enriched samples. Thus, PCA analysis of the expression of mitochondria-related genes clustered tumor samples not only according to breast cancer subtypes but also according to malignancy, with the most malignant triple negative or basal-like subtype to the right and the least malignant luminal A samples to the left of the graph (Figure 1B). These findings suggest important differences in mitochondrial function among tumors from different breast cancer subtypes. Importantly, luminal B samples were the most heterogeneous, with some samples clustering with Luminal A tumors (Figure 1B and also Figure 1A, cluster I) and others clustering with HER2-enriched tumors (Figure 1B and also Figure 1A, cluster II, sub-cluster vi). This likely reflects differences in the mitochondrial biology of Luminal B samples which are HER2+ and those which are HER2- and suggests a possible role for the HER2 receptor in the regulation of mitochondrial gene expression and function.
Mitochondrial shape has been extensively linked to mitochondrial function and although it is determined by a highly dynamic and regulated process, diverse cellular functions and alterations have been associated to changes in mitochondrial morphology (12, 24). Fluorescent mitochondrial labeling has been used to assess mitochondrial shape and changes in function in breast cancer cells and in cancer cells from other tissues (23, 25–27). Hence, we evaluated mitochondrial morphology in mitotracker-stained breast cancer cell lines representative of different subtypes (Figure 2A). We used MCF10A cells as a non-tumorigenic (NT) control and, according to the classification by Neve et al. (10), we used MCF7 and T47D cell lines as luminal cells and MDAMB231, MDAMB468, and BT549 as triple negative, basal-like cancer cell lines. Cells were classified as completely tubular (I), tubular with few fragments (II), fragmented with few tubules (III) or completely fragmented (IV) according to representative images in Figure 2B. We found an important difference in the number of cells classified as having mostly tubular mitochondria (I) between NT and breast cancer cell lines. The MCF10A cell line showed the highest tubular mitochondria when compared to cancer cells, indicating an important role for mitochondrial fission in breast cancer. Importantly, we found cells with fragmented mitochondria (IV) as being the most heterogeneous population among the cell lines, with a low percentage of fragmented mitochondria in MCF10A and a great diversity among the cancer cell lines studied. An image of the most representative mitochondrial morphology found in each cell line is shown in Figure 2C.
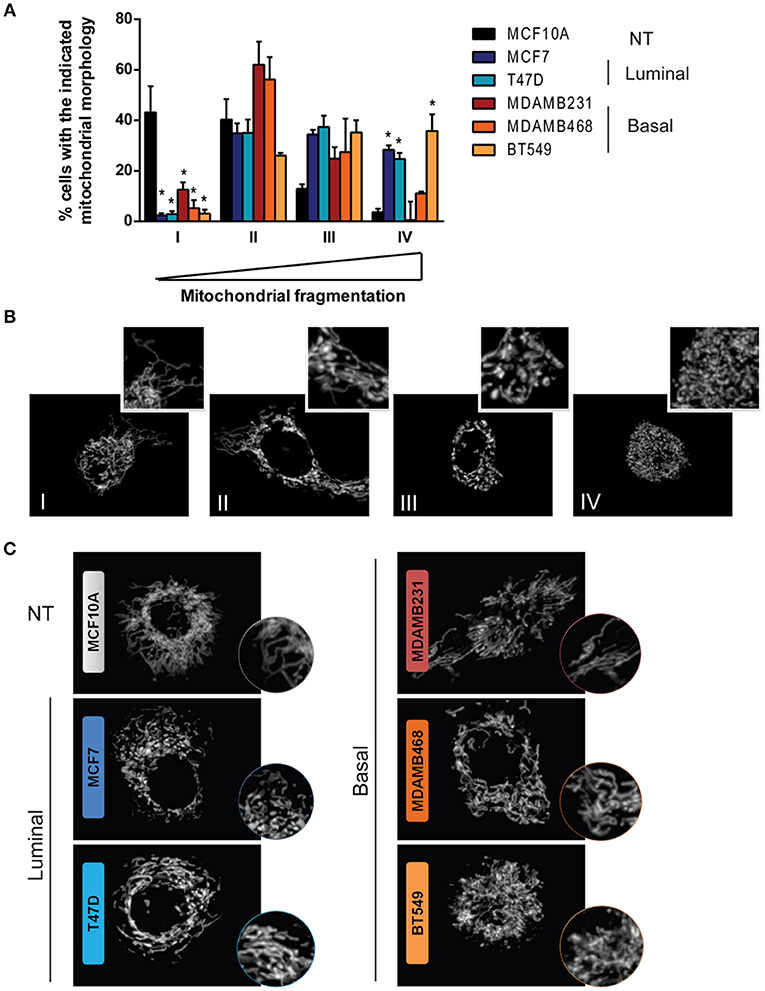
Figure 2. Breast cancer cell lines show differences in mitochondrial morphology and increased mitochondrial fragmentation than a non-tumorigenic cell line. (A) Mitotracker staining revealed differences in mitochondrial morphology among breast cancer cell lines. (B) Cells were classified as completely tubular (I), tubular with some fragments (II), fragmented with some tubules (III), or completely fragmented (IV). The graph in (A) shows the percentage of cells with the corresponding mitochondrial morphology as shown in (B). In (C) representative images of the characteristic morphology per cell line is shown. The graph in (A) shows mean ± SEM of 3–5 independent experiments. Sixty to one hundred individual cells were classified per experiment by two independent observers. *Different to MCF10A with p < 0.05.
We selected genes in mitochondrial gene signatures related to mitophagy, mitochondrial dynamics and biogenesis to evaluate differences in mitochondrial function among breast cancer subtypes. We found differences in the expression level of genes related to mitochondrial biology in tumors from the TCGA sample set according to the molecular classification of tumors (Table 1, Supplementary Figure 1). Significant changes in the expression level of genes related to mitochondrial dynamics were observed among breast cancer subtypes. Fusion-related (OPA1, MFN1) as well as fission related (DNM1L) genes were found to be increased in the basal-like subtype when compared to Luminal A tumor samples. However, adaptor proteins for Drp-1 on the outer mitochondrial membrane like MID49/MIEF2 or FIS1 (Table 1, Supplementary Figure 1), were found to be decreased in the basal-like subtype when compared to the other breast cancer subtypes, and no changes among the different subtypes were observed in MFF, another Drp-1 adaptor protein (Table 1). Importantly, decreased levels of mitophagy-related BNIP3L and PINK1, as well as increased levels of mitochondrial biogenesis related genes PPARGC1A and PPARGC1B were found in the basal-like tumor samples when compared to the Luminal A subtype (Table 1, Supplementary Figure 1). This evidence suggests changes in mitochondrial quality control mechanisms, turnover and important differences in mitochondrial biology among breast cancer subtypes.
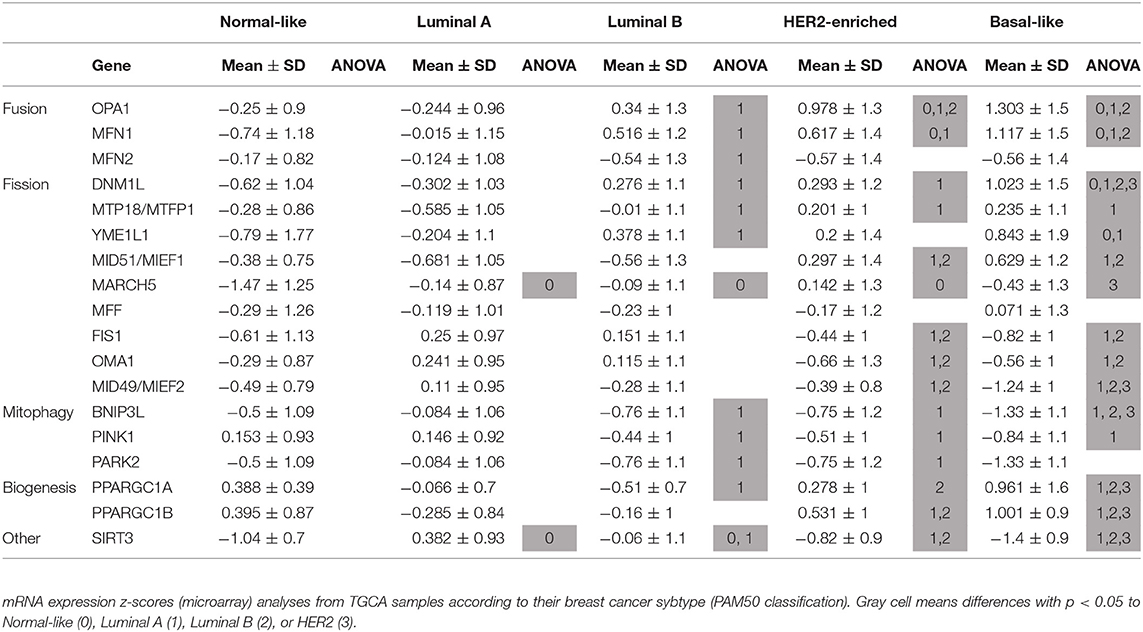
Table 1. Breast cancer subtypes show differences in the expression level of mitochondria-related genes.
TNBC Was Characterized by an Increased Oxidation State
Mitochondria have a crucial role in triggering redox signaling through ROS release from the electron transport chain (ETC) and ROS production is one of the aspects that has been involved in the promotion of malignancy by mitochondrial dysfunction (17). In this regard, ROS generation from mitochondria or from other cellular sources can contribute to the initiation of cancer in normal or non-malignant cells. Moreover, once a cell is transformed, redox signaling can amplify the malignant phenotype in terms of proliferation, survival, and migration through the activation of pro-tumorigenic signaling pathways (17, 28). Since we were particularly interested in TNBC, we analyzed ROS levels in the different TNBC cell lines under basal conditions using dihydroethidium (DHE) staining and compared to an ER+ and a non-tumorigenic control (Figures 3A–C). DHE is widely used as a small-molecule fluorescent ROS probe which is oxidized to 2-hydroxyethidium in the presence of and to ethidium enzymatically or in the presence of 1-electron oxidants, which reflect total oxidant generation (29, 30). Since both oxidation products are fluorescent in red and are not distinguishable in intact cells with the methods that we used (fluorescence microscopy and flow cytometry), we used DHE staining as a measurement of total ROS levels.
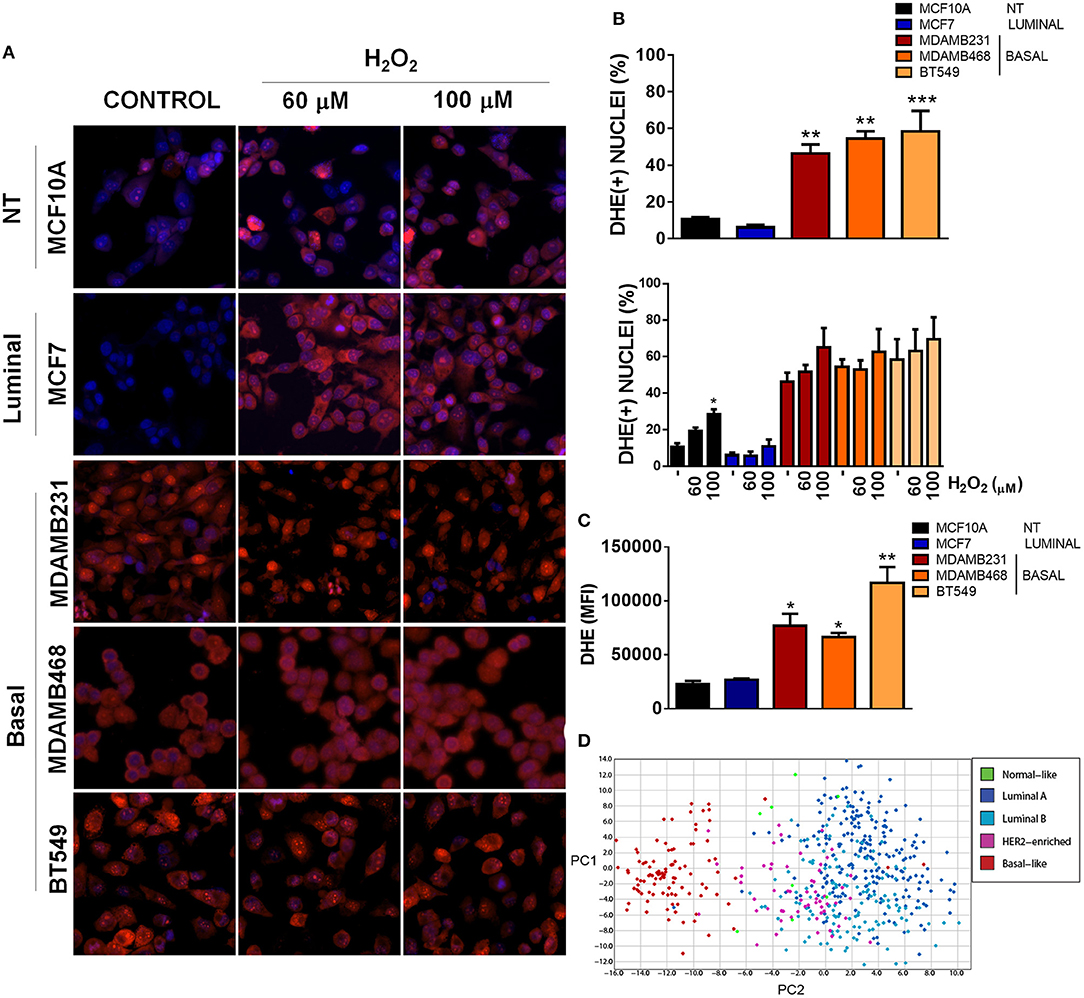
Figure 3. Basal, TNBC cell lines have elevated ROS levels when compared to non-tumorigenic or luminal breast cancer cell lines. (A) ROS levels were evaluated by fluorescence microscopy using dihydroethidium (DHE) staining (red) and total nuclei were stained with Hoechst (blue). Cells were treated with the indicated concentrations of H2O2. (B) DHE positive nuclei were counted and graphed as a percentage of total nuclei. (C) ROS levels were quantitatively evaluated by flow cytometry in the different cell lines. (D) A ROS-related gene signature PCA analysis clearly clustered basal-like tumors separate from the other breast cancer subtypes. Graphs show mean ± SEM of 3–5 independent experiments, *Different to MCF10A and MCF7 or to their respective control with *p < 0.05; **p < 0.01, and ***p < 0.001. PC, principal component.
We found increased DHE(+) nuclei in basal-like, TNBC cell lines with more than 45% DHE positive nuclei in the three TNBC cell lines studied (MDAMB231, MDAMB468 and BT549) when compared to the luminal (MCF7) or non-tumorigenic (MCF10A) cell lines (Figures 3A,B). Interestingly, H2O2 treatment increased DHE positive nuclei only in the non-tumorigenic, MCF10A cell line, probably indicating a better redox balance in cancer cells or a high oxidation status in TNBC cells that cannot be further increased by oxidants. Also, flow cytometry analysis of DHE mean fluorescence intensity in each cell line showed increased DHE staining in basal-like, TNBC cell lines when compared to the non-tumorigenic MCF10A or the ER+/luminal MCF7 cells (Figure 3C). Finally, expression analysis of a ROS gene signature in tumor samples from the TCGA dataset clearly separated basal-like tumors from the other breast cancer subtypes, both when analyzed by unsupervised hierarchical clustering (Supplementary Figure 2) or principal component analysis (PCA, Figure 3D), indicating that oxidant and anti-oxidant gene expression is similar among basal-like tumor samples and different to other breast cancer subtypes. Thus, TNBC cells had a high level of oxidation when compared to cell lines from other subtypes, which could not be further increased with H2O2 treatment.
Mitochondrial ROS Sustain Oncogenic Signaling and Survival in TNBC
To test if elevated ROS levels sustained oncogenic signaling and survival of TNBC cells, we used H2O2 to induce oxidation or the antioxidant N-acetyl cysteine (NAC) to decrease basal ROS levels in TNBC cell lines and compared to an ER+ cell line (MCF7) with low oxidation levels (Figure 4A). H2O2 treatment increased the ROShigh population and/or decreased the relative frequency in the ROSlow population in the cancer cell lines studied. NAC treatment decreased the relative frequency of the ROShigh or increased the ROSlow population (Figure 4A). We measured cell confluency as a measure of cellular viability and cell death using the cell impermeable dye propidium iodide (PI). Dead cells with compromised plasma membrane are permeable to the dye and red nuclei represent dead cells (Figures 4B,C). The MCF7 luminal breast cancer cell line was sensitive to H2O2 treatment since increased PI staining as well as decreased proliferation was observed (Figures 4B–D), whereas with NAC treatment, only proliferation was affected (decreased, Figure 4D) and no induction of cell death was observed (Figures 4B,C). Interestingly, TNBC cell lines (MDAMB231, MDAMB468, and BT549) showed the most striking changes in cell morphology, increased cell death, and decreased proliferation after antioxidant treatment (Figures 4B–D). Surprisingly, H2O2 had no effect on cell death (Figures 4B,C) or cell proliferation (Figure 4D) on MDAMB231 and MDAMB468 TNBC cell lines and both NAC and H2O2 induced cell death in the BT549 TNBC cell line. These results suggest that high ROS levels are responsible for maintaining oncogenic signaling in TNBC cells.
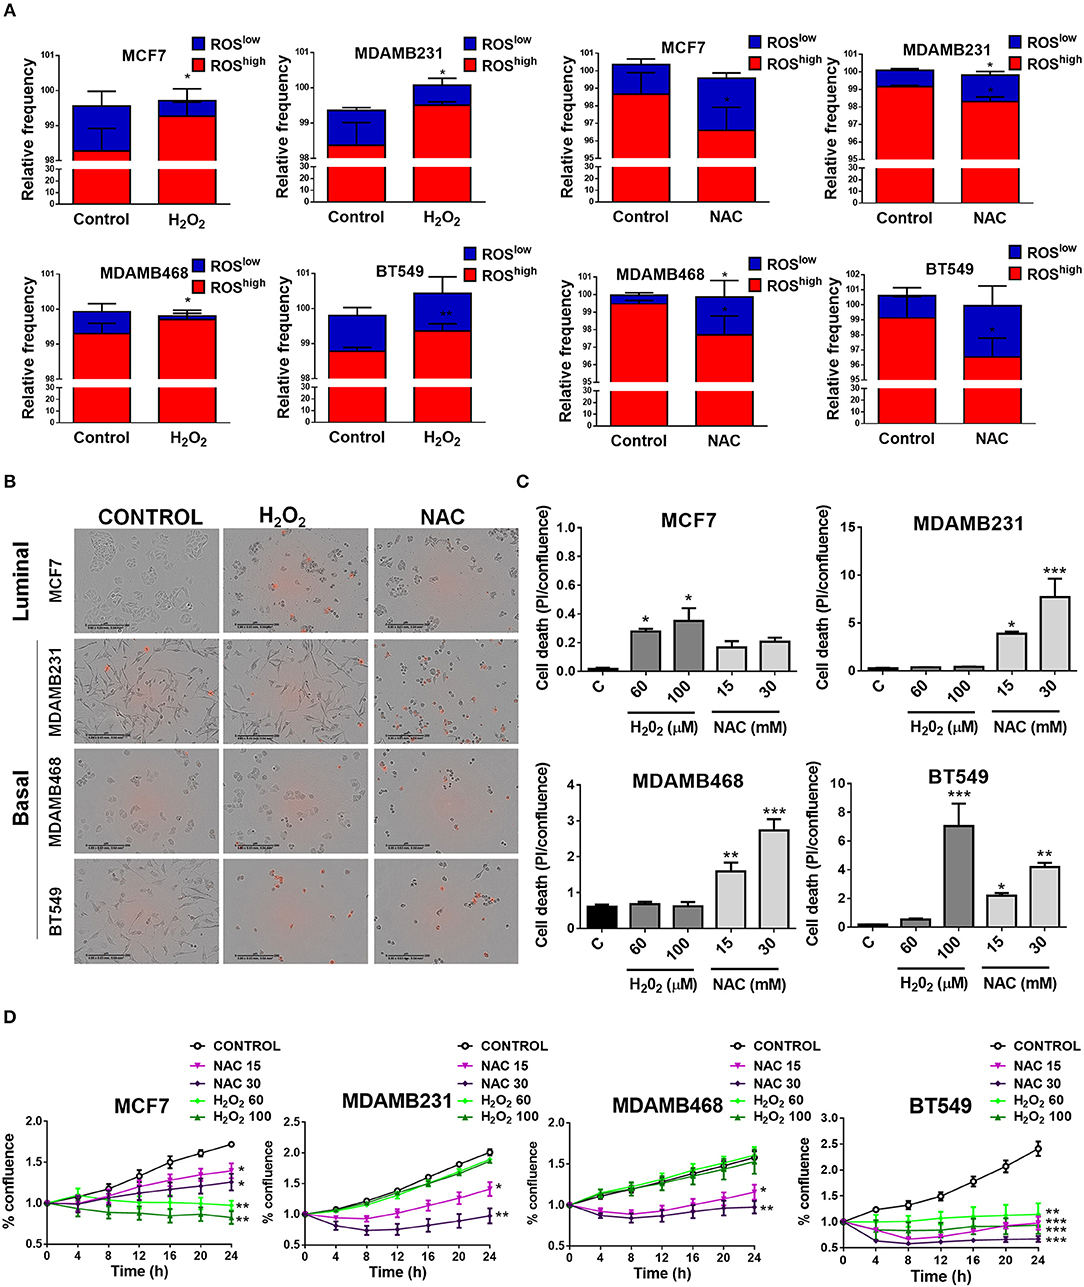
Figure 4. Basal, TNBC cell lines are dependent on ROS for survival. (A) Cells were treated with oxidating conditions (H2O2) or with an antioxidant (NAC, N-acetyl cysteine) at the indicated concentrations. One hundred micromolar H2O2 treatment increased the ROShigh or decreased the ROSlow population and 30 mM NAC had the opposite effect in all breast cancer cell lines studied. (B,C) Cell death was evaluated as propidium iodide staining [% confluency of PI(+) cells] and normalized to total % confluency. (D) Cell proliferation was evaluated as changes in cell confluency in an Incucyte real time cell imaging system. Graphs show mean ± SEM of more than 3 independent experiments. *different to control, p < 0.05; **different to control, p < 0.01; and ***different to control, p < 0.001.
In order to evaluate the source of ROS production, we explored if elevated ROS in TNBC cell lines were derived from mitochondria by co-staining cell lines with MitoSox (red) to evaluate mitochondrial ROS production and MitoTracker (green) to stain mitochondria and compared to ER+ MCF7 or non-tumorigenic MCF10A cell lines (Figure 5A). MitoSox is a DHE derivative with an additional cationic triphenylphosphonium group (TPP+). Due to its positive charge, MitoSox preferentially accumulates within the mitochondrial matrix and its red fluorescent oxidation products have been used to measure mitochondrial ROS production (31).
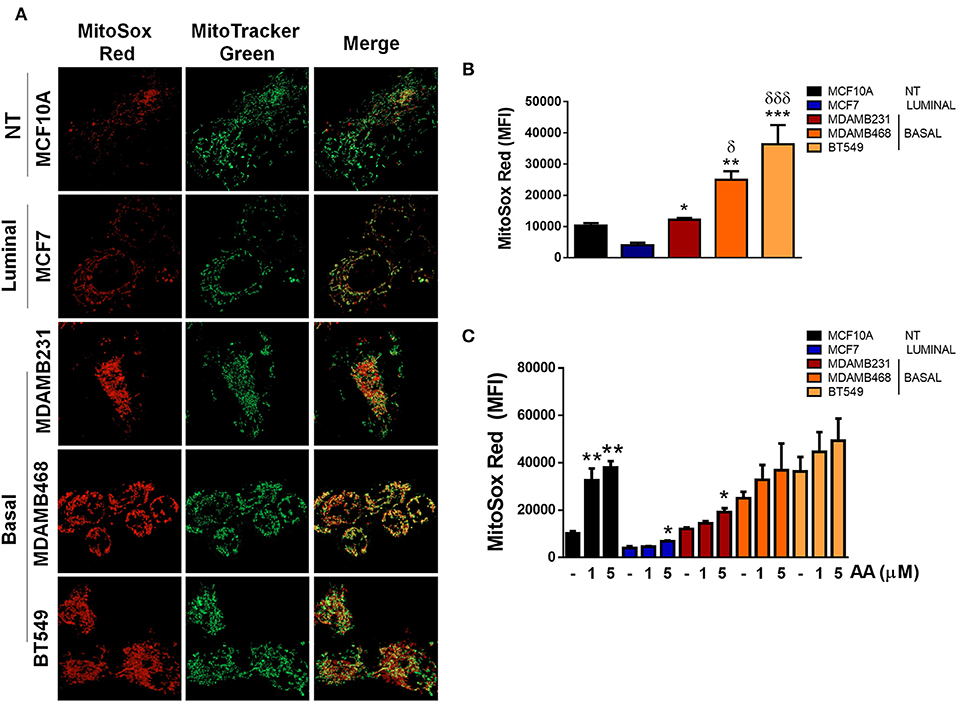
Figure 5. ROS in basal, TNBC cell lines are derived from the mitochondria. (A) Mitochondria were stained with Mitotracker (green) and MitoSox (red) to evaluate production of mitochondrial ROS. (B) Quantification of MitoSox fluorescence was performed by flow cytometry in basal conditions or (C) in cells treated with Antimycin A (AA) at the indicated concentrations. Graphs show mean ± SEM of 3 independent experiments. In (B) *different to MCF7 and δdifferent to MCF10A. In (C) *different to control. *p < 0.05; **p < 0.01; ***p < 0.001; *δ <0.05; and ***δδδ <0.001.
We found increased MitoSox staining in all the TNBC cell lines studied as well as increased co-localization of both stains indicating higher mitochondrial ROS production in the TNBC cell lines (Figure 5A). In addition, MitoSox levels were higher in the TNBC cell lines when compared to the luminal MCF7 cell line when MitoSox fluorescence intensity was quantified by flow cytometry (Figure 5B). Importantly, antimycin A (AA), a mitochondrial complex III inhibitor, only increased MitoSox fluorescence in the MCF10A, MCF7, and MDAMB231 cell lines, probably indicating that MDAMB468 and BT549 cell line mitochondria were producing high mitochondrial ROS in basal conditions that cannot be further increased by AA treatment (Figure 5C). Although the MDAMB231 TNBC cell line had increased MitoSox levels when compared to the MCF7 cell line, it showed high DHE fluorescence (Figure 3C) and its DHE fluorescence intensity was similar to MDAMB468 cells. Furthermore, frequency of MitoSoxhigh cells was lower than the DHEhigh population in both the MDAMB231 and MDAMB468 but not in the BT549 cell line (Supplementary Figure 4). The previous data indicate that the MDAMB231 and the MDAMB468 cell line, to a lesser extent, have active ROS sources additional to the mitochondria that contribute to the maintenance of their high oxidation state.
Discussion
Alterations in mitochondrial dynamics and function have been related to malignancy in different types of cancer. In breast cancer, increased mitochondrial fission-related Drp1 protein levels have been found in breast carcinomas and lymph node metastases (25), increased mitochondrial fission has been observed in TNBC cell lines and it has been shown that mitochondrial fission is necessary for cell migration and invasion (25). It has also been shown that invasive breast cancer cells have increased oxidative phosphorylation (OXPHOS), mitochondrial biogenesis, and oxygen consumption rates when compared to their non-invasive counterparts (32). Differences in mitochondrial mass have been observed in primary human breast tumors (33), and mitochondria from breast cancer cell lines with different metastatic capacities have been shown to have different functional characteristics (34). In agreement with the previously published reports, a mitochondria-related gene signature clustered breast cancer tumor samples according to their intrinsic subtype (Figure 1) and we found important differences in mitochondrial morphology when comparing the non-tumorigenic MCF10A with all the breast cancer cell lines tested (Figures 2A,C). Breast cancer cell lines had more fragmented mitochondria than the non-tumorigenic cell line, which had almost 40% of cells with a tubular morphology (I) while all the cancer cell lines had < 15% indicating an important role for mitochondrial fragmentation in transformation. However, despite significant differences in the expression levels of genes related to mitochondrial dynamics among breast tumor subtypes (Table 1, Supplementary Figure 1), we did not find a clear relationship between mitochondrial morphology and breast cancer subtype in the cell lines studied. Although luminal cell lines MCF7 and T47D showed a very similar mitochondrial morphology, mitochondrial shape from basal, TNBC cell lines was highly heterogeneous (Figure 2A). Nevertheless, the basal-like subtype was the most different to other breast cancer subtypes with regards to changes in mitochondria-related gene expression (Table 1, Figure 1), suggesting mitochondrial alterations different to mitochondrial shape. So, although protein levels of individual mitochondrial-dynamics related proteins (e.g., Drp1) have been related to increased levels of malignancy (25), the global changes in mitochondria-related gene expression that we studied (Figure 1), clustered breast cancer samples according to tumor subtypes and seem to be related to changes in mitochondrial function rather to a specific mitochondrial morphology. Indeed, we found increased DNM1L/Drp1 mRNA levels in Basal-like breast cancer samples (Table 1, Supplementary Figure 1) but we also found increased mitochondrial fusion and biogenesis-related gene expression, as well as decreased mitophagy-related genes, suggesting global changes in mitochondrial function beyond mitochondrial morphology. Importantly, changes in mitochondrial gene expression, particularly of genes related to mitochondrial dynamics could also reflect a distinct association of mitochondria with other organelles, like the endoplasmic reticulum, which has been shown to regulate cellular processes like endoplasmic reticulum stress, autophagy and inflammasome signaling (35), but this was not evaluated in this study.
One of the consequences of mitochondrial disfunction that has been involved in several aspects of carcinogenesis is the production of ROS and elevated ROS levels have been found in tumor cells from different tissues (14, 36). In this regard, it has been proposed that cancer cells are able to modulate their antioxidant capacity to achieve a different redox balance than normal cells. In this setting, overproduction of ROS due to oncogenic signaling or metabolic alterations has been shown to result in increased antioxidant capacity that is able to maintain oncogenic ROS signaling, allowing disease progression and avoiding cell death (28). Oncogenic signaling pathways that are known to be activated by ROS include the NF-kB (37), NRF2, Wnt (38), and EGFR signaling pathways (39, 40). Also, ROS have been shown to activate the tumor suppressor p53 and mediate apoptosis (41). Importantly, basal-like tumors are known to present TP53 loss of function in most, if not all, tumors and show amplification of the RAS-RAF-MEK pathway including amplifications in EGFR (7). We found increased ROS levels in TNBC cell lines when compared to a non-tumorigenic or an ER+/luminal breast cancer cell line. The increased oxidation state was necessary for cell survival since antioxidant treatment induced cell death in TNBC cell lines and not in non-tumorigenic or an ER+/luminal breast cancer cell line. Our results demonstrate that increased ROS production in TNBC cell lines have a pro-tumorigenic role by sustaining the oncogenic signaling necessary for their proliferation and survival and suggest that the loss of function of p53 characteristic of this type of breast cancer might be necessary to survive this strongly oxidizing conditions. Mitochondrial ROS were the main source of ROS in TNBC cell lines (Figure 5) and mitochondrial ROS levels were related to mitochondrial shape (Figure 2), since MitoSox fluorescence correlated with the percentage of cells in the fragmented classification (IV, Figure 2A) for the TNBC subtype. Our results relate differences in mitochondrial shape among TNBC cell lines with mitochondrial ROS production and suggest that those TNBC cell lines with low levels of fragmented mitochondria (e.g., MDAMB231 cell line) could have additional ROS sources to maintain oxidative conditions and signaling, while those TNBC cells with high levels of fragmented mitochondria (BT549) would rely only on mitochondrial ROS production to sustain oncogenic signaling.
In the literature, there is conflicting evidence regarding the use of antioxidants during cancer progression and treatment. In normal cells or pre-cancerous lesions, ROS have been proposed to induce DNA damage and increase oncogenic mutations, raising the possibility that dietary supplementation with antioxidants could suppress the initiation or progression of some types of cancer. However, antioxidant treatment is known to suppress cancer initiation in some contexts and increase cancer progression in others (16). Moreover, the use of dietary antioxidants has not been shown to reduce cancer incidence and in fact, antioxidant supplementation has actually increased incidence and death from some types of cancer including lung cancer (42) or increase the risk of developing another type of unrelated diseases (43, 44). In cancer progression models there is also contradictory evidence regarding the use of antioxidants for the treatment of cancer. For instance, in a melanoma mouse model, metastatic cells had higher cytoplasmic and mitochondrial ROS levels and lower mitochondrial mass. The authors proposed that the high levels of oxidation in metastasis are limiting for the establishment of metastasis, since the treatment with antioxidants increased the number of circulating tumor cells and metastatic burden without affecting the growth of the tumor (45). On the other hand, in another study, highly metastatic cells were found to have increased mitochondrial activity and superoxide production. In this case, antioxidant treatment decreased migration and invasiveness which was proposed to be due to ROS-mediated Src activation in tumor cells (46). In breast cancer, in the PyMT mouse cancer model, mice with decreased glutathione content due to deficiency in GCLM (glutamate cysteine ligase modifier), a subunit of glutamate cysteine ligase, necessary for glutathione synthesis or mice treated with BSO (buthionine-[S,R]-sulfoximine) to chemically inhibit glutathione synthesis, had decreased mammary tumor burden. When formed, tumors in PyMT-Gclm-/- mice, showed reduced proliferation and progression (47). So, at least in this model, pre-cancerous lesions need the antioxidant effect of glutathione to progress to breast cancer, which would argue against the use of antioxidants for breast cancer treatment. On the other hand, also in breast cancer, antioxidant treatment decreased DNA lesions and tumorigenesis in a murine model of BRCA1-deficient, p53+/− breast cancer, where excessive estrogen metabolism increased cancer cell ROS production and DNA damage (48). Also, ROS scavenging by overexpression of exogenous EcSOD (extracellular superoxide dismutase), decreased invasion of breast cancer cells in vitro (49), and decreased metastasis in vivo in TNBC mouse models (50). Moreover, increased ROS levels have been associated with BRCA1 mutations in this type of breast cancer (40).
In agreement with the previous studies, where BRCA1 mutations, which predispose to TNBC have been found to have increased ROS levels, our data shows increased ROS levels in all the TNBC cell lines studied in comparison to an ER+ breast cancer cell line or the non-tumorigenic cells. Moreover, high ROS levels seem to be necessary for the maintenance and survival of this type of cancer since antioxidant treatment greatly decreased proliferation and induced cell death. Our results suggest a potential use for ROS or oxidation products in cancer cells as biomarkers of malignancy in TNBC which is currently diagnosed by the absence of immunohistochemistry biomarkers. Furthermore, mitochondrial ROS could function as a therapeutic target against this cancer subtype, which currently lacks a targeted therapy. Our data explains controversies in the literature regarding the use of antioxidants for cancer therapy and we propose that antioxidant treatments should only be used in those cancer cells with high basal ROS levels which are likely to use this pro-oxidant conditions to sustain oncogenic signaling. Our results also suggest that a similar approach could be used in those types of cancer which have been shown to have increased oxidation levels or similar mechanisms of transformation as TNBC (e.g., BRCA1 inactivation, RB1 loss, TP53 inactivation or amplifications in the MAPK pathway) (7). In this regard, serous ovarian carcinomas have been shown to have a similar mutation and expression profile as TNBC (7) and has also been shown to manifest a pro-oxidant state (51), indicating a potential use for antioxidant treatment in this type of cancer. Other cancer types that have also been characterized by increased oxidation levels and in which a role of ROS has been proposed in the promotion of malignancy include prostate (52), gastric (53, 54), and pancreatic cancer (55). Importantly, our data also suggests that antioxidant treatment should not be suggested as a general therapy for cancer in these tissues since heterogeneity in tumors from those tissues has also been reported (56–58) and a careful analyses of those cancer subtypes which utilize pro-oxidant signaling for survival should be performed.
Our data also suggests a possible explanation for the anti-cancer effect of drugs with yet unclear mechanisms of action like metformin. This drug has been shown to have anti-cancer effects on breast (59) and other types of cancer (60, 61), has been proposed to have an antioxidant effect (62), and is known to be particularly effective on the TNBC subtype (63). So, our results indicate a potential use for this drug or for antioxidant nutraceuticals (64) for the treatment of this type of cancer and for cancers with similar mechanisms of oncogenicity involving increased oxidation states.
Finally, our results underscore the role of mitochondrial ROS production in sustaining oncogenic signaling in the basal, TNBC subtype as the main, but likely not only, source of ROS and highlights their potential use as a therapeutic target in this breast cancer subtype with current limited therapeutic options.
Data Availability
All datasets generated for this study are included in the manuscript and/or the Supplementary Files.
Author Contributions
FS-S, PC-H, RP, LM-P-P, and PM contributed conception and design of the study. FS-S, AD-M, JM-A, DR-R, and JF-A performed the experiments. FS-S, JR-L, IH-C, MA-R, RP, and PM wrote sections of the manuscript. All authors contributed to manuscript revision, read and approved the submitted version.
Funding
This work was supported with the following projects from the Instituto Mexicano del Seguro Social: FIS/IMSS/PROT/PRIO/15/049; CTFIS/1ORD/012/2011 and from CONACYT: CB-2015-01 258123. FS-S was a recipient of a CONACYT (291137) and IMSS scholarships (97221301) and VIEP-BUAP 2018 support for doctoral students. JR-L was supported by Fundación IMSS. PM is a recipient of a Catedra CONACYT for young investigators (CONACYT/3103).
Conflict of Interest Statement
The authors declare that the research was conducted in the absence of any commercial or financial relationships that could be construed as a potential conflict of interest.
Supplementary Material
The Supplementary Material for this article can be found online at: https://www.frontiersin.org/articles/10.3389/fonc.2019.00480/full#supplementary-material
References
1. Russnes HG, Lingjaerde OC, Borresen-Dale AL, Caldas C. Breast cancer molecular stratification: from intrinsic subtypes to integrative clusters. Am J Pathol. (2017) 187:2152–62. doi: 10.1016/j.ajpath.2017.04.022
2. Sorlie T. Molecular portraits of breast cancer: tumour subtypes as distinct disease entities. Eur J Cancer. (2004) 40:2667–75. doi: 10.1016/j.ejca.2004.08.021
3. Sorlie T. The impact of gene expression patterns in breast cancer. Clin Chem. (2016) 62:1150–1. doi: 10.1373/clinchem.2015.253229
4. Prat A, Perou CM. Deconstructing the molecular portraits of breast cancer. Mol Oncol. (2011) 5:5–23. doi: 10.1016/j.molonc.2010.11.003
5. Coates AS, Winer EP, Goldhirsch A, Gelber RD, Gnant M, Piccart-Gebhart M, et al. Tailoring therapies–improving the management of early breast cancer: St. Gallen international expert consensus on the primary therapy of early breast cancer 2015. Ann Oncol. (2015) 26:1533–46. doi: 10.1093/annonc/mdv221
6. Lehmann BD, Bauer JA, Chen X, Sanders ME, Chakravarthy AB, Shyr Y, et al. Identification of human triple-negative breast cancer subtypes and preclinical models for selection of targeted therapies. J Clin Investigat. (2011) 121:2750–67. doi: 10.1172/JCI45014
7. The Cancer Genome Atlas T. Comprehensive molecular portraits of human breast tumours. Nature. (2012) 490:61–70. doi: 10.1038/nature11412
8. Howlader N, Cronin KA, Kurian AW, Andridge R. Differences in breast cancer survival by molecular subtypes in the United States. Cancer Epidemiol Biomarkers Prev. (2018) 27:619–26. doi: 10.1158/1055-9965.EPI-17-0627
9. Kumar P, Aggarwal R. An overview of triple-negative breast cancer. Arch Gynecol Obstet. (2016) 293:247–69. doi: 10.1007/s00404-015-3859-y
10. Neve RM, Chin K, Fridlyand J, Yeh J, Baehner FL, Fevr T, et al. A collection of breast cancer cell lines for the study of functionally distinct cancer subtypes. Cancer Cell. (2006) 10:515–27. doi: 10.1016/j.ccr.2006.10.008
11. Hanahan D, Weinberg RA. Hallmarks of cancer: the next generation. Cell. (2011) 144:646–74. doi: 10.1016/j.cell.2011.02.013
12. Maycotte P, Marin-Hernandez A, Goyri-Aguirre M, Anaya-Ruiz M, Reyes-Leyva J, Cortes-Hernandez P. Mitochondrial dynamics and cancer. Tumour Biol. (2017) 39:1-16. doi: 10.1177/1010428317698391
13. Vyas S, Zaganjor E, Haigis MC. Mitochondria and cancer. Cell. (2016) 166:555–66. doi: 10.1016/j.cell.2016.07.002
14. Barrera G. Oxidative stress and lipid peroxidation products in cancer progression and therapy. ISRN Oncol. (2012) 2012:137289. doi: 10.5402/2012/137289
15. Huang Q, Zhan L, Cao H, Li J, Lyu Y, Guo X, et al. Increased mitochondrial fission promotes autophagy and hepatocellular carcinoma cell survival through the ROS-modulated coordinated regulation of the NFKB and TP53 pathways. Autophagy. (2016) 12:999–1014. doi: 10.1080/15548627.2016.1166318
16. Chio IIC, Tuveson DA. ROS in cancer: the burning question. Trends Mol Med. (2017) 23:411–29. doi: 10.1016/j.molmed.2017.03.004
17. Sabharwal SS, Schumacker PT. Mitochondrial ROS in cancer: initiators, amplifiers or an Achilles' heel? Nat Rev Cancer. (2014) 14:709–21. doi: 10.1038/nrc3803
18. Liou GY, Storz P. Detecting reactive oxygen species by immunohistochemistry. Methods Mol Biol. (2015) 1292:97–104. doi: 10.1007/978-1-4939-2522-3_7
19. Mootha VK, Lindgren CM, Eriksson KF, Subramanian A, Sihag S, Lehar J, et al. PGC-1alpha-responsive genes involved in oxidative phosphorylation are coordinately downregulated in human diabetes. Nat Genet. (2003) 34:267–73. doi: 10.1038/ng1180
20. Subramanian A, Tamayo P, Mootha VK, Mukherjee S, Ebert BL, Gillette MA, et al. Gene set enrichment analysis: a knowledge-based approach for interpreting genome-wide expression profiles. Proc Natl Acad Sci USA. (2005) 102:15545–50. doi: 10.1073/pnas.0506580102
21. Bime C, Zhou T, Wang T, Slepian MJ, Garcia JG, Hecker L. Reactive oxygen species-associated molecular signature predicts survival in patients with sepsis. Pulm Circ. (2016) 6:196–201. doi: 10.1086/685547
22. Ulitsky I, Maron-Katz A, Shavit S, Sagir D, Linhart C, Elkon R, et al. Expander: from expression microarrays to networks and functions. Nat Protoc. (2010) 5:303–22. doi: 10.1038/nprot.2009.230
23. Giedt RJ, Fumene Feruglio P, Pathania D, Yang KS, Kilcoyne A, Vinegoni C, et al. Computational imaging reveals mitochondrial morphology as a biomarker of cancer phenotype and drug response. Sci Rep. (2016) 6:32985. doi: 10.1038/srep32985
24. Wai T, Langer T. Mitochondrial dynamics and metabolic regulation. Trends Endocrinol Metabol TEM. (2016) 27:105–17. doi: 10.1016/j.tem.2015.12.001
25. Zhao J, Zhang J, Yu M, Xie Y, Huang Y, Wolff DW, et al. Mitochondrial dynamics regulates migration and invasion of breast cancer cells. Oncogene. (2013) 32:4814–24. doi: 10.1038/onc.2012.494
26. Kashatus JA, Nascimento A, Myers LJ, Sher A, Byrne FL, Hoehn KL, et al. Erk2 phosphorylation of Drp1 promotes mitochondrial fission and MAPK-driven tumor growth. Mol Cell. (2015) 57:537–51. doi: 10.1016/j.molcel.2015.01.002
27. Serasinghe MN, Wieder SY, Renault TT, Elkholi R, Asciolla JJ, Yao JL, et al. Mitochondrial division is requisite to RAS-induced transformation and targeted by oncogenic MAPK pathway inhibitors. Mol Cell. (2015) 57:521–36. doi: 10.1016/j.molcel.2015.01.003
28. Moloney JN, Cotter TG. ROS signalling in the biology of cancer. Semin Cell Dev Biol. (2018) 80:50–64. doi: 10.1016/j.semcdb.2017.05.023
29. Wang X, Fang H, Huang Z, Shang W, Hou T, Cheng A, et al. Imaging ROS signaling in cells and animals. J Mol Med. (2013) 91:917–27. doi: 10.1007/s00109-013-1067-4
30. Fernandes DC, Goncalves RC, Laurindo FR. Measurement of superoxide production and NADPH oxidase activity by HPLC analysis of dihydroethidium oxidation. Methods Mol Biol. (2017) 1527:233–49. doi: 10.1007/978-1-4939-6625-7_19
31. Forkink M, Smeitink JA, Brock R, Willems PH, Koopman WJ. Detection and manipulation of mitochondrial reactive oxygen species in mammalian cells. Biochim Biophys Acta. (2010) 1797:1034–44. doi: 10.1016/j.bbabio.2010.01.022
32. Lebleu VS, O'connell JT, Gonzalez Herrera KN, Wikman H, Pantel K, Haigis MC, et al. PGC-1alpha mediates mitochondrial biogenesis and oxidative phosphorylation in cancer cells to promote metastasis. Nat Cell Biol. (2014) 16:992–1003. doi: 10.1038/ncb3039
33. Boland ML, Chourasia AH, Macleod KF. Mitochondrial dysfunction in cancer. Front Oncol. (2013) 3:292. doi: 10.3389/fonc.2013.00292
34. Tu YF, Kaipparettu BA, Ma Y, Wong LJ. Mitochondria of highly metastatic breast cancer cell line MDA-MB-231 exhibits increased autophagic properties. Biochim Biophys Acta. (2011) 1807:1125–32. doi: 10.1016/j.bbabio.2011.04.015
35. Van Vliet AR, Verfaillie T, Agostinis P. New functions of mitochondria associated membranes in cellular signaling. Biochim Biophys Acta. (2014) 1843:2253–62. doi: 10.1016/j.bbamcr.2014.03.009
36. Gu H, Huang T, Shen Y, Liu Y, Zhou F, Jin Y, et al. Reactive oxygen species-mediated tumor microenvironment transformation: the mechanism of radioresistant gastric cancer. Oxid Med Cell Longev. (2018) 2018:8. doi: 10.1155/2018/5801209
37. Morgan MJ, Liu ZG. Crosstalk of reactive oxygen species and NF-kappaB signaling. Cell Res. (2011) 21:103–15. doi: 10.1038/cr.2010.178
38. de Sá Junior PL, Câmara DAD, Porcacchia AS, Fonseca PMM, Jorge SD, Araldi RP, et al. The roles of ROS in cancer heterogeneity and therapy. Oxid Med Cell Longev. (2017):2467940. doi: 10.1155/2017/2467940
39. Liu LZ, Hu XW, Xia C, He J, Zhou Q, Shi X, et al. Reactive oxygen species regulate epidermal growth factor-induced vascular endothelial growth factor and hypoxia-inducible factor-1alpha expression through activation of AKT and P70S6K1 in human ovarian cancer cells. Free Radic Biol Med. (2006) 41:1521–33. doi: 10.1016/j.freeradbiomed.2006.08.003
40. Kubli SP, Bassi C, Roux C, Wakeham A, Gobl C, Zhou W, et al. AhR controls redox homeostasis and shapes the tumor microenvironment in BRCA1-associated breast cancer. Proc Natl Acad Sci USA. (2019) 116:3604–13. doi: 10.1073/pnas.1815126116
41. Liu B, Chen Y St. Clair DK. ROS and p53: a versatile partnership. Free Radic Biol Med. (2008) 44:1529–35. doi: 10.1016/j.freeradbiomed.2008.01.011
42. Fortmann SP, Burda BU, Senger CA, Lin JS, Whitlock EP. Vitamin and mineral supplements in the primary prevention of cardiovascular disease and cancer: an updated systematic evidence review for the U.S. Preventive Services Task Force. Ann Intern Med. (2013) 159:824–34. doi: 10.7326/0003-4819-159-12-201312170-00729
43. Bjelakovic G, Gluud LL, Nikolova D, Whitfield K, Krstic G, Wetterslev J, et al. Vitamin D supplementation for prevention of cancer in adults. Cochrane Database Syst Rev. (2014) 6:CD007469. doi: 10.1002/14651858.CD007469.pub2
44. Bjelakovic G, Nikolova D, Gluud C. Antioxidant supplements and mortality. Curr Opin Clin Nutr Metab Care. (2014) 17:40–4. doi: 10.1097/MCO.0000000000000009
45. Piskounova E, Agathocleous M, Murphy MM, Hu Z, Huddlestun SE, Zhao Z, Oxidative stress inhibits distant metastasis by human melanoma cells. Nature. (2015) 527:186–91. doi: 10.1038/nature15726
46. Porporato PE, Payen VL, Perez-Escuredo J, De Saedeleer CJ, Danhier P, Copetti T, et al. A mitochondrial switch promotes tumor metastasis. Cell Rep. (2014) 8:754–66. doi: 10.1016/j.celrep.2014.06.043
47. Harris IS, Treloar AE, Inoue S, Sasaki M, Gorrini C, Lee KC, et al. Glutathione and thioredoxin antioxidant pathways synergize to drive cancer initiation and progression. Cancer Cell. (2015) 27:211–22. doi: 10.1016/j.ccell.2015.01.009
48. Li M, Chen Q, Yu X. Chemopreventive effects of ROS targeting in a murine model of BRCA1-deficient breast cancer. Cancer Research. (2017) 77:448–58. doi: 10.1158/0008-5472.CAN-16-2350
49. Teoh ML, Fitzgerald MP, Oberley LW, Domann FE. Overexpression of extracellular superoxide dismutase attenuates heparanase expression and inhibits breast carcinoma cell growth and invasion. Cancer Res. (2009) 69:6355–63. doi: 10.1158/0008-5472.CAN-09-1195
50. Teoh-Fitzgerald ML, Fitzgerald MP, Zhong W, Askeland RW, Domann FE. Epigenetic reprogramming governs EcSOD expression during human mammary epithelial cell differentiation, tumorigenesis and metastasis. Oncogene. (2014) 33:358–68. doi: 10.1038/onc.2012.582
51. Saed GM, Diamond MP, Fletcher NM. Updates of the role of oxidative stress in the pathogenesis of ovarian cancer. Gynecol Oncol. (2017) 145:595–602. doi: 10.1016/j.ygyno.2017.02.033
52. Lim SD, Sun C, Lambeth JD, Marshall F, Amin M, Chung L, et al. Increased Nox1 and hydrogen peroxide in prostate cancer. Prostate. (2005) 62:200–7. doi: 10.1002/pros.20137
53. Tamura M, Matsui H, Tomita T, Sadakata H, Indo HP, Majima HJ, et al. Mitochondrial reactive oxygen species accelerate gastric cancer cell invasion. J Clin Biochem Nutr. (2014) 54:12–7. doi: 10.3164/jcbn.13-36
54. Du S, Miao J, Zhu Z, Xu E, Shi L, Ai S, et al. NADPH oxidase 4 regulates anoikis resistance of gastric cancer cells through the generation of reactive oxygen species and the induction of EGFR. Cell Death Dis. (2018) 9:948. doi: 10.1038/s41419-018-0953-7
55. Storz P. KRas, ROS and the initiation of pancreatic cancer. Small GTPases. (2017) 8:38–42. doi: 10.1080/21541248.2016.1192714
56. Cancer Genome Atlas Research N. The molecular taxonomy of primary prostate cancer. Cell. (2015) 163:1011–25. doi: 10.1016/j.cell.2015.10.025
57. Li X, Wu WK, Xing R, Wong SH, Liu Y, Fang X, et al. Distinct subtypes of gastric cancer defined by molecular characterization include novel mutational signatures with prognostic capability. Cancer Res. (2016) 76:1724–32. doi: 10.1158/0008-5472.CAN-15-2443
58. Sidaway P. Pancreatic cancer: TCGA data reveal a highly heterogeneous disease. Nat Rev Clin Oncol. (2017) 14:648. doi: 10.1038/nrclinonc.2017.146
59. Faria J, Negalha G, Azevedo A, Martel F. Metformin and breast cancer: molecular targets. J Mammary Gland Biol Neoplasia. (2019). doi: 10.1007/s10911-019-09429-z. [Epub ahead of print].
60. Coyle C, Cafferty FH, Vale C, Langley RE. Metformin as an adjuvant treatment for cancer: a systematic review and meta-analysis. Ann Oncol. (2016) 27:2184–95. doi: 10.1093/annonc/mdw410
61. Antognelli C, Cecchetti R, Riuzzi F, Peirce MJ, Talesa VN. Glyoxalase 1 sustains the metastatic phenotype of prostate cancer cells via EMT control. J Cell Mol Med. (2018) 22:2865–83. doi: 10.1111/jcmm.13581
62. Kurhaluk N, Bojkova B, Winklewski PJ. Liver antioxidant and aerobic status improves after metformin and melatonin administration in a rat model of high-fat diet and mammary carcinogenesis. Can J Physiol Pharmacol. (2018) 96:790–7. doi: 10.1139/cjpp-2018-0001
63. Liu B, Fan Z, Edgerton SM, Deng XS, Alimova IN, Lind SE, et al. Metformin induces unique biological and molecular responses in triple negative breast cancer cells. Cell Cycle. (2009) 8:2031–40. doi: 10.4161/cc.8.13.8814
Keywords: breast cancer, ROS, mitochondria, mitochondrial morphology, mitochondrial ROS
Citation: Sarmiento-Salinas FL, Delgado-Magallón A, Montes-Alvarado JB, Ramírez-Ramírez D, Flores-Alonso JC, Cortés-Hernández P, Reyes-Leyva J, Herrera-Camacho I, Anaya-Ruiz M, Pelayo R, Millán-Pérez-Peña L and Maycotte P (2019) Breast Cancer Subtypes Present a Differential Production of Reactive Oxygen Species (ROS) and Susceptibility to Antioxidant Treatment. Front. Oncol. 9:480. doi: 10.3389/fonc.2019.00480
Received: 03 April 2019; Accepted: 21 May 2019;
Published: 07 June 2019.
Edited by:
Carlos Pérez-Plasencia, National Autonomous University of Mexico, MexicoReviewed by:
Cinzia Antognelli, University of Perugia, ItalyFranklin David Rumjanek, Federal University of Rio de Janeiro, Brazil
Copyright © 2019 Sarmiento-Salinas, Delgado-Magallón, Montes-Alvarado, Ramírez-Ramírez, Flores-Alonso, Cortés-Hernández, Reyes-Leyva, Herrera-Camacho, Anaya-Ruiz, Pelayo, Millán-Pérez-Peña and Maycotte. This is an open-access article distributed under the terms of the Creative Commons Attribution License (CC BY). The use, distribution or reproduction in other forums is permitted, provided the original author(s) and the copyright owner(s) are credited and that the original publication in this journal is cited, in accordance with accepted academic practice. No use, distribution or reproduction is permitted which does not comply with these terms.
*Correspondence: Paola Maycotte, YmlzYmVuemltaWRhQGdtYWlsLmNvbQ==; cG1heWNvdHRlZ29AY29uYWN5dC5teA==