 In-Wha Kim
 Jae Hyun Kim
 Jung Mi Oh
- College of Pharmacy and Research Institute of Pharmaceutical Sciences, Seoul, South Korea
Purpose: Most prostate cancers (PCs) initially respond to androgen deprivation therapy (ADT), but eventually many PC patients develop castration resistant PC (CRPC). Currently, available drugs that have been approved for the treatment of CRPC patients are limited. Computational drug repositioning methods using public databases represent a promising and efficient tool for discovering new uses for existing drugs. The purpose of the present study is to predict drug candidates that can treat CRPC using a computational method that integrates publicly available gene expression data of tumors from CRPC patients, drug-induced gene expression data and drug response activity data.
Methods: Gene expression data from tumoral and normal or benign prostate tissue samples in CRPC patients were downloaded from the Gene Expression Omnibus (GEO) and differentially expressed genes (DEGs) in CRPC were determined with a meta-signature analysis by a metaDE R package. Additionally, drug activity data were downloaded from the ChEMBL database. Furthermore, the drug-induced gene expression data were downloaded from the LINCS database. The reversal relationship between the CRPC and drug gene expression signatures as the Reverse Gene Expression Scores (RGES) were computed. Drug candidates to treat CRPC were predicted using summarized scores (sRGES). Additionally, synergic effects of drug combinations were predicted with a Target Inhibition interaction using the Minimization and Maximization Averaging (TIMMA) algorithm.
Results: The drug candidates of sorafenib, olaparib, elesclomol, tanespimycin, and ponatinib were predicted to be active for the treatment of CRPC. Meanwhile, CRPC-related genes, in this case MYL9, E2F2, APOE, and ZFP36, were identified as having gene expression data that can be reversed by these drugs. Additionally, lenalidomide in combination with pazopanib was predicted to be most potent for CRPC.
Conclusion: These findings support the use of a computational reversal gene expression approach to identify new drug and drug combination candidates that can be used to treat CRPC.
Introduction
Drug repurposing or repositioning is a strategy for identifying new indications for approved or investigational drugs that are outside the scope of the original medical indication (1). This strategy offers an advantage in that the cost of bringing a repurposed drug to market has been estimated to be US$300 million on average, compared to estimates of approximately $2–3 billion for a new drug (2).
Drug–disease similarity approaches aim to identify shared therapeutic applications for drugs (3) while drug–drug similarity approaches aim to identify shared mechanisms of action for drugs (4). Recently, interest in the use of genomics-based drug repositioning to aid and accelerate the drug discovery process has increased (5). Drug development strategies based on gene expression levels are advantageous in that they do not require a large amount of a priori knowledge pertaining to particular diseases or drugs (6, 7). Large public datasets such as the Gene Expression Omnibus (GEO) at the National Center for Biotechnology Information (NCBI) (8), the Cancer Cell Line Encyclopedia (CCLE) (9), and the Library of Integrated Network-Based Cellular Signatures (LINCS) (10, 11), describing chemical and biological disease entities or gene expression data and the relationships between them, provide an efficient approach by which to reposition existing drugs for new indications (5, 12). Recently, the reverse gene expression scores (RGES) computation method was developed as a one of the powerful drug repositioning tools to predict drug candidates (13). The RGES computation method was applied to find drug candidates for CRPC in this study.
Prostate cancer (PC) was the cancer with the highest incidence worldwide and the leading cause of cancer deaths for men in 2015 (14). Although PC mortality in Western countries has declined due to early diagnosis and treatment, incidence rates of PC continue to increase in the developing countries (15). Androgens and androgen receptors (ARs) may play key roles in the initiation and progression of PC (16). As Huggins and Hodges discovered that androgen-deprivation therapy (ADT) with surgical castration to reduce testicular testosterone could suppress PC progression (17), ADT has been the standard therapy to treat PC (16, 18).
Different therapeutic approaches to target androgen and AR signals after surgical or chemical castration were developed by combining ADT with various anti-androgens, including the steroidal anti-androgens cyproterone acetate (19) and megestrol acetate (19), and non-steroidal anti-androgens, including nilutamide (20), flutamide (21), and bicalutamide (22). Most PCs initially shrink in response to ADT, but eventually most types of ADT with anti-androgens fails and PC patients develop castration resistant PC (CRPC) (16). When this occurs, chemotherapeutic approaches such as docetaxel may be considered (23). Although recently enzalutamide, apalutamide, and abiraterone acetate were approved for the treatment of CRPC (24, 25), available drugs that have been approved for the treatment of CRPC patients are limited (26). Therefore, repositioning for CRPC is challenging and numerous preclinical or clinical trial studies deriving from repositioning approaches, including those focusing on itraconazole (27), phentolamine (28), and niclosamide (29), have been continually conducted.
Primary PC has relatively few genomic aberrations compared to other cancers (30). However, detailed spatial sampling and sequencing of prostate tumors has identified significant heterogeneity within multifocal tumors in the same patient (31, 32). In the case of CRPC, it has been shown to remain dependent on the AR signaling pathway by various mechanisms even during the systemic depletion of androgens (33).
The purpose of this study is to predict drug candidates that can treat CRPC using a computational method that integrates publicly available gene expression data of tumors in CRPC patients, drug-induced gene expression data and drug response activity data.
Materials and Methods
Collection of Gene Expression Data
Publicly available gene expression data for CRPC related studies were identified in the GEO database hosted by the NCBI (http://www.ncbi.nlm.nih.gov/geo). A search of the GEO database was conducted in July of 2018 using “prostate cancer,” “castration,” “resistance,” and “refractory” as a key search phrases. The results were filtered using the search terms Homo sapiens, expression profiling by array, and expression profiling by high throughput sequencing. Only original experimental datasets that compared the expression levels of mRNAs between CRPC tumor and normal or benign tissues were selected in CRPC patients. Additionally, gene expression data of human prostate adenocarcinoma cell lines were downloaded from CCLE (version 2.7. updated 2015 https://portals.broadinstitute.org/ccle) (9).
Preprocessing of Gene Expression Data
The GEO accession number, Gene Expression Omnibus platforms (GPL) access number, number of cases and controls, sample type, and gene expression data were extracted from each of the identified datasets. Gene expression data were individually log2-based transformed and normalized. If there were multiple probes for the same gene, the probe with the highest interquartile range was selected for that gene expression level. All probe sets on different platforms were re-annotated to use the most recent NCBI Entrez Gene Identifiers (Gene IDs), and the Gene IDs were used to cross-map genes among the different platforms. Only genes present in all selected platforms were considered. The R packages MetaQC (34) was used for quality control (QC) of gene expression data. The mean rank of all QC measures in each dataset was also determined as a quantitative summary score by calculating the ranks of each QC measure among all included datasets.
Identification of Disease Gene Expression Signatures
The R package MetaDE (35–38) was used to identify the DEGs in meta-analysis of CRPC. A moderated t-statistic was used to calculate P-values for each dataset, and a meta-analysis was conducted with a fixed effect model (39). Additionally, the degree of similarities among the gene expression data between CRPC tumor samples from the GEO and PC cell lines from the CCLE were assessed.
Identification of Compound Gene Expression Signatures
The L1000 landmark transcript values (Level 4) of 978 landmark genes from LINCS as of May of 2018 were downloaded from LINCS cloud storage (http://lincscloud.org/) hosted by the Broad Institute (40). Cell lines described in LINCS, CCLE, and ChEMBL (version 24 1st Sep 2017, https://www.ebi.ac.uk/chembl/) (41) were mapped using PC cell line names followed by manual inspection. Meta-information for compound-induced gene expression values, in this case cell line types as well as treatment durations and drug concentrations, was retrieved. Only L1000 signatures with the annotation “is gold,” indicating the highest quality of aggregate data were used for further analyses.
Collection of Compound Activity Data
Compound activity data, described as the half maximal inhibitory concentrations (IC50) in PC cell lines were retrieved from ChEMBL. As the IC50 values for a given compound could vary for the same cell line across different studies, the median IC50 value was used. Compounds included in the ChEMBL and LINCS were manually mapped using International Union of Pure and Applied Chemistry International Chemical Identifier keys. Additionally, the area-under-the-curve (AUC) values for compound activity data in the PC cell lines were retrieved from the Cancer Therapeutic Response Portal (CTRP ver 2, https://portals.broadinstitute.org/ctrp.v2.1/) (42). Sensitivity levels were measured in the form of cellular ATP levels as a surrogate for cell number and growth using CellTiter-Glo assays (43). A compound-performance score was computed at each concentration of compound. Median AUC values across various cell lines were used. Compounds were categorized into active (IC50 <10 μM) and inactive groups (IC50≥10 μM) based on their activities in cell lines. An IC50 value of 10 μM was chosen as an activity threshold given that compounds with IC50 ≥10 μM in primary screenings are often not pursued (44).
Computation and Summarization of RGES
The method used to calculate the reverse gene expression score (RGES) was adapted from the previously described Connectivity Map method (45) and RGES computational method (13). Briefly, genes were initially ranked according to their expression levels for each compound. An enrichment score for each set of up- and down-regulated genes in CRPC was computed based on their positions in the ranked list. RGES values emphasize the reversal correlation by capturing the reversal relationship between the DEGs and compound-induced changes in the gene expression levels. Therefore, a lower negative RGES indicates a higher likelihood of reversing changes in the gene expression of CRPC, and vice versa. In addition, the Spearman's correlation coefficient, the Pearson correlation coefficient, and the cosine similarity were computed between DEGs in CRPC and compound activities, as an alternate method for computing the reversal relationship between DEGs and the active compounds (46). The databases used can list multiple gene expression levels associated with one compound due to testing involving different cell lines, treatment concentrations and durations of compounds. This resulted in multiple RGESs for one compound that could reverse disease gene expression. Given these variations, summarized RGESs (sRGES) were weighted and calculated. Results obtained for a 10 μM drug concentration and a 24 h treatment time were used to define the reference conditions.
Identification of Reversed Genes
In cases for which multiple gene expression values yielded multiple RGES values for one compound, a median RGES value was calculated from the PC cell lines. In cases for which multiple compound activity IC50 data were available for one compound, median IC50 values were calculated. Each gene expression datum was sorted by its expression value. Upregulated genes were ranked highly (i.e., on the top), whereas downregulated genes were assigned a low rank (i.e., on the bottom). Among the upregulated genes, reversal genes were defined as those that were ranked lower in the active group (IC50 <10 μM) than in the inactive group (IC50 ≥ 10 μM). In contrast, among the downregulated genes, the reversal genes were defined as those that were ranked higher in the active group than the inactive group. A leave-one-compound-out cross-validation approach was used to find genes having reversed expression (47). For each trial, one compound was removed and the reversed genes were then identified using the approach described above. Only those genes that were significantly reversed in all trials were retained. The genes with adjusted P < 0.25 in all trials were considered as reversal genes.
Prediction of Synergic Effects
To predict the synergic effects of drug combinations based on the interactions between drugs and the identified targets, RGES values was used for Target Inhibition Inference using the Maximization and Minimization Averaging (TIMMA) algorithm (48). The synergic scores were calculated with the TIMMA-R package (49). The synergic addictive score was defined as Sa(i, j) = y(i, j) − (y(i) + y(j)) and the synergic multiplicative score was defined as Sm(i, j) = y(i, j) − (y(i) × y(j)). The synergic highest agent score was defined as Sl(i, j) = y(i, j) − max(y(i), y(j)). An average synergy score was defined as . The predicted sensitivity was defined as Sensitivity = expectation + synergy.
Statistical Analysis
The degree of similarity in gene expressions between CRPC tumor samples from the GEO and PC cell lines from the CCLE were assessed by a Spearman's rank correlation test, as were these similarity degrees between RGES and IC50 values from ChEMBL or AUC values from CCLE. A Wilcoxon signed-rank test was used to assess differences between RGES across active (IC50 <10 μM) and inactive compounds (IC50 ≥ 10 μM), the same and different cell lines, higher (≥10 μM) and lower (<10 μM) drug concentrations, and longer (≥24 h) and shorter (<24 h) treatment durations. P-values were adjusted with the Benjamini and Hochberg's false discovery rate method to correct for multiple testing.
Results
Inclusion of CRPC Gene Expression Datasets
The study selection process for finding CRPC disease signatures is outlined in Figure 1. A total of 224 GEO Series Experiments (GSEs) were searched. A number of GSEs were excluded due to duplicated data (n = 21), disease (n = 179), non-human (n = 14), non-control (neither normal nor benign tissues) (n = 4), and number of genes <5,000 (n = 2). Finally, the four datasets of GSE3325, GSE35988, GSE70768, and GSE80609 were selected for further analysis after a MetaQC analysis (Supplementary Table S1). Detailed information about the downloaded CRPC gene expression datasets is summarized in Supplementary Table S2. GSE35988 contained gene expression data from the GPL6480 and GPL6848 platforms. Tumor gene expression signatures in CRPC were analyzed for 178 samples by comparing RNA expression data for 64 tumors and 114 normal or benign tissues from those four datasets.
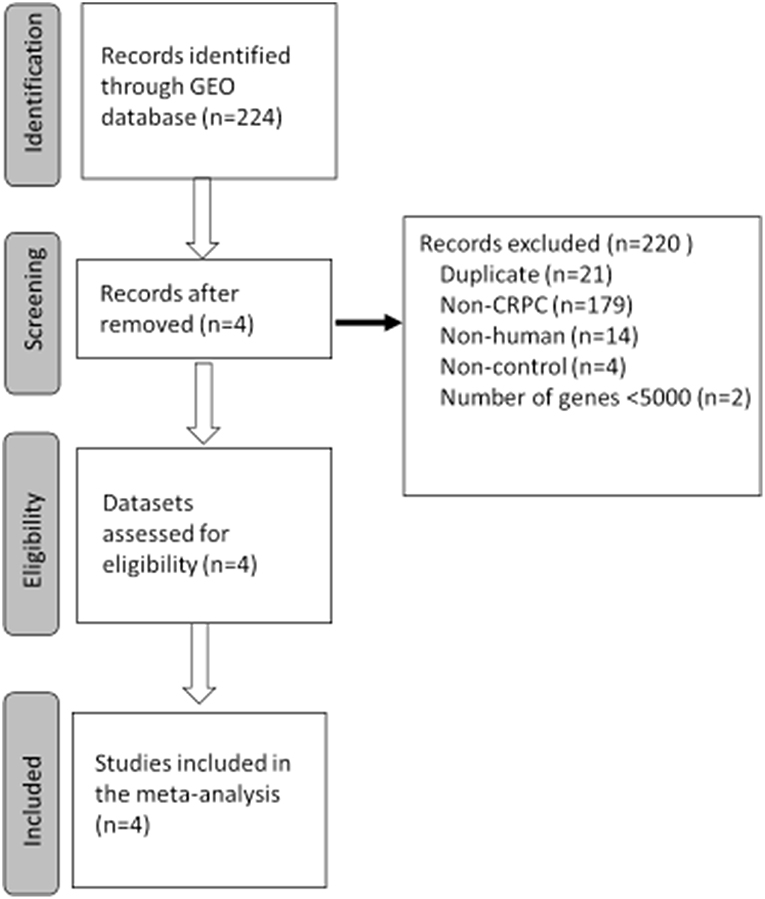
Figure 1. Flowchart of the selected process to select gene expression datasets for meta-analysis of castration resistant prostate cancer (CRPC). GEO, Gene Expression Omnibus.
Gene Expression Signatures of CRPC
The workflow for the exploration of the compounds using the calculated RGES values is presented in Supplementary Figure S1. Corresponding probes on each platform were re-annotated with the most recent NCBI Entrez Gene IDs and then mapped to yield 7,825 unique common genes across the five different platforms. A fixed-effect model method was used by combining the P-values using the MetaDE package. Among the gene expression signatures, 53 genes showed increased expression levels in tumors compared to normal or benign tissues (adjusted P < 0.001, log2foldchange > 1.5), whereas 42 genes showed decreased expression levels in tumors compared to normal or benign tissues (adjusted P < 0.001, log2foldchange < –1.5; Supplementary Table S3).
Similarity in Gene Expressions Between Tumor Samples and PC Cell Lines
The degree of similarity in the gene expression levels between CRPC tumor samples from the GEO and PC cell lines from the CCLE was assessed by a ranked Spearman's correlation test. Gene expression data for eight PC cell lines were included in the CCLE (Supplementary Table S4). The top 5,000 genes in these cell lines were ranked according to their interquartile range across all PC cell lines used. Among them, <0.1% of genes had expression levels in tumor samples from the GEO that did not correlate with those in these cell lines.
Computation of RGES Values
Changed expression values of 978 landmark genes after a compound treatment of human prostate adenocarcinoma PC3 cell lines with 172 compounds in the LINCS data as drug signatures were used for the computation of the RGES values. The median IC50s values for 12,895 compounds used to treat PC cancer cell lines listed in the ChEMBL were used for the RGES computation. The changed expression values of 95 DEGs after extraction from the set of LINCS landmark genes as disease signatures were also used for computation. Variations in the RGES values were evaluated under various biological conditions. The RGES values showed larger variations across different cell lines relative to those within different replicates of the same cell line when the same concentration and treatment duration for a compound were used (P < 2.2 × 10⁻¹⁶; Figure 2A). In addition, higher compound concentrations (>10 μM) had lower RGES values than lower concentrations (<10 μM, P = 1.46 × 10⁻⁴; Figure 2B) when a compound was tested on the same cell line at the same concentration. Likewise, longer treatment durations (≥24 h) were associated with lower RGES values compared to shorter durations (<24 h) (P < 2.2 × 10⁻¹⁶; Figure 2C). The RGES values for the compounds were evaluated by examining the correlations with their activities in the same cell line. Finally, the RGES values were correlated with the IC50 values for the compounds (Spearman correlation rho = 0.19, P = 1.43 × 10⁻²; Figure 3A).
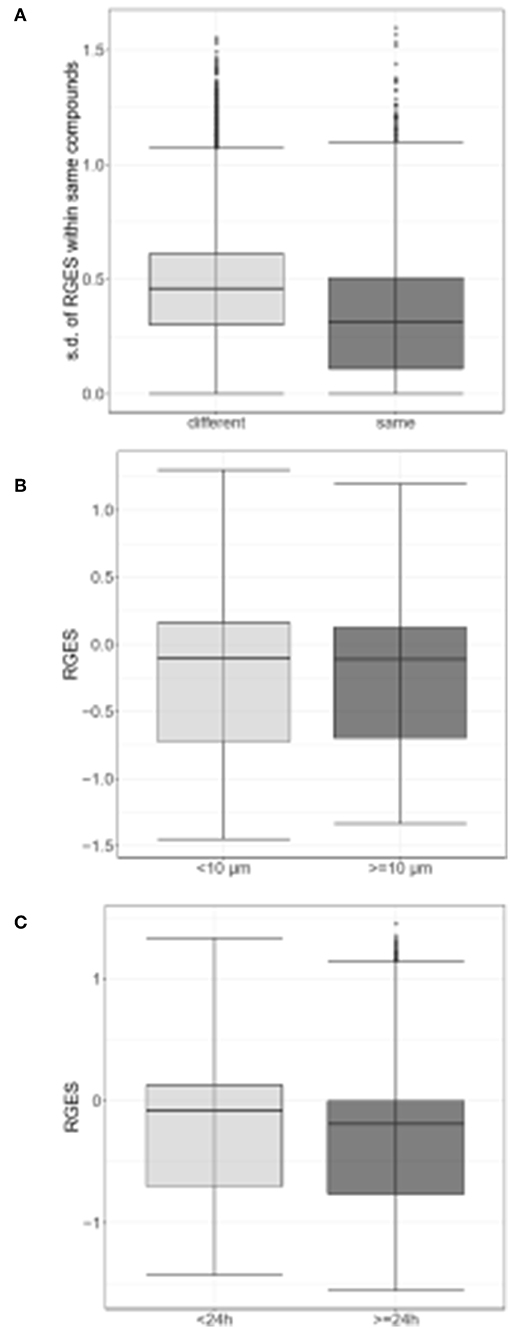
Figure 2. Differences in reverse gene expression scores (RGES) under the various biological conditions. (A) Standard deviation (s.d.) of reverse gene expression scores (RGES) of individual compounds across different cell lines (gray) vs. across replicates within the same cell line (black gray). (B) RGES distribution between drug concentrations<10 μM (gray) and ≥10 μM (black gray). (C) RGES distribution between treatment durations<24 h (gray) and ≥24 h (black gray). Treatment duration and compound concentration were categorized based on compound data in LINCS. P-value was calculated using a Wilcoxon signed-rank test.
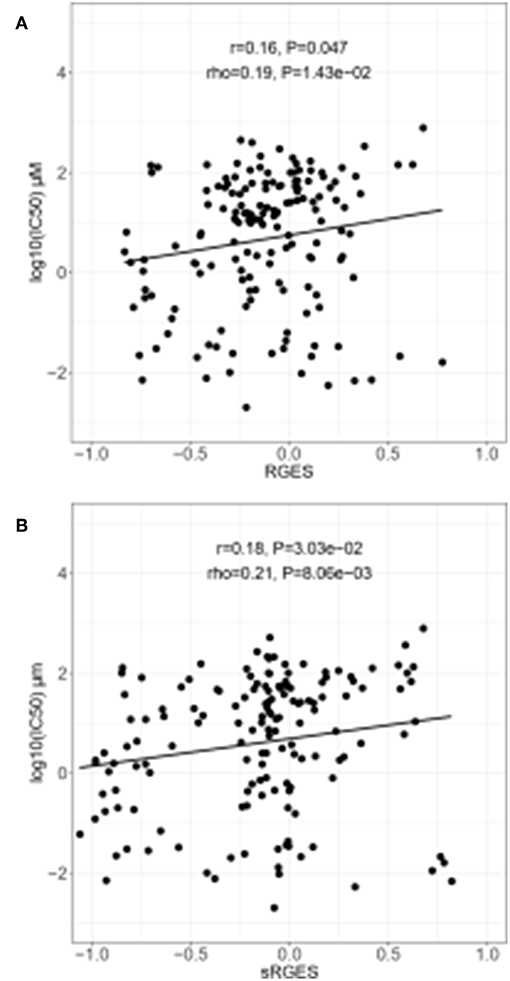
Figure 3. Correlation between drug efficacy and reverse gene expression score (RGES) in PC3 cancer cell lines. (A) Correlation between RGES and drug efficacy (IC50) by linear regression and Spearman's correlation tests. (B) Correlation between drug efficacy (IC50) and summarized reverse gene expression score (sRGES) for all cancer cell lines using a linear regression and a Spearman's correlation tests. IC50, half maximal inhibitory concentration.
Summarization and Evaluation of RGES Outcomes
sRGES values were computed by weighting various cell lines, compound concentrations, and treatment durations. A number of known methods were used to summarize the RGES outcomes and obtain sRGES values (Supplementary Table S5). The calculated sRGES values for each compound were significantly correlated with drug activity levels (Spearman correlation rho = 0.21 and P = 8.06 × 10⁻³; Figure 3B). Additionally, CTRP was used as an external data set to confirm the correlation between the reversal potency and the compound activity. Compound activity data expressed as AUC values for 558 compounds tested in PC cell lines were collected from CTRP. After the sRGES computations, the median AUC values across multiple cell lines were used to evaluate the sRGES outcomes. The sRGES values were significantly correlated with the AUC values (rho = 0.29, P = 2.91 × 10⁻⁵; Figure 4).
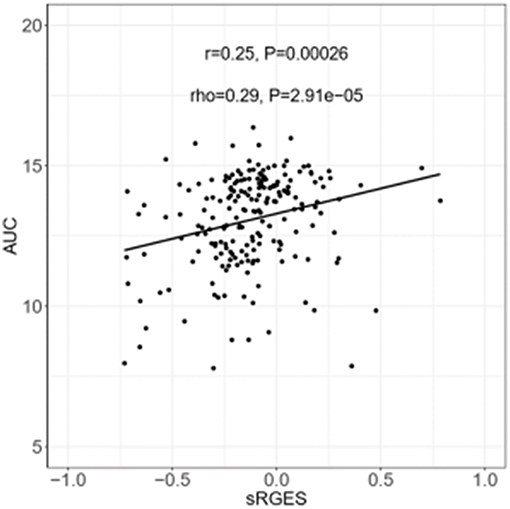
Figure 4. Correlation between AUC and sRGES of compounds. AUC data were retrieved from CTRP. Sensitivity levels were measured in the form of cellular ATP levels as a surrogate for cell number and growth using CellTiter-Glo assays. A compound-performance score was computed at each concentration of compound. Median values were used to summarize AUC across all prostate cancer cell lines examined. A Spearman's correlation test was used to analyze the correlation between sRGES and AUC. AUC, areas under the concentration-response curve. CTRP, the cancer therapeutic response portal.
Identification of Reversed Genes and Predictions of Compounds
Using the correlation between the sRGES values and the compound activity, compounds having high reversal potency for PC were identified. Next, genes having expression levels that were reversed by the active compounds were predicted by a leave-one-compound-out approach. The four genes that showed significant reversal of expression following treatment with PC cell lines with the active compounds included the following: (i) myosin light chain 9 (MYL9), (ii) DNA topoisomerase 2-binding protein 1 (TOPBP1), (iii) Apolipoprotein E (APOE), and (iv) zinc finger protein 36 (ZFP36) (Figures 5A,B). Fifty compounds were determined to be active compounds against CRPC (Figure 5A), while 48 compounds were determined to be inactive compounds (Figure 5B, Supplementary Table S6). The active drugs against CRPC identified by our analysis contained the tyrosine kinase inhibitors dasatinib, lapatinib, lestaurtinib, and saracatinib; the histone acetylation inhibitors belinostat, entinostat, mocetinostat, panobinostat, trichostatin-A, and vorinostat and the heat shock inhibitors elesclomol and geldanamycin.
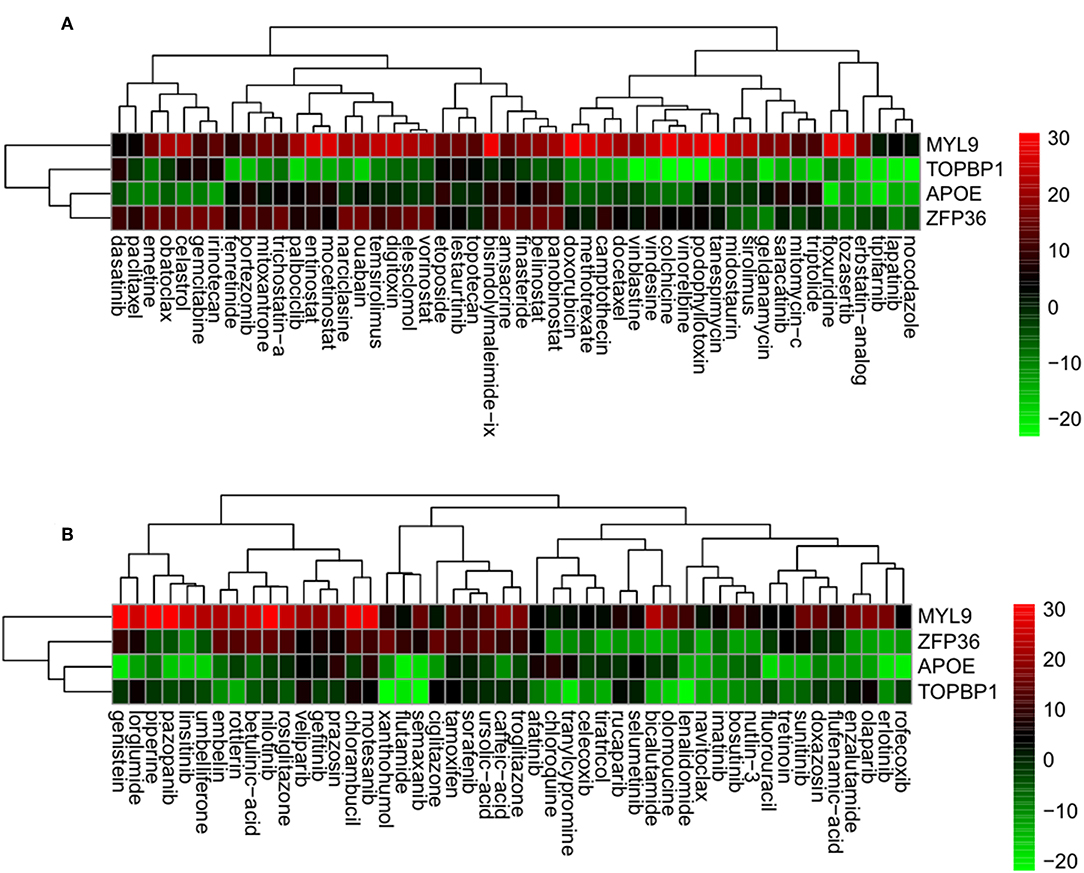
Figure 5. Genes having reversed expression in response to treatment with active (A) and inactive (B) compounds. Low rank and high rank suggests that the gene expression is down- and upregulated, respectively, by the corresponding compound. The heatmap indicates the relative position of a gene in ranked drug expression data. Position are normalized and compound columns are ordered according to IC50. Red and green colors indicate up- and down-regulation, respectively, after compound treatment.
Prediction of the Synergic Effect
Combination of 98 drug candidates were employed the TIMMA. Of all these drug combinations, the highest synergy sensitivity score was predicted for the combination of lenalidomide and pazopanib (Figure 6, Supplementary Table S7). Next, the synergic sensitivity score orders were lenalidomide combined with olapanib, nocodazole, tipifarnib, and imatinib and their corresponding targets were APOE, ZFP36, E2F2, and MYL9.
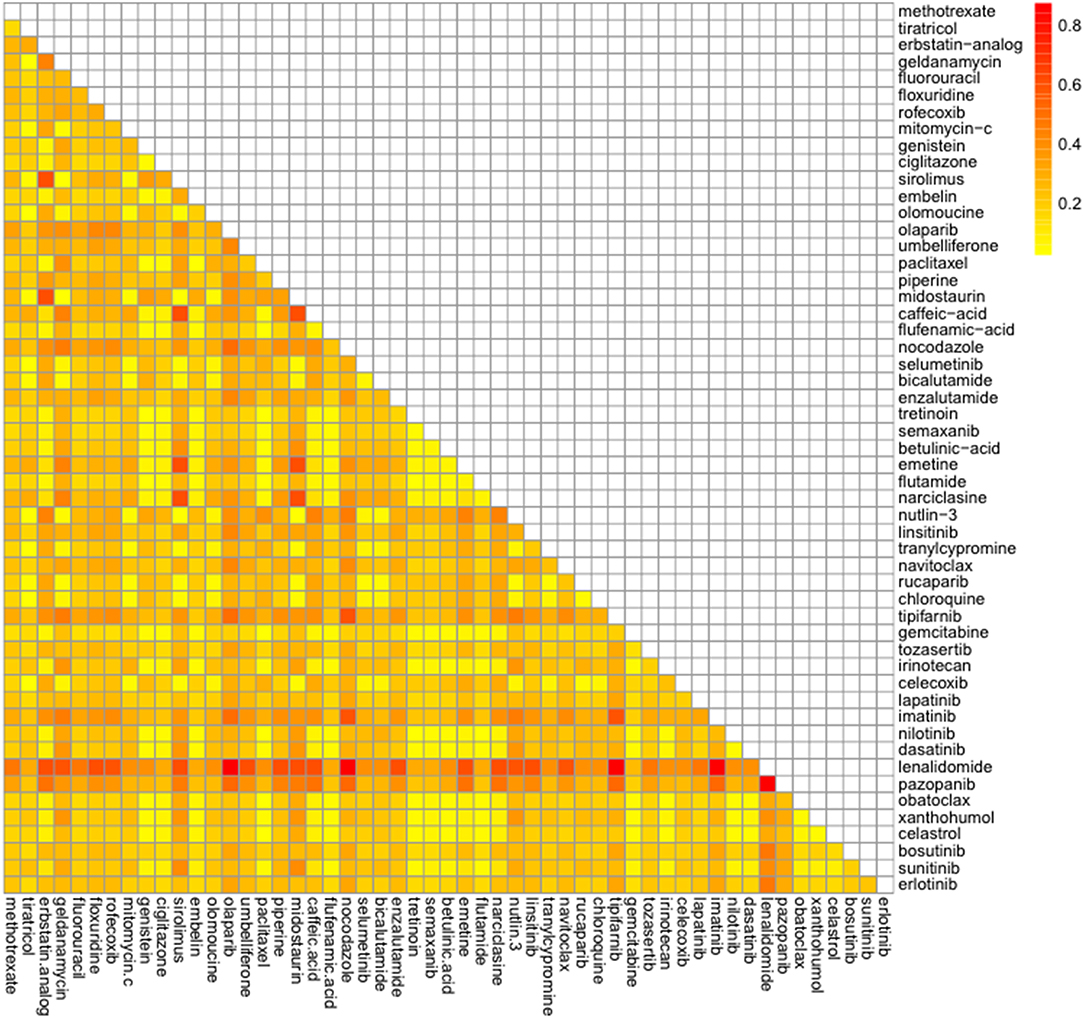
Figure 6. Predicted synergic drug combinations against castration resistant prostate cancer. Predicted sensitivity scores were calculated by the Target Inhibition Interaction using Maximization and Minimization Averaging algorithm. The bar on the right shows predicted synergic scores.
Discussion
The computational approaches used in systemic analyses of large amounts of data such as gene expression values, genotypes, and chemical structure similarities for predictive repositioning offer a relatively quick and mechanistic method of identifying new application of existing drugs that may be translated into clinical applications (50). In this study, computational methods using public database were used for the purpose of identifying drug repositioning candidates for treatment of CRPC. Several drug candidates were identified, as well as DEGs in CRPC whose expression can be reversed by these agents. We used public cancer genomic and pharmacologic databases to demonstrate the reversal potency relationship between DEGs and drug activities, and to predict potential new drug candidates for CRPC.
Our results showed that the ability of drugs to reverse DEGs was correlated with drug activity in CRPC, although this correlation was highly dependent on the cell lines as well as the treatment concentration and duration of the drugs. The positive correlation between sRGES and IC50 values indicated that combining disease gene expression data derived from clinical samples with drug gene expression data obtained from results with in vitro cell lines could be used to predict drug activities.
In our study, four genes, MYL9, E2F2, APOE, and ZFP36, showed reversed expression in response to 50 active compounds in CRPC. To the best of our knowledge, this is the first study focusing on drug repositioning using a computational reversal gene expression approach in relation to CRPC. MYL9 (myosin light chain 9) has been reported to play an important role in tumor progression in PC (51). Loss of the RB function facilitates the development of CRPC via E2F-mediated upregulation of the AR (52). ZFP36 is reportedly involved in the progression and prognosis of PC (53). As cholesterol is known to be a potential target for CRPC, ApoE has been suggested to play a potential role in prostate cancer progression (54). These genes showed reversed expression levels and thus may be feasible as therapeutic targets for CRPC.
Among the active drugs against CRPC identified by our analysis, the histone deacetylase inhibitors, vorinostat (55), and panobinostat (56), the tyrosine kinase inhibitors, dasatinib (57) and lapatinib (58), and a poly (ADP-ribose) polymerase (PARP) inhibitor, olaparib (59), have gone through phase I and phase II clinical trials for CRPC patients. Additionally, the docetaxel FDA-approved for metastatic CRPC (60) was identified as an active drug in our results. Bicalutamide and flutamide used as a hormonal therapy against CRPC have low cytotoxic activities, resulting that they have been identified as inactive drugs in our study. The cytotoxic chemotherapy is most effective when given in combination to achieve an additive or synergistic effect and a targeted therapy involving more than one drug increases powerful antitumor effects and overcomes resistance mechanisms (61). A combination of high-throughput screening of all licensed drugs has been carried out in an attempt to discover synergistic interactions (62). Therefore, the synergic effects of the candidate drugs identified were examined in our study. The immunomodulatory, drug lenalidomide combined with a tyrosine kinase inhibitor, pazopanib was most potent against CRPC in our result. Several clinical trials of lenalidomide- or pazopanib-based regimens for CRPC were conducted (63–65). The phase I/II study of lenalidomide in combination with sunitinib was conducted in patients with advanced or metastatic renal cell carcinoma (66). Despite the fact that the combination of pazopanib and lenalidomide has been reported to induce synergistic cytotoxicity in multiple myeloma (67), this drug combination has not yet been tested yet in CRPC cases.
After CRPC development, PC switches from an endocrine-driven disease to a paracrine- or autocrine-driven disease. Therefore, CRPC represents an increased opportunity to accumulate genomic aberrations and is riddled with aggressive and heterogeneous clones. Strengths of this work is that it leverages publically available datasets to identify candidates for drug repositioning targets and theoretically, this could be a much cheaper and faster way to identify promising new leads. A limitation of this study is that the CRPC disease gene expression datasets from the GEO are not uniformly associated with clinical outcomes or CRPC etiologies. CRPC is a heterogeneous disease that might be driven by different pathways, depending on prior treatments and this approach essentially treats CRPC as a single entity. The drug efficacy of the predicted compounds may also vary because the CRPC tissue states varied for individual patients. Therapeutic efficacy is more complex than a simple correlation of gene expression levels with drugs and diseases. Therefore, our findings for drug candidates will require further preclinical testing and demonstration in clinical trials. As performing randomized trials in relation to a rare cancer disease is challenging, a computational drug repositioning approach with public gene expression databases may become a quite useful strategy for treating rare types of cancer.
In summary, our computational approach combined disease gene expression with drug-induced expression data in CRPC to identify new drugs and target genes as CRPC therapies. This approach, can also be used to predict the efficacy of new drug candidates to treat CRPC. This computational approach could be broadly applied to other rare forms of cancer for which reliable gene expression data are available.
Author Contributions
I-WK and JO contributed conception and design of the study. I-WK organized the database and wrote the first draft of the manuscript. I-WK and JK contributed to data collection and performed the statistical analysis. All authors contributed to manuscript revision, read, and approved the submitted version.
Funding
This study was supported by the National Research Foundation of Korea grant funded by the Korea government (MSIT) (no. NRF-2018R1A2B6001859 and 2017R1E1A1A01077186).
Conflict of Interest Statement
The authors declare that the research was conducted in the absence of any commercial or financial relationships that could be construed as a potential conflict of interest.
Acknowledgments
We appreciate the previous work in Dr. Chen's laboratory that developed the RGES method and provided analysis code.
Supplementary Material
The Supplementary Material for this article can be found online at: https://www.frontiersin.org/articles/10.3389/fonc.2019.00661/full#supplementary-material
References
1. Ashburn TT, Thor KB. Drug repositioning: identifying and developing new uses for existing drugs. Nat Rev Drug Discov. (2004) 3:673–83. doi: 10.1038/nrd1468
3. Iorio F, Isacchi A, di Bernardo D, Brunetti-Pierri N. Identification of small molecules enhancing autophagic function from drug network analysis. Autophagy. (2010) 6:1204–5. doi: 10.1073/pnas.1000138107
4. Chiang AP, Butte AJ. Systematic evaluation of drug-disease relationships to identify leads for novel drug uses. Clin Pharmacol Ther. (2009) 86:507–10. doi: 10.1038/clpt.2009.103
5. Sirota M, JT Dudley, Kim J, Chiang AP, Morgan AA, Sweet-Cordero A, et al. Discovery and preclinical validation of drug indications using compendia of public gene expression data. Sci Transl Med. (2011) 3:96ra77. doi: 10.1126/scitranslmed.3001318
6. Iorio F, Rittman T, Ge H, Menden M, Saez-Rodriguez J. Transcriptional data: a new gateway to drug repositioning? Drug Discov Today. (2013) 18:350–7. doi: 10.1016/j.drudis.2012.07.014
7. Li J, Zheng S, Chen B, Butte AJ, Swamidass SJ, Lu Z. A survey of current trends in computational drug repositioning. Brief Bioinformatics. (2016) 17:2–12. doi: 10.1093/bib/bbv020
8. Barrett T, Edgar R. Mining microarray data at NCBI's Gene Expression Omnibus (GEO)*. Methods Mol Biol. (2006) 338:175–90. doi: 10.1385/1–59745-097–9:175
9. Barretina J, Caponigro G, Stransky N, Venkatesan K, Margolin AA, Kim S, et al. The Cancer Cell Line Encyclopedia enables predictive modelling of anticancer drug sensitivity. Nature. (2012) 483:603–7. doi: 10.1038/nature11003
10. Keenan AB, Jenkins SL, Jagodnik KM, Koplev S, He E, Torre D, et al. The library of integrated network-based cellular signatures NIH program: system-level cataloging of human cells response to perturbations. Cell Syst. (2018) 6:13–24. doi: 10.1016/j.cels.2017.11.001
11. Koleti A, Terryn R, Stathias V, Chung C, Cooper DJ, Turner JP, et al. Data portal for the Library of Integrated Network-based Cellular Signatures (LINCS) program: integrated access to diverse large-scale cellular perturbation response data. Nucleic Acids Res. (2018) 46:D558–66. doi: 10.1093/nar/gkx1063
12. Xue H, Li J, Xie H, Wang Y. Review of drug repositioning approaches and resources. Int J Biol Sci. (2018) 14:1232–44. doi: 10.7150/ijbs.24612
13. Chen B, Ma L, Paik H, Sirota M, Wei W, Chua MS, et al. Reversal of cancer gene expression correlates with drug efficacy and reveals therapeutic targets. Nat Commun. (2017) 8:16022. doi: 10.1038/ncomms16022
14. Global Burden of Disease Cancer Collaboration, Fitzmaurice C, Allen C, Barber RM, Barregard L, Bhutta ZA, et al. Global, regional, and national cancer incidence, mortality, years of life lost, years lived with disability, and disability-adjusted life-years for 32 cancer groups, 1990 to 2015: a systematic analysis for the global burden of disease study. JAMA Oncol. (2017) 3:524–48. doi: 10.1001/jamaoncol.2016.5688
15. Zhou CK, Check DP, Lortet-Tieulent J, Laversanne M, Jemal A, Ferlay J, et al. Prostate cancer incidence in 43 populations worldwide: An analysis of time trends overall and by age group. Int J Cancer. (2016) 138:1388–400. doi: 10.1002/ijc.29894
16. Miyamoto H, Messing EM, Chang C. Androgen deprivation therapy for prostate cancer: current status and future prospects. Prostate. (2004) 61:332–53. doi: 10.1002/pros.20115
17. Huggins C, Hodges CV. Studies on prostatic cancer. I. The effect of castration, of estrogen and androgen injection on serum phosphatases in metastatic carcinoma of the prostate. Cancer Res. (1941) 1:293–97.
18. von Klot CA, Kuczyk MA, Boeker A, Reuter C, Imkamp F, Herrmann TR, et al. Role of free testosterone levels in patients with metastatic castration-resistant prostate cancer receiving second-line therapy. Oncol Lett. (2017) 13:22–8. doi: 10.3892/ol.2016.5392
19. Goldenberg SL, Bruchovsky N. Use of cyproterone acetate in prostate cancer. Urol Clin North Am. (1991) 18:111–22.
20. Decensi AU, Boccardo F, Guarneri D, Positano N, Paoletti MC, Costantini M, et al. Monotherapy with nilutamide, a pure nonsteroidal antiandrogen, in untreated patients with metastatic carcinoma of the prostate. The Italian Prostatic Cancer Project. J Urol. (1991) 146:377–81.
21. Boccardo F. Hormone therapy of prostate cancer: is there a role for antiandrogen monotherapy? Crit Rev Oncol Hematol. (2000) 35:121–32. doi: 10.1016/S1040-8428(00)00051-2
22. Iversen P, Tyrrell CJ, Kaisary AV, Anderson JB, Van Poppel H, Tammela TL, et al. Bicalutamide monotherapy compared with castration in patients with nonmetastatic locally advanced prostate cancer: 6.3 years of followup. J Urol. (2000) 164:1579–82. doi: 10.1016/S0022-5347(05)67032-2
23. Massard C, Fizazi K. Targeting continued androgen receptor signaling in prostate cancer. Clin Cancer Res. (2011) 17:3876–83. doi: 10.1158/1078–0432.CCR-10–2815
24. Mateo J, Smith A, Ong M, de Bono JS. Novel drugs targeting the androgen receptor pathway in prostate cancer. Cancer Metastasis Rev. (2014) 33:567–79. doi: 10.1007/s10555–013-9472–2
25. Wadosky KM, Koochekpour S. Therapeutic rationales, progresses, failures, and future directions for advanced prostate cancer. Int J Biol Sci. (2016) 12:409–26. doi: 10.7150/ijbs.14090
26. Carles J, Castellano D, Climent MA, Maroto P, Medina R, Alcaraz A. Castration-resistant metastatic prostate cancer: current status and treatment possibilities. Clin Transl Oncol. (2012) 14:169–76. doi: 10.1007/s12094-012-0780–8
27. Antonarakis ES, Heath EI, Smith DC, Rathkopf D, Blackford AL, Danila DC, et al. Repurposing itraconazole as a treatment for advanced prostate cancer: a noncomparative randomized phase II trial in men with metastatic castration-resistant prostate cancer. Oncologist. (2013) 18:163–73. doi: 10.1634/theoncologist.2012–314
28. Ho CH, Hsu JL, Liu SP, Hsu LC, Chang WL, Chao CC, et al. Repurposing of phentolamine as a potential anticancer agent against human castration-resistant prostate cancer: a central role on microtubule stabilization and mitochondrial apoptosis pathway. Prostate. (2015) 75:1454–66. doi: 10.1002/pros.23033
29. Schweizer MT, Haugk K, McKiernan JS, Gulati R, Cheng HH, Maes JL, et al. A phase I study of niclosamide in combination with enzalutamide in men with castration-resistant prostate cancer. PLoS ONE. (2018) 13:e0198389. doi: 10.1371/journal.pone.0198389
30. Berger MF, Lawrence MS, Demichelis F, Drier Y, Cibulskis K, Sivachenko AY, et al. The genomic complexity of primary human prostate cancer. Nature. (2011) 470:214–20. doi: 10.1038/nature09744
31. Boutros PC, Fraser M, Harding NJ, de Borja R, Trudel D, Lalonde E, et al. Spatial genomic heterogeneity within localized, multifocal prostate cancer. Nat Genet. (2015) 47:736–45. doi: 10.1038/ng.3315
32. Cooper CS, Eeles R, Wedge DC, Van Loo P, Gundem G, Alexandrov LB, et al. Analysis of the genetic phylogeny of multifocal prostate cancer identifies multiple independent clonal expansions in neoplastic and morphologically normal prostate tissue. Nat Genet. (2015) 47:367–72. doi: 10.1038/ng.3221
33. Kobayashi T, Inoue T, Kamba T, Ogawa O. Experimental evidence of persistent androgen-receptor-dependency in castration-resistant prostate cancer. Int J Mol Sci. (2013) 14:15615–35. doi: 10.3390/ijms140815615
34. Kang DD, Sibille E, Kaminski N, Tseng GC. MetaQC: objective quality control and inclusion/exclusion criteria for genomic meta-analysis. Nucleic Acids Res. (2012) 40:e15. doi: 10.1093/nar/gkr1071
35. Li J, Gruschow S, Tewari A. Words of wisdom. Re: prospective assessment of prostate cancer aggressiveness using 3-T diffusion-weighted magnetic resonance imaging-guided biopsies versus a systematic 10-core transrectal ultrasound prostate biopsy cohort. Eur Urol. (2012) 62:731–2. doi: 10.1016/j.eururo.2012.07.019
36. Lu S, Li J, Song C, Shen K, Tseng GC. Biomarker detection in the integration of multiple multi-class genomic studies. Bioinformatics. (2010) 26:333–40. doi: 10.1093/bioinformatics/btp669
37. Tseng GC, Ghosh D, Feingold E. Comprehensive literature review and statistical considerations for microarray meta-analysis. Nucleic Acids Res. (2012) 40:3785–99. doi: 10.1093/nar/gkr1265
38. Wang X, Lin Y, Song C, Sibille E, Tseng GC. Detecting disease-associated genes with confounding variable adjustment and the impact on genomic meta-analysis: with application to major depressive disorder. BMC Bioinformatics. (2012) 13:52. doi: 10.1186/1471–2105-13–52
39. Choi JK, Yu U, Kim S, Yoo OJ. Combining multiple microarray studies and modeling interstudy variation. Bioinformatics. (2003) 19 Suppl 1:i84–90. doi: 10.1093/bioinformatics/btg1010
40. Duan Q, Flynn C, Niepel M, Hafner M, Muhlich JL, Fernandez NF, et al. LINCS Canvas Browser: interactive web app to query, browse and interrogate LINCS L1000 gene expression signatures. Nucleic Acids Res. (2014) 42:W449–60. doi: 10.1093/nar/gku476
41. Gaulton A, Bellis LJ, Bento AP, Chambers J, Davies M, Hersey A, et al. ChEMBL: a large-scale bioactivity database for drug discovery. Nucleic Acids Res. (2012) 40:D1100–7. doi: 10.1093/nar/gkr777
42. Seashore-Ludlow B, Rees MG, Cheah JH, Cokol M, Price EV, Coletti ME, et al. Harnessing connectivity in a large-scale small-molecule sensitivity dataset. Cancer Discov. (2015) 5:1210–23. doi: 10.1158/2159–8290.CD-15–0235
43. Basu A, Bodycombe NE, Cheah JH, Price EV, Liu K, Schaefer GI, et al. An interactive resource to identify cancer genetic and lineage dependencies targeted by small molecules. Cell. (2013) 154:1151–61. doi: 10.1016/j.cell.2013.08.003
44. van Westen GJ, Gaulton A, Overington JP. Chemical, target, and bioactive properties of allosteric modulation. PLoS Comput Biol. (2014) 10:e1003559. doi: 10.1371/journal.pcbi.1003559
45. Lamb J, Crawford ED, Peck D, Modell JW, Blat IC, Wrobel MJ, et al. The connectivity map: using gene-expression signatures to connect small molecules, genes, and disease. Science. (2006) 313:1929–35. doi: 10.1126/science.1132939
46. Cheng J, Xie Q, Kumar V, Hurle M, Freudenberg JM, Yang L, et al. Evaluation of analytical methods for connectivity map data. Pac Symp Biocomput. (2013) 5–16. doi: 10.1142/9789814447973_0002
47. Zhang M, Chen M, Tong W. Is toxicogenomics a more reliable and sensitive biomarker than conventional indicators from rats to predict drug-induced liver injury in humans? Chem Res Toxicol. (2012) 25:122–9. doi: 10.1021/tx200320e
48. He L, Wennerberg K, Aittokallio T, Tang J. TIMMA-R: an R package for predicting synergistic multi-targeted drug combinations in cancer cell lines or patient-derived samples. Bioinformatics. (2015) 31:1866–8. doi: 10.1093/bioinformatics/btv067
49. Tang J, Karhinen L, Xu T, Szwajda A, Yadav B, Wennerberg K, et al. Target inhibition networks: predicting selective combinations of druggable targets to block cancer survival pathways. PLoS Comput Biol. (2013) 9:e1003226. doi: 10.1371/journal.pcbi.1003226
50. Pushpakom S, Iorio F, Eyers PA, Escott KJ, Hopper S, Wells A, et al. Drug repurposing: progress, challenges and recommendations. Nat Rev Drug Discov. (2018) 18:41–58. doi: 10.1038/nrd.2018.168
51. Huang YQ, Han ZD, Liang YX, Lin ZY, Ling XH, Fu X, et al. Decreased expression of myosin light chain MYL9 in stroma predicts malignant progression and poor biochemical recurrence-free survival in prostate cancer. Med Oncol. (2014) 31:820. doi: 10.1007/s12032–013-0820–4
52. Thangavel C, Boopathi E, Liu Y, Haber A, Ertel A, Bhardwaj A, et al. RB loss promotes prostate cancer metastasis. Cancer Res. (2017) 77:982–95. doi: 10.1158/0008–5472.CAN-16–1589
53. Zhu JG, Yuan DB, Chen WH, Han ZD, Liang YX, Chen G, et al. Prognostic value of ZFP36 and SOCS3 expressions in human prostate cancer. Clin Transl Oncol. (2016) 18:782–91. doi: 10.1007/s12094–015-1432–6
54. Yencilek F, Yilmaz SG, Yildirim A, Gormus U, Altinkilic EM, Dalan AB, et al. Apolipoprotein E Genotypes in patients with prostate cancer. Anticancer Res. (2016) 36:707–11.
55. Schneider BJ, Kalemkerian GP, Bradley D, Smith DC, Egorin MJ, Daignault S, et al. Phase I study of vorinostat (suberoylanilide hydroxamic acid, NSC 701852) in combination with docetaxel in patients with advanced and relapsed solid malignancies. Invest New Drugs. (2012) 30:249–57. doi: 10.1007/s10637–010-9503–6
56. Rathkopf DE, Picus J, Hussain A, Ellard S, Chi KN, Nydam T, et al. A phase 2 study of intravenous panobinostat in patients with castration-resistant prostate cancer. Cancer Chemother Pharmacol. (2013) 72:537–44. doi: 10.1007/s00280–013-2224–8
57. Twardowski PW, Beumer JH, Chen CS, Kraft AS, Chatta GS, Mitsuhashi M, et al. A phase II trial of dasatinib in patients with metastatic castration-resistant prostate cancer treated previously with chemotherapy. Anticancer Drugs. (2013) 24:743–53. doi: 10.1097/CAD.0b013e328361feb0
58. Whang YE, Armstrong AJ, Rathmell WK, Godley PA, Kim WY, Pruthi RS, et al. A phase II study of lapatinib, a dual EGFR and HER-2 tyrosine kinase inhibitor, in patients with castration-resistant prostate cancer. Urol Oncol. (2013) 31:82–6. doi: 10.1016/j.urolonc.2010.09.018
59. Mateo J, Carreira S, Sandhu S, Miranda H, Mossop H, Perez-Lopez R, et al. DNA-repair defects and olaparib in metastatic prostate cancer. N Engl J Med. (2015) 373:1697–708. doi: 10.1056/NEJMoa1506859
60. Tannock IF, de Wit R, Berry WR, Horti J, Pluzanska A, Chi KN, et al. Docetaxel plus prednisone or mitoxantrone plus prednisone for advanced prostate cancer. N Engl J Med. (2004) 351:1502–12. doi: 10.1056/NEJMoa040720
61. Al-Lazikani B, Banerji U, Workman P. Combinatorial drug therapy for cancer in the post-genomic era. Nat Biotechnol. (2012) 30:679–92. doi: 10.1038/nbt.2284
62. Keith CT, Borisy AA, Stockwell BR. Multicomponent therapeutics for networked systems. Nat Rev Drug Discov. (2005) 4:71–8. doi: 10.1038/nrd1609
63. Barata PC, Cooney M, Mendiratta P, Tyler A, Dreicer R, Garcia JA. Ketoconazole plus Lenalidomide in patients with Castration-Resistant Prostate Cancer (CRPC): results of an open-label phase II study. Invest New Drugs. (2018) 36:1085–92. doi: 10.1007/s10637–018-0660–3
64. Shimokihara K, Kawahara T, Suzuki T, Mochizuki T, Takamoto D, Teranishi JI, et al. Lenalidomide decreased the PSA level for castration-resistant prostate cancer: a case report. Clin Case Rep. (2018) 6:391–4. doi: 10.1002/ccr3.1328
65. Sridhar SS, Joshua AM, Gregg R, Booth CM, Murray N, Golubovic J, et al. A phase II study of GW786034 (pazopanib) with or without bicalutamide in patients with castration-resistant prostate cancer. Clin Genitourin Cancer. (2015) 13:124–9. doi: 10.1016/j.clgc.2014.06.001
66. Rini B, Redman B, Garcia JA, Burris HA, Li S, Fandi A, et al. A phase I/II study of lenalidomide in combination with sunitinib in patients with advanced or metastatic renal cell carcinoma. Ann Oncol. (2014) 25:1794–9. doi: 10.1093/annonc/mdu212
Keywords: drug repositioning, castration resistant prostate cancer, gene expression, drug activity, synergic effect
Citation: Kim I-W, Kim JH and Oh JM (2019) Screening of Drug Repositioning Candidates for Castration Resistant Prostate Cancer. Front. Oncol. 9:661. doi: 10.3389/fonc.2019.00661
Received: 28 January 2019; Accepted: 05 July 2019;
Published: 23 July 2019.
Edited by:
Scott T. Tagawa, Department of Medicine, Weill Cornell Medicine, Cornell University, United StatesReviewed by:
Young E. Whang, University of North Carolina at Chapel Hill, United StatesMasaki Shiota, Kyushu University, Japan
Copyright © 2019 Kim, Kim and Oh. This is an open-access article distributed under the terms of the Creative Commons Attribution License (CC BY). The use, distribution or reproduction in other forums is permitted, provided the original author(s) and the copyright owner(s) are credited and that the original publication in this journal is cited, in accordance with accepted academic practice. No use, distribution or reproduction is permitted which does not comply with these terms.
*Correspondence: In-Wha Kim, aXdraW0yQGhhbm1haWwubmV0; Jung Mi Oh, am1vaEBzbnUuYWMua3I=