 Min Zhang1,2†
 Jiuming He3†
 Tiegang Li3Haixu Hu4Xiaofei Li5Hao Xing5Jun Wang6Fan Yang6Qunfeng Ma7Bing Liu4Chuanhao Tang8Zeper Abliz3,9*Xiaoqing Liu2*
- 1Academy of Military Medical Science, Beijing, China
- 2Department of Lung Cancer, The Fifth Medical Center of Chinese PLA General Hospital, Beijing, China
- 3State Key Laboratory of Bioactive Substance and Function of Natural Medicines, Institute of Materia Medica, Peking Union Medical College, Chinese Academy of Medical Sciences, Beijing, China
- 4Laboratory of Oncology, The Fifth Medical Center of Chinese PLA General Hospital, Beijing, China
- 5Department of Thoracic Surgery, Tangdu Hospital, Air Force Military Medical University, Xi'an, China
- 6Department of Thoracic Surgery, Peking University People's Hospital, Beijing, China
- 7Department of Thoracic Surgery, The Fifth Medical Center of Chinese PLA General Hospital, Beijing, China
- 8Department of Oncology, Peking University International Hospital, Beijing, China
- 9Center for Imaging and Systems Biology, Minzu University of China, Beijing, China
Objectives: Tumor pathology examination especially epidermal growth factor receptor (EGFR) mutations molecular testing has been integral part of lung cancer clinical practices. However, the EGFR mutations spatial distribution characteristics remains poorly investigated, which is critical to tumor heterogeneity analysis and precision diagnosis. Here, we conducted an exploratory study for label-free lung cancer pathology diagnosis and mapping of EGFR mutation spatial distribution using ambient mass spectrometry imaging (MSI).
Materials and Methods: MSI analysis were performed in 55 post-operative non-small cell lung cancer (NSCLC) tumor and paired normal tissues to distinguish tumor from normal and classify pathology. We then compared diagnostic sensitivity of MSI and ADx-amplification refractory mutation system (ARMS) for the detection of EGFR mutation in pathological confirmed lung adenocarcinoma (AC) and explored EGFR mutations associated biomarkers to depict EGFR spatial distribution base on ambient MSI.
Results: Of 55 pathological confirmed NSCLC, MSI achieved a diagnostic sensitivity of 85.2% (23/27) and 82.1% (23/28) for AC and squamous cell carcinoma (SCC), respectively. Among 27 AC, there were 17 EGFR-wild-type and 10 EGFR-mutated-positive samples detected by ARMS, and MSI achieved a diagnostic sensitivity of 82.3% (14/17) and 80% (8/10) for these two groups. Several phospholipids were specially enriched in AC compared with SCC tissues, with the higher ions intensity of phospholipids in EGFR-mutated-positive compared with EGFR-wild-type AC tissues. We also found EGFR mutations distribution was heterogeneous in different regions of same tumor by multi-regions ARMS detection, and only the regions with higher ions intensity of phospholipids were EGFR-mutated-positive.
Conclusion: MSI method could accurately distinguish tumor pathology and subtypes, and phospholipids were reliable EGFR mutations associated biomarkers, phospholipids imaging could intuitively visualize EGFR mutations spatial distribution, may facilitate our understanding of tumor heterogeneity.
Highlights
- Lung tumors are heterogeneous, making diagnosis, and treatment difficult.
- Metabolomics can be used to separate lung tumor and healthy tissue in real time.
- Metabolite profiling can assess lung tumor pathology and EGFR mutation status.
- Mass spectrometry imaging analysis can visually plot the spatial distribution heterogeneity of EGFR mutation status, which may benefit our understanding of tumor heterogeneity.
Introduction
Lung cancer is a highly heterogeneous malignant epithelial tumor with distinct pathological features and clinical behavior (1). It can be routinely classified into non-small cell lung cancer (NSCLC) and small cell lung cancer according to histopathology, with NSCLC accounts for 85% of cases. The clinical treatment program decisions in lung cancer always depended largely on accurate classification of tumor types and subtypes. Advance in molecular diagnostic technology and deep study of tumor biology, NSCLC are found to have diverse molecular subtypes according to lung cancer-specific driver oncogenes (2–5). Epidermal growth factor receptor (EGFR) (6–10) is one of the most common driver oncogenes, but also an important therapeutic target and good predictor of the curative effect of targeted drugs in NSCLC. Hence, accurate molecular pathology testing especially EGFR mutations detection has been an expert consensus in lung cancer clinical practice (11).
Tumor spatiotemporal heterogeneity remains the main reason of anti-tumor therapy failure, which has significant influence on the treatment decision making and patients' prognosis. Because of tumor spatiotemporal heterogeneity, NSCLC patients harbor EGFR mutations will have different drug response and clinical benefit treated with EGFR-tyrosine kinase inhibitors (TKIs) (1, 12–17). However, routine driver oncogenes detection methods (18, 19) including direct sequencing and ARMS have inherent limitations: lose all spatial distribution information of EGFR mutations during the tumor tissue homogenization process. Hence, the current gene mutation detection methods are unable to reveal the EGFR mutation spatial distribution features. New methods are urgently needed to intuitively visualize the spatial distribution of EGFR mutations across whole tumor tissues and facilitate more accurate EGFR mutations detection.
MSI, a spatially resolved label-free bioanalytical technique (20–25), can directly map the spatial distribution of chemical molecules (i.e., proteins and metabolites) in biological tissues, has been widely used for biomarkers screening and disease diagnosis. Air flow assisted desorption electrospray ionization-MSI (AFADESI-MSI) (20, 21) is an ambient MSI technique which specially characterized the endogenous metabolites such as lipids in biological tissues. This approach allows rapid and nearly real-time analysis with minimal pre-treatment, usually a single AFADESI-MSI analysis of a tissue section requires only tens of minutes. AFADESI-MSI can produce a multicolor map to illustrate the spatial distribution of the molecules of interest or candidate biomarkers while maintain tissue morphology integrity, will facilitate studies of tumor spatial heterogeneity.
The present study is an extension of our previous work (20) with the goal to explore EGFR mutations associated biomarkers, and visualize EGFR mutation spatial distribution in lung adenocarcinoma (LADC) tissues using ambient AFADESI-MSI.
Materials and Methods
Sample Collection and Pre-treatment
All post-operative lung cancer tissue and paired adjacent normal (more than 5 cm to tumor) samples were collected from the Tang Du Hospital of Air Force Military Medical University, Peking University People's Hospital, and the Fifth Medical Center of Chinese PLA General Hospital following ethics committee approval number: 2012-11-171. The enrolled patients were all newly diagnosed did not show other tumor occurrences. Patients had not received chemotherapy or radiotherapy prior to surgery. Study protocols were approved by the ethical review community of the Fifth Medical Center of Chinese PLA General Hospital, and all study participants provided informed written consent. Samples were washed twice with sterile saline to remove the blood clots. Then the samples were flash frozen in liquid nitrogen and stored at −80°C before being sectioned at 8-μm thickness using a cryomicrotome (CM 1950; Leica, Wetzlar, Germany) and thaw-mounted onto glass slides (Superfrost Plus slides, Thermo Fisher Scientific, Waltham, MA, USA). Five tissue sections were cut and collected, and one cryosection was acetone-fixed and subsequently stained using haematoxylin and eosin (H&E) for pathological examination. Other slides were stored in closed containers at −80°C for AFADESI-MSI analysis. Prior to analysis, the slides were allowed to thaw at room temperature and were dried in a desiccator for ~30 min.
Histopathology Analysis and EGFR Mutation Detection
Tumor content and pathology was assessed by two independent pathologists according to H&E-stained and immunohistochemistry (streptavidin-perosidase, S-P) examination. Detection of EGFR mutations was undertaken using an ADx-ARMS EGFR mutation test kit (Amoy Diagnostics, Xiamen, China) according to the manufacturer's instructions on a 7500 real-time PCR System (Applied Biosystems, Foster City, CA, USA). DNA quality and integrity were evaluated according to the 260 nm/280 nm ratio using a NanoDrop 2000 Ultramicro spectrophotometer (Thermo Fisher Scientific). We defined the presence of an EGFR mutation as Ct <26 (representing the number of cycles in which the fluorescent signal from each reaction tube reached the set threshold) and mutation abundance >5%.
MSI Profiling and Metabolite Identification
The MSI profiling experiments were performed using a Q-TOF (QSTAR Elite, Applied Biosystem/MDS Sciex) equipped with a custom-made AFAI ion source as previously described (20). Metabolite assignments were tentatively confirmed by tandem mass spectrometry (MS/MS) based on a liquid chromatography mass spectrometry (LC-MS) technique (26–28). Briefly, frozen lung tissue samples (wet weight: ~50 mg) were homogenized in a pre-cooled solution (410 μL of methanol and 210 μL of water), followed by addition of 280 μL of methylene dichloride and 210 μL of water. Homogenates were thoroughly vortexed for 2 min, followed by centrifugation at 15,000 rpm for 10 min at 4°C. Centrifugation produced a biphasic mixture, with the upper (polar) and lower (non-polar) layers collected separately and dried under nitrogen. Before analysis, polar extracts were resuspended in 1.2 mL of 8:2 acetonitrile: water, and non-polar extracts were resuspended in 120 μL of 40:60 acetonitrile: water. Analyses were conducted on an UltiMate 3000 RSLC System (Dionex; Thermo Fisher Scientific) coupled to a Q-Orbitrap mass spectrometer (Q-Exactive; Thermo Fisher Scientific). The MS spray voltage was ± 3.5 kV, and the capillary temperature was set to 350°C, with the sheath gas at 40 arbitrary units and the aux gas at 11 arbitrary units. The chromatographic peak width was 15 s, and the mass scan range was set to a range of 70 Da to 1,000 Da. The resolution of the Orbitrap was set to 70,000. MS/MS data were collected with the collision energy between ± 10 and ± 45 eV. A linear 30-min water (5 mM ammonium acetate)-to-acetonitrile gradient was run on a Phenomenex Kinetex HILIC column (2.6 μm, 2.1 × 150 mm; Phenomenex, Torrance, CA, USA) for the polar sample. For the non-polar layer, a linear 35-min water (0.1% formic acid)-to-acetonitrile gradient was employed on a Waters ACQUITY UPLC CSH C18 column (1.7 μm, 2.1 × 100 mm; Waters Corp., Milford, MA, USA). Data regarding exact molecular weights (accurate masses of parent and product ions in MS/MS spectra) retrieved from the literature or online databases [HMDB (http://www.hmdb.ca/metabolites), Massbank (https://massbank.eu/MassBank/Index), and Lipid maps (http://www.lipidmaps.org/)] were used to tentatively confirm the postulated structures of these potential biomarkers.
Data Processing and Statistical Analysis
All LADC tissue sections were subjected to AFADESI-MSI analysis and we constructed three diagnostic model: tumor vs. normal, AC vs. SCC and EGFR-mutated-positive vs. EGFR-wild-type as the flow chart described (Figure 1). Raw mass spectrometry data were extracted from the selected regions of interest based on the visual ion image and the corresponding optical image of the tissue section. The raw dataset matrixes were imported into MarkerView (v1.2.1, AB SCIEX) for background deduction, peak picking, and peak alignment. Filtered quality control data were then imported into SIMCA-P software (v14.1, Umetrics AB, Umea, Sweden) to conduct orthogonal projections to latent structures discriminant analysis (OPLS-DA), then the OPLS-DA was applied for the exploration of discriminating variables of three diagnostic models, respectively (29). Discriminating variables with both high covariance and correlation were preferentially selected by S-plot and variable importance (26, 28). Biomarker candidates were further confirmed by an independent t test (Microsoft Office Excel 2010), and the variation in and comparison of potential biomarker levels between the experimental groups were presented as histograms (GraphPad Prism 6.02). The receiver operating characteristic and area under the curve values were used to assess the diagnostic power of the selected variables using SPSS (v19.0.0).
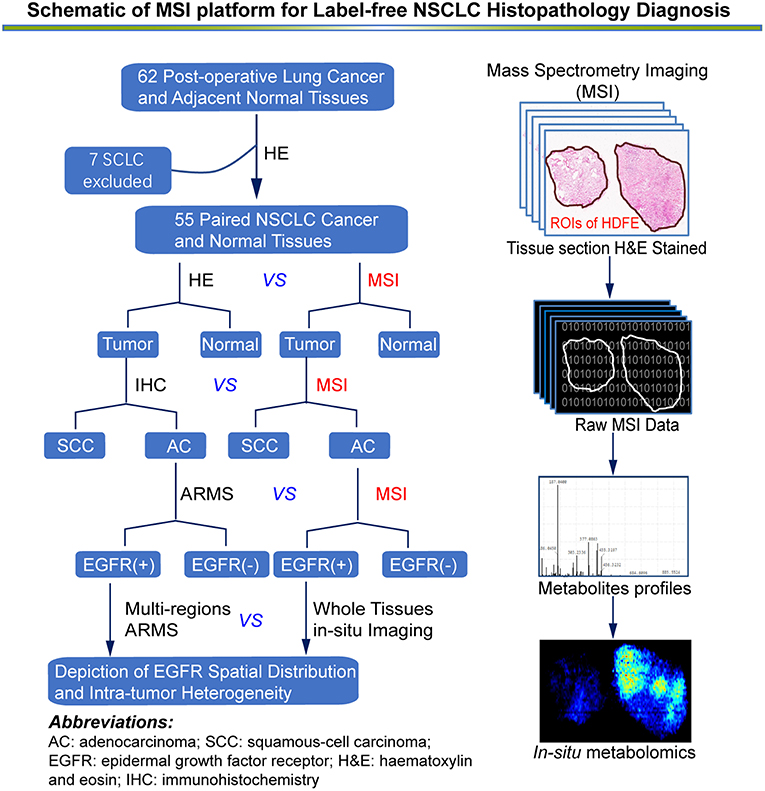
Figure 1. An overview of MSI platform for label-free NSCLC pathology diagnosis. Definition of regions of interest (ROIs) and strategy for developing an in situ metabolomics method to discover reliable diagnostic biomarkers to classify molecular pathology and map EGFR mutation status in NSCLC tissues.
Results
A complete description of the specimens used in this study, including information regarding number, sex, age, type, Eastern Cooperative Oncology Group performance status scores, smoking history, tumor-node-metastasis stage, and EGFR status, is provided in Table 1 and Table S1. Representative mass spectra from human lung cancer tissue and corresponding adjacent normal tissue, as well as different pathology types and the EGFR mutation status of lung cancer acquired by AFADESI-MSI, are provided in Figures S1–S3 and Table 2. More detailed information on these three diagnostic models using MSI is described below.
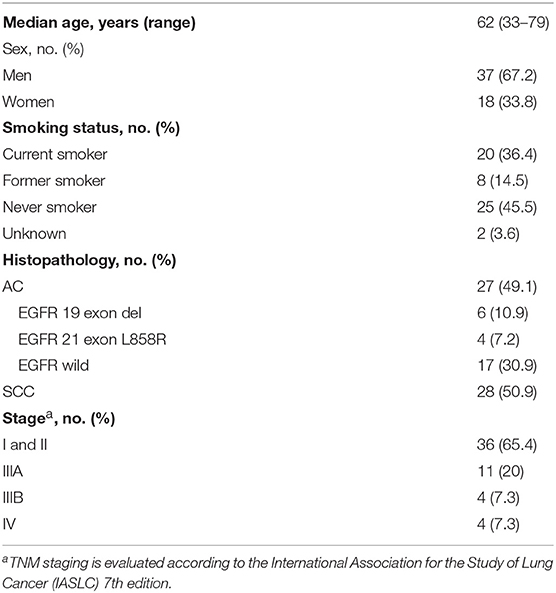
Table 1. Summary of the lung cancer specimens used in this study (N = 55).
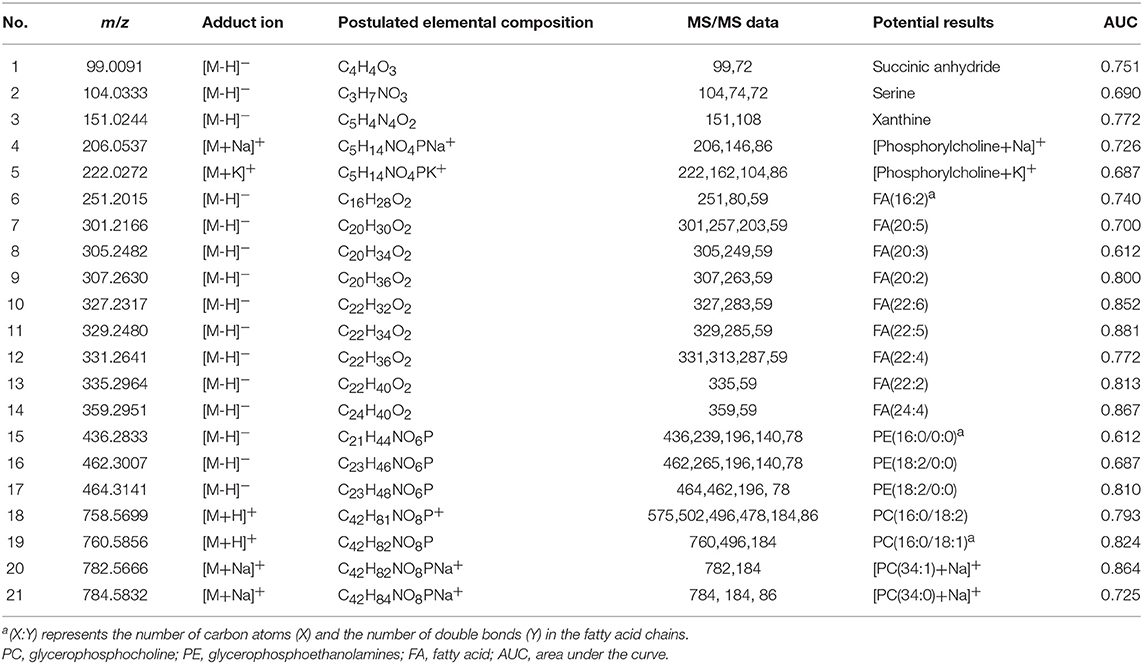
Table 2. Potential biomarkers of lung tumors and their tentative identifications results.
Lipid Profiles Facilitate Accurate Classification of Tumor
AFADESI-MSI analysis was performed on 55 paired, treatment-naïve, post-operative lung cancer tissue sections, and corresponding normal tissues to discover potential diagnostic biomarkers for use in differentiating malignant tumors and normal tissue (Figure S5A) according to the protocol outlined in our previous work (20). The most prevalent metabolites species observed in lung cancer tissues were glycerophosphocholines (PCs) and fatty acids (FAs). Eleven metabolites were discovered to be specially enriched in NSCLC tumor tissues, with the signal acquired from tumor tissues being stronger than that obtained from adjacent normal tissues. Both potential biomarkers showed a clear distinction between tumor tissues and normal tissues and could depict a clear tissue contour using MSI shown in Figure 2. The spatial distributions of these metabolites in the ion images were consistent with the statistical trends shown in the histogram. In addition, these differential metabolites group achieved a high diagnostic power of 0.991 after binary logistic regression (Figures S4A,D) for classification of tumor and normal tissues.
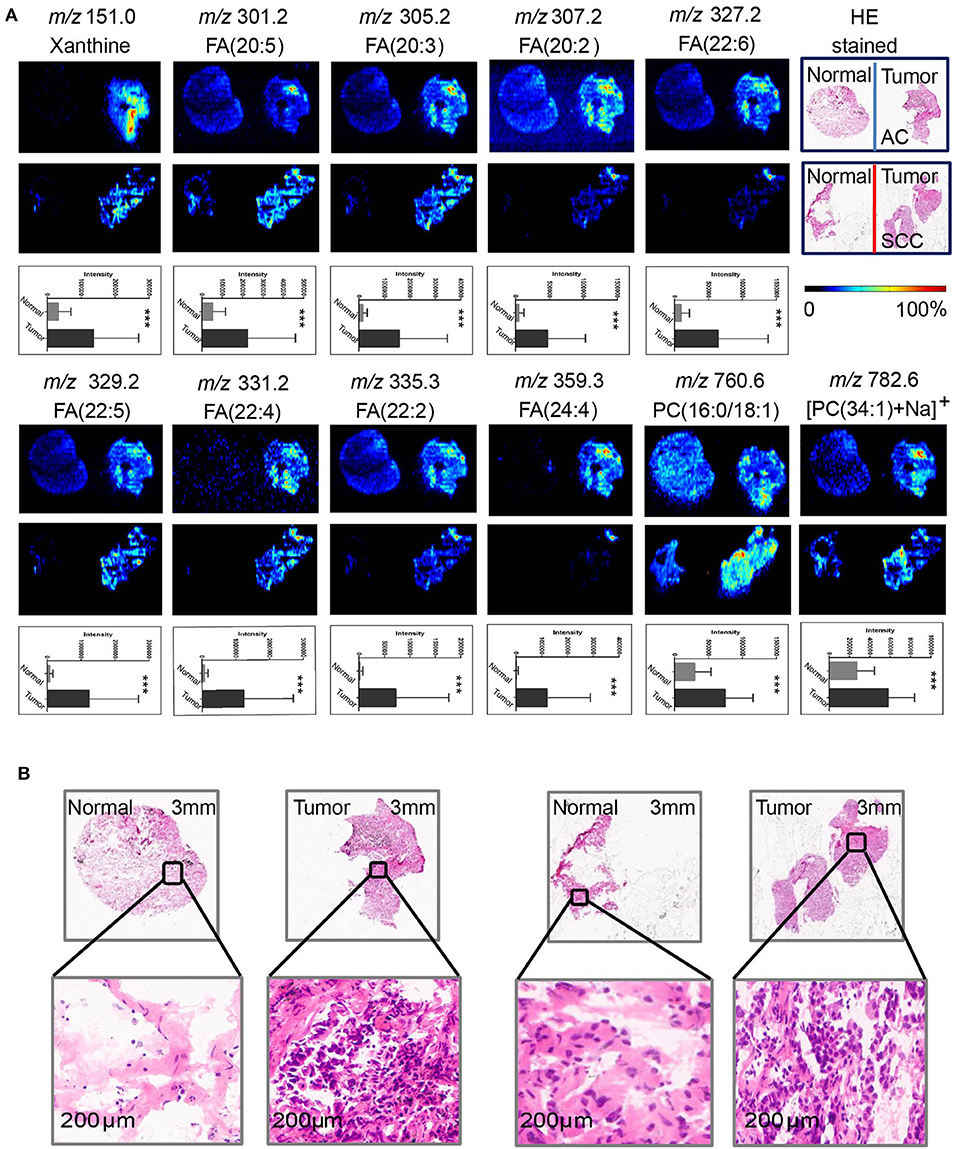
Figure 2. Distributions of representative potential biomarkers (group) across tumors and adjacent normal tissue sections from AC and SCC lung cancer. (A) Xanthine; FA(20:5); FA(20:3); FA(20:2); FA(22:6); FA(22:5); FA(22:4); FA(22:2); FA(24:4); PC(16:0/18:1); [PC(34:1)+Na]+]. (B) Optical images of corresponding H&E stained sections and the amplified figures of tumor and normal lung tissues (× 200).
Lipid Profiles Facilitate Label-Free Lung Cancer Molecular Diagnosis and EGFR Mutations Detection
Although sharing most of the malignancy signature, different pathological types of lung cancer were characterized by differences in their metabolic behavior (30, 31). We further investigated the metabolic difference of AC from SCC and tried to explore discriminative biomarkers to classify these two groups (Figure S5B). Interestingly, MSI images (Figure 3) showed that the phosphorylcholine molecules and PC had a stronger ions intensity in AC compared with SCC tissues while the SCC tissues were specially enriched with succinic anhydride and serine. These biomarkers group generated by MSI achieved a diagnostic sensitivity of 85.2% (23/27) and 82.1% (23/28) for AC and SCC, respectively, with a high diagnostic power of 0.827 for pathological diagnosis model (Figures S4B,D). As the MSI method could intuitively reveal the discriminative biomarkers distribution in tumor tissues without antibody staining, the difference of metabolites abundance in tumor tissues could be used to study the tumor behavior characteristic between tumor subtypes. Hence, we further validated the ability of the MSI method to distinguish EGFR-mutated-positive from EGFR-wild-type AC samples. There was a trend indicating clear separation between EGFR-mutated-positive and EGFR-wild-type samples after multivariate statistical analysis (Figure S5C), whereas EGFR-mutated-positive subtypes (19-DEL vs. 21-L858R) were not distinguished well (Figure S5D), possibly due to the number of specimens. We also discovered a panel of lipids associated with EGFR mutations status. As shown in Figure 4, the phospholipids molecules m/z 436.3 [PE(16:0/0:0)], m/z 462.3 [PE(18:2/0:0)], m/z 464.3 [PE(18:2/0:0)], and m/z 758.6 [PC(16:0/18:2)] were discovered to be specially enriched in EGFR-mutated-positive compared with EGFR-wild-type samples. These phospholipids biomarkers achieved a diagnostic sensitivity of 82.3% (14/17) and 80% (8/10) for these two groups with a high diagnostic power of 0.880 (Figures S4C,D). Noteworthy, in one AC sample (N34, EGFR-mutated-positive), we observed that these phospholipids had a distinct distribution in separate regions of the same tumor tissue. We deduce that the heterogeneous distribution of phospholipids in tumor tissues may be related to the spatial distribution heterogeneity of EGFR mutations. To validate this hypothesis, we confirmed that the N34 sample had a high abundance of tumor cells according to imaging of tumor-related biomarkers (Figure 5A). Then, we extracted nucleic acids from different regions of tumor tissue for ARMS analysis, which revealed that only the region providing the strongest ion intensities of phospholipids (Figure 5B) for the EGFR mutation returned a positive result (Figures 5C–E). These results suggested that phospholipids molecules, including PC and PE, but not FA, might be more reliable biomarkers to characterize EGFR mutation status.
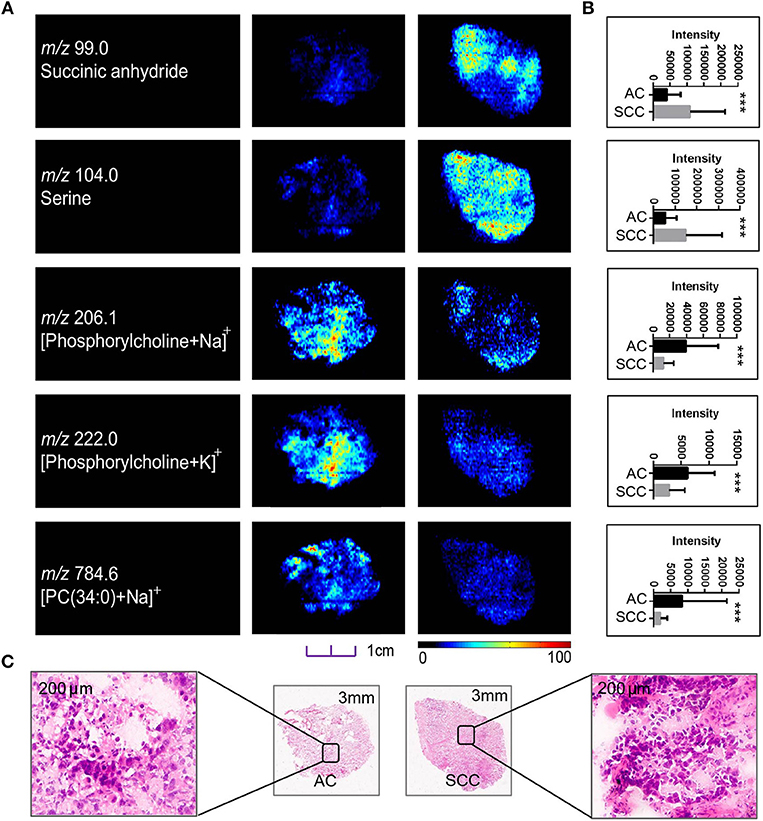
Figure 3. Distributions of representative potential pathology-related biomarkers (A) across AC and SCC tumors and the histogram (B) showed relative expression level of these biomarkers in AC (black box) and SCC tumors (gray box). (C) Optical images of corresponding H&E stained sections the amplified figures (× 200). PC, Phosphorylcholine. *p < 0.05, **p < 0.01, ***p <0.001 (t-test).
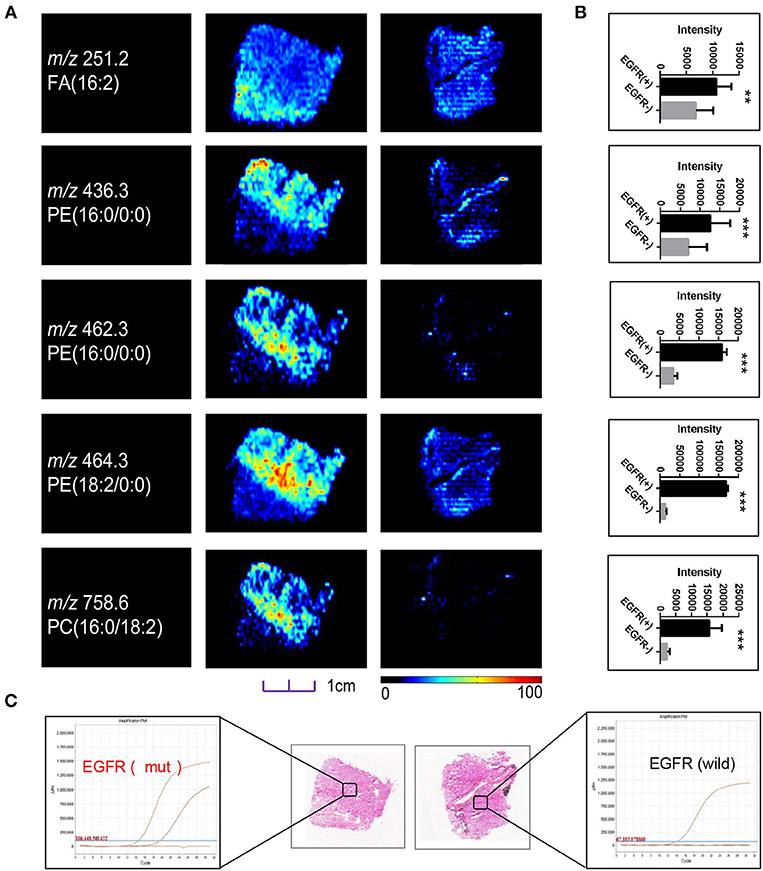
Figure 4. (A) Distributions of representative potential EGFR-related biomarkers (A) across different EGFR mutation status of lung cancer, and histogram (B) the boxplot showed relative expression level of these biomarkers in EGFR-mutated-positive (gray box) and EGFR-wild (black box) samples. (C) Optical images of corresponding H&E stained sections and DNA amplification plot of EGFR by ARMS; *p < 0.05, **p < 0.01, ***p <0.001 (t-test).
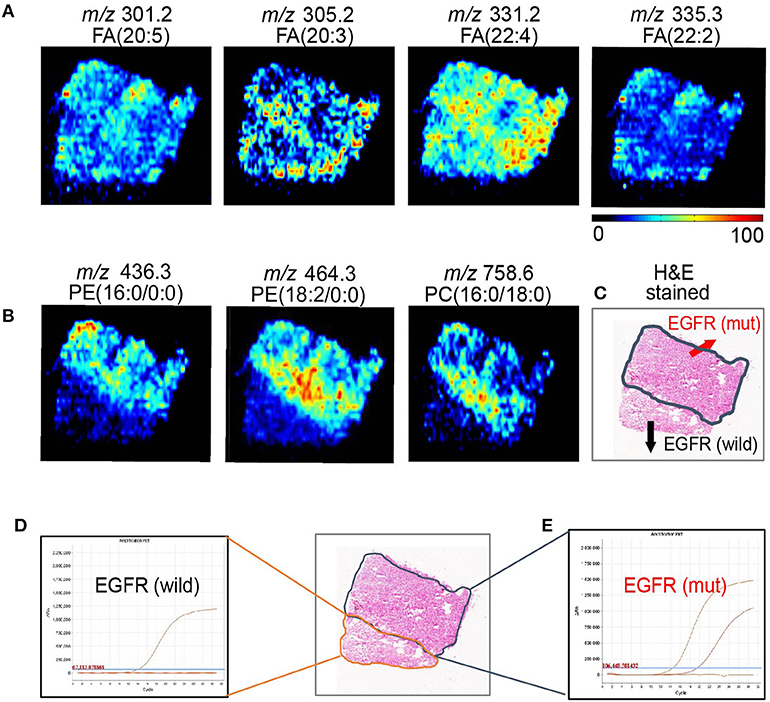
Figure 5. AFADESI-MSI revealed the spatial heterogeneity of EGFR by in situ metabolomics imaging. (A) The tumor-related biomarkers of FA(20:5), FA(20:3), FA(22:4), FA(22:2) were used to showcase the overall contour of cancerous tissue. (B) The EGFR-related biomarkers of PE(16:0/0:0), PE(18:2/0:0), and PE(16:0/18:0) present the EGFR mutation spatial distribution heterogeneity. (C) With region of tissue harbor EGFR mutation delineated by dotted blue line shown in optical image. DNA amplification plot of EGFR by ARMS. (D) EGFR mutant-wild; (E) EGFR mutant positive.
Discussion
Endogenous metabolites serve as direct signatures of biochemical activity and downstream products of gene expression, and are therefore easier to correlate with phenotype and can help to understand the pathogenesis (31). In this study, we discovered several reliable discriminative tumor biomarkers which could be used for classification of tumor and normal samples. Based on the tumor associated lipids imaging, tumor margin and contour could be immediately recognized and mapped, which may benefit accurate surgical resections. We also found the phospholipids were specially enriched in AC compared with SCC tissues. Noteworthy, with the higher ions intensity of phospholipids in EGFR-mutated-positive AC compared with EGFR-wild-type samples. These findings were consistent with the result that abnormal choline phospholipid metabolism is a hallmark of cancer (32). Two independent studies also revealed EGFR-mutated-positive NSCLC had a unique metabotype according to lipidomic profiling in lung pleural effusion (33) and phospholipids of tumor extracellular vesicles were different in gefitinib-resistant NSCLC cells from gefitinib-sensitive NSCLC cells (34). These results along with our observation showed phospholipids may represent reliable discriminative biomarkers associated with EGFR mutations status.
Tumor tissues are known to contain both tumor cells and normal cells, with transitional and apoptotic cells also included, the EGFR mutations in separate regions of the same tumor tissue may be highly heterogeneous. In addition, EGFR mutations spatial heterogeneity remains one of most important reason leading to targeted drug resistance, which has posed a series of challenge to both accurate diagnosis and personalized therapy. The routine EGFR mutations detection methods inherently lose all spatial information during pre-treatment process, may obscure the difference between separate spatial regions of tumor tissues. Hence, current gene mutations detection methods provided little information of EGFR mutations spatial distribution, were unable to assess the intra-tumor heterogeneity. For a more accurate EGFR mutations diagnosis, several research groups (12–14) tried to apply laser capture micro-dissection to extract tumor materials in different tumor spatial regions and perform multiregional genomic sequencing to generate a comprehensive EGFR mutations spatial landscape. In addition, isotopically labeled EGFR-TKIs probes (35, 36) have also been used for in vivo molecular imaging of EGFR spatial distribution in lung tumor xenografts. However, these methods have inherent limitations: a large amount of tumor tissue is needed, the sample pre-treatment is complex and time consuming. These methods remain available only in a low-throughput manner, and therefore cannot be routinely applied clinically for lung cancer diagnosis.
As MSI can directly map the spatial distribution of molecules of interest in association with pathological features in small amount of tissue sample with minimal pre-treatment, has been recognized as a label-free IHC form (25). The matrix assisted laser desorption/ionization mass spectrometry imaging (MALDI-MSI) technique has been used to explore the proteomic differences and intuitively reveal HER2 receptor status in breast cancer (37). In this study, we also revealed that the phospholipids signature was able to accurately classify EGFR mutation status. According to phospholipids imaging, the EGFR mutation spatial distribution map in whole tumor tissues was not difficult to generate, thereby we could visually observe the EGFR mutations spatial distribution features. We also performed multi-regions ARMS EGFR detection in tissue section of each tumor sample. Interestingly, we found that only the regions providing the strongest ions intensity of phospholipids were EGFR-mutated-positive, suggested that phospholipids imaging could reveal EGFR mutations spatial distribution heterogeneity. To our knowledge, this is the first time to generate a comprehensive EGFR spatial distribution landscape and observe EGFR mutation intratumor heterogeneity based on metabolites imaging. The MSI method may provide a new perspective to analyze and monitor the EGFR mutation status in vivo, potentially benefitting real-time monitoring of targeted therapy.
As this is a preliminary study, the number of cases studied here was limited, our findings of the phospholipid biomarkers for the identification of EGFR mutations status need to be validated in a larger cohort of patients. Second, whether or not these biomarkers can predict the clinical response of EGFR-targeting drugs remains unclear. Future studies to use these phospholipid biomarkers for dynamic observation of EGFR-TKIs efficacy are currently under consideration as a possible extension of our work.
Data Availability
The raw data supporting the conclusions of this manuscript is available in Data Sheets S1 and S2.
Ethics Statement
This study was carried out in accordance with the recommendations of the ethical review community of the Fifth Medical Center of Chinese PLA General Hospital with written informed consent from all subjects. All subjects gave written informed consent in accordance with the Declaration of Helsinki. The protocol was approved by the ethical review community of the Fifth Medical Center of Chinese PLA General Hospital.
Author Contributions
XLiu and ZA designed and supervised the entire study. MZ, TL, and JH planned the experiments. HX, XLi, FY, JW, and QM provided lung cancer samples, clinical diagnosis information, and confirmed tumor margin and content. HH performed ARMS analysis of EGFR. BL and CT had participated in the discussion. MZ, TL, and JH performed AFADESI-MSI analysis, data mining and processing, and wrote the manuscript.
Funding
We thank the following agencies and foundations for their financial support: The National Key Foundation for Exploring Scientific Instrument of China (grant No. 2011YQ170067), Beijing Municipal Science & Technology Commission (grant No. Z181100001718074), and the National Natural Science Foundation of China (grant No. 81102413).
Conflict of Interest Statement
The authors declare that the research was conducted in the absence of any commercial or financial relationships that could be construed as a potential conflict of interest.
Supplementary Material
The Supplementary Material for this article can be found online at: https://www.frontiersin.org/articles/10.3389/fonc.2019.00804/full#supplementary-material
Table S1. Information on human specimens used in this study.
Data Sheet S1. Raw mass spectrometry expression matrix in positive ions model.
Data Sheet S2. Raw mass spectrometry expression matrix in negative ions model.
Figure S1. Representative mass spectra from human lung cancer tissue and corresponding adjacent normal tissue acquired by AFADESI-MSI.
Figure S2. Representative mass spectra from AC and SCC tumors samples acquired by AFADESI-MSI.
Figure S3. Representative mass spectra from EGFR-mutated-positive samples and EGFR-wild-type samples acquired by AFADESI-MSI.
Figure S4. The ROC curve illustrates the combined discriminatory performance of a group of valuable clinical biomarkers in (A) Tumor diagnosis model, (B) pathology type classification model, (C) EGFR mutation detection model, and (D) the histogram revealed the diagnostic power of each discriminatory biomarker.
Figure S5. Score plot of the OPLS-DA models derived from AFADESI-MSI data for (A) tumor diagnosis model, (B) pathology type classification model, (C) EGFR mutation detection model, and (D) EGFR mutation subtypes detection model.
Abbreviations
AC, adenocarcinoma; SCC, squamous-cell carcinoma; AFADESI, air-flow-assisted desorption electrospray ionization; ARMS, amplification refractory mutation system; EGFR, epidermal growth factor receptor; H&E, haematoxylin and eosin; LC-MS, liquid chromatography mass spectrometry; MS/MS, tandem mass spectrometry; MSI, mass spectrometry imaging; NSCLC, non-small-cell lung cancer; SCLC, small cell lung cancer; TKI, tyrosine kinase inhibitor.
References
1. Chen Z, Fillmore CM, Hammerman PS, Kim CF, Wong KK. Non-small-cell lung cancers: a heterogeneous set of diseases. Nat Rev Cancer. (2014) 14:535–46. doi: 10.1038/nrc3775
2. Chapman AM, Sun KY, Ruestow P, Cowan DM, Madl AK. Lung cancer mutation profile of EGFR, ALK, and KRAS: meta-analysis and comparison of never and ever smokers. Lung Cancer. (2016) 102:122–34. doi: 10.1016/j.lungcan.2016.10.010
3. Dearden S, Stevens J, Wu YL, Blowers D. Mutation incidence and coincidence in non small-cell lung cancer: meta-analyses by ethnicity and histology (mutMap). Ann Oncol. (2013) 24:2371–6. doi: 10.1093/annonc/mdt205
4. Gou LY, Wu YL. Prevalence of driver mutations in non-small-cell lung cancers in the People's Republic of China. Lung Cancer. (2014) 5:1–9. doi: 10.2147/LCTT.S40817
5. Cancer Genome Atlas Research Network. Comprehensive molecular profiling of lung adenocarcinoma. Nature. (2014) 511:543–50. doi: 10.1038/nature13385a
6. Zhou C, Wu YL, Chen G, Feng J, Liu XQ, Wang C, et al. Erlotinib versus chemotherapy as first-line treatment for patients with advanced EGFR mutation-positive non-small-cell lung cancer (OPTIMAL, CTONG-0802): a multicentre, open-label, randomised, phase 3 study. Lancet Oncol. (2011) 12:735–42.
7. Garassino MC, Martelli O, Broggini M, Farina G, Veronese S, Rulli E, et al. Erlotinib versus docetaxel as second-line treatment of patients with advanced non-small-cell lung cancer and wild-type EGFR tumours (TAILOR): a randomised controlled trial. Lancet Oncol. (2013) 14:981–8. doi: 10.1016/S1470-2045(13)70310-3
8. Mayor S. Osimertinib effective in EGFR T790M-positive lung cancer. Lancet Oncol. (2017) 18:e9. doi: 10.1016/S1470-2045(16)30654-4
9. Miller VA, Hirsh V, Cadranel J, Chen YM, Park K, Kim SW, et al. Afatinib versus placebo for patients with advanced, metastatic non-small-cell lung cancer after failure of erlotinib, gefitinib, or both, and one or two lines of chemotherapy (LUX-Lung 1): a phase 2b/3 randomised trial. Lancet Oncol. (2012) 13:528–38. doi: 10.1016/S1470-2045(12)70087-6
10. Mitsudomi T. Erlotinib, gefitinib, or chemotherapy for EGFR mutation-positive lung cancer? Lancet Oncol. (2011) 12:710–1. doi: 10.1016/S1470-2045(11)70194-2
11. Wood DE, Kazerooni EA, Baum SL, Eapen GA, Ettinger DS, Hou L, et al. Lung cancer screening, Version 3.2018, NCCN clinical practice guidelines in oncology. J Natl Compr Canc Netw. (2018) 16:412–41. doi: 10.6004/jnccn.2018.0020
12. Cai W, Lin D, Wu C, Li X, Zhao C, Zheng L, et al. Intratumoral heterogeneity of ALK-rearranged and ALK/EGFR coaltered lung adenocarcinoma. J Clin Oncol. (2015) 33:3701–3709. doi: 10.1200/JCO.2014.58.8293
13. Gerlinger M, Rowan AJ, Horswell S, Math M, Larkin J, Endesfelder D, et al. Intratumor heterogeneity and branched evolution revealed by multiregion sequencing. N Engl J Med. (2012) 366:883–92. doi: 10.1056/NEJMoa1113205
14. Taniguchi K, Okami J, Kodama K, Higashiyama M, Kato K. Intratumor heterogeneity of epidermal growth factor receptor mutations in lung cancer and its correlation to the response to gefitinib. Cancer Sci. (2008) 99:929–35. doi: 10.1111/j.1349-7006.2008.00782.x
15. Yatabe Y, Matsuo K, Mitsudomi T. Heterogeneous distribution of EGFR mutations is extremely rare in lung adenocarcinoma. J Clin Oncol. (2011) 29:2972–7. doi: 10.1200/JCO.2010.33.3906
16. Zhou Q, Zhang XC, Chen ZH, Yin XL, Yang JJ, Xu CR, et al. Relative abundance of EGFR mutations predicts benefit from gefitinib treatment for advanced non–small-cell lung cancer. J Clin Oncol. (2011) 29:3316–21. doi: 10.1200/JCO.2010.33.3757
17. Zhang J, Fujimoto J, Zhang J, Wedge DC, Song X, Zhang J, et al. Intratumor heterogeneity in localized lung adenocarcinomas delineated by multiregion sequencing. Science. (2014) 346:256–9. doi: 10.1126/science.1256930
18. Liu X, Lu Y, Zhu G, Lei Y, Zheng L, Qin H, et al. The diagnostic accuracy of pleural effusion and plasma samples versus tumour tissue for detection of EGFR mutation in patients with advanced non-small cell lung cancer: comparison of methodologies. J Clin Pathol. (2013) 66:1065–9. doi: 10.1136/jclinpath-2013-201728
19. Liu Y, Liu B, Li XY, Li JJ, Qin HF, Tang CH, et al. A comparison of ARMS and direct sequencing for EGFR mutation analysis and tyrosine kinase inhibitors treatment prediction in body fluid samples of non-small-cell lung cancer patients. J Exp Clin Cancer Res. (2011) 30:111. doi: 10.1186/1756-9966-30-111
20. Li T, He J, Mao X, Bi Y, Luo Z, Guo C, et al. In situ biomarker discovery and label-free molecular histopathological diagnosis of lung cancer by ambient mass spectrometry imaging. Sci Rep. (2015) 5:14089. doi: 10.1038/srep14089
21. Mao X, He J, Li T, Lu Z, Sun J, Meng Y, et al. Application of imaging mass spectrometry for the molecular diagnosis of human breast tumors. Sci Rep. (2016) 6:21043. doi: 10.1038/srep21043
22. Santagata S, Eberlin LS, Norton I, Calligaris D, Feldman DR, Ide JL, et al. Intraoperative mass spectrometry mapping of an onco-metabolite to guide brain tumor surgery. Proc Natl Acad Sci USA. (2014) 111:11121–6. doi: 10.1073/pnas.1404724111
23. Schwartz SA, Weil RJ, Thompson RC, Shyr Y, Moore JH, Toms SA, et al. Proteomic-based prognosis of brain tumor patients using direct-tissue matrix-assisted laser desorption ionization mass spectrometry. Cancer Res. (2005) 65:7674–81. doi: 10.1158/0008-5472.CAN-04-3016
24. Eberlin LS, Norton I, Dill AL, Golby AJ, Ligon KL, Santagata S, et al. Classifying human brain tumors by lipid imaging with mass spectrometry. Cancer Res. (2012) 72:645–54. doi: 10.1158/0008-5472.CAN-11-2465
25. McDonnell LA, Heeren RM. Imaging mass spectrometry. Mass Spectrom Rev. (2007) 26:606–43. doi: 10.1002/mas.20124
26. Chen Y, Xu J, Zhang R, Shen G, Song Y, Sun J, et al. Assessment of data pre-processing methods for LC-MS/MS-based metabolomics of uterine cervix cancer. Analyst. (2013) 138:2669–77. doi: 10.1039/c3an36818a
27. Shen G, Chen Y, Sun J, Zhang R, Zhang Y, He J, et al. Time-course changes in potential biomarkers detected using a metabonomic approach in walker 256 tumor-bearing rats. J Proteome Res. (2011) 10:1953–61. doi: 10.1021/pr101198q
28. Xu J, Chen Y, Zhang R, Song Y, Cao J, Bi N, et al. Global and targeted metabolomics of esophageal squamous cell carcinoma discovers potential diagnostic and therapeutic biomarkers. Mol Cell Proteom. (2013) 12:1306–18. doi: 10.1074/mcp.M112.022830
29. Bylesjö M, Rantalainen M, Cloarec O, Nicholson JK, Holmes E, Trygg J. OPLS discriminant analysis: combining the strengths of PLS-DA and SIMCA classification. J Chemomet. (2006) 20:341–51. doi: 10.1002/cem.1006
30. Jordan KW, Adkins CB, Su L, Halpern EF, Mark EJ, Christiani DC, et al. Comparison of squamous cell carcinoma and adenocarcinoma of the lung by metabolomic analysis of tissue–serum pairs. Lung Cancer. (2010) 68:44–50. doi: 10.1016/j.lungcan.2009.05.012
31. Pavlova NN, Thompson CB. The emerging hallmarks of cancer metabolism. Cell Metab. (2016) 23:27–47. doi: 10.1016/j.cmet.2015.12.006
32. Cheng M, Rizwan A, Jiang L, Bhujwalla ZM, Glunde K. Molecular effects of doxorubicin on choline metabolism in breast cancer. Neoplasia. (2017) 19:617–27. doi: 10.1016/j.neo.2017.05.004
33. Ho YS, Yip LY, Basri N, Chong VS, Teo CC, Tan E, et al. Lipidomic profiling of lung pleural effusion identifies unique metabotype for EGFR mutants in non-Small cell lung cancer. Sci Rep. (2016) 6:35110. doi: 10.1038/srep35110
34. Jung JH, Lee MY, Choi DY, Lee JW, You S, Lee KY, et al. Phospholipids of tumor extracellular vesicles stratify gefitinib-resistant nonsmall cell lung cancer cells from gefitinib-sensitive cells. Proteomics. (2015) 15:824–35. doi: 10.1002/pmic.201400243
35. Memon AA, Jakobsen S, Dagnaes-Hansen F, Sorensen BS, Keiding K, Nexo E. Positron emission tomography (PET) imaging with [11C]-labeled erlotinib: a micro-PET study on mice with lung tumor xenografts. Cancer Res. (2009) 69:873–78. doi: 10.1158/0008-5472.CAN-08-3118
36. Bahce I, Smit EF, Lubberink M, van der Veldt AA, Yaqub M, Windhorst AD, et al. Development of [11C] erlotinib positron emission tomography for in vivo evaluation of EGF receptor mutational status. Clin Cancer Res. (2012). 19:183–93. doi: 10.1158/1078-0432.CCR-12-0289
Keywords: tumor heterogeneity, mass spectrometry imaging, lipids, non-small cell lung cancer (NSCLC), epidermal growth factor receptor (EGFR)
Citation: Zhang M, He J, Li T, Hu H, Li X, Xing H, Wang J, Yang F, Ma Q, Liu B, Tang C, Abliz Z and Liu X (2019) Accurate Classification of Non-small Cell Lung Cancer (NSCLC) Pathology and Mapping of EGFR Mutation Spatial Distribution by Ambient Mass Spectrometry Imaging. Front. Oncol. 9:804. doi: 10.3389/fonc.2019.00804
Received: 12 May 2019; Accepted: 07 August 2019;
Published: 28 August 2019.
Edited by:
Zaver Bhujwalla, School of Medicine, Johns Hopkins University, United StatesReviewed by:
Wagner Fontes, University of Brasilia, BrazilZhongxiang Ding, Hangzhou First People's Hospital, China
Copyright © 2019 Zhang, He, Li, Hu, Li, Xing, Wang, Yang, Ma, Liu, Tang, Abliz and Liu. This is an open-access article distributed under the terms of the Creative Commons Attribution License (CC BY). The use, distribution or reproduction in other forums is permitted, provided the original author(s) and the copyright owner(s) are credited and that the original publication in this journal is cited, in accordance with accepted academic practice. No use, distribution or reproduction is permitted which does not comply with these terms.
*Correspondence: Zeper Abliz, emVwZXJAaW1tLmFjLmNu; Xiaoqing Liu, bGl1eGlhb3FpbmdAY3Njby5vcmcuY24=
†These authors have contributed equally to this work