 Ru Chen1,2
 Aiko Sugiyama1*†
 Naoyuki Kataoka3,4
 Masahiro Sugimoto5
 Shoko Yokoyama2Akihisa Fukuda1
 Shigeo Takaishi2*†Hiroshi Seno1
- 1Department of Gastroenterology and Hepatology, Graduate School of Medicine, Kyoto University, Kyoto, Japan
- 2DSK Project, Medical Innovation Center, Graduate School of Medicine, Kyoto University, Kyoto, Japan
- 3Laboratory of Cell Regulation, Department of Applied Animal Sciences, Graduate School of Agricultural and Life Sciences, The University of Tokyo, Tokyo, Japan
- 4Department of Applied Biological Chemistry, Graduate School of Agricultural and Life Sciences, The University of Tokyo, Tokyo, Japan
- 5Research and Development Center for Minimally Invasive Therapies Health Promotion and Preemptive Medicine, Tokyo Medical University, Tokyo, Japan
Both pancreatic intraepithelial neoplasia (PanIN), a frequent precursor of pancreatic cancer, and intraductal papillary mucinous neoplasm (IPMN), a less common precursor, undergo several phases of molecular conversions and finally develop into highly malignant solid tumors with negative effects on the quality of life. We approached this long-standing issue by examining the following PanIN/IPMN cell lines derived from mouse models of pancreatic cancer: Ptf1a-Cre; KrasG12D; p53f/+ and Ptf1a-Cre; KrasG12D; and Brg1f/f pancreatic ductal adenocarcinomas (PDAs). The mRNA from these cells was subjected to a cap analysis of gene expression (CAGE) to map the transcription starting sites and quantify the expression of promoters across the genome. Two RNA samples extracted from three individual subcutaneous tumors generated by the transplantation of PanIN or IPMN cancer cell lines were used to generate libraries and Illumina Seq, with four RNA samples in total, to depict discrete transcriptional network between IPMN and PanIN. Moreover, in IPMN cells, the transcriptome tended to be enriched for suppressive and inhibitory biological processes. In contrast, the transcriptome of PanIN cells exhibited properties of stemness. Notably, the proliferation capacity of the latter cells in culture was only minimally constrained by well-known chemotherapy drugs such as GSK690693 and gemcitabine. The various transcriptional factor network systems detected in PanIN and IPMN cells reflect the distinct molecular profiles of these cell types. Further, we hope that these findings will enhance our mechanistic understanding of the characteristic molecular alterations underlying pancreatic cancer precursors. These data may provide a promising direction for therapeutic research.
Introduction
Pancreatic cancer remains among the most lethal malignancies worldwide, and the incidence of this disease has been increasing slowly in recent years (1–3). The assessments of molecular markers and tumor progression signatures are essential contributors to treatment decisions (4, 5), as a timely diagnosis could prevent 12–13% of patients in a precursor stage or with clinically unapparent disease from progressing toward end-stage disease (6).
To date, three precursors of pancreatic cancer have been identified: pancreatic intraepithelial neoplasia (PanIN; the most common precursor), intraductal papillary mucinous neoplasm (IPMN), and mucinous cystic neoplasm (MCN) (7, 8). PanIN is usually confirmed histologically as it develops into infiltrative adenocarcinoma via various steps from low grade to high grade, with gradual morphological changes (9). Early molecular alterations [such as K-ras mutation, epidermal growth factor receptor (EGFR) overexpression, and HER2/neu overexpression] and later events (p16, p53, DPC4, and BRCA inactivation) have been reported to contribute to malignant transformation (10). Animal models of pancreatic cancer have been developed to reproduce and study these benchmark genetic alterations and further our understanding of the underlying mechanisms (11).
One previously described mouse model of pancreatic cancer was developed by the concomitant expression of oncogenic mutant K-ras with a loss of Brg1 or p53 (12). The former model developed cystic neoplastic lesions consistent with human IPMN, whereas the latter developed PanIN similar to the corresponding human condition. Therefore, these murine PanIN and IPMN lesions can be used to generate transcriptome signatures representative of overall pancreatic cancer characteristics.
Advances in next-generation sequencing technologies such as cap analysis of gene expression (CAGE) have led to a comprehensive understanding of the regulatory processes applied to transcribed regions of the genome and the construction of an integrated overview of the transcriptome (13). Particularly, CAGE was originally used to construct a precise map of transcription start sites (TSSs) and elucidate the “promoteromes” of mammalian cells and tissues. In one analysis involving the tagging of m7G caps on mRNAs, nearly 25% of mammalian m7G caps were not located at already known TSS (14, 15). Whole-transcriptome network analyses via technologies such as CAGE might enable a much more comprehensive understanding of the divergence of promoteromes in the precursors of malignancies such as pancreatic cancer (16).
Although several mutations have been explicitly identified in pancreatic cancer (17), the role of epigenetic modifications in this malignancy remains largely unknown, and the optimal transcriptional network remains to be discovered. Techniques such as CAGE can be used to evaluate variations in regulatory networks over time and in response to various factors, such as enhancers, mechanical stressors, and stable or long-term regulatory transcriptional factors. Here, in this study, we took a glimpse of the transcriptome network depicted in PanIN and IPMN and hopefully found evidences that might support the future therapy development aiming at the early period of pancreatic cancer.
Materials and Methods
Cell Lines
The mouse pancreatic cancer cell lines PanIN and IPMN were cultured in Roswell Park Memorial Institute (RPMI)-1640 medium (Nacalai, Japan) supplemented with 10% heat-inactivated fetal bovine serum (HyClone, USA) and 100 IU penicillin–streptomycin/ml (Nacalai, Japan). The Akt inhibitor GSK690693 (Sigma, USA) and gemcitabine (Tokyo Chemical Industry Co., Japan) were added to the cultures on the second day after seeding. Briefly, the cells were cultured with a fixed concentration of GSK690693 or AZD4547 for the next 4 days.
RNA Extraction and Isolation
Total RNA was extracted and isolated using the Nucleospin RNA plus kit (Takara, Japan). The concentration and A260/A280 ratio of each prepared RNA sample were measured using a NanoDrop device (Thermo Fisher Scientific, USA). RNAs with A260/A280 and 260/230 ratios > 1.7 were subjected to a subsequent analysis. RNA quality was assessed using a Bioanalyzer (Agilent) to ensure an RNA integrity number (RIN) > 7.0.
Cap Analysis of Gene Expression and Computational Analysis
CAGE library preparation, sequencing, and mapping were performed by DNAFORM (Yokohama, Kanagawa, Japan). CAGE libraries were prepared from the purified RNA samples, as follows: briefly, first-strand cDNAs were transcribed to the 5' ends of capped RNAs and attached to CAGE bar code tags. These tags were sequenced on an Illumina HiSeq 2000 sequencer (Illumina, San Diego, CA, USA) and mapped to the mouse mm9 genome using BWA software (v0.5.9) after discarding ribosomal or non-A/C/G/T base-containing RNAs. For tag clustering, CAGE tag 5' coordinates were input for Reclu clustering (18), with a maximum irreproducible discovery rate of 0.1 and minimum count per million (CPM) of 0.1. The samples were normalized using the relative log expression method, and differential analyses were conducted using edgeR. In the motif analysis, genomic DNA sequences in the regions that are 500 bp upstream to 500 bp downstream of the CAGE peaks were analyzed using the MEME and DREME (Analysis of Motif Enrichment) tool (motif search cutoff: E score > 0.05) (19) and the JASPAR CORE 2014 vertebrates 68 motif database. TOMTOM was used for comparisons.
Quantitative Real-Time PCR
Complementary DNA was synthesized using the Superscript II 1st Strand cDNA synthesis kit (Takara, Japan). Quantitative PCR was performed with the SYBR-green-based gene master (Roche, Germany). The expression levels were normalized against mouse Gapdh (Hokkaido System Science Co., Japan). The primer sequences can be referred in Table S1.
Western Blotting
Cell lysates (20 μg/lane) were electrophoresed on 6 and 15% commercially purchased gels (SuperSep Ace, Fujifilm, Japan) and then transferred to polyvinylidene difluoride (PVDF) membrane (Immobilon-P, Merck, Ireland). Immunoblotting was performed by primary antibody: anti-RREB1 antibody ab64168 (Abcam, USA), pan Akt C67E7 Rabbit mAb and phosphor-Akt (Thr308) D25E6 Rabbit mAb (CST, USA), and horseradish peroxidase (HRP)-conjugated secondary antibody ab2307391 (Jackson ImmunoResearch, USA). Beta-actin immunoblotting was performed by anti-beta actin antibody ab49900 (Abcam, USA).
Immunocytochemistry and Immunofluorescence Assay
Cells were seeded on culture slides (Falcon, USA) and fixed with 4% formaldehyde in 1× PBS for 10 min at room temperature. They were then blocked with 1× PBS containing 0.25% Triton X-100 and 5% bovine serum for 60 min at room temperature and incubated with primary antibodies overnight at 4°C: anti-Nanog antibody ab80892 and anti-Sox2 antibody ab92494 (Abcam, USA). On the second day, the cells were washed with 1× PBS and incubated with secondary antibodies for 60 min at room temperature: Alexa Fluor® 488 ab150081 (Abcam, USA). Nuclear staining was observed using DAPI staining (VECTASHIELD, Japan), and images were acquired by Keyence fluorescence microscope.
Gene Ontology and Kyoto Encyclopedia of Genes and Genomes Pathway Enrichment Analyses
To identify the key pathways associated with differentially expressed promoters, the CAGE data were subjected to a Gene Ontology (GO) enrichment analysis and Kyoto Encyclopedia of Genes and Genomes (KEGG) pathway analysis using the clusterProfiler R package (20). The Goplot package was then used to explore the biological significance of these differences (21). The significant GO terms and pathways were identified using the Benjamini test to generate corrected P-values.
Gene Set Enrichment Analysis
A gene set enrichment analysis (GSEA) was conducted using primarily computational methods to determine the significant differences in expression between PanIN and IPMN from the CAGE datasets. Usually, a false discovery rate (FDR) <0.25 is applied to generate the most likely hypotheses. However, we applied a slightly looser cutoff of 0.5 in this study to accommodate the small number of samples.
Detection of Aldehyde Dehydrogenase Activity and Flow Cytometry
The ALDEFLUOR kit (StemCell Technologies, USA) was used to identify cells exhibiting aldehyde dehydrogenase (ALDH) activity. Cells were incubated (45 min, 37°C, final densities: 2 × 10⁵ and 5 × 10⁵ cells/ml) with the specific ALDH inhibitor diethylaminobenzaldehyde (DEAB). A fluorescent substrate was added as the background modification. All procedures were conducted according to the provided protocol.
Sphere Formation Assays
Suspensions of PanIN and IPMN cells were adjusted to a density of 104 cells/ml in medium comprising DMEM/F12 (Nacalai, Japan) supplemented with B27 (Gibco, USA), 100 μg of epidermal growth factor (Thermo, USA), and 50 μg of basic fibroblast growth factor (Thermo, USA). Next, cells were seeded in semi-suspension and cultured on Ultra Low Attachment 6-well plates (Corning Incorporated Life Sciences, USA). After a 5 day incubation, the numbers of cell spheres were counted and recorded using cell3imager (SCREEN Holdings, Japan).
Xenograft Growth in Non-obese Diabetic/Severe Combined Immunodeficiency Mice
All procedures involving animals were conducted in accordance with the Institutional Animal Welfare Guidelines of Kyoto University. Cells (106 per cell line, viability > 95%) were suspended in 80 μl of phosphate-buffered saline (PBS) together with 20 μl of Matrigel and injected subcutaneously (s.c.) into the dorsal regions of 8 week-old non-obese diabetic/severe combined immunodeficiency (NOD/SCID) mice (Charles Rivers Laboratories, Yokohama, Japan; four mice per group). The mice received three subsequent intra-abdominal injections of GSK690693 (Selleck Chemical, Japan) at doses of 40 mg/kg/day. The tumors were harvested after 4 weeks.
Cell Counting Kit-8 Assay
Cells were seeded in 96-well plates after several days of incubation with the chemotherapy drugs. After the culture media were discarded, the cells were washed with PBS. Ten microliters of Cell Counting Kit-8 (CCK-8; Dojindo, Japan) and 90 μl of culture medium were added to each well. Subsequently, the cells were incubated for 2 h in an atmosphere of 95% air plus 5% CO2 at 37°C. A microplate reader (TECAN Infinite F50, USA) was used to detect the optical density value at 450 nm in each well as a measure of cell proliferation.
Statistical Analysis
R statistical software, version 3.5.3 (http://www.R-project.org), was used to perform the general statistical analysis and generate the graphs. All P-values described in this study represent two-sided tests. A P < 0.05 was considered statistically significant.
Results
Histological and Genome-Wide Assessment of Subcutaneous Pancreatic Intraepithelial Neoplasia-Pancreatic Ductal Adenocarcinoma and Intraductal Papillary Mucinous Neoplasm-Pancreatic Ductal Adenocarcinoma Mouse Cell Tumors
For these experiments, we used pancreatic cell lines generated from a Kras+p53+Brg1−/−; Kras+p53+ mouse pancreatic cancer model that was developed by Fukuda et al. After subcutaneous tumors in the NOD/SCID mice had been created via injection of these cell lines, hematoxylin and eosin-stained tissue sections were evaluated histologically to confirm that the tumors mimicked pancreatic cancer. As shown in Figures 1A,B, the tumor component contained a clear ductal spectrum consistent with classic pancreatic cancer, with little variation between the two sections, thus verifying little difference in the manifestation of PDA at the advanced stage.
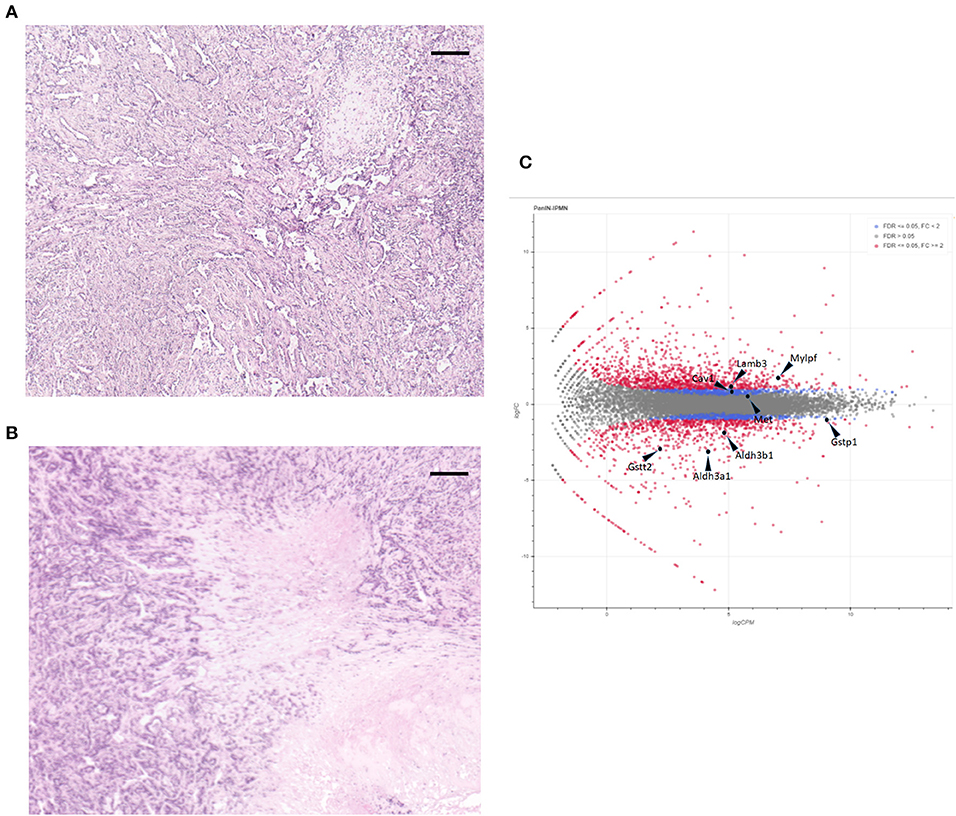
Figure 1. Hematoxylin and eosin staining of subcutaneous tumors formed by cell lines intraductal papillary mucinous neoplasm (IPMN) (A) and pancreatic intraepithelial neoplasia (PanIN) (B). Scale bar: 200 μm. (C) MA plot of the monitored expressions of individual genes. Non-differentially expressed (gray dots), differentially expressed (red dots), and the eight selected genes are shown.
We next applied CAGE to the RNAs extracted from the subcutaneous tumors formed by injecting mouse PanIN and IPMN cell lines into NOD/SCID mice. As shown in Figure S1, a clustering analysis based on the entire genome-wide promoter set revealed clearly distinct trends in the mouse pancreatic cancer cells depending on the PanIN or IPMN status. A MA plot also demonstrated that a differential analysis with an FDR of <5% revealed a balanced distribution of the promoters (Figure 1C).
Use of Chromatin Immunoprecipitation-Based Weighted Parametric Gene Set Analysis to Create Comprehensive Networks of Transcription Factor Activity
To get an overall image of the configurations of transcription factor (TF) networks in the two cell lines, we used weighted parametric gene set analysis (wPGSA) to establish a visual network of the factors detected among the differentially expressed promoters (Figure 2) (22), which is a method to estimate relative activities of transcriptional regulators from given transcriptome data. This analysis displayed the dynamic and complex nature of gene regulation in mouse PanIN/IPMN cells, together with the TSS cluster expression profiles. LogFC values were used to represent the relative activities of TFs in the whole PanIN/IPMN transcriptome. Distinct configuration signatures were evident because TFs in the IPMN appeared to be spreading in the outer layer and had less connections than had TFs in the center, of which most were present in PanIN, whereas the number of TFs enriched in the PanIN weighted higher several star molecules, including Nanog, Sox2, and Runx1. These molecules play especially important roles in the epithelial–mesenchymal transition and dedifferentiation processes, indicating a tendency toward aggression at the TF level (23). In IPMN, the transcriptome included classic malignancy-promoting genes such as Stat4, Trp53, and Pax6, suggesting a more rigorous and limited perception of the connections between TFs.
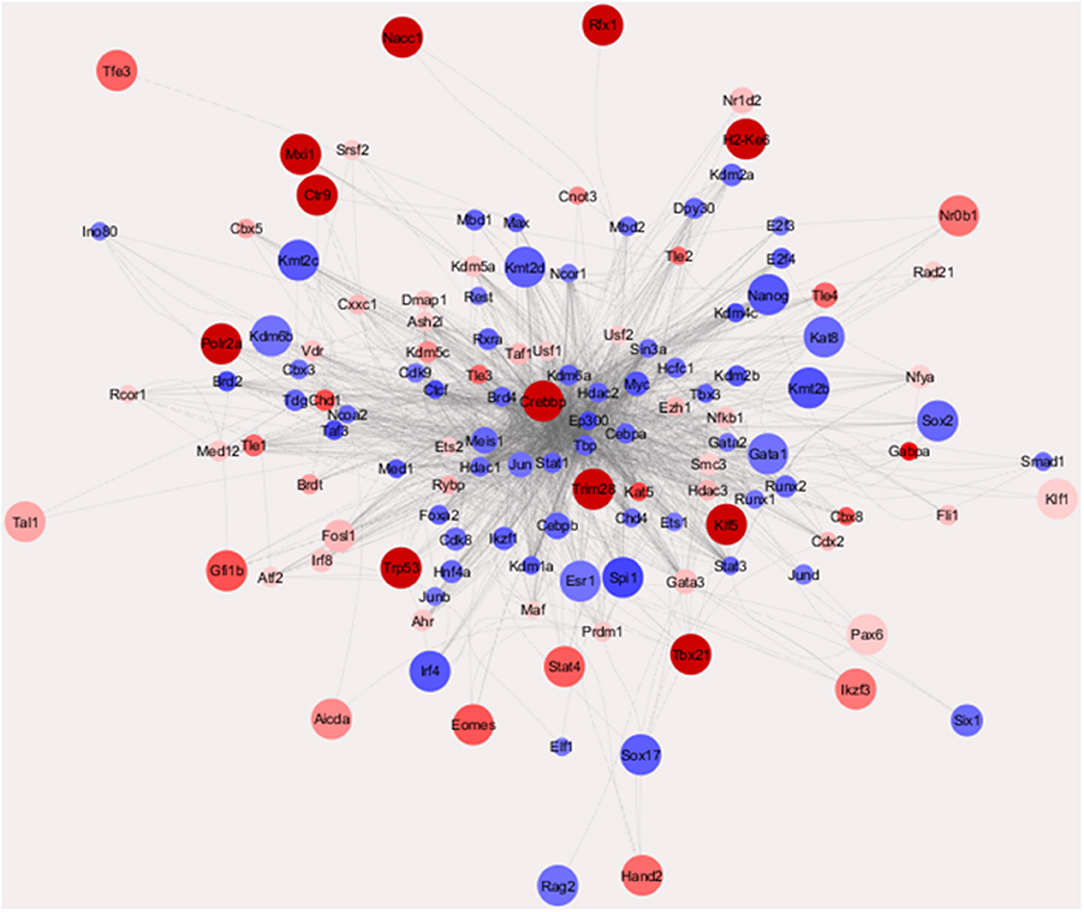
Figure 2. Transcriptional regulatory network of TFs characterizing IPMN and PanIN (Enrichment Score >10 or < −10). Those nodes with more out-degrees [the number of other transcription factor (TFs) that they regulate] were placed in a center position. The node size indicated the LogFC value of the TF gene found in cap analysis of gene expression (CAGE) data and the node colors indicate the enrichment scores of the TFs estimated with weighted parametric gene set analysis (wPGSA).
Confirmed with qRT-PCR, which is shown in Figure S2A, most of the star molecules mentioned above had varied mRNA expression in PanIN/IPMN cell lines. Immunocytochemistry (ICC)/immunofluorescence (IF) technique was applied in detecting Nanog and Sox2 expression in PanIN/IPMN (Figures S2B, S2C).
Identification of the Enriched Processes Among Promoters in Intraductal Papillary Mucinous Neoplasm/Pancreatic Intraepithelial Neoplasia Cells
The promoters identified via CAGE were refined further using several criteria: an exact FDR cut-off <0.01 to indicate statistical significance in the differential analysis, a median expression level of >4 CPM to obtain observable results with qRT-PCR and a |LogFC| > 2 to indicate a solid difference in expression between the two groups. A total of 1,261 upregulated and downregulated promoters were screened and tested for enrichment using DAVID to identify those with annotation robust peaks within a cluster associated with a pathway or biological process. A subsequent KEGG/GO term enrichment analysis revealed that the commonly upregulated promoters were enriched primarily in important pathways such as PI3K-Akt signaling and focal adhesion (Figure 3A). The downregulated promoters were enriched in P450 metabolic systems such as drug metabolism and xenobiotic metabolism (Figure 3B). In IPMN cells, the upregulated promoters were enriched for the GO categories related to inhibitory enzymatic activity, negative regulation of cell communication, and immune processes (Figure 3C), indicating a more suppressive signature when compared with that of PanIN cells.
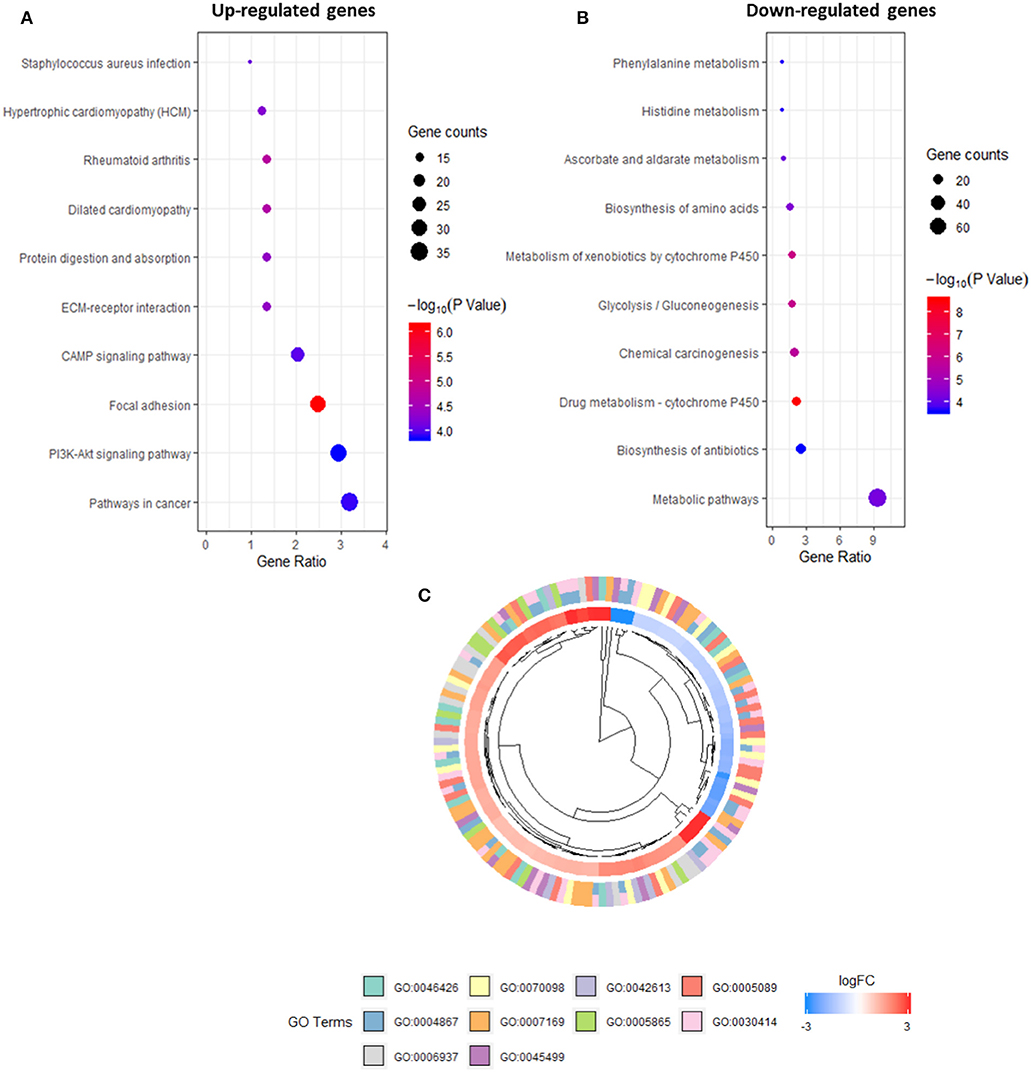
Figure 3. Kyoto Encyclopedia of Genes and Genomes (KEGG) pathway analysis of promoters in up-regulated (A) and down-regulated expression (B). Gene Ontology (GO) terms within differentially expressed promoters [false discovery rate (FDR) > 0.05] in intraductal papillary mucinous neoplasm (IPMN) (C).
Distinct Transcription Networks in Mouse Pancreatic Cancer Cell Lines Generated From Pancreatic Intraepithelial Neoplasia-Pancreatic Ductal Adenocarcinoma/Intraductal Papillary Mucinous Neoplasm-Pancreatic Ductal Adenocarcinoma
We also examined the enrichment of TF-binding motifs in the vicinity of the promoters. On the basis of the above pathway analysis results, we focused on promoters associated with the PI3K-Akt signaling pathway, focal adhesion, and P450 metabolism. A further survival analysis based on RNAseq data provided by The Cancer Genome Atlas (TCGA) confirmed that some of these annotated genes exhibited significant correlations with the survival duration in days (P < 0.05; Figure S3A). All survival-related genes were then subjected to qRT-PCR (Figure S3B).
Next, we applied MEME (24) to the survival-related genes, using several motif search tools. First, we generated heat maps on the basis of the total promoter expression levels to reveal differences in the configurations of various predicted and discovered categories of motifs. The distinct mapping of several sets of motifs is shown in Figures 4A,B. The motifs discovered for promoters associated with regulatory survival-associated genes via MEME are shown in Figures 4C,D. These were subjected to a motif comparison using TOMTOM (25), which suggested that the comprehensive transcriptional factor Rreb1 had a significantly upregulated promoter. The binding motif of Rreb1 was also enriched among the upregulated promoters. As shown in Figures 4E,F, qRT-PCR and western blotting verified that the expression of Rreb1 was higher than in the IPMN compared with PanIN. These results indicate that in the mouse, IPMN and PanIN are likely controlled by distinct transcriptional regulatory networks. Similar candidates of transcriptional factors were discovered via Motif Activity Response Analysis (26) (MARA; Table S1), which is another classical approach in motif analysis adopted in processing CAGE data.
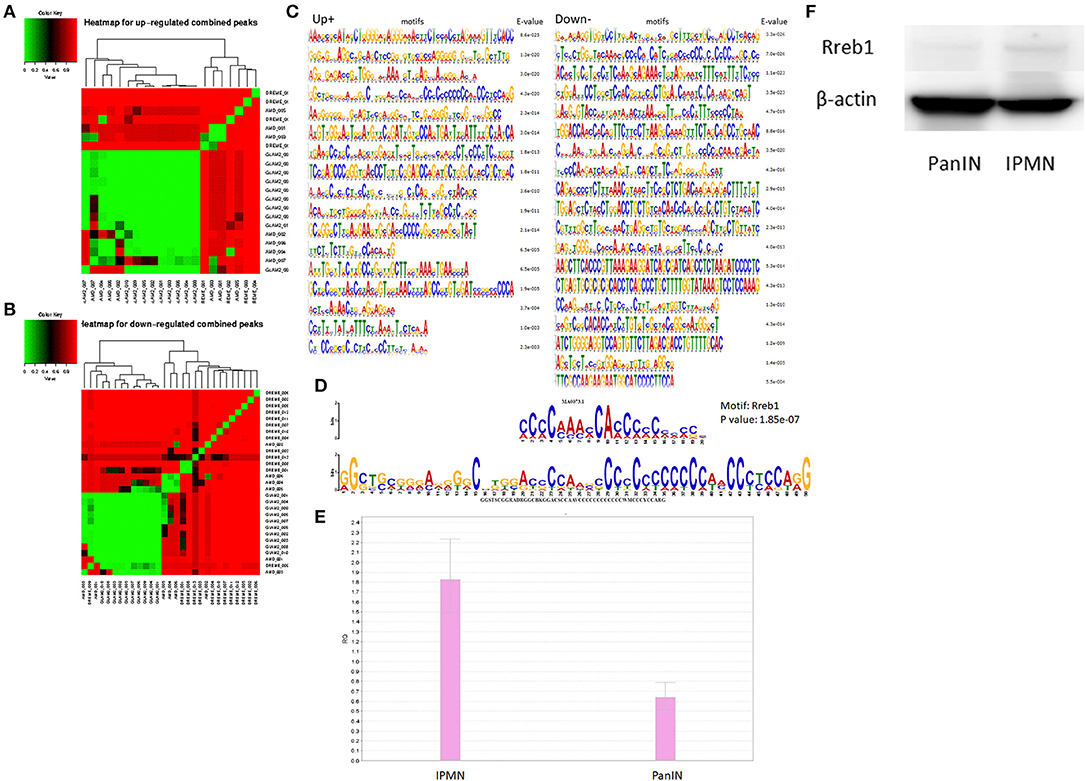
Figure 4. Clusters screened by the differentially expressed criteria and divided into up-regulated or down-regulated peaks were used for motif discovery analysis, heat maps represented results shown as up-regulated and down-regulated in (A,B). (C) Motifs significantly detected at the promoter region of target genes (enrichment score < 0.05). (D) Comparison analysis with standard motifs representations in the JASPAR core database using TOMTOM. The sequence logos at the top showed the transcription factor MA0073.1 (Rreb1), and the ones below the binding match motif. (E) qRT-PCR result suggested Rreb1 expression in pancreatic intraepithelial neoplasia/intraductal papillary mucinous neoplasm (PanIN/IPMN) correlated with findings from motif search. (F) Rreb1 protein (245 kDa) expression level of IPMN/PanIN cell lines; beta-actin was used as the internal control.
Gene Set Enrichment Analysis of the Promoteromes in Intraductal Papillary Mucinous Neoplasm/Pancreatic Intraepithelial Neoplasia Cells
The characteristics of several GSEA datasets from different categories were analyzed using the PanIN/IPMN leading gene CPM. Among all tested datasets, genes that were upregulated and downregulated during the early or late stages of embryoid body differentiation from embryonic stem cells (ESCs) consistently yielded significant differences. As shown in Figure 5, only the expression matrix from PanIN had a detectably distinct pattern different from that of stepwise development in a mouse embryo. On the contrary, PanIN cells exhibited negative correlations with all genes that were downregulated during the early/late differentiation of embryoid bodies from ESCs, suggesting that these cells tend to lose the capacity for pluripotency. PanIN cells also exhibited negative correlations with genes that were upregulated during the early/late differentiation of embryoid bodies. Like other well-differentiated cells, PanIN manifested alliance toward the less oncogenic property of the upregulation of stem signature from early/late stage of ESC. All but the first GSEA result lacked FDR power and were considered marginal. We note, however, that the GSEA datasets corresponding to early/late shifts in ESC genes represent the loss of stemness properties in PanIN. Therefore, these results might suggest the presence of stemness before the transition from PanIN into a solid tumor.
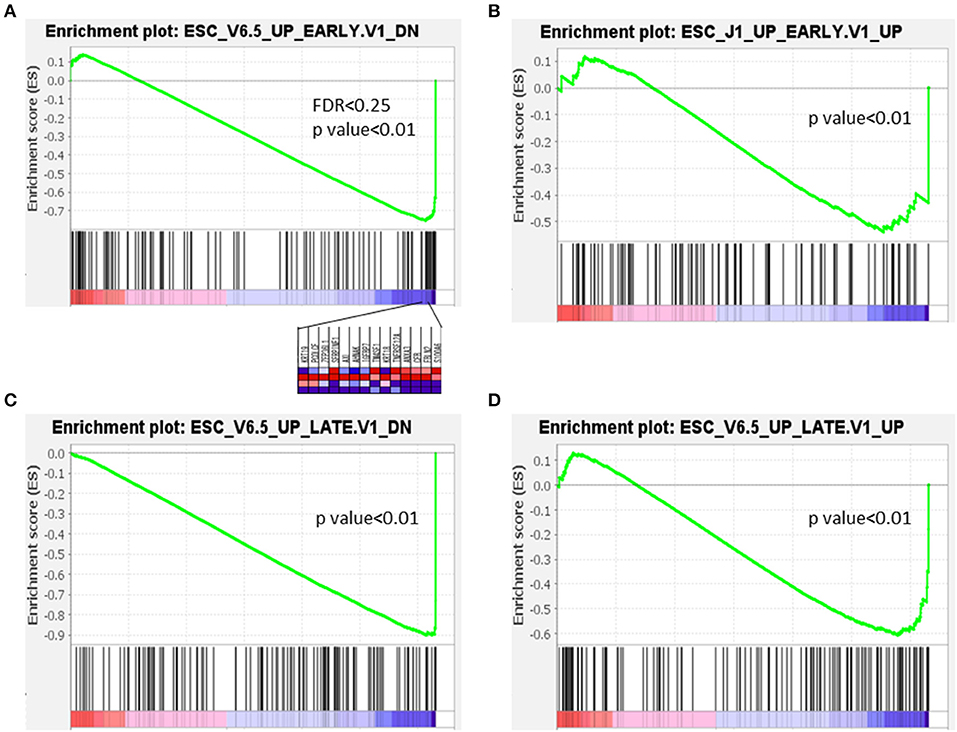
Figure 5. Expression in PanIN derived from mouse PDA was negatively correlated with differentiation of embryoid bodies from mouse embryonic stem cells.
Validation of Stemness in a Mouse Cell Line Derived From Pancreatic Intraepithelial Neoplasia-Pancreatic Ductal Adenocarcinoma
We investigated stemness properties in PanIN- and IPMN-derived mouse PDA cell lines in terms of higher Aldh enzyme activity, as previously reported (27). The Aldh family, which includes Aldh1a1 and Aldh1a3, comprises well-known stem cell markers (28). Therefore, the proportion of Aldh+-positive cells after treatment with the Aldh family inhibitor DEAB can be determined by flow cytometry as an indicator of stem cells in various cell types. In this respect, we used the ALDEFLUOR kit (see Materials and Methods) to detect cell populations with higher Aldh activity in both PanIN and IPMN cells via flow cytometry. DEAB was used to correct the background fluorescence. Figure 6 demonstrates a significantly higher percentage of Aldh+ cells in PanIN than in IPMN (~40% vs. 10%; Figure 6Aa–d) at a cell density of 5 × 10⁵ cells/ml and incubation time of 45 min. Similar results were obtained with a cell density of 2 × 10⁵ cells/ml (Figure 6Be–h).
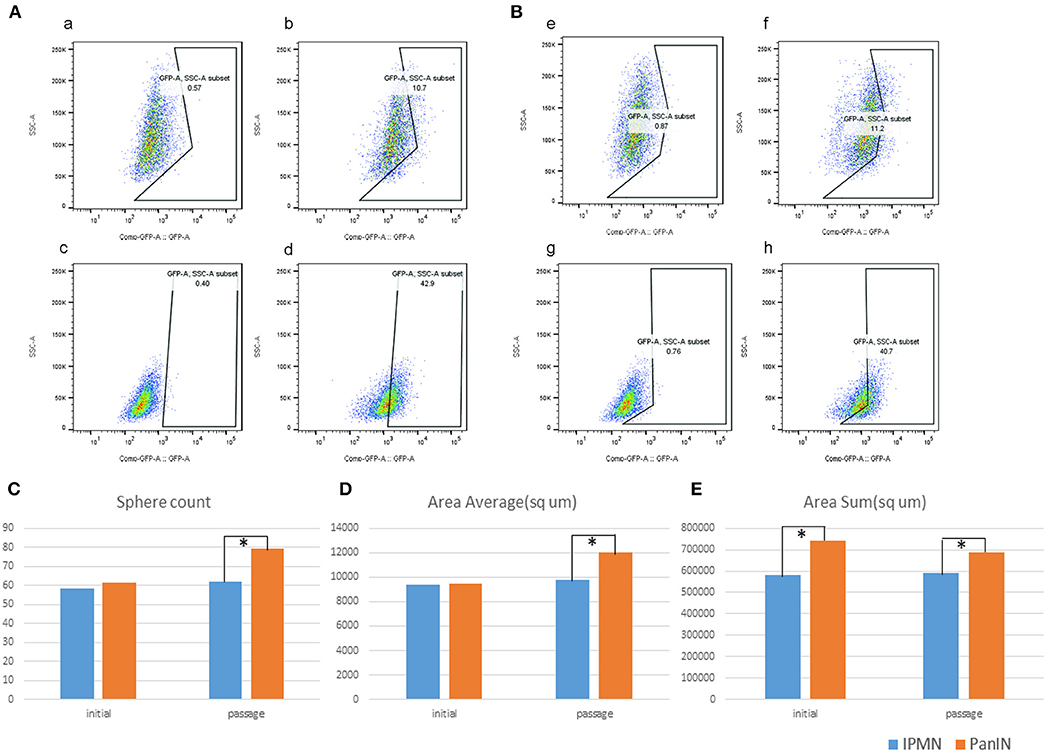
Figure 6. Green fluorescent protein (GAP)-conjugated ALDH+ and DAPI (detection of dead cells) were detected by flow cytometry; right, the fraction of ALDH+ cells (GFP+, DAPI negative) (b,d,f,h) vs. left, as the background correction. Upper were cells from intraductal papillary mucinous neoplasm (IPMN); lower were cells from pancreatic intraepithelial neoplasia (PanIN). In separate condition of 5 × 10⁵ cells/ml (A) and 2 × 10⁵ cells/ml. (B) Sphere digitalization by cell3imager. Sphere count (C), area average/μm2 (D), and area sum/μm2 (E).
We next performed a sphere formation assay to assess the stemness property (29). The spheres formed by IPMN cells tended to merge upon reaching a diameter of 100 μm, followed by a transformation into an irregular shape and loss of the round shape (Figures 6C–E, Figure S4). In a comparison of the cell lines, both the numbers of spheres with diameters > 80 μm and the average area of a single sphere were likely to exhibit insignificant differences. After passage, however, PanIN exhibited a greater capacity in terms of overall sphere formation and spherical size. The varied sphere densities and diameters despite culture under the same circumstances revealed the diverse stemness properties of PanIN and IPMN cells.
Evaluation of Chemoresistance in Intraductal Papillary Mucinous Neoplasm/Pancreatic Intraepithelial Neoplasia-Pancreatic Ductal Adenocarcinoma Cells
Chemoresistance is a typical characteristic of stemness-possessing cells (30). As mentioned previously, our CAGE data suggested activation of the PI3K-Akt signaling pathway in IPMN-PDA cells. To evaluate this possibility, GSK690693 (Akt inhibitor) was added to cultures of both cell lines, and the effect was investigated using a 5 day CCK-8 cell proliferation assay. Notably, GSK690693 decreased the proliferation rate of IPMN cells in an approximately dose-dependent manner, with a significant decrease in viability at a concentration of 0.3 μM relative to the inhibitor-free control (P < 0.05; Figure 7A). PanIN exhibited a relatively insignificant decrease proliferation in response to the same concentration of GSK690693.
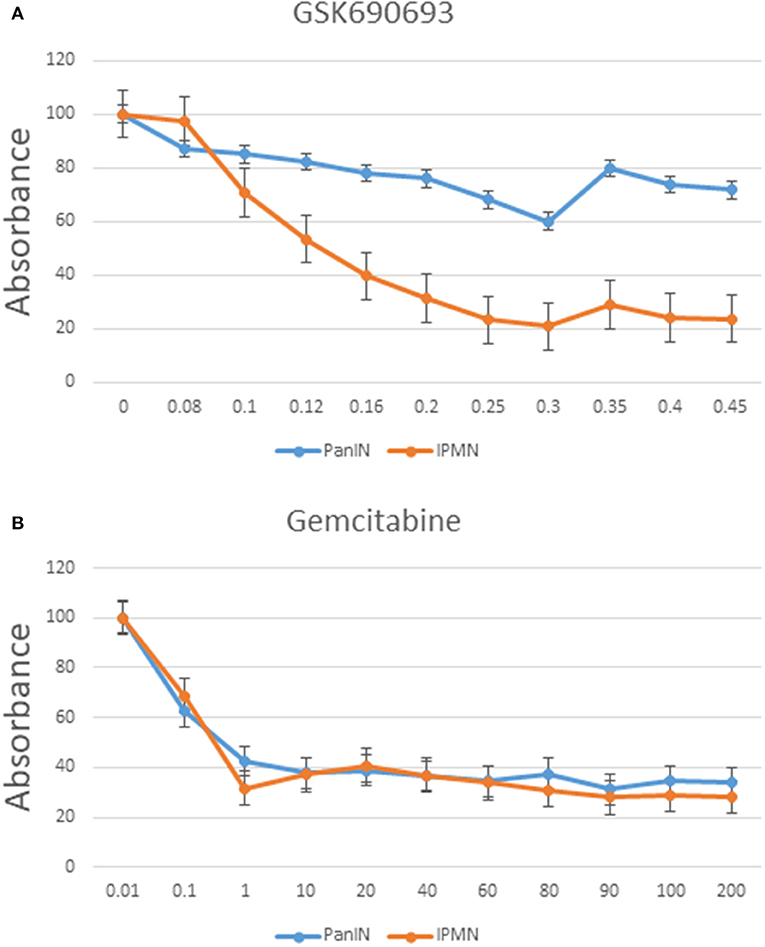
Figure 7. Cell proliferation assay of PanIN and IPMN cells after adding GSK690693 (Akt inhibitor) (A) and gemcitabine (B) normalized to relative control. Data are shown as mean ± SD performed in triplicate, representative of three independent experiments. Y axis: %; x axis: μM.
This observation prompted us to explore whether GSK690693 would have a similarly anti-proliferative effect on subcutaneous tumors in vivo in NOD/SCID mice. GSK690693 was injected intraperitoneally into two random mice from both the PanIN-PDA and IPMN-PDA groups (30 mg/kg/day at three intermittent times). Two untreated mice from each group were also observed. As shown in Figure S3, the sizes of the tumors varied between the two cell lines. However, in the same PanIN/IPMN group, the longitudinal size measured did not differ significantly between GSK690693-treated and untreated mice (Figure S5).
We also treated both cell lines with gemcitabine in accordance with the standard treatment regimen for pancreatic cancer. As shown in Figure 7B, IPMN and PanIN did not differ greatly in terms of sensitivity on gemcitabine; although PanIN had a more rapid proliferation speed in normal culture condition (Figure S6A), gemcitabine inhibitory effect seemed nearly equal when calculated proportionally, indicating a rigorous Akt inhibitory resistance in PanIN alone. Function of Akt inhibitor was verified through western blotting using phospho-Akt and pan AKT (Figure S6B): phosphor-Akt level in IPMN treated with GSK690693 was lower than non-Akti-treated control. Besides, application of another AKT inhibitor, AZD5363, was found generating similar proliferation alteration in PanIN/IPMN (Figure S6C).
Upon Akti treatment, alteration in stem cell contents occurred as well: as can be seen in Figure S7, when cell density reached 106 cells/ml under 45 min of incubation time, a greater drop of Aldh+ cells in Akti-treated IPMN than in PanIN can be observed (Figure S7A; P < 0.05). The same scenario happened in CD24/44 stem cell system in PanIN/IPMN (Figures S7B, S7C) (31), which was reported as pancreatic cancer stem cell (CSC) markers, CD24/CD44 population decreased significantly in IPMN than in PanIN when treated with Akti.
Discussion
The transition of a pancreatic cancer precursor into the most lethal malignancy has long been a topic of interest (32, 33). However, the detection of asymptomatic precursor lesions and early-stage disease has been challenging because of a lack of sufficiently sensitive methodology and a poor understanding of these entities (34). Therefore, a practical and accurate mouse model that could be used to assess ongoing molecular alterations in cancer might further relevant experimentation. In this study, we used mouse cancer cell lines generated from mouse models of PanIN (Ptf1a-Cre; KrasG12D; p53f/+) and IPMN (Ptf1a-Cre; KrasG12D; Brg1f/f).
Our genome-wide enrichment analysis of all differentially expressed promoters identified enrichment in several pathways, including the PI3K-Akt signaling pathway, which is well-known in the field of cancer and has been targeted using several combined therapeutic approaches (35). This finding suggests that inhibitors targeting the PI3K pathway are promising in terms of therapeutics (36). We also observed enrichment for focal adhesion, which is often mentioned in terms of physiological and disease cellular function remodeling. Notably, the activity of focal adhesion kinase is upregulated in malignancies (37). In our analysis of promoter profiles, cytochrome P450 metabolism was the only enriched pathway in PanIN that caught our attention. Enzymes associated with cytochrome P450 metabolism have been recognized in a wide variety of tumors, and these discoveries might lead to novel treatment options and lifesaving opportunities (38). On the one hand, our KEGG pathway analysis revealed mutual enrichment of pathways at the promoter level and the accumulation of common oncogenic processes. On the other hand, our analysis of classic GO terms revealed the enrichment of suppressive biological processes, cellular components, and molecular functions associated with enzyme inhibition and the negative regulation of cell communication in IPMN cells. This enrichment profile differed significantly from that of PanIN cells and might explain the more favorable outcome associated with IPMN. However, IPMN also tends to proliferate at a relatively slow rate and is less aggressive than other precancerous lesions.
We also evaluated differences in the transcriptional network between PanIN and IPMN cells using TFs screened via a chromatin immunoprecipitation (ChIP)-based wPGSA. This type of analysis predicts transcription regulators based on transcriptome and global ChIP data via computational approaches. Accordingly, we identified different compositions of key regulators in PanIN and IPMN cells. TFs associated with reprogramming, such as Myc, Sox2, and Nanog, exhibited high activity levels in PanIN cells and targeted considerably activated TFs in PanIN. Another classic TF discovery method involves searching for TF bonds with conventional motifs that are found to be cohering in the specified region of the promoters (39). In the promoter levels of Cav1, Met, Mylpf, and Lamb3, which were all survival significant factors in pancreatic cancer, TF Rreb1 was discovered to be in the minor view. Rreb1 plays a key role in Ras-mediated cell differentiation by upregulating the expression of calcitonin. However, it is not necessarily involved in the proliferation of malignant cells (40). A previous study reported that the RREB1/ZIP3/ZINC complex arises in early-stage human pancreatic cancers and suppresses the development of malignant cells (41). Therefore, the loss of Rreb1 activity may contribute to the proliferative ability of PanIN. Overall, wPGSA solves problems in TFs search from routine motif analysis such as prediction of actual frequencies of bindings between TFs and motifs and overcomes the limitation of the fewer number of motifs already known.
GSEA is another bioinformatics method used to determine an expression signature using a previously published set of relatively well-defined genes (42). In this study, the CSC marker list was downloaded from a previously published list of ESCs. The most negatively related genes included KRT19, ZFP36L1, AHNAK, IGFBP7, and TM4SF1; interestingly, KRT19, AHNAK2, and TM4SF1 were previously reported as promising diagnostic candidates and were upregulated in PDA-promoting malignancy (43–45). In a survival analysis, the overexpression of ZFP36L2 and IGFBP7 was found to be correlated with poor survival in patients with PDA (46, 47). Separately, all these genes indicate carcinogenesis, whereas the combined signature suggests a loss of stemness that corresponded with the significantly higher proportion of Aldh+ PanIN cells relative to IPMN cells.
Aldh+ and CD cell surface markers are used to identify CSCs via two different evaluation systems (48). In a previous report, pancreatic cancer cells expressing CD24/CD44 or CD133 functioned as CSCs and exhibited tumorigenesis and chemoresistance (31). The Aldh+ system used in this study demonstrated that PanIN cells contained a larger proportion of cells with stemness. Although the ALDEFLUOR kit used in this study mainly detects Aldh1a1, Aldh1a3, and Aldh2 activity while neglecting that of Aldh3a1 and Aldh3b1 (49), we observed the upregulated expression of several Aldh family members in PanIN cells, which suggests a capacity for aggressive proliferation. Our subsequent sphere formation assay confirmed the stemness of PanIN cells. In an actual 2D culture context, PanIN cells exhibited much more accelerated growth than did IPMN cells, and this vigorous proliferation ability was not altered by treatment with GSK690693, a pan-Akt kinase inhibitor proven effective against pancreatic cancer in various preclinical and clinical trials. Our observation that PanIN and IPMN cells exhibited different sensitivities to the same concentration of GSK690693 suggests that this difference underlies the poor treatment effects of single chemo-drug regimens.
Finally, in our use of CAGE data from PanIN and IPMN cells, while dealing with sequencing data (50), variability is of significant importance and is reflected in multiple steps before and during routine analysis; in the preparation stage, human resources tend to generate greater variability than do congenic mouse strains. Besides, biological variance, like sample collection and time points, can induce many variances, which differ obviously in time course study of a phenotypic phenomenon. In this sense, only increasing the number of replicates will be able to aid in drawing a confident conclusion from the data. In our study, tumor formed via mouse cancer cells is the end-stage event, and clustering indicated well-represented consistency between replicates, thus indicating trustworthiness for subsequent experiments. As to the TSS level from the CAGE data, reported by Omori et al. using the mutation profiles (51), it was revealed that only the TSS expression levels shifted between the groups. The lack of newly developed TSS peaks and variants suggested that the genomic profiles of PanIN and IPMN were identical to those of PDA. The independent inclusion of p53 and Brg1 mutations in the mouse genome led to the generation of totally different expression networks in PanIN and IPMN. These differences manifested as distinct phenotypes in the transition from precancerous lesions to pancreatic cancer. The clarification of the major events and characteristics associated with these processes might enable future efforts to prevent the transition to pancreatic malignancy in the future.
Data Availability Statement
The dataset for this study can be found in the GSE139648 (https://www.ncbi.nlm.nih.gov/geo/query/acc.cgi?acc=GSE139648).
Ethics Statement
The animal study was reviewed and approved by ARC-MedKyotoUniv (Animal Research Committee, Graduate School of Medicine, Kyoto University).
Author Contributions
RC and AS contributed to the conception and design of the study. AF provided the mice and worked together with SY in the maintenance of the mice collection. RC performed the statistical analysis and wrote the first draft of the manuscript. MS, NK, HS, and ST corrected sections of the manuscript. All authors contributed to manuscript revision and read and approved the submitted version.
Funding
The authors declare that this study received funding from Sumitomo Danippon Pharma Co., Ltd. The funder was not involved in the study design, collection, analysis, interpretation of data, the writing of this article or the decision to submit it for publication.
Conflict of Interest
The authors declare that the research was conducted in the absence of any commercial or financial relationships that could be construed as a potential conflict of interest.
Supplementary Material
The Supplementary Material for this article can be found online at: https://www.frontiersin.org/articles/10.3389/fonc.2020.00316/full#supplementary-material
Figure S1. Clustering analysis based on expression of the entire promoter set.
Figure S2. Confirmation of transcriptional factors from wPAGA in PanIN/IPMN. (A) qRT-PCR results of all the six TF genes in PanIN/IPMN. Intracellular localization of Nanog in IPMN (B) and Sox2 in PanIN (C) via immunoflourscence staining. Scale bar: 50 μm.
Figure S3. Verification of eight selected genes using qRT-PCR. (A) Survival analysis of eight selected genes from up- and down-regulated promoterome. (B) qRT-PCR results of all the eight selected genes from motif search.
Figure S4. Morphology of cells in IPMN (A) and PanIN (B). Scale bar: 50 μm.
Figure S5. Subcutaneous tumors harvested after GSK690693 applied in treatment in NOD/SCID mice. Within (A) tumors formed in the treated group ① and ② vs. untreated group ③ and ④ in week 3 (p < 0.05). (B,C) represented the diameter measured of each four mice in week 1 and week 2 (p < 0.05).
Figure S6. Cell proliferation assay of PanIN and IPMN cells (A) and after AZD5363 (Akt inhibitor) treatment (C). (B) Western blotting of phosphor-Akt and pan-Akt expression in PanIN and IPMN cells before and after Akt inhibitor treatment.
Figure S7. FACS analysis of cancer stem cell contents alteration upon adding Akt inhibitor via ALDEFLOUR (A) and CD system (B,C).
Table S1. Primer sequences and MARA results.
Abbreviations
CAGE, Cap analysis of gene expression; CPM, Count per million; ESC, Embryonic stem cell; FDR, False discovery rate; GO, Gene Ontology; GSEA, Gene set enrichment analysis; IPMN, Intraductal papillary mucinous neoplasm; KEGG, Kyoto Encyclopedia of Genes and Genomes; MCN, Mucinous cystic neoplasm; PBS, Phosphate-buffered saline; TSS, Transcription start site; PanIN, Pancreatic intraepithelial neoplasia.
References
1. Wu W, He X, Yang L, Wang Q, Bian X, Ye J, et al. Rising trends in pancreatic cancer incidence and mortality in 2000–2014. Clin Epidemiol. (2018) 10:789–97. doi: 10.2147/CLEP.S160018
2. Rawla P, Sunkara T, Gaduputi V. Epidemiology of pancreatic cancer: global trends, etiology and risk factors. World J Oncol. (2019) 10:10–27. doi: 10.14740/wjon1166
3. Søreide K, Primavesi F, Labori KJ, Watson MM, Stättner S. Molecular biology in pancreatic ductal adenocarcinoma: implications for future diagnostics and therapy. Eur Surg. (2019) 51:126–34. doi: 10.1007/s10353-019-0575-z
4. Ghaneh P, Costello E, Neoptolemos JP. Biology and management of pancreatic cancer. Gut. (2007) 56:1134–52. doi: 10.1136/gut.2006.113068
5. Bailey P, Chang DK, Nones K, Johns AL, Patch AM, Gingras MC, et al. Genomic analyses identify molecular subtypes of pancreatic cancer. Nature. (2016) 531:47–52. doi: 10.1038/nature16965
6. Kaur S, Baine MJ, Jain M, Sasson AR, Batra SK. Early diagnosis of pancreatic cancer: challenges and new developments. Biomark Med. (2012) 6:597–612. doi: 10.2217/bmm.12.69
7. Pelosi E, Castelli G, Testa U. Pancreatic cancer: molecular characterization, clonal evolution and cancer stem cells. Biomedicines. (2017) 5:65. doi: 10.3390/biomedicines5040065
8. Distler M, Aust D, Weitz J, Pilarsky C, Grützmann R. Precursor lesions for sporadic pancreatic cancer: PanIN, IPMN, and MCN. Biomed Res Int. (2014) 2014:474905. doi: 10.1155/2014/474905
9. Makohon-Moore AP, Matsukuma K, Zhang M, Reiter JG, Gerold JM, Jiao Y, et al. Precancerous neoplastic cells can move through the pancreatic ductal system. Nature. (2018) 561:201–5. doi: 10.1038/s41586-018-0481-8
10. Khan MA, Azim S, Zubair H, Bhardwaj A, Patel GK, Khushman M, et al. Molecular drivers of pancreatic cancer pathogenesis: looking inward to move forward. Int J Mol Sci. (2017) 18:779. doi: 10.3390/ijms18040779
11. Ijichi H. Genetically-engineered mouse models for pancreatic cancer: advances and current limitations. World J Clin Oncol. (2011) 2:195–202. doi: 10.5306/wjco.v2.i5.195
12. von Figura G, Fukuda A, Roy N, Liku ME, Morris Iv JP, Kim GE, et al. The chromatin regulator Brg1 suppresses formation of intraductal papillary mucinous neoplasm and pancreatic ductal adenocarcinoma. Nat Cell Biol. (2014) 16:255–67. doi: 10.1038/ncb2916
13. Hawkins RD, Hon GC, Ren B. Next-generation genomics: an integrative approach. Nat Rev Genet. (2010) 11:476–86. doi: 10.1038/nrg2795
14. Shiraki T, Kondo S, Katayama S, Waki K, Kasukawa T, Kawaji H, et al. Cap analysis gene expression for high-throughput analysis of transcriptional starting point and identification of promoter usage. Proc Natl Acad Sci USA. (2003) 100:15776–81. doi: 10.1073/pnas.2136655100
15. Li H, Bai L, Li H, Li X, Kang Y, Zhang N, et al. Selective translational usage of TSS and core promoters revealed by translatome sequencing. BMC Genomics. (2019) 20:282. doi: 10.1186/s12864-019-5650-0
16. Kouno T, Moody J, Kwon AT, Shibayama Y, Kato S, Huang Y, et al. C1 CAGE detects transcription start sites and enhancer activity at single-cell resolution. Nat Commun. (2019) 10:360. doi: 10.1038/s41467-018-08126-5
17. Maitra A, Hruban RH. Pancreatic cancer. Annu Rev Pathol. (2008) 3:157–88. doi: 10.1146/annurev.pathmechdis.3.121806.154305
18. Ohmiya H, Vitezic M, Frith MC, Itoh M, Carninci P, Forrest AR, et al. RECLU: a pipeline to discover reproducible transcriptional start sites and their alternative regulation using capped analysis of gene expression (CAGE). BMC Genomics. (2014) 15:269. doi: 10.1186/1471-2164-15-269
19. Bailey TL. DREME: motif discovery in transcription factor ChIP-seq data. Bioinformatics. (2011) 27:1653–59. doi: 10.1093/bioinformatics/btr261
20. Yu G, Wang LG, Han Y, He QY. clusterProfiler: an R package for comparing biological themes among gene clusters. Omics. (2012) 16:284–7. doi: 10.1089/omi.2011.0118
21. Walter W, Sánchez-Cabo F, Ricote M. GOplot: an R package for visually combining expression data with functional analysis. Bioinformatics. (2015) 31:2912–4. doi: 10.1093/bioinformatics/btv300
22. Kawakami E, Nakaoka S, Ohta T, Kitano H. Weighted enrichment method for prediction of transcription regulators from transcriptome and global chromatin immunoprecipitation data. Nucleic Acids Res. (2016) 44:5010–21. doi: 10.1093/nar/gkw355
23. Herreros-Villanueva M, Zhang JS, Koenig A, Abel EV, Smyrk TC, Bamlet WR, et al. SOX2 promotes dedifferentiation and imparts stem cell-like features to pancreatic cancer cells. Oncogenesis. (2013) 2:e61. doi: 10.1038/oncsis.2013.23
24. Bailey TL, Elkan C. Fitting a mixture model by expectation maximization to discover motifs in biopolymers. In: Proceedings of the Second International Conference on Intelligent Systems for Molecular Biology. Menlo Park, CA: AAAI Press (1994). p. 28–36.
25. Gupta S, Stamatoyannopolous JA, Bailey T, Noble WS. Quantifying similarity between motifs. Genome Biol. (2007) 8:R24. doi: 10.1186/gb-2007-8-2-r24
26. Madsen JGS, Rauch A, Van Hauwaert EL, Schmidt SF, Winnefeld M, Mandrup S. Integrated analysis of motif activity and gene expression changes of transcription factors. Genome Res. (2018) 28:243–55. doi: 10.1101/gr.227231.117
27. Mele L, Liccardo D, Tirino V. Evaluation and isolation of cancer stem cells using ALDH activity assay. Methods Mol Biol. (2018) 1692:43–8. doi: 10.1007/978-1-4939-7401-6_4
28. Vassalli G. Aldehyde dehydrogenases: not just markers, but functional regulators of stem cells. Stem Cells Int. (2019) 2019:3904645. doi: 10.1155/2019/3904645
29. Bahmad HF, Cheaito K, Chalhoub RM, Hadadeh O, Monzer A, Ballout F, et al. Sphere-formation assay: three-dimensional in vitro culturing of prostate cancer stem/progenitor sphere-forming cells. Front Oncol. (2018) 8:347. doi: 10.3389/fonc.2018.00347
30. Lathia JD, Liu H. Overview of cancer stem cells and stemness for community oncologists. Targeted Oncol. (2017) 12:387–99. doi: 10.1007/s11523-017-0508-3
31. Durko L, Wlodarski W, Stasikowska-Kanicka O, Wagrowska-Danilewicz M, Danilewicz M, Hogendorf P, et al. Expression and clinical significance of cancer stem cell markers CD24, CD44, and CD133 in pancreatic ductal adenocarcinoma and chronic pancreatitis. Dis Markers. (2017) 2017:3276806. doi: 10.1155/2017/3276806
32. Weledji EP, Enoworock G, Mokake M, Sinju M. How grim is pancreatic cancer? Oncol Rev. (2016) 10:294. doi: 10.4081/oncol.2016.294
33. Saad AM, Turk T, Al-Husseini MJ, Abdel-Rahman O. Trends in pancreatic adenocarcinoma incidence and mortality in the United States in the last four decades; a SEER-based study. BMC Cancer. (2018) 18:688. doi: 10.1186/s12885-018-4610-4
34. Singhi AD, Koay EJ, Chari ST, Maitra A. Early detection of pancreatic cancer: opportunities and challenges. Gastroenterology. (2019) 156:2024–40. doi: 10.1053/j.gastro.2019.01.259
35. Conway JR, Herrmann D, Evans TJ, Morton JP, Timpson P. Combating pancreatic cancer with PI3K pathway inhibitors in the era of personalised medicine. Gut. (2019) 68:742–58. doi: 10.1136/gutjnl-2018-316822
36. Ebrahimi S, Hosseini M, Shahidsales S, Maftouh M, Ferns GA, Ghayour-Mobarhan M, et al. Targeting the Akt/PI3K signaling pathway as a potential therapeutic strategy for the treatment of pancreatic cancer. Curr Med Chem. (2017) 24:1321–31. doi: 10.2174/0929867324666170206142658
37. Kanteti R, Mirzapoiazova T, Riehm JJ, Dhanasingh I, Mambetsariev B, Wang J, et al. Focal adhesion kinase a potential therapeutic target for pancreatic cancer and malignant pleural mesothelioma. Cancer Biol Ther. (2018) 19:316–27. doi: 10.1080/15384047.2017.1416937
38. McFadyen MC, Melvin WT, Murray GI. Cytochrome P450 enzymes: novel options for cancer therapeutics. Mol Cancer Ther. (2004) 3:363–71. Available online at: https://mct.aacrjournals.org/content/3/3/363.long
39. Ma W, Noble WS, Bailey TL. Motif-based analysis of large nucleotide data sets using MEME-ChIP. Nat Protoc. (2014) 9:1428–50. doi: 10.1038/nprot.2014.083
40. Nitz MD, Harding MA, Smith SC, Thomas S, Theodorescu D. RREB1 transcription factor splice variants in urologic cancer. Am J Pathol. (2011) 179:477–86. doi: 10.1016/j.ajpath.2011.03.038
41. Franklin RB, Zou J, Costello LC. The cytotoxic role of RREB1, ZIP3 zinc transporter, and zinc in human pancreatic adenocarcinoma. Cancer Biol Ther. (2014) 15:1431–7. doi: 10.4161/cbt.29927
42. Mootha VK, Lindgren CM, Eriksson KF, Subramanian A, Sihag S, Lehar J, et al. PGC-1alpha-responsive genes involved in oxidative phosphorylation are coordinately downregulated in human diabetes. Nat Genet. (2003) 34:267–73. doi: 10.1038/ng1180
43. Yao H, Yang Z, Liu Z, Miao X, Yang L, Li D, et al. Glypican-3 and KRT19 are markers associating with metastasis and poor prognosis of pancreatic ductal adenocarcinoma. Cancer Biomark. (2016) 17:397–404. doi: 10.3233/CBM-160655
44. Lu D, Wang J, Shi X, Yue B, Hao J. AHNAK2 is a potential prognostic biomarker in patients with PDAC. Oncotarget. (2017) 8:31775–84. doi: 10.18632/oncotarget.15990
45. Cao J, Yang JC, Ramachandran V, Arumugam T, Deng DF, Li ZS, et al. TM4SF1 regulates pancreatic cancer migration and invasion in vitro and in vivo. Cell Physiol Biochem. (2016) 39:740–50. doi: 10.1159/000445664
46. Yonemori K, Seki N, Kurahara H, Osako Y, Idichi T, Arai T, et al. ZFP36L2 promotes cancer cell aggressiveness and is regulated by antitumor microRNA-375 in pancreatic ductal adenocarcinoma. Cancer Sci. (2017) 108:124–35. doi: 10.1111/cas.13119
47. An W, Ben QW, Chen HT, Zheng JM, Huang L, Li GX, et al. Low expression of IGFBP7 is associated with poor outcome of pancreatic ductal adenocarcinoma. Ann Surg Oncol. (2012) 19:3971–8. doi: 10.1245/s10434-012-2407-2
48. Li W, Ma H, Zhang J, Zhu L, Wang C, Yang Y. Unraveling the roles of CD44/CD24 and ALDH1 as cancer stem cell markers in tumorigenesis and metastasis. Sci Rep. (2017) 7:13856. doi: 10.1038/s41598-017-14364-2
49. Zhou L, Sheng D, Wang D, Ma W, Deng Q, Deng L, et al. Identification of cancer-type specific expression patterns for active aldehyde dehydrogenase (ALDH) isoforms in ALDEFLUOR assay. Cell Biol Toxicol. (2019) 35:161–77. doi: 10.1007/s10565-018-9444-y
50. McIntyre LM, Lopiano KK, Morse AM, Amin V, Oberg AL, Young LJ, et al. RNA-seq: technical variability and sampling. BMC Genomics. (2011) 12:293. doi: 10.1186/1471-2164-12-293
Keywords: cap analysis of gene expression, intraductal papillary mucinous neoplasm, molecular profiling, pancreatic intraepithelial neoplasia, transcriptome
Citation: Chen R, Sugiyama A, Kataoka N, Sugimoto M, Yokoyama S, Fukuda A, Takaishi S and Seno H (2020) Promoter-Level Transcriptome Identifies Stemness Associated With Relatively High Proliferation in Pancreatic Cancer Cells. Front. Oncol. 10:316. doi: 10.3389/fonc.2020.00316
Received: 02 November 2019; Accepted: 21 February 2020;
Published: 20 March 2020.
Edited by:
Fabio Iannelli, IFOM—The FIRC Institute of Molecular Oncology, ItalyReviewed by:
Quan Nguyen, The University of Queensland, AustraliaEnza Lonardo, Institute of Genetics and Biophysics (CNR), Italy
Copyright © 2020 Chen, Sugiyama, Kataoka, Sugimoto, Yokoyama, Fukuda, Takaishi and Seno. This is an open-access article distributed under the terms of the Creative Commons Attribution License (CC BY). The use, distribution or reproduction in other forums is permitted, provided the original author(s) and the copyright owner(s) are credited and that the original publication in this journal is cited, in accordance with accepted academic practice. No use, distribution or reproduction is permitted which does not comply with these terms.
*Correspondence: Aiko Sugiyama, YWlrby5zdWdpeWFtYS5mdHhAZ21haWwuY29t; Shigeo Takaishi, dGFrYWlzaGlAZHNrLm1lZC5reW90by11LmFjLmpw
†These authors jointly supervised this study