 Xuezhi Zhou1,2†Yongju Yi3,4†
 Zhenyu Liu2,5†Zhiyang Zhou6†Bingjia Lai7
 Kai Sun1Longfei Li8
 Liyu Huang1Yanqiu Feng3*
 Wuteng Cao6*
 Jie Tian1,2,5,9*
- 1Engineering Research Center of Molecular and Neuro Imaging of Ministry of Education, School of Life Science and Technology, Xidian University, Xi'an, China
- 2CAS Key Laboratory of Molecular Imaging, Institute of Automation, Chinese Academy of Science, Beijing, China
- 3Guangdong Provincial Key Laboratory of Medical Image Processing, School of Biomedical Engineering, Southern Medical University, Guangzhou, China
- 4Network Information Center, The Sixth Affiliated Hospital, Sun Yat-sen University, Guangzhou, China
- 5University of Chinese Academy of Science, Beijing, China
- 6Department of Radiology, The Sixth Affiliated Hospital, Sun Yat-sen University, Guangzhou, China
- 7Department of Radiology, Sun Yat-sen Memorial Hospital, Sun Yat-sen University, Guangzhou, China
- 8Collaborative Innovation Center for Internet Healthcare, Zhengzhou University, Zhengzhou, China
- 9Beijing Advanced Innovation Center for Big Data-Based Precision Medicine, School of Medicine, Beihang University, Beijing, China
Background and Purpose: Lymph node status is a key factor for the recommendation of organ preservation for patients with locally advanced rectal cancer (LARC) following neoadjuvant therapy but generally confirmed post-operation. This study aimed to preoperatively predict the lymph node status following neoadjuvant therapy using multiparametric magnetic resonance imaging (MRI)-based radiomic signature.
Materials and Methods: A total of 391 patients with LARC who underwent neoadjuvant therapy and TME were included, of which 261 and 130 patients were allocated to the primary cohort and the validation cohort, respectively. The tumor area, as determined by preoperative MRI, underwent radiomics analysis to build a radiomic signature related to lymph node status. Two radiologists reassessed the lymph node status on MRI. The radiomic signature and restaging results were included in a multivariate analysis to build a combined model for predicting the lymph node status. Stratified analyses were performed to test the predictive ability of the combined model in patients with post-therapeutic MRI T1-2 or T3-4 tumors, respectively.
Results: The combined model was built in the primary cohort, and predicted lymph node metastasis (LNM+) with an area under the curve of 0.818 and a negative predictive value (NPV) of 93.7% were considered in the validation cohort. Stratified analyses indicated that the combined model could predict LNM+ with a NPV of 100 and 87.8% in the post-therapeutic MRI T1-2 and T3-4 subgroups, respectively.
Conclusion: This study reveals the potential of radiomics as a predictor of lymph node status for patients with LARC following neoadjuvant therapy, especially for those with post-therapeutic MRI T1-2 tumors.
Introduction
Neoadjuvant therapy followed by total mesorectal excision (TME) is the standard treatment for patients with locally advanced rectal cancer (LARC) (1). After neoadjuvant therapy, ~50–60% of patients are downstaged, and ~20% show pathologic complete response (1–3). Although TME is effective at providing local tumor control, it is also associated with significant genitourinary and gastrointestinal morbidity and long-lasting complications such as sexual dysfunction and urinary or fecal problems (4–6). Hence, organ preservation strategies, such as watchful waiting and local excision (7) following neoadjuvant therapy, are becoming more popular for preserving organ function and improving the patients' quality of life (8–12).
One of the disadvantages of organ preservation is a lack of exact pathologic lymph node staging. Leaving lymph node metastasis (LNM+) unresected can potentially lead to local recurrence or distant spread. Magnetic resonance imaging (MRI) and computer tomography are the routine imaging modalities for restaging following neoadjuvant therapy for rectal cancer, but with limited accuracy and with no consensus regarding the standard definitions of LNM+ (13). Neoadjuvant therapy results in changes in shape, size, and texture of a positive lymph node, but these changes still cannot exactly indicate a positive node turning out to be negative. The remains of tumor cells in small nodes make nodal restaging a challenge, which makes patients to have to undergo TME to obtain the precise pathological nodal stage (14). Several studies have investigated the predictive factors for LNM+ but have not identified measures with sufficient predictive precision to enable clinical decisions. For example, a nomogram based on preoperatively available clinicopathologic features has been created to predict LNM+ following neoadjuvant treatment for LARC. If the threshold of 0.3 nomogram predicting the risk of positive nodes is used, almost 80% of the patients with LNM+ will be correctly identified (15). Azizian et al. found that changes of circulating miR-18b and miR-20a expression levels during neoadjuvant treatment could predict LNM+ with a NPV of 79 and 85%, respectively (16). A recent study reported that two factors (ypT stage <3 and lymphovascular invasion) were associated with ypN0 status in good responders following neoadjuvant therapy, indicating a high positive predictive value (PPV) for identifying ypN0 patients (17). However, this study had a small sample size and lacked validation, and the predictive factors were derived from resection specimens; this precluded desirable preoperative decision-making.
Radiomics is a rapid developing field of quantitative image analysis that may facilitate the prediction of lymph node status following neoadjuvant therapy (18, 19). The utility of radiomics is evident from clinical research, such as the prediction of therapeutic responses (20–23), survival analysis (24, 25), and prediction of clinical events (26, 27). Recently, two studies (28, 29) have attempted to detect the associations between local tumor region information on imaging and surrounding nodals and demonstrated the potential of preoperative tumor radiomic features in predicting LNM+ in rectal cancer; however, their analyses were limited to patients that were not administered with any preoperative treatment. Therefore, we hypothesize that local tumor region information following neoadjuvant therapy may also associate with regional nodal status.
Radiomics could quantitatively analyze image information, which may help to detect some associations between local tumor information on imaging and surrounding nodal status. This study aimed to assess if preoperative MRI-based radiomic features could reliably predict lymph node status following neoadjuvant therapy in LARC to improve patient management. Briefly, we first attempted to construct a multiparametric MRI-based radiomic signature. Then, we built and validated a prediction model incorporating the radiomic signature and radiologist's assessment results. Finally, we evaluated the prediction model's performance in two subgroups with different post-therapeutic MRI T (ymrT) stages to identify the ideal population in which this model would be applicable.
Materials and Methods
Patients
This retrospective study was approved by the institutional review board of the Sixth Affiliated Hospital of Sun Yat-sen University. The requirement for informed patient consent was waived. A total of 425 patients who were initially diagnosed with N+ or T3/T4 rectal cancer, also named as LARC, and received neoadjuvant therapy followed by TME surgery between November 2012 and May 2017 at the Sixth Affiliated Hospital of Sun Yat-sen University were included. The exclusion criteria were as follows: (i) lack of multiparametric MRI data including T1-weighted fast spin-echo imaging (T1w), T2 weighted fast spin-echo imaging (T2w), diffusion-weighted imaging (DWI), or contrast-enhanced T1-weighted fast spin-echo imaging (CE-T1w) 1 week before TME surgery; (ii) insufficient MRI quality due to bowel peristalsis-related artifacts; (iii) lack of clinical information including sex, age, and carcinoembryonic antigen (CEA) (cutoff: ≥ 5 ng/ml, <5 ng/ml) blood level; and (iv) lack of pathology reports, since the pathological lymph nodal status will be obtained from the pathology reports. The recruitment of patients is depicted in Figure 1. Patients were then randomly allocated to a primary cohort and a validation cohort in a ratio of 2:1.
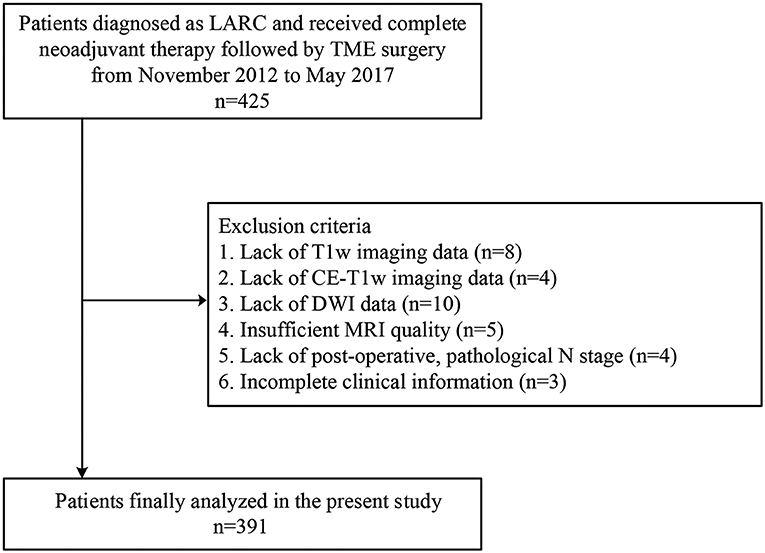
Figure 1. Recruitment pathway for patients in this study. LARC, locally advanced rectal cancer; T1w, T1-weighted; CE-T1w, contrast-enhanced T1-weighted; DWI, diffusion-weighted imaging; MRI, magnetic resonance imaging.
Multiparametric MRI Acquisition
All patients were scanned with a 1.5-Tesla MR (Optima MR 360, GE Medical Systems, USA) using an eight-element body array coil with fixed image protocols. The scanning sequences consisted of T1w, T2w, DWI (two b-values including 0 and 800 s/mm2), and CE-T1w. The technical MRI parameters are listed in Supplementary Table A2.
Tumor Masking and Radiomic Feature Extraction
Two gastrointestinal radiologists with 5 (radiologist #1) and 10 (radiologist #2) years of experience examined the MR images and independently defined the regions of interest by manually outlining the tumor margin using itk-SNAP software (www.itksnap.org) on axial slices containing the largest cross-sectional tumor area on each imaging sequence, as shown in Figure 2. At an intuitive level, the most reasonable way to predict the lymph node status is to perform radiomic analysis on each node. However, doing so in this retrospective study is almost impossible as it needs to know every node's pathological status and needs to map every lymph node tissue on MRIs. In this study, we could only obtain the patient-level lymph node status from the post-operative pathology report, which was the number of positive nodes and all nodes from the resection specimens. There even existed some small nodes that could be identified under the microscope but are missed on MRIs following neoadjuvant therapy. In addition, one problem must be solved if we perform radiomic analysis on identifiable nodes on MRIs. The number of identifiable nodes can vary a lot between different patients. That means that we will obtain feature sets with different feature numbers between different patients. Transforming these feature sets into the same feature space is difficult to solve. Thus, we defined a local tumor area as a region of interest like most of the published study (28, 30, 31). Local tumor region information following neoadjuvant therapy may also associate with regional nodal status. Intraclass correlation coefficients were used to assess the agreement of extracted features by two radiologists. The regions of interest on DWI were delineated at a b value of 800 s/mm2 and were then copied onto the corresponding apparent diffusion coefficient (ADC) maps.
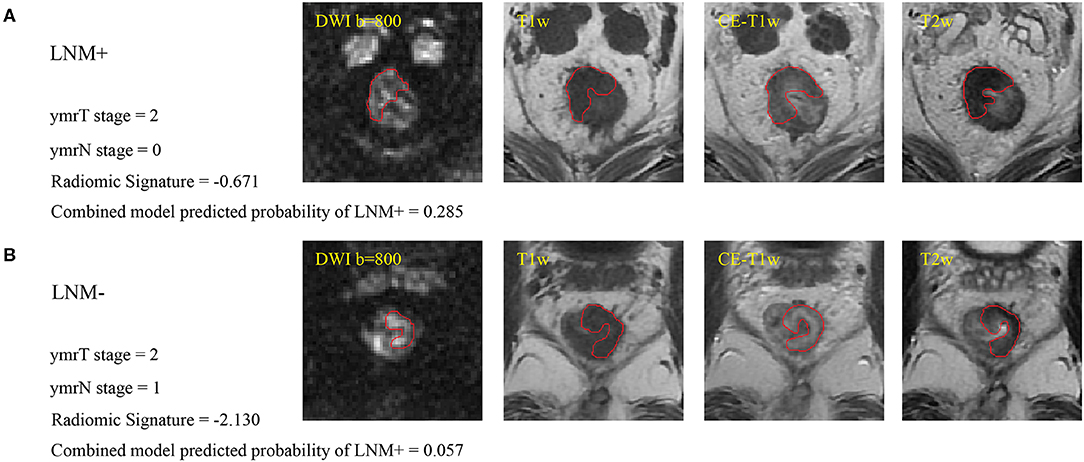
Figure 2. (A) Sample images of LNM+, where the red line indicates the tumor margin. (B) Sample images of LNM–. Cutoffs for the radiomic signature and combined model are −1.4208 and 0.0897, respectively, for patients with ymrT1-2 tumors in this study. These two patients were misdiagnosed by the radiologist but were correctly assessed by radiomics analysis. LNM+, lymph node metastasis; LNM–, lymph node non-metastasis; DWI, diffusion-weighted imaging; T1w, T1-weighted; CE-T1w, contrast-enhanced T1-weighted; T2w, T2-weighted.
The radiomic features extracted are listed in Supplementary Table A3. A total of 264 features were extracted from each of the T1w, T2w, and CE-T1w images and the ADC maps. These features could be divided into three categories, including first-order statistics, textural features, and Laplacian of Gaussian (LoG) filtration features. Radiomic feature extraction was conducted using an in-house software written in MATLAB (MathWorks, Inc., Natick, MA, USA). All features were linearly normalized into a range [0, 1] with the formula as follows:
where was the ith normalized feature value, Xi was the ith raw feature value, and and were the minimum value and maximum value of the ith raw feature values in the primary cohort, respectively.
Feature Selection and Radiomic Signature Construction
We built a model for predicting LNM+ in the primary cohort and evaluated its generalizability in the validation cohort. Before modeling, a feature selection program consisting of three steps was executed in the primary cohort. First, the Wilcoxon rank-sum test was performed for every feature between the LNM+ and LNM- groups as a rough identification of features with p ≤ 0.1 to be used in further processing. Second, the Spearman correlation coefficient was calculated between any two features, and the feature with the bigger Wilcoxon rank-sum test p-value was excluded when the absolute value of the correlation coefficient exceeded 0.9. Third, the least absolute shrinkage and selection operator (LASSO) method was applied to select the most predictive features (32). To avoid over-fitting, the best LASSO regularization parameter “lambda” was determined by a 10-fold cross-validation. Features with one standard error from the minimum criterion were selected for modeling. Then, a multivariate logistic regression model was built based on the selected features. Summation of the selected features multiplied by the corresponding coefficients was performed for each patient as a radiomic signature, which was mathematically represented as follows:
where Y was the probability of LNM+ predicted by this model, b was the intercept, Xi was the ith selected feature, and Ci was the coefficient of the ith selected feature. Receiver operating characteristic (ROC) curve analysis was performed in both cohorts to evaluate the predictive ability of radiomic signatures in differentiating LNM+ from LNM-. All steps were performed with R version 3.5.2 (www.r-project.org) using the “glmnet,” “glm2,” and “pROC” packages.
Comparison of Radiomic Signature and Radiologists' Diagnostic Performance
Radiologists #1 and #2, who were blinded to any medical record information, independently reviewed the MRIs and independently determined the post-therapeutic ymrT stage and post-therapeutic MRI N (ymrN) stage. The ymrT stage was based on the depth of tumor penetration (mucin or soft components) relative to the muscularis propria as T1 (limited to the mucosa and submucosa), T2 (invasion but no penetration of the muscularis propria), T3 (penetration beyond the muscularis propria), or T4 (involvement of other organs). The ymrN status was defined as positive metastasis if the regional lymph node manifested with a small diameter (≥ 6 mm), irregular border, mixed signal intensity (SI), or high SI assumed to represent mucin. The N stage was based on the number of positive lymph nodes: N1 (at least one but less than three nodes) or N2 (more than or equal to three nodes). If the smallest diameter of the largest lymph node was <6 mm and had no features of irregular border and no mixed SI was observed, the N status was graded as N0 (33). Mcnemar test (34) and net reclassification improvement (NRI) test (35) were used for statistical analysis of the prediction results of the radiomic signature and radiologists' diagnosis. Univariate logistic regression analysis was performed in the primary cohort to select the clinical variables with a significant association. Finally, we established a combined model incorporating the radiomic signature and the associated clinical variables by multivariate logistic regression and evaluated this model in the validation cohort. A clinical model incorporating associated clinical variables without radiomic signature was also built through multivariate logistic regression for comparison purposes. To provide an easily used quantitative tool to predict the probability of LNM+, we converted the combined model to a nomogram. The calibration curves were plotted to assess the consistency between the predicted probability and the actual rate of LNM+. Hosmer-Lemeshow test with p-value > 0.05 indicates a good fit of the model (36). Decision curve analysis was also conducted to assess the clinical use of this nomogram.
Unlike patients with ymrT3-4 tumors, patients with ymrT1-2 tumors usually exhibit a lower probability of LNM+ and a smaller depth of invasion (37); thus, they are more suitable candidates for local excision. The predictive ability of the model may differ in subgroups divided according to ymrT stage. Thus, we conducted stratified analyses in ymrT1-2 and ymrT3-4 groups, respectively.
Area under the curve (AUC), accuracy, sensitivity, specificity, PPV, and negative predictive value (NPV) according to the Youden cutoff (38) were calculated to quantize the predictive ability of the prediction models in both cohorts.
Results
Demographic and Clinical Data
A total of 391 patients were enrolled in the study, as described in Figure 1; 231 of these patients underwent preoperative treatment with four to six cycles of mFOLFOX6 chemotherapy (infusional fluorouracil plus oxaliplatin of 85 mg/m2 intravenously on day 1 of each chemotherapy cycle). Postoperative adjuvant chemotherapy was performed with seven cycles of mFOLFOX6; the rest of the 160 patients received preoperative treatment with five cycles of infusional fluorouracil (leucovorin 400 mg/m2 intravenously followed by fluorouracil 400 mg/m2 intravenously and fluorouracil 2.4 g/m2 by 48-h continuous intravenous infusion) and concurrent radiation treatment. Radiotherapy was delivered at 1.8 to 2.0 Gy daily from Monday through Friday for a total of 23 to 28 fractions over 5 to 6 weeks and a total dose of 46.0 to 50.4 Gy. Radiation was delivered with a minimum energy of 6-MV photons through a three- or four-field box technique to the primary tumor and to mesorectal, presacral, and internal iliac lymph nodes (39). A post-operative pathological examination indicated that 87 patients were LNM+. The number of positive nodes ranges from 1 to 12, with a median number of 2. The other 304 patients were LNM-. The clinical characteristics of the patients enrolled are summarized in Table 1 and in Supplementary Table A1. There were no significant differences in the clinical variables between the primary and the validation cohorts. Table 2 exhibited the agreement of ymrT/N stage and ypT/N stage. The ymrT could predict ypT stage with an accuracy of 88.2%. The major predicted error was derived from overstaging of ypT0–2. However, in terms of node restaging, ymrN and ypN showed bad concordance.
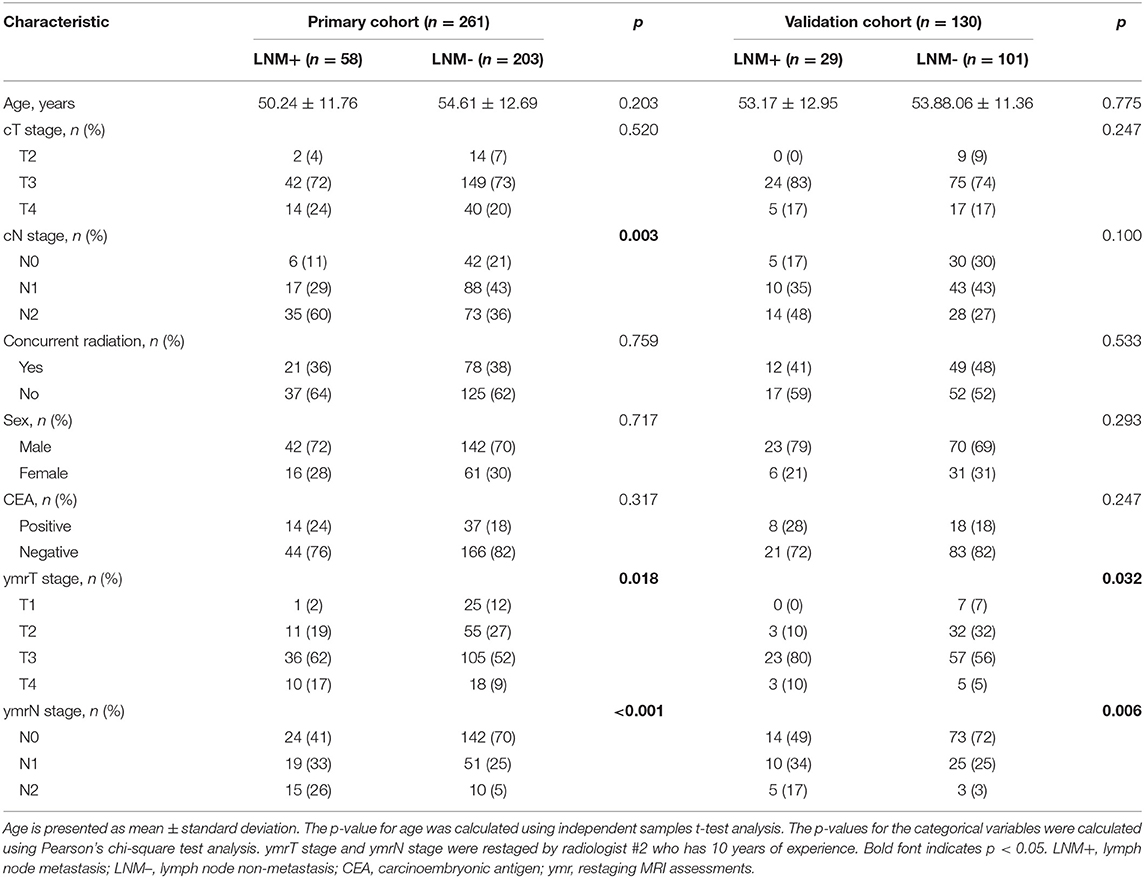
Table 1. Clinical characteristics of patients in primary and validation cohorts.
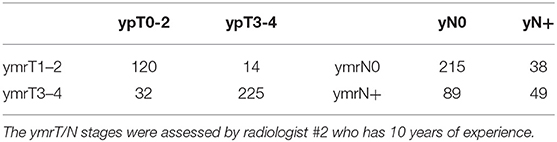
Table 2. Confusion matrice for tumor restaging and node restaging.
Radiomic Signature Construction
The intraclass correlation coefficients calculated for features extracted by the two radiologists ranged from 0.725 to 0.942, reflecting a good agreement. The features extracted from the regions of interest delineated by the radiologist with 10 years of experience were used for further analysis. Thirteen features were selected to build a radiomic signature, as listed in Supplementary Table A4. None of the T1w feature was selected, indicating a poor predictive ability of T1w features. In both cohorts, the radiomic signature was significantly higher in the LNM+ group than in the LNM- group, as shown in Figure 3. The radiomic signature yielded an AUC of 0.787 [95% confidence interval (CI): 0.726–0.848] and 0.783 (95% CI: 0.690–0.875) in the primary and validation cohorts, respectively.
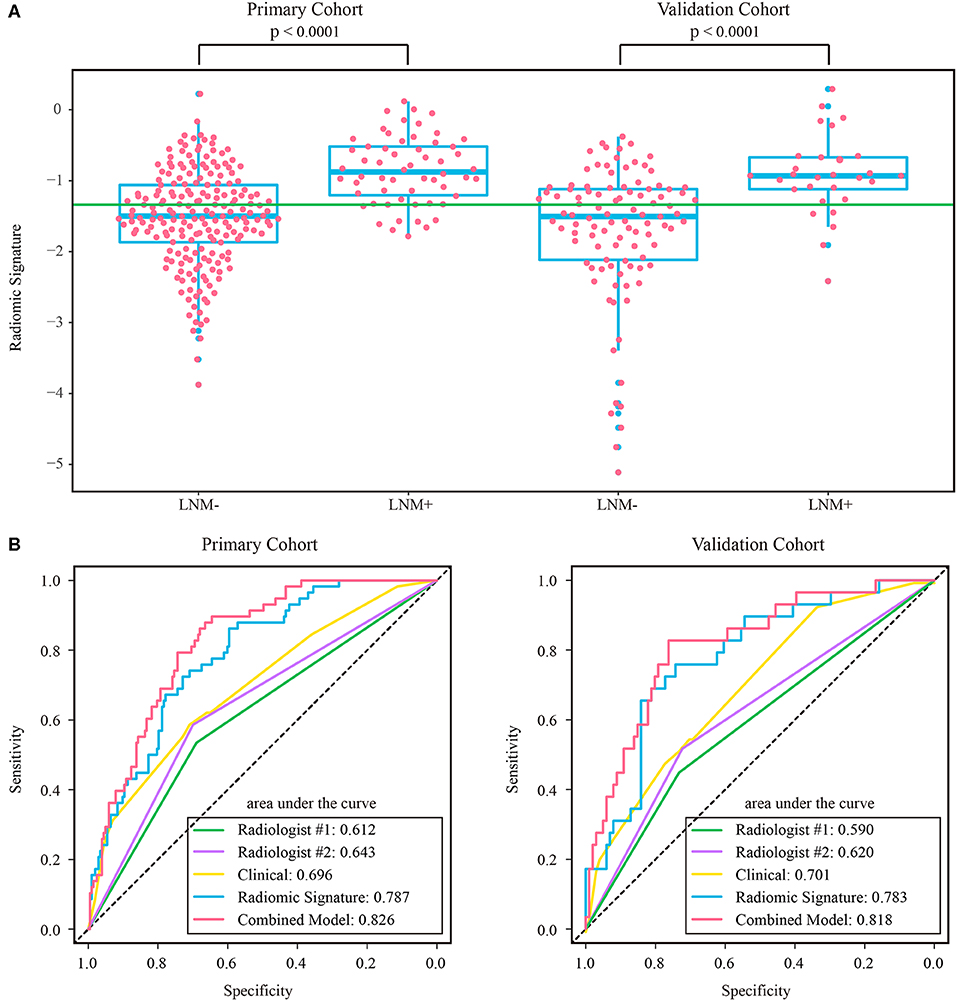
Figure 3. (A) Distribution of radiomic signature in the primary and validation cohorts, where the green line indicates the Youden cutoff in the primary cohort, and the p-value was calculated using Wilcoxon rank-sum test. (B) ROC curves of radiologists' and prediction models. LNM+, lymph node metastasis; LNM-, lymph node non-metastasis; ROC, receiver operating characteristic.
Comparison of Radiomic Signature and Radiologists' Diagnostic Performance
The assessment results of the two radiologists were highly consistent, yielding a Kappa value of 0.936 and 0.933 for ymrT stage and ymrN stage, respectively. The confusion matrices, as shown in Supplementary Figure A1, indicated that radiologist #1 and radiologist #2 yielded a sensitivity of 50.57% (95% CI: 35.6–64.7%) and 56.32% (95% CI: 42.3–70.8%), respectively. The AUC of radiologist #2 was 0.62 (95% CI: 0.518–0.722) in the validation cohort, which was significantly (Delong test p-value: 0.021) smaller than that of the radiomic signature. The sensitivity of the radiomic signature reached a score of 82.8% (95% CI: 68.8–96.6%), which was significantly (Mcnemar test p-value: 0.022) different from that of radiologist #2 in the validation cohort. The specificity values of radiomic signature and radiologist #2 were 58.4% (95% CI: 48.8–67.7%) vs. 72.2% (95% CI: 63.5–81.0%), which were also significantly different (Mcnemar test p-value: 0.044).
As the diagnostic accuracy of radiologist #2 was higher than that of radiologist #1, here we only reported the prediction results based on post-therapeutic restaging results from radiologist #2, and those based on the restaging results from radiologist #1 were provided in the Supplementary File. In univariate logistic regression analysis in the primary cohort, post-therapeutic ymrT stage, ymrN stage, and radiomic signature were statistically significant (Table 3). We built a combined model to integrate the staging results of radiologist #2 and the radiomic signature using multivariate logistic regression in the primary cohort and converted it into a nomogram, as shown in Figure 4. Compared to the radiologists' performance, the prediction accuracy in the validation cohort using the combined model was improved (NRI test p-value: 0.125) to 75.4% from the accuracy value of 63.8% of radiologist #2, yielding a sensitivity of 82.8% (95% CI: 68.5–82.8%), specificity of 73.3% (95% CI: 64.8–81.9%), PPV of 47.1% (33.2–60.8%), and NPV of 93.7% (88.3–99.0%). The clinical model incorporating ymrT and ymrN yielded an AUC value of 0.696 (95% CI: 0.619–0.773) and 0.701 (95% CI: 0.601–0.801) in the primary cohort and the validation cohort, respectively. The Delong test analysis showed that the clinical model performed significantly (p < 0.05) worse than the combined model but was comparable to the radiomic signature (p > 0.05) in both cohorts. All these results are listed in Supplementary Table A5 and Figure 2A.
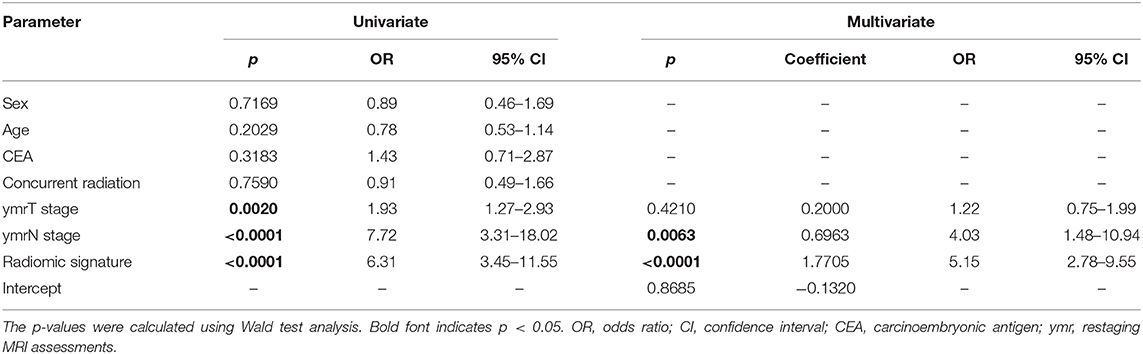
Table 3. Univariate and multivariate logistic regression analysis for clinical characteristics and radiomic signature.
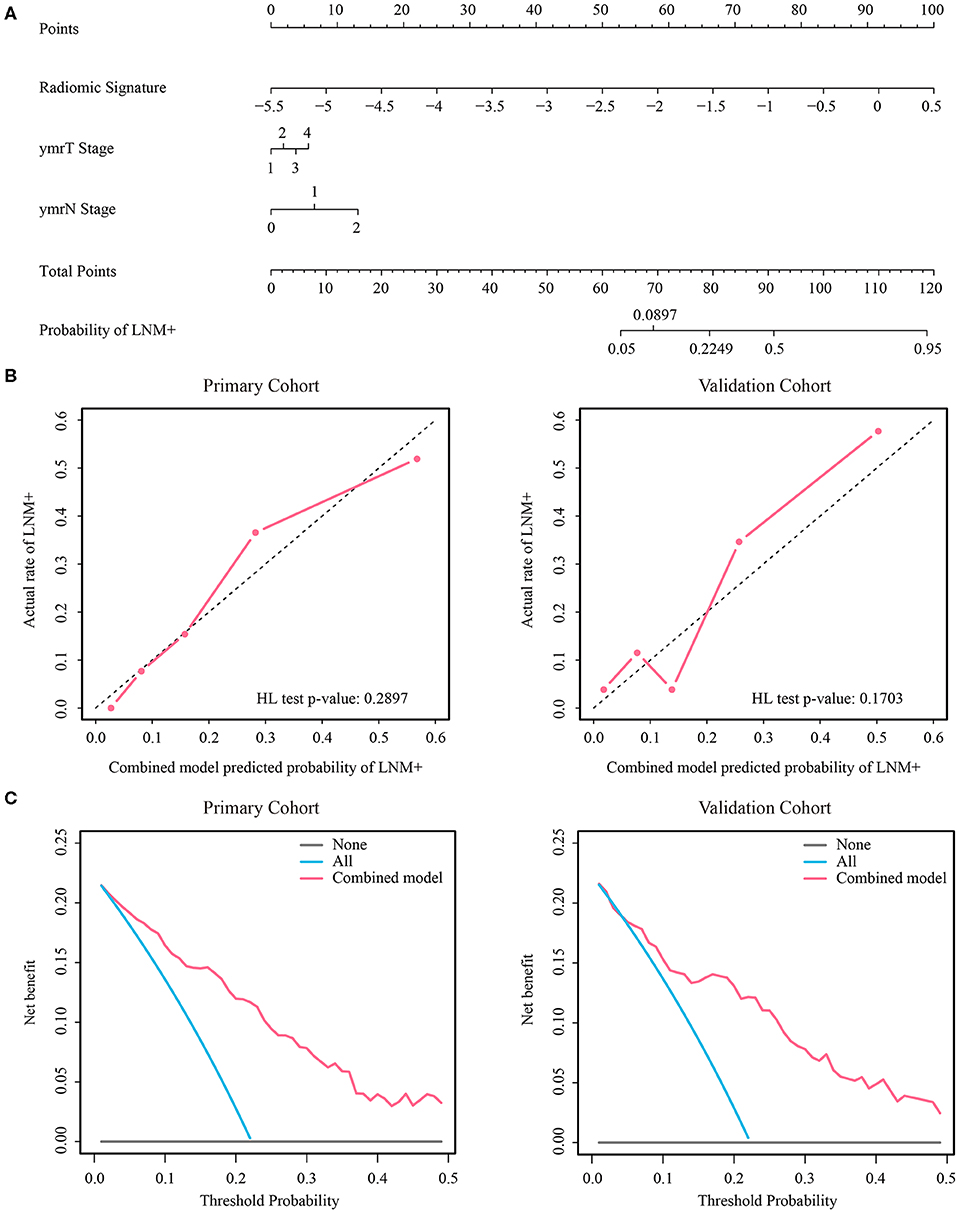
Figure 4. (A) Nomogram of the combined model. (B) Calibration curves of the combined model in both cohorts. (C) Decision curve analysis of the combined model in both cohorts. LNM+, lymph node metastasis; HL, Hosmer-Lemeshow.
The stratified analyses indicated that radiologist #2 yielded a better prediction in the ymrT1-2 subgroup than that in the ymrT3-4 subgroup with NPV of 90.7 vs. 80%. The combined model also performed better in the ymrT1-2 subgroup of the validation cohort with an AUC of 0.915 and a NPV of 100%. In the ymrT3-4 subgroup of the validation cohort, the combined model yielded an AUC of 0.764 and a NPV of 87.8% according to the Youden cutoff. Detailed results are shown in Figures 5, 6 and in Supplementary Tables A6, A7. For comparison, the combined model based on radiomic signature and restaging results from radiologist #1 yielded a NPV of 100 and 86.7% in ymrT1–2 subgroup and ymrT3-4 subgroup, respectively (Supplementary Table A8).
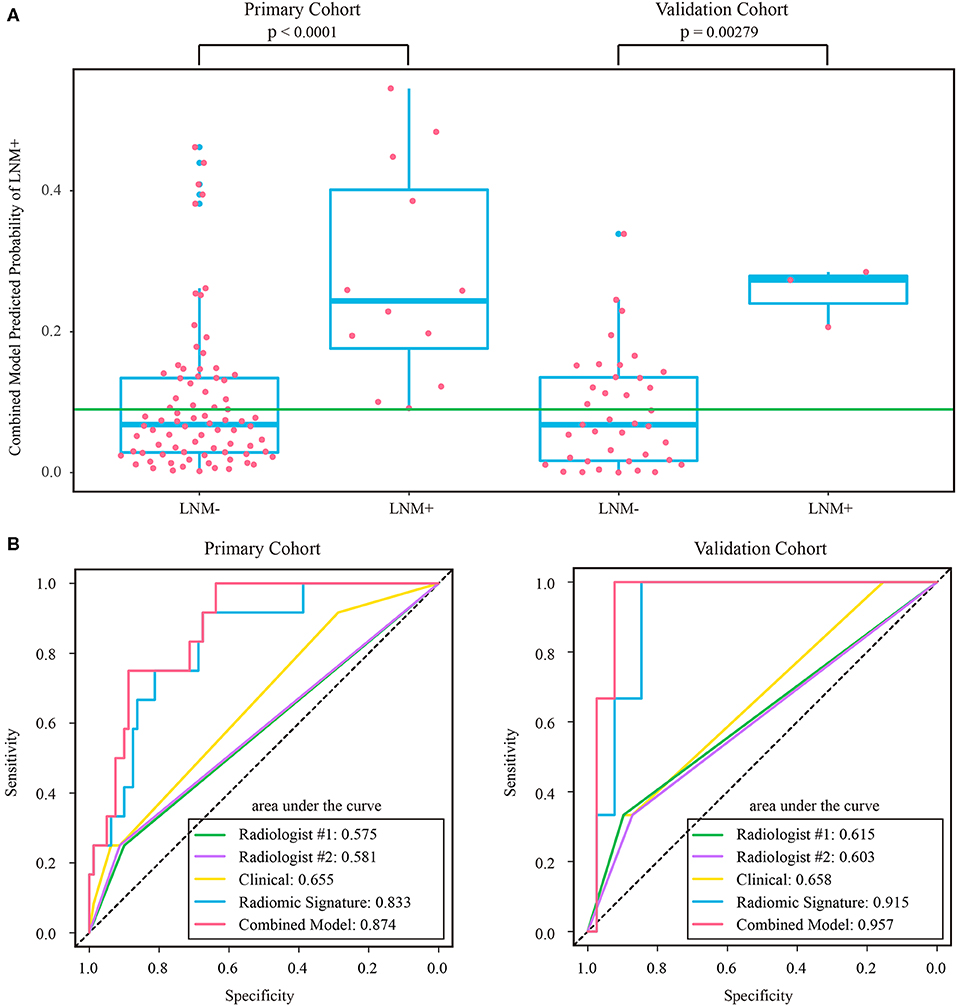
Figure 5. (A) Distribution of combined model predicted probability of LNM+ in post-therapeutic ymrT1-2 subgroups of both cohorts, where the green line indicates the Youden cutoff in the primary cohort. (B) ROC curves of radiologists' and prediction models in post-therapeutic ymrT1-2 subgroups of both cohorts. LNM+, lymph node metastasis; LNM-, lymph node non-metastasis; ROC, receiver operating characteristic.
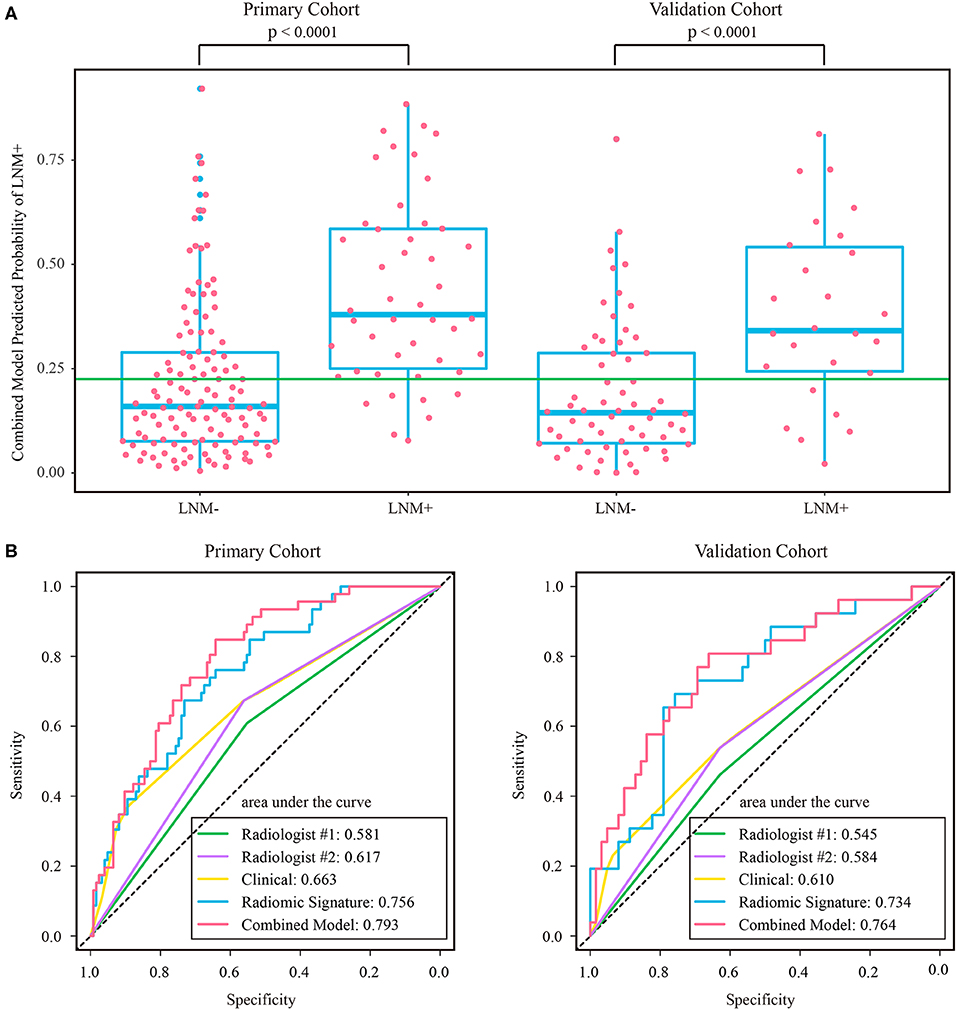
Figure 6. (A) Distribution of combined model predicted probability of LNM+ in post-therapeutic ymrT3-4 subgroups of both cohorts, where the green line indicates the Youden cutoff in the primary cohort. (B) ROC curves of radiologists and prediction models in post-therapeutic ymrT3-4 subgroups of both cohorts. LNM+, lymph node metastasis; LNM–, lymph node non-metastasis; ROC, receiver operating characteristic.
Discussion
In this study, a major finding was that radiomics is a promising approach for the preoperative prediction of LNM+ following neoadjuvant therapy in patients with LARC. Radiomic signature was a powerful predictor independent of the radiologists' diagnostic results, offering a NPV of 92.2% in the validation cohort. Combining radiomic signature with the radiologists' diagnostic results improved the NPV to 93.7%. In the post-therapeutic ymrT1-2 subgroup, the combined model yielded a NPV of 100% and specificity of 59%. However, in the post-therapeutic ymrT3-4 subgroup, the combined model did not achieve 100% NPV.
A major factor limiting the clinical application of organ preservation strategies is that the precise assessment of lymph node status is challenging (14, 40) since the completeness of tumor resection can be determined by pathological examination, but residual LNM+ has a high risk of leading to an adverse prognosis. Although the size and the morphological features (i.e., round shape, irregular border, and heterogeneous texture) have been proposed to define a clinically positive lymph node on MRI, the correspondence between post-therapeutic cN+ and pN+ is still poor. Recently, a large retrospective study from the Netherlands revealed that using post-therapeutic cN+ to predict pN+ yielded a sensitivity of 56%, specificity of 67%, PPV of 47%, and NPV of 75% for rectal cancer patients who received a short course of radiotherapy with short interval to surgery between 2011 and 2014 (41). Our study obtained similar results, whereby the more experienced radiologist's visual assessments could only accurately detect a small proportion of LNM+ with a sensitivity of 56.3%, specificity of 70.7%, PPV of 35.5%, and NPV of 84.9%.
Although receiver operating characteristic analysis indicated that the radiomic signature had superior predictive ability to that of the more experienced radiologist, the radiologist's assessment results should not be overlooked. Compared with the radiomic signature, the radiologist exhibited a lower sensitivity and a higher specificity. In the univariate logistic regression analysis, ymrT and ymrN stages were significantly associated with LNM+. In particular, ymrN stage was still an independent predictor for LNM+ even when considering radiomic signature and ymrT stage as covariates. Thus, based on the advantages of radiomic signature and the radiologist's restaging results, the combined model was able to achieve a higher prediction accuracy.
The results of the stratified analyses highlight the potential of the combined model for clinical application. For patients with post-therapeutic ymrT1-2 tumors following neoadjuvant therapy, the combined model achieved a NPV of 100% and corresponding specificity of 63.8 and 59% in the primary cohort and validation cohort, respectively. This result indicates that approximately 60% of ymrT1-2 patients with LNM- would benefit from the model's prediction results. In practice, choosing less invasive treatment after neoadjuvant therapy for rectal cancer is a difficult and complex decision for both the doctor and the patient. Local excision or wait-and-watch is typically only considered for ypT0-2, lymph node-negative patients. However, we cannot obtain the ypT stage and lymph node status other than by pathologic evaluation after TME. This contradiction spurs us on to achieve a more precise clinical T/N staging. We believe that our combined model can serve as an important assistive tool for assessing the likelihood of node status following neoadjuvant therapy. Further research aiming at the simultaneous precise prediction of ypT stage and ypN before TME is indispensable to promote organ preservation strategies in the clinic.
Radiomics is a data-driven approach which has been successfully used to assess treatment response after neoadjuvant therapy (30) and to predict pathological features such as degree of differentiation, T stage, and N stage (31). It is an advanced framework which selects the most useful features from a high-throughput feature set to build a signature correlated to an object in a linear or a non-linear way. To the best of our knowledge, our study may be one of the first attempts to cope with this clinical problem by using radiomics. The selected radiomic features included understandable first-order statistics features such as LoG3-FOS_Mean, LoG2-FOS_Skewness, and so on, which reflect the strength information of tumor. The selected features also included textural features such as LoG3-GLCM_cshade, LoG2-GLSZM_LZLGE, and so on, which reflect a high-order statistical property among image elements and usually cannot be visually examined, but we believe that these features can be associated with an underlying pathology. Some published studies have mapped radiomic features to gene mutation (42, 43) and molecular pathway activation (44–46) by a radiogenomic method (47, 48). In the future, interpreting these selected features by specific genetic profiles may help to improve decision making in node restaging.
Several limitations existed in this study. It was a retrospective study with single-center samples in China. The chemoradiotherapy regimens usually are not the same in different hospitals, which may cause different lymph node responses. The imaging equipment parameters are usually different in multicenter research, which makes the reliability of the extracted features challenged. In order to control for confounders as much as possible, we conducted our study in a single hospital. Another limitation is that the enrolled sample size was relatively small, especially for the post-therapeutic ymrT1-2 subgroup. Thus, a prospective, international, multicenter clinical trial with a large sample size is needed to confirm our findings. In addition, only two radiologists were involved in the diagnosis in our study, and the more experienced radiologist provided a more accurate diagnosis. Thus, future research should include more experienced radiologists. Perirectal environment is another area that is worth to analyze, but blood vessels, muscles, nerves, and posttreatment edema may exist in this area. These confounding factors may affect the extracted features, causing negative effects to the accuracy of the prediction results. Although manually excluding these confounding factors on MRI is very time-consuming, it is worth trying to analyze the perirectal environment in a further study to get better prediction accuracy. Deep learning is an emerging field that surpasses radiomics in many tasks. Modeling with deep learning to correctly identify more LNM- patients may be a promising direction.
In summary, we demonstrated that combining a radiologist's staging results and radiomics analysis assists in the prediction of lymph node status in patients with LARC following neoadjuvant therapy, especially for patients with post-therapeutic ymrT1-2 tumors. An external validation of this study is warranted to guide the treatment recommendations for patients eligible for organ preservation strategies.
Data Availability Statement
The datasets for this article are not publicly available as it is private data that belongs to the Sixth Affiliated Hospital of Sun Yat-sen University. Requests to access the datasets should be directed to corresponding author.
Ethics Statement
The studies involving human participants were reviewed and approved by institutional review board of Sixth Affiliated Hospital of Sun Yat-sen University. The ethics committee waived the requirement of written informed consent for participation.
Author Contributions
JT, YF, and WC conceptualized and designed the study. Data were acquired by WC, YY, ZZ, and YF. XZ, YY, WC, BL, LL, KS, and LH analyze and interpreted the data. XZ, YY, ZL, and ZZ drafted the manuscript. JT, YF, and WC critically revised the paper.
Funding
This work was supported by the National Natural Science Foundation of China (grant numbers 81922040, 81772012, 81227901, and 81527805), the Beijing Natural Science Foundation (grant number 7182109), the National Key Research and Development Plan of China (grant numbers 2016YFA0100900, 2016YFA0100902, and 2017YFA0205200), the Youth Innovation Promotion Association CAS (grant number 2019136), the Chinese Academy of Sciences (grant numbers GJJSTD20170004, KFJ-STS-ZDTP-059, and YJKYYQ20180048), the Strategic Priority Research Program from CAS (grant number XDBS01030200), and the Key Research Projects in Frontier Science of CAS (grant number QYZDJ-SSW-JSC005).
Conflict of Interest
The authors declare that the research was conducted in the absence of any commercial or financial relationships that could be construed as a potential conflict of interest.
Supplementary Material
The Supplementary Material for this article can be found online at: https://www.frontiersin.org/articles/10.3389/fonc.2020.00604/full#supplementary-material
Abbreviations
ADC, apparent diffusion coefficient; AUC, area under curve; CI, confidence interval; LARC, locally advanced rectal cancer; LNM+, lymph node metastasis; LNM-, lymph node non-metastasis; LoG, Laplacian of Gaussian; MRI, magnetic resonance imaging; NPV, negative predictive value; PPV, positive predictive value; ROC, receiver operating characteristic; TME, total mesorectal excision
References
1. Benson AB III, Venook AP, Al-Hawary MM, Cederquist L, Chen YJ, Ciombor KK, et al. Rectal cancer, Version 2.2018, NCCN Clinical Practice Guidelines in Oncology. J Natl Compr Cancer Netw. (2018) 16:874–901. doi: 10.6004/jnccn.2018.0061
2. Collette L, Bosset JF, den Dulk M, Nguyen F, Mineur L, Maingon P, et al. Patients with curative resection of cT3-4 rectal cancer after preoperative radiotherapy or radiochemotherapy: does anybody benefit from adjuvant fluorouracil-based chemotherapy? A trial of the European Organisation for Research and Treatment of Cancer Radiation Oncology Group. J Clin Oncol. (2007) 25:4379–86. doi: 10.1200/jco.2007.11.9685
3. Park IJ, You YN, Agarwal A, Skibber JM, Rodriguez-Bigas MA, Eng C, et al. Neoadjuvant treatment response as an early response indicator for patients with rectal cancer. J Clin Oncol. (2012) 30:1770–6. doi: 10.1200/jco.2011.39.7901
4. Marijnen CA, van de Velde CJ, Putter H, van den Brink M, Maas CP, Martijn H, et al. Impact of short-term preoperative radiotherapy on health-related quality of life and sexual functioning in primary rectal cancer: report of a multicenter randomized trial. J Clin Oncol. (2005) 23:1847–58. doi: 10.1200/jco.2005.05.256
5. Peeters KC, van de Velde CJ, Leer JW, Martijn H, Junggeburt JM, Kranenbarg EK, et al. Late side effects of short-course preoperative radiotherapy combined with total mesorectal excision for rectal cancer: increased bowel dysfunction in irradiated patients–a Dutch colorectal cancer group study. J Clin Oncol. (2005) 23:6199–206. doi: 10.1200/jco.2005.14.779
6. Pahlman L, Bohe M, Cedermark B, Dahlberg M, Lindmark G, Sjodahl R, et al. The Swedish rectal cancer registry. Br J Surg. (2007) 94:1285–92. doi: 10.1002/bjs.5679
7. Baxter NN, Garcia-Aguilar J. Organ preservation for rectal cancer. J Clin Oncol. (2007) 25:1014–20. doi: 10.1200/jco.2006.09.7840
8. Kim CJ, Yeatman TJ, Coppola D, Trotti A, Williams B, Barthel JS, et al. Local excision of T2 and T3 rectal cancers after downstaging chemoradiation. Ann Surg. (2001) 234:352–8; discussion 358–9. doi: 10.1097/00000658-200109000-00009
9. Schell SR, Zlotecki RA, Mendenhall WM, Marsh RW, Vauthey JN, Copeland EM. III. Transanal excision of locally advanced rectal cancers downstaged using neoadjuvant chemoradiotherapy. J Am Coll Surg. (2002) 194:584–90; discussion 590–1. doi: 10.1016/s1072-7515(02)01128-6
10. Callender GG, Das P, Rodriguez-Bigas MA, Skibber JM, Crane CH, Krishnan S, et al. Local excision after preoperative chemoradiation results in an equivalent outcome to total mesorectal excision in selected patients with T3 rectal cancer. Ann Surg Oncol. (2010) 17:441–7. doi: 10.1245/s10434-009-0735-7
11. Lezoche E, Baldarelli M, Lezoche G, Paganini AM, Gesuita R, Guerrieri M. Randomized clinical trial of endoluminal locoregional resection versus laparoscopic total mesorectal excision for T2 rectal cancer after neoadjuvant therapy. Br J Surg. (2012) 99:1211–8. doi: 10.1002/bjs.8821
12. Pucciarelli S, De Paoli A, Guerrieri M, La Torre G, Maretto I, De Marchi F, et al. Local excision after preoperative chemoradiotherapy for rectal cancer: results of a multicenter phase II clinical trial. Dis Colon Rectum. (2013) 56:1349–56. doi: 10.1097/DCR.0b013e3182a2303e
13. De Nardi P, Carvello M. How reliable is current imaging in restaging rectal cancer after neoadjuvant therapy? World J Gastroenterol. (2013) 19:5964–72. doi: 10.3748/wjg.v19.i36.5964
14. van der Paardt MP, Zagers MB, Beets-Tan RG, Stoker J, Bipat S. Patients who undergo preoperative chemoradiotherapy for locally advanced rectal cancer restaged by using diagnostic MR imaging: a systematic review and meta-analysis. Radiology. (2013) 269:101–12. doi: 10.1148/radiol.13122833
15. Newton AD, Li J, Jeganathan AN, Mahmoud NN, Epstein AJ, Paulson EC. A nomogram to predict lymph node positivity following neoadjuvant chemoradiation in locally advanced rectal Cancer. Dis Colon Rectum. (2016) 59:710–7. doi: 10.1097/DCR.0000000000000638
16. Azizian A, Kramer F, Jo P, Wolff HA, Beissbarth T, Skarupke R, et al. Preoperative prediction of lymph node status by circulating Mir-18b and Mir-20a during chemoradiotherapy in patients with rectal cancer. World J Surg. (2015) 39:2329–35. doi: 10.1007/s00268-015-3083-8
17. Dumont F, Dartigues P, Delga B, Thibaudeau E, Benhaim L, Campion L, et al. Model predicting the ypN0 status after good response to chemoradiotherapy in rectal cancer. Am J Surg. (2018) 216:438–43. doi: 10.1016/j.amjsurg.2018.03.025
18. Lambin P, Rios-Velazquez E, Leijenaar R, Carvalho S, van Stiphout RG, Granton P, et al. Radiomics: extracting more information from medical images using advanced feature analysis. Eur J Cancer. (2012) 48:441–6. doi: 10.1016/j.ejca.2011.11.036
19. Liu Z, Wang S, Dong D, Wei J, Fang C, Zhou X, et al. The applications of radiomics in precision diagnosis and treatment of oncology: opportunities and challenges. Theranostics. (2019) 9:1303–22. doi: 10.7150/thno.30309
20. Liu Z, Zhang XY, Shi YJ, Wang L, Zhu HT, Tang Z, et al. Radiomics analysis for evaluation of pathological complete response to neoadjuvant chemoradiotherapy in locally advanced rectal cancer. Clin Cancer Res. (2017) 23:7253–62. doi: 10.1158/1078-0432.Ccr-17-1038
21. Liu Z, Li Z, Qu J, Zhang R, Zhou X, Li L, et al. Radiomics of multi-parametric MRI for pretreatment prediction of pathological complete response to neoadjuvant chemotherapy in breast cancer: a multicenter study. Clin Cancer Res. (2019) 25:3538–47. doi: 10.1158/1078-0432.Ccr-18-3190
22. Tang Z, Zhang XY, Liu Z, Li XT, Shi YJ, Wang S, et al. Quantitative analysis of diffusion weighted imaging to predict pathological good response to neoadjuvant chemoradiation for locally advanced rectal cancer. Radiother Oncol. (2019) 132:100–8. doi: 10.1016/j.radonc.2018.11.007
23. Zhou X, Yi Y, Liu Z, Cao W, Lai B, Sun K, et al. Radiomics-based pretherapeutic prediction of non-response to neoadjuvant therapy in locally advanced rectal cancer. Ann Surg Oncol. (2019) 26:1676–84. doi: 10.1245/s10434-019-07300-3
24. Huang Y, Liu Z, He L, Chen X, Pan D, Ma Z, et al. Radiomics signature: a potential biomarker for the prediction of disease-free survival in early-stage (I or II) non-small cell lung cancer. Radiology. (2016) 281:947–57. doi: 10.1148/radiol.2016152234
25. Zhang B, Tian J, Dong D, Gu D, Dong Y, Zhang L, et al. Radiomics features of multiparametric MRI as novel prognostic factors in advanced nasopharyngeal carcinoma. Clin Cancer Res. (2017) 23:4259–69. doi: 10.1158/1078-0432.Ccr-16-2910
26. Zheng J, Chakraborty J, Chapman WC, Gerst S, Gonen M, Pak LM, et al. Preoperative prediction of microvascular invasion in hepatocellular carcinoma using quantitative image analysis. J Am Coll Surg. (2017) 225, 778–88.e771. doi: 10.1016/j.jamcollsurg.2017.09.003
27. Liu Z, Wang Y, Liu X, Du Y, Tang Z, Wang K, et al. Radiomics analysis allows for precise prediction of epilepsy in patients with low-grade gliomas. Neuroimage Clin. (2018) 19:271–8. doi: 10.1016/j.nicl.2018.04.024
28. Huang YQ, Liang CH, He L, Tian J, Liang CS, Chen X, et al. Development and validation of a radiomics nomogram for preoperative prediction of lymph node metastasis in colorectal cancer. J Clin Oncol. (2016) 34:2157–64. doi: 10.1200/jco.2015.65.9128
29. Meng X, Xia W, Xie P, Zhang R, Li W, Wang M, et al. Preoperative radiomic signature based on multiparametric magnetic resonance imaging for noninvasive evaluation of biological characteristics in rectal cancer. Eur Radiol. (2018) 29:3200–9. doi: 10.1007/s00330-018-5763-x
30. Horvat N, Veeraraghavan H, Khan M, Blazic I, Zheng J, Capanu M, et al. MR imaging of rectal cancer: radiomics analysis to assess treatment response after neoadjuvant therapy. Radiology. (2018) 287:833–43. doi: 10.1148/radiol.2018172300
31. Ma X, Shen F, Jia Y, Xia Y, Li Q, Lu J. MRI-based radiomics of rectal cancer: preoperative assessment of the pathological features. BMC Med Imaging. (2019) 19:86. doi: 10.1186/s12880-019-0392-7
32. Tibshirani RJ. Regression shrinkage and selection via the lasso. J R Stat Soc Ser B. (1996) 58:267–88.
33. Park SH, Lim JS, Lee J, Kim HY, Koom WS, Hur H, et al. Rectal mucinous adenocarcinoma: MR imaging assessment of response to concurrent chemotherapy and radiation therapy-A hypothesis-generating study. Radiology. (2017) 285:124–33. doi: 10.1148/radiol.2017162657
34. Mc NQ. Note on the sampling error of the difference between correlated proportions or percentages. Psychometrika. (1947) 12:153–7. doi: 10.1007/bf02295996
35. Pencina MJ, D'Agostino RB Sr, D'Agostino RB Jr, Vasan RS. Evaluating the added predictive ability of a new marker: from area under the ROC curve to reclassification and beyond. Stat Med. (2008) 27:157–72; discussion 207–112. doi: 10.1002/sim.2929
36. Kramer AA, Zimmerman JE. Assessing the calibration of mortality benchmarks in critical care: the Hosmer-Lemeshow test revisited. Crit Care Med. (2007) 35:2052–6. doi: 10.1097/01.Ccm.0000275267.64078.B0
37. Gerard JP, Chamorey E, Gourgou-Bourgade S, Benezery K, de Laroche G, Mahe MA, et al. Clinical complete response (cCR) after neoadjuvant chemoradiotherapy and conservative treatment in rectal cancer. Findings from the ACCORD 12/PRODIGE 2 randomized trial. Radiother Oncol. (2015) 115:246–52. doi: 10.1016/j.radonc.2015.04.003
39. Deng Y, Chi P, Lan P, Wang L, Chen W, Cui L, et al. Modified FOLFOX6 with or without radiation versus fluorouracil and leucovorin with radiation in neoadjuvant treatment of locally advanced rectal cancer: initial results of the Chinese FOWARC multicenter, open-label, randomized three-arm phase III trial. J Clin Oncol. (2016) 34:3300–7. doi: 10.1200/jco.2016.66.6198
40. Lahaye MJ, Beets GL, Engelen SM, Kessels AG, de Bruine AP, Kwee HW, et al. Locally advanced rectal cancer: MR imaging for restaging after neoadjuvant radiation therapy with concomitant chemotherapy. Part II What are the criteria to predict involved lymph nodes? Radiology. (2009) 252:81–91. doi: 10.1148/radiol.2521081364
41. Brouwer NPM, Stijns RCH, Lemmens V, Nagtegaal ID, Beets-Tan RGH, Futterer JJ, et al. Clinical lymph node staging in colorectal cancer; a flip of the coin? Eur J Surg Oncol. (2018) 44:1241–6. doi: 10.1016/j.ejso.2018.04.008
42. Chen SW, Chiang HC, Chen WT, Hsieh TC, Yen KY, Chiang SF, et al. Correlation between PET/CT parameters and KRAS expression in colorectal cancer. Clin Nucl Med. (2014) 39:685–9. doi: 10.1097/rlu.0000000000000481
43. Cui Y, Liu H, Ren J, Du X, Xin L, Li D, et al. Development and validation of a MRI-based radiomics signature for prediction of KRAS mutation in rectal cancer. Eur Radiol. (2020) 30:1948–58. doi: 10.1007/s00330-019-06572-3
44. Grossmann P, Stringfield O, El-Hachem N, Bui MM, Rios Velazquez E, Parmar C, et al. (2017). Defining the biological basis of radiomic phenotypes in lung cancer. Elife. 6: e23421. doi: 10.7554/eLife.23421
45. Wu J, Li B, Sun X, Cao G, Rubin DL, Napel S, et al. Heterogeneous enhancement patterns of tumor-adjacent parenchyma at MR imaging are associated with dysregulated signaling pathways and poor survival in breast cancer. Radiology. (2017) 285:401–13. doi: 10.1148/radiol.2017162823
46. Badic B, Hatt M. Radiogenomics-based cancer prognosis in colorectal cancer. Sci Rep. (2019) 9:9743. doi: 10.1038/s41598-019-46286-6
47. Pinker K, Shitano F, Sala E, Do RK, Young RJ, Wibmer AG, et al. Background, current role, and potential applications of radiogenomics. J Magn Reson Imaging. (2018) 47:604–20. doi: 10.1002/jmri.25870
Keywords: lymph node metastasis, prediction, neoadjuvant therapy, locally advanced rectal cancer, radiomics
Citation: Zhou X, Yi Y, Liu Z, Zhou Z, Lai B, Sun K, Li L, Huang L, Feng Y, Cao W and Tian J (2020) Radiomics-Based Preoperative Prediction of Lymph Node Status Following Neoadjuvant Therapy in Locally Advanced Rectal Cancer. Front. Oncol. 10:604. doi: 10.3389/fonc.2020.00604
Received: 28 October 2019; Accepted: 02 April 2020;
Published: 11 May 2020.
Edited by:
Xuelei Ma, Sichuan University, ChinaReviewed by:
Satish E. Viswanath, Case Western Reserve University, United StatesTakashi Akiyoshi, Cancer Institute Hospital of Japanese Foundation for Cancer Research, Japan
Copyright © 2020 Zhou, Yi, Liu, Zhou, Lai, Sun, Li, Huang, Feng, Cao and Tian. This is an open-access article distributed under the terms of the Creative Commons Attribution License (CC BY). The use, distribution or reproduction in other forums is permitted, provided the original author(s) and the copyright owner(s) are credited and that the original publication in this journal is cited, in accordance with accepted academic practice. No use, distribution or reproduction is permitted which does not comply with these terms.
*Correspondence: Yanqiu Feng, Zm9yZWVAMTYzLmNvbQ==; Wuteng Cao, Y2Fvd3RlbmdAMTYzLmNvbQ==; Jie Tian, amllLnRpYW5AaWEuYWMuY24=
†These authors have contributed equally to this work and share first authorship