 Chunyu Wang
 Ning Zhao
 Kai Sun3*
- 1School of Computer Science and Technology, Harbin Institute of Technology, Harbin, China
- 2School of Life Science and Technology, Harbin Institute of Technology, Harbin, China
- 3Thoracic Surgery Department, General Hospital of Heilongjiang Province Land Reclamation Bureau, Harbin, China
- 4Department of Pharmacy, General Hospital of Heilongjiang Province Land Reclamation Bureau, Harbin, China
The initiation, promotion and progression of cancer are highly associated to the environment a human lives in as well as individual genetic factors. In view of the dangers to life and health caused by this abnormally complex systemic disease, many top scientific research institutions around the world have been actively carrying out research in order to discover the pathogenic mechanisms driving cancer occurrence and development. The emergence of high-throughput sequencing technology has greatly advanced oncology research and given rise to the revelation of important oncogenes and the interrelationship among them. Here, we have studied heterogeneous multi-level data within a context of integrated data, and scientifically introduced lncRNA omics data to construct multi-omics bio-network models, allowing the screening of key cancer-related gene groups. We propose a compactness clustering algorithm based on corrected cumulative rank scores, which uses the functional similarity between groups of genes as a distance measure to excavate key gene modules for abnormal regulation contained in gene groups through clustering. We also conducted a survival analysis using our results and found that our model could divide groups of different levels very well. The results also demonstrate that the integration of multi-omics biological data, key gene modules and their dysregulated gene groups can be discovered, which is crucial for cancer research.
Introduction
Studies in systems biology have revealed that cell functions in biological systems generally involve the interaction of multiple genes (1). In this era of functional genomics, many gene groups have been pinpointed using different high-throughput technologies, such as micro-matrix technology, mass spectrometry analysis technology, and next-generation sequencing technology (2–5). These gene groups are often associated with many similar diseases, and are usually used as novel protein complex, differentially expressed genes or co-expressed gene module, and sometimes in effector signaling pathway in further downstream research (6). It is important, however, to compare gene groups and interpret the correlation between them as potential biological mechanisms that are easy to understand.
In recent years, an emerging number of new computing techniques and utilities have been developed to explore such gene groups. Most of them for analyzing gene functions are enrichment analysis tools. An important part of these bioinformatics enrichment analysis software adopts Gene Ontology (GO) (7), which only allows simple single group analysis and identifies GO terms overrepresented within the group. For example, the tools GOstat (8), GO::TermFinder (9), and GOEAST (10) are often used for GO analysis. To implement a single gene group functional analysis, some of them integrate diversify integrated heterogeneous data, such as Gazer (11), GeneTrail (12), DAVID (13), and GSEA (14). However, even in complete biological pathways, there are no genes that act alone (15). Gene groups collaborate with other ones through sophisticated technique, and these interrelations can affect related disease and phenotype. Therefore, the prevailing challenge binding biologists is to obtain easy-to-understand functional links between different gene groups in the background of this complexity. At present, some calculation tools based on GOs have been developed for comparing gene group relationships, such as FatiGO (16) and ProfCom (17). Some semantic similarity methods based on GO can also compare between gene groups by the mean of the pairwise distances of different elements (18). Essentially, GO acts as only language annotations, and it is still challenging to make GO gene annotations accurately indicate the substantial intricacy of biological functions and relations (19). Others directly compare literature keywords to reflect the links between groups (20). Some calculation tools using these keywords are based on the same idea, and use GO terms or literature citations to map biological knowledge to gene groups, and then find significantly overrepresented GO terms or keywords. This methodology, however, cannot provide a functional similarity measurement between gene groups.
Protein-Protein Interaction Networks (PPINs) can reveal the functional interaction in proteins (21–36). The closeness of proteins within a network is a sign of the similarity of their functions. It also suggests that the diseases caused by the genes represented by these proteins are the same. In terms of predicting carcinogenic gene patterns, some methods use PPINs and disease phenotype similarity data to calculate and rank genes to screen for carcinogenic genes. Oti et al. (37) predicted carcinogenic genes by integrating PPINs and genetic loci. Their work illustrates the importance of PPINs for predicting carcinogenic genes. The drawback of this method is that there is often noise in a PPIN, and the source of some disease sites is not accurate, meaning the derivation process is not perfect. Lage et al. (38) proposed a novel method for calculating the association score between genes and cancer, which was based on the information that candidate carcinogenic genes within one step of a PPIN act on the same or similar diseases, allowing them to calculate the association score, and further mine candidate carcinogenic genes and cancer-associated protein complexes. Goldenberg et al. (39) used high differential expression changes in normal and abnormal cancer data to establish a regression model and identify a set of genes with consistent expression changes of neighboring genes in their network. It was proposed that this set of genes causes changes in the expression of neighboring genes.
In terms of cancer-related disorder modules and pathways, these modules and pathways are often based on a PPIN, studied by collecting differentially expressed genes in normal samples and tumor samples and using them as candidate genes, and then mining the disorder modules through different analysis methods. Chowdhury et al. (40) considered the mutual information between the dominantness of samples and the dominantness of samples with known gene expression, used information theory to establish a subnet state function to find subnetworks with coexpression disorders, and used neural network models as classification detection model in this method. Vandin et al. (41) provided a method (Dendrix) for discovering mutation-driven pathways in somatic mutation data, which was different from the discovery of genes with effective frequency mutations in cancer genomes (42–49), that is, those driver mutations that targeted multiple cell signals and regulatory pathways. Backes et al. (50) proposed a method to identify abnormal regulatory modules and related important genes. This method focused on abnormal regulation subgraphs, and its detection method was based on a new pruning strategy. This method was not only applicable to directed networks, but also applicable to undirected networks. Proteins rarely act alone usually; instead they form networks of complex interactions among different molecules. Biological cell functions are commonly accomplished in a hierarchical manner (51). Related researches have exposed that PPINs can reflect the protein functional interactions. The distance between proteins is highly correlated to their function similarity within a network (52–57).
Given these challenges, we analyzed the integration mode of data at different levels, and through experimental analysis and verification, we scientifically introduced lncRNA expression profiling data to further expanded the breadth of multi-omics data integration methods. We then mined carcinogenic gene modules composed of candidate genes, and through a corrected cumulative rank score method, we were better able to understand the interaction level of gene groups in a PPIN and calculated the functional similarity score between gene groups. We used the corrected cumulative rank score as distance measure for a compactness clustering method, and mined the gene modules hidden in the key genes of this abnormal regulation gene group. The specific process description of this method is shown in Figure 1.
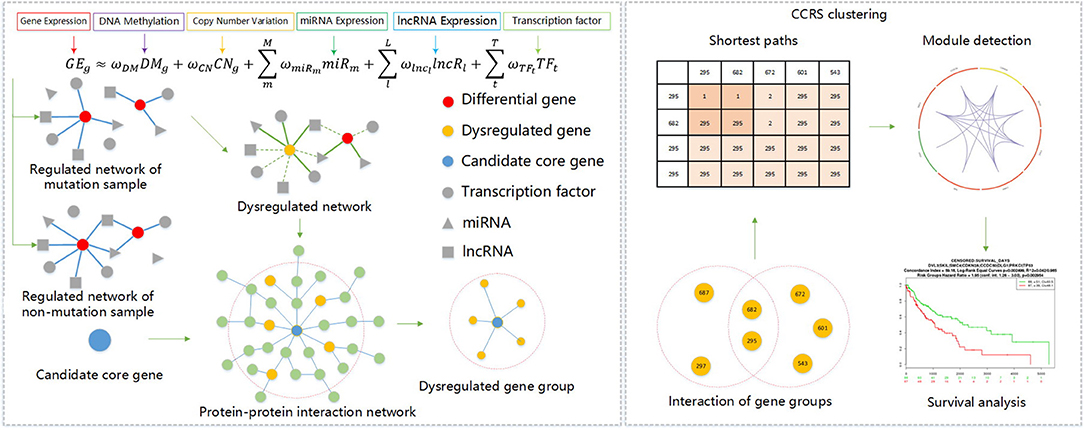
Figure 1. Framework of core module mining method.
Methods
Multi-Omics Data
We downloaded Lung squamous cell carcinoma (LUSC) multi-omics data from TCGA database, including DNA methylation, copy number variation (CNV), miRNA and gene expression data. We directly derived somatic variation data using 338 samples from the TCGA database. By filtering silent mutations, a set of 5,982 mutant genes was obtained. The CNV data was processed using GISTIC software (58) and CNV matrix data for 337 samples was obtained. We downloaded the DNA methylation data of 367 samples tested using the JHU-USC HumanMethylation450 platform, and obtained the expression data of a total of 20,503 genes from 337 samples, the expression data of 1,043 miRNAs from 387 samples, and downloaded the expression data of 12,728 lncRNAs from 220 samples from the TANRIC database (59). Finally, 66 LUSC samples with all multi-omics data were identified and used for study.
miRNA-target data was obtained from StarBase. To reduce false positives, the following screening criteria were selected: (1) at least one CLIP-Seq test supported the miRNA target site; (2) miRNA and target gene expression were negatively correlated in at least three cancers (Pearson correlation: γ < 0, p < 0.05); (3) the target relationship was predicted using at least one of different five prediction software platforms (TargetScan, PicTar, PITA, miRanda/mirSVR, and RNA22). We obtained experimentally verified the regulatory relationships of transcription factor (TF) genes in TRANSFAC database (60) and used conservative TF binding sites in the UCSC genome browser. Finally, from BioGRID, BIND, HPRD, IntAct, MINT, MIPS, PDZBase, DIP, and Reactome databases, we collected human protein-protein interaction data. We also remove all redundant data which have not been experimentally verified or predicted in related literatures.
The relationship between lncRNA and gene function was obtained as follows. We know that each miRNA has a regulatory relationship with genes, and miRNAs also have a regulatory relationship with lncRNAs. Thus, we assumed that genes and lncRNAs regulated by identical miRNAs were also interactive. For genes and lncRNA regulated by the same miRNA, we calculated the Pearson correlation (γ < 0, p < 0.05) of the gene expressions from our 66 samples to obtain the links between lncRNAs and genes. Multi-omics biological data is shown in Table 1. The data on the regulatory relationship of regulatory factors to these genes are listed in Table 2, including numbers of regulatory factors and genes.
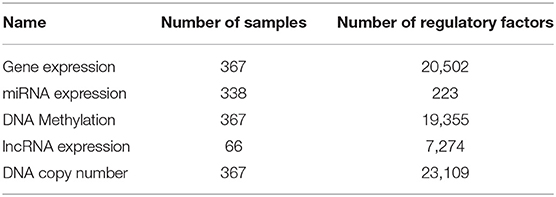
Table 1. Multi-omics biological data.
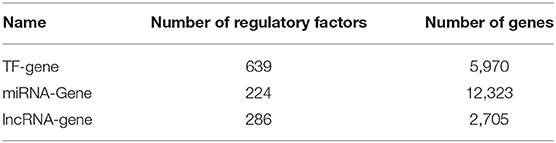
Table 2. Regulatory relationship data.
Abnormal Regulatory Gene Group
First, we selected genes from DNA mutation data to obtain all the genes that produced mutations, constructed a gene mutation spectrum, and then used GISTIC software to process the DNA CNV data to determine the discretization value of CNV for each gene in all cancer samples (−2, −1, 0, 1, 2) to obtain the DNA CNV spectrum.
With the gene mutation spectrum and CNV spectrum data collectively, a binary gene variation matrix M was generated. The matrix rows corresponded to genes, and columns to samples. If the gene of the i-th row had both gene mutations and CNVs in the sample of the j-th column, mij was assigned value 1 though, otherwise assigned 0. The criteria for screening key candidate genes were: (1) the samples should produce more than ten percent of total mutations in the gene variation matrix; and, (2) the gene produced differential expression in the mutated and non-mutated samples. The second screening criterion required the integration of gene expression profiling data. A Student's T-test was performed between the mutated and non-mutated samples of the gene, and the standard was that the false discovery rate was <0.01. Through the above two criteria, we obtained mutation information for key candidate genes.
An abnormal regulatory network was constructed for every key candidate gene, and it was then necessary to distinguish between mutated samples and non-mutated samples for every abnormal regulatory network. The cancer samples were divided into mutated and non-mutated samples, and then a linear regression model was constructed to describe the variation in gene expression. The variables in the regression model included the DNA methylation, CNV, TFs that regulate the particular gene, miRNAs, and lncRNAs.
Under the specific conditions of including G samples, given a gene g, there were T TFs(TF1, TF2, …, TFT), M miRs(miRNA1, miRNA2, …, miRNAM) and L lncRs(lncRNA1, lncRNA2, …, lncRNAL) are bound with g. We can then train a linear regression model using the following formula:
where GEg is the expression level of g in G samples, CNg is the occurrence times of copy number of g, DMg keeps methylation value of g, TFt keeps expression level of the t-th TF that regulates g, miRm saves expression level of the m-th miRNA targeting g, and lncRl is the expression level of the t-th lncRNA that affects g. ωCN, ωDM, ωTFt, ωmiRm, ωlncl represents the regression coefficients of CNg, DMg, TFt, miRm, and lncRl, respectively. For the genes in the sample, only the differential expression in the tumor sample and normal sample (R SAM package fold-change [>2, < 1/2] FDR < 0.05) was used to train the linear model. We used a two-layer neural network to train each model and obtained the factor of a variable in each model. Only the TFs with a weight greater than a specific threshold were determined to construct our network.
By filtering the TFs of each differential list gene, we build a key candidate gene regulatory network among mutated and non-mutated samples. Further, by performing an XOR operation on these two networks, we obtained an irregular regulatory network of key candidate ones, which contained an abnormal regulatory gene group of key candidate genes. The XOR operation is defined as: edges in the network is related to a regulatory links; and links within only one network were retained.
In order to obtain the set of genes that were dysregulated by key candidate genes, we mapped genes in the irregular regulatory network and key candidate ones to a protein-protein interaction network, found genes of the irregular regulatory network of key candidate genes in a two-step wise of the PPIN, and used these genes as the abnormal regulatory gene group of key candidate genes. In this way, a total of 130 abnormal regulatory gene groups of key candidate ones were collected, of which 89 key candidate genes could be reached in our protein-protein interaction network. The corrected cumulative rank scores of the 89 key candidate genes were calculated in pairs, and a score matrix of the functional similarity of the gene groups was obtained.
Clustering Algorithm Based on Corrected Cumulative Rank Score
Clustering is often employed in various bioinformatics researches (61–68). The calculation process of the corrected cumulative rank score (CCRS) method (36) is shown in Figure 2. This method can measure the functional similarity between two gene groups by means of the functional relation and physical interaction between genes. This method defines the functional distance between two genes as the shortest path of two nodes in a PPIN. Then the distance of two genes reflects the similarity. Therefore, this method can be used to find the functional distance to score the functional similarity between two genes, and compare two gene groups by cumulatively scoring each pair of genes between the two gene groups. For any gene group, it must be completely consistent with its own functional similarity apparently. Therefore, when comparing two determined gene groups, there are two hypotheses: (1) any gene has a direct interaction to itself; (2) for two genes in the same gene group, if there is a path, the functional distance is independent of the path length. Based on the above two assumptions, when there is an intersection between two gene groups, the corrected cumulative rank score can thus be calculated.
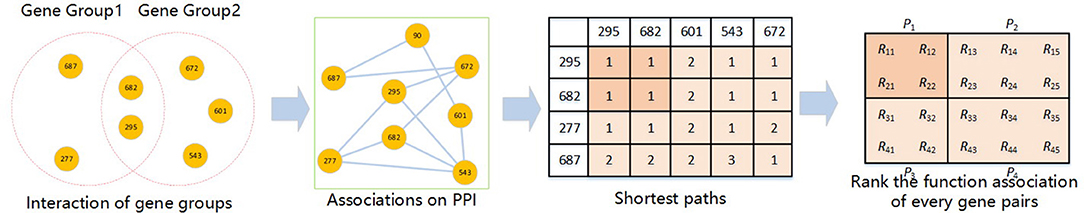
Figure 2. Corrected cumulative rank score calculation.
We assume that there are gene groups G1 and G2. The intersection of G1 and G2 is defined as G. For the genes p and q taken separately from G1 and G2, there are n paths based on m nodes in the PPIN intersection G, and the corrected cumulative rank score is shown in formula (2).
Rpq is the functional distance from the gene p to the gene q, i.e., the shortest path length. N is the number of functional distances that exist. And Rpq = 0 if there is no path between gene p and q.
We used the corrected cumulative rank score as distance measure of the clustering algorithm, and then used the compactness clustering algorithm to find key gene modules. The distance measurement of the clustering algorithm at this time was as follows.
Where Disij is the distance from the i-th key gene to the j-th one, and DSi and DSj, respectively, indicate the abnormal regulatory gene group affected by the i-th gene and the j-th gene. See Algorithm 1 for the clustering algorithm of key gene modules based on compactness.
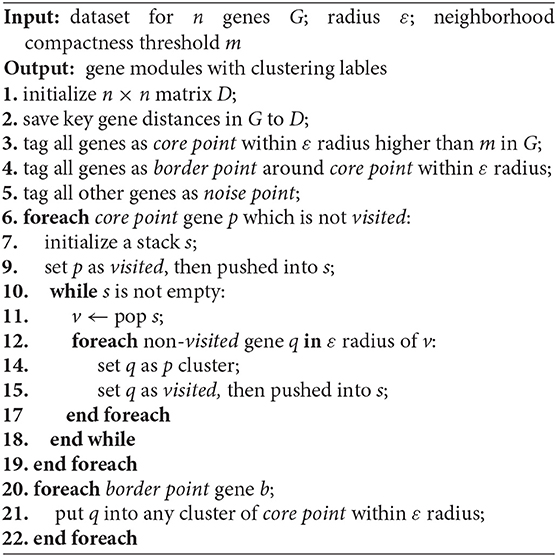
Algorithm 1. Compactness-based module clustering algorithm
This algorithm is a clustering algorithm for the connection area, it defined cluster as the largest set of the compactness of genes connected, which divide cluster with sufficiently high compactness region. The basic idea is to optionally choose a gene x, the number of genes within ε radius if x region contains greater than a threshold and create a new cluster. This algorithm finds key gene modules for the key genes proposed in this paper and the abnormal gene groups regulated by it. The two parameters of the scanning radius and the neighborhood compactness threshold in algorithm 1 is automatically determined by methods in (69).
Results
Key Gene Modules
In this paper, we mined key gene modules on an abnormal regulatory gene group of 89 key genes. In this way, we conclude three key gene modules with 19 genes, including CDKN2A, DLG1, DVL3, PRKCI, SKIL, TP53, SMC4, and CCDC50; DROSHA, AHSG, AP2M1, ECT2, and TNK; LRCH3, MLF1, TRA2B, PPFIA1, RAI14, and RSRC1. Among them, the 4 genes PPFIA1, DROSHA, CDKN2A, and TP53 were related to LUSC (downloaded from the LUSC gene list from Cosmic, OMIM, HuGE, and GAD). There were 12 genes related to LUSC in GeneCards, as shown in Table 3. The relationship between the genes in the key gene module and the chromosomes they belong to are shown in Figure 3.
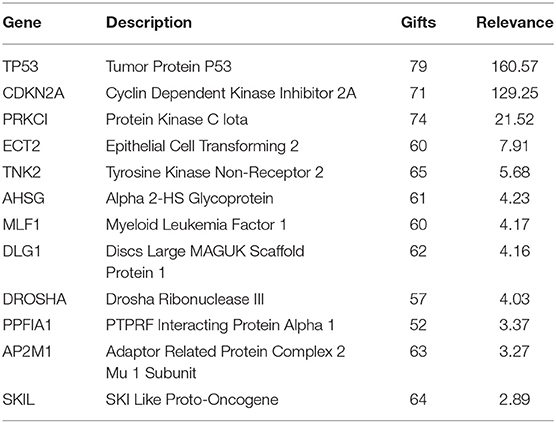
Table 3. Relevance of core genes to LUSC.
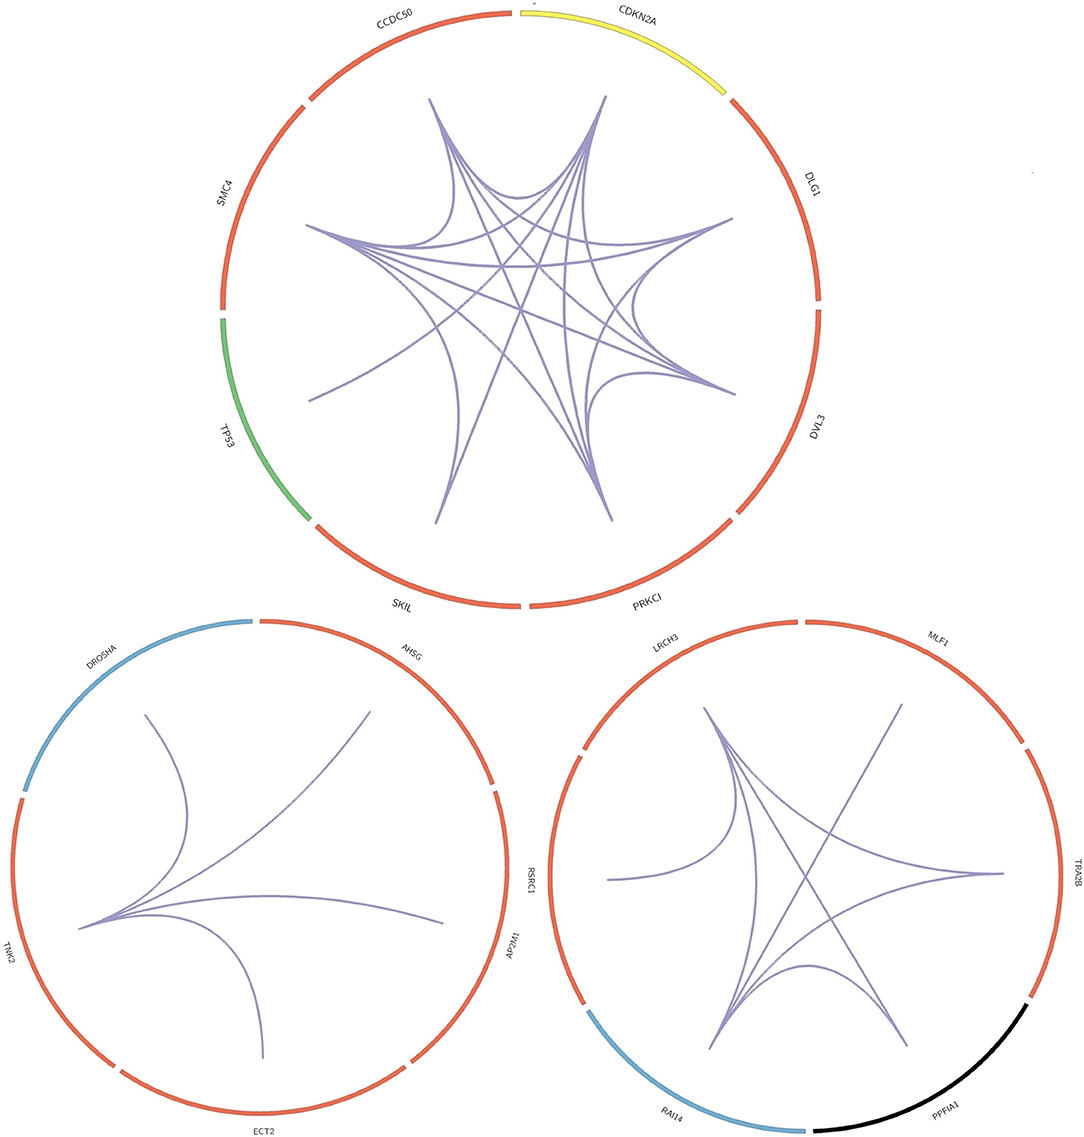
Figure 3. Core gene module.
The three key gene modules in Figure 3 have a total of 19 key genes. Of these, 18 were associated with lung cancer and 9 were associated with lung squamous cell carcinoma. The bar entities in the outer circle represents key genes. Among these, red, blue, yellow, black, and green represent the genes belonging to chromosomes 3, 5, 9, 11, and 17, respectively, and purple lines represent genes and the relationship between genes.
Most of the genes in these three modules are related to lung cancer, and there were key genes related to lung squamous cell carcinoma. A small number of genes have not been yet confirmed to be related to lung cancer, but they were all related to complex diseases or cancer. By investigating the module information to which these genes belong on NCBI, we found that most of the genes could be found on chromosome 3, and the specific information is shown in Table 4.
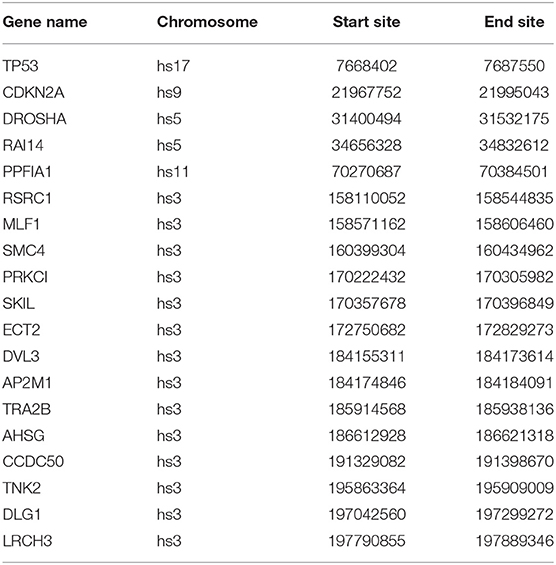
Table 4. Chromosome information of key genes.
Distinguishing Samples From Normal and Tumor
In order to exhibit the character of the three key modules we found in the development progress of LUSC, we hierarchically clustered the gene expression profile data from a total of 389 TCGA-LUSC samples, which included 337 tumor samples of TCGA-LUSC and 52 normal ones. For the distance measure, Euclidean distance was used to calculate the average distance between classes. The clustering analysis shows in Figure 4.
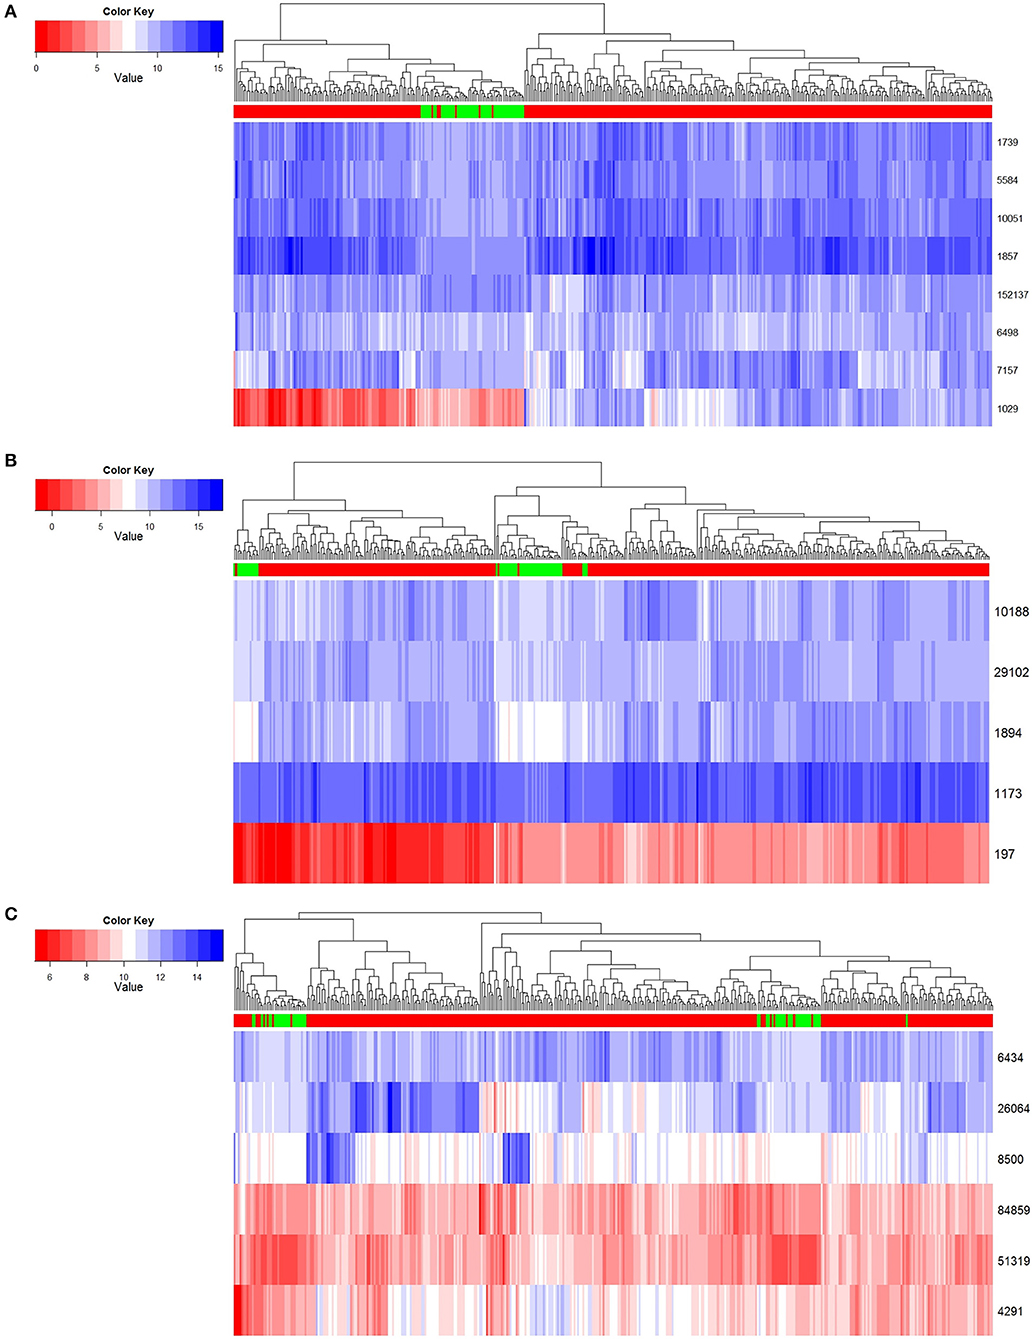
Figure 4. Normal and tumor samples resolved based on core genes. (A) Module 1 clustering result. (B) Module 2 clustering result. (C) Module 3 clustering result.
In the first row of Figure 4, red indicates that the sample is a tumor sample, and green is a normal one. Genes are illustrated in rows of the remaining part, and expression levels are in columns by scale of colors in blue and red. According to the results shown in Figure 4, we found that these three key gene modules could distinguish cancer samples from normal samples very robustly. Among these key genes, module 1 had the best classification effect, followed by Module 2 and Module 3.
Function and Pathway
For the key gene modules obtained by this method, we used DAVID software to perform KEGG pathway analysis and Gene Ontology function analysis. Among these classifications, only the Biological Progress was selected for functional analysis. The specific functional terms and pathway ID are list in Table 5, the prefix of GO is the function ID from Gene Ontology, and the prefix of each has the pathway ID from KEGG. The results shows that important carcinogenic effect. Among these, GO: 0071158, GO: 0045893, and GO: 0007050 disorders will aggravate the abnormal proliferation of cells and have extremely important effects. p53 is a tumor suppressor protein, and hsa04115 is a p53 signaling pathway closely related to cancer. Many genes in the Hippo signaling pathway represented by hsa04390 are tumor suppressor genes. hsa05203, hsa05212, hsa05214, hsa05219, and hsa05223 are relate with a viral carcinogenic mechanism, pancreatic cancer, glioma, bladder cancer, and non-small cell lung cancer, respectively. HTLV-I virus infection related with hsa05166 which associated with several cancers. hsa05200 itself represents a carcinogenic pathway. These show that the pathways and functions regulated by this gene module are also firmly associated to the development of LUSC.
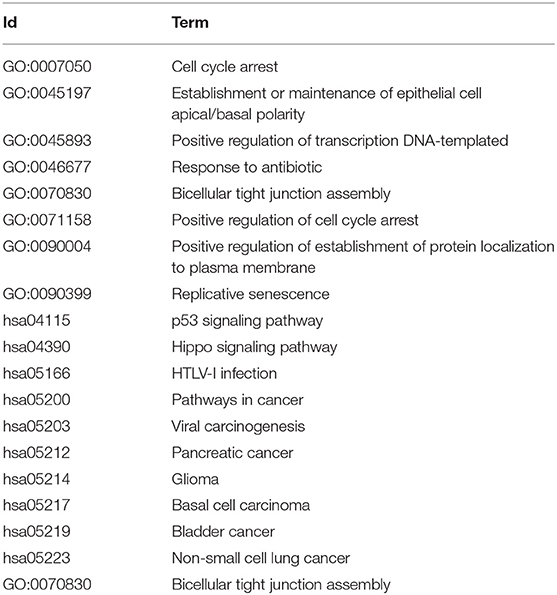
Table 5. Functions and pathways.
Survival Analysis
The key gene modules mined in this paper also have an important impact on LUSC and can characterize different risk level groups cancer samples. We applied a Cox proportional-hazards model to the genetic modification module for survival analysis. The Kaplan-Meier estimator curve is shown in Figure 5, where the abscissa represents days, and the ordinate shows the global survival rate. High- and low-risk group are in red and green line, respectively. The numbers in groups are shown in the legend and the loss to follow-up is indicated by “+” symbol. By comparing the two curves in the figure, we found that with increasing time, the two curves gradually split away, and the difference in survival time of the two groups of patients gradually increased, indicating that the 8 genes in module 1 (p = 0.002954) and the 4 genes in module 2 (p = 0.004595) can significantly distinguish the two groups of patients, are were highly relevant to the patient survival.
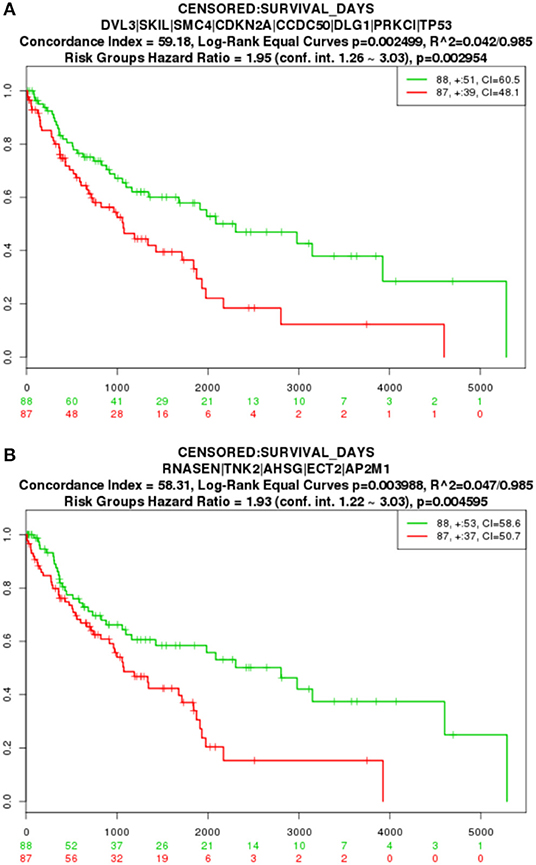
Figure 5. TCGA survival analysis result. (A) Module 1 survival analysis result. (B) Module 2 survival analysis result.
Conclusions
In this paper, the corrected cumulative rank score method was used as a distance measurement for a compactness clustering method to mine the gene modules contained in key genes of abnormal regulatory gene groups. The corrected cumulative rank score helped us understand the interaction level of gene groups in a protein interaction network and calculate the functional similarity score between gene groups. Three key gene modules were mined in this paper, and more than half of the genes in each module were related to lung squamous cell carcinoma. In particular, in the first key gene module, the correlation between TP53 as well as CDKN2A and lung squamous cell carcinoma ranks the top two on the GeneCards website, which fully illustrates the correlation between this module and lung cancer. The functions and pathways of these three modules have an important impact on the cause and progress of cancer. With survival analysis, we concluded that there were two key gene modules that could discriminate different risk level of patients very well. Our experimental results further validate the effectiveness of our overall method, and demonstrate the feasibility of mining key gene modules contained in a gene group using multiple methods.
Data Availability Statement
The original contributions presented in the study are included in the article/supplementary material, further inquiries can be directed to the corresponding authors.
Author's Note
The results in this article are based upon data generated by the TCGA Research Network: https://www.cancer.gov/tcga.
Author Contributions
CW and KS conceived of the presented idea. CW and NZ drafted the manuscript. NZ and YZ designed the model and the computational framework and analyzed the data. KS supervised the project. All authors discussed the results and contributed to the final manuscript.
Funding
This work was supported by Natural Science Foundation of China (61532014 and 61872114) and the National Key Research and Development Plan Task of China under Grant 2016YFC0901902. The funders had no role in study design, data collection and analysis, decision to publish, or preparation of the manuscript.
Conflict of Interest
The authors declare that the research was conducted in the absence of any commercial or financial relationships that could be construed as a potential conflict of interest.
References
1. Hong J, Luo Y, Zhang Y, Ying J, Xue W, Xie T, et al. Protein functional annotation of simultaneously improved stability, accuracy and false discovery rate achieved by a sequence-based deep learning. Brief Bioinform. (2019) bbz081. doi: 10.1093/bib/bbz081
2. Tang J, Fu J, Wang Y, Luo Y, Yang Q, Li B, et al. Simultaneous improvement in the precision, accuracy, and robustness of label-free proteome quantification by optimizing data manipulation chains. Mol Cell Proteomics. (2019) 18:1683–99. doi: 10.1074/mcp.RA118.001169
3. Yang Q, Wang Y, Zhang Y, Li F, Xia W, Zhou Y, et al. NOREVA: enhanced normalization and evaluation of time-course and multi-class metabolomic data. Nucleic Acids Res. (2020) gkaa258. doi: 10.1093/nar/gkaa258
4. Cheng L. Computational and biological methods for gene therapy. Curr Gene Ther. (2019) 19:210. doi: 10.2174/156652321904191022113307
5. Zhou LY, Qin Z, Zhu YH, He ZY, Xu T. Current RNA-based therapeutics in clinical trials. Curr Gene Ther. (2019) 19:172–96. doi: 10.2174/1566523219666190719100526
6. Yu L, Yao SY, Gao L, Zha YH. Conserved disease modules extracted from multilayer heterogeneous disease and gene networks for understanding disease mechanisms and predicting disease treatments. Front Genet. (2019) 9:745. doi: 10.3389/fgene.2018.00745
7. Ashburner M, Ball CA, Blake JA, Botstein D, Butler H, Cherry JM, et al. Gene Ontology: tool for the unification of biology. Nat Genet. (2000) 25:25–9. doi: 10.1038/75556
8. Beißbarth T, Speed TP. GOstat: find statistically overrepresented Gene Ontologies within a group of genes. Bioinformatics. (2004) 20:1464–5. doi: 10.1093/bioinformatics/bth088
9. Boyle EI, Weng S, Gollub J, Jin H, Botstein D, Cherry JM, et al. GO:: termFinder—open source software for accessing gene ontology information and finding significantly enriched Gene Ontology terms associated with a list of genes. Bioinformatics. (2004) 20:3710–5. doi: 10.1093/bioinformatics/bth456
10. Zheng Q, Wang X-J. GOEAST: a web-based software toolkit for Gene Ontology enrichment analysis. Nucleic Acids Res. (2008) 36(suppl_2):W358–W63. doi: 10.1093/nar/gkn276
11. Kim S-B, Yang S, Kim S-K, Kim SC, Woo HG, Volsky DJ, et al. GAzer: gene set analyzer. Bioinformatics. (2007) 23:1697–9. doi: 10.1093/bioinformatics/btm144
12. Backes C, Keller A, Kuentzer J, Kneissl B, Comtesse N, Elnakady YA, et al. GeneTrail—advanced gene set enrichment analysis. Nucleic Acids Res. (2007) 35(suppl_2):W186–W92. doi: 10.1093/nar/gkm323
13. Huang D, Sherman B, Lempicki R. Systematic and integrative analysis of large gene lists using DAVID bioinformatics resources. Nat Protoc. (2009) 4:44–57. doi: 10.1038/nprot.2008.211
14. Subramanian A, Tamayo P, Mootha VK, Mukherjee S, Ebert BL, Gillette MA, et al. Gene set enrichment analysis: a knowledge-based approach for interpreting genome-wide expression profiles. Proc Natl Acad Sci USA. (2005) 102:15545–50. doi: 10.1073/pnas.0506580102
15. Junwei H, Xudong H, Qingfei K, Liang C. psSubpathway: a software package for flexible identification of phenotype-specific subpathways in cancer progression. Bioinformatics. (2019) 36:2303–5. doi: 10.1093/bioinformatics/btz894
16. Al-Shahrour F, Minguez P, Tárraga J, Medina I, Alloza E, Montaner D, et al. FatiGO+: a functional profiling tool for genomic data. Integration of functional annotation, regulatory motifs and interaction data with microarray experiments. Nucleic Acids Res. (2007) 35(suppl_2):W91–W6. doi: 10.1093/nar/gkm260
17. Antonov AV, Schmidt T, Wang Y, Mewes HW. ProfCom: a web tool for profiling the complex functionality of gene groups identified from high-throughput data. Nucleic Acids Res. (2008) 36(suppl_2):W347–W51. doi: 10.1093/nar/gkn239
18. Wang JZ, Du Z, Payattakool R, Yu PS, Chen C-F. A new method to measure the semantic similarity of GO terms. Bioinformatics. (2007) 23:1274–81. doi: 10.1093/bioinformatics/btm087
19. Hong J, Luo Y, Mou M, Fu J, Zhang Y, Xue W, et al. Convolutional neural network-based annotation of bacterial type IV secretion system effectors with enhanced accuracy and reduced false discovery. Brief Bioinform. (2019) bbz120. doi: 10.1093/bib/bbz120
20. Soldatos TG, O'Donoghue SI, Satagopam VP, Jensen LJ, Brown NP, Barbosa-Silva A, et al. Martini: using literature keywords to compare gene sets. Nucleic Acids Res. (2010) 38:26–38. doi: 10.1093/nar/gkp876
21. Wang Y, You Z, Li L, Chen Z. A survey of current trends in computational predictions of protein-protein interactions. Front Comput Sci. (2020) 14:144901. doi: 10.1007/s11704-019-8232-z
22. Jiang M, Pei Z, Fan X, Jiang J, Wang Q, Zhang Z. Function analysis of human protein interactions based on a novel minimal loop algorithm. Curr Bioinformatics. (2019) 14:164–73. doi: 10.2174/1574893613666180906103946
23. Wang Y, Zhang S, Li F, Zhou Y, Zhang Y, Wang Z, et al. Therapeutic target database 2020: enriched resource for facilitating research and early development of targeted therapeutics. Nucleic Acids Res. (2020) 48(D1):D1031–D41. doi: 10.1093/nar/gkz981
24. Li B-Q, Zhang Y-H, Jin M-L, Huang T, Cai Y-D. Prediction of protein-peptide interactions with a nearest neighbor algorithm. Curr Bioinf. (2018) 13:14–24. doi: 10.2174/1574893611666160711162006
25. Zeng J, Zou Q, Wu Y, Li D, Liu X. An empirical study of features fusion techniques for protein-protein interaction prediction. Curr Bioinf. (2016) 11:4–12. doi: 10.2174/1574893611666151119221435
26. Li B, Tang J, Yang Q, Li S, Cui X, Li Y, et al. NOREVA: normalization and evaluation of MS-based metabolomics data. Nucleic Acids Res. (2017) 45(W1):W162–W70. doi: 10.1093/nar/gkx449
27. Guo F, Zou Q, Yang G, Wang D, Tang J, Xu J. Identifying protein-protein interface via a novel multi-scale local sequence and structural representation. BMC Bioinf. (2019) 20:483. doi: 10.1186/s12859-019-3048-2
28. Guo F, Ding Y, Li SC, Shen C, Wang L. Protein-protein interface prediction based on hexagon structure similarity. Comput Biol Chem. (2016) 63:83–8. doi: 10.1016/j.compbiolchem.2016.02.008
29. Yin J, Sun W, Li F, Hong J, Li X, Zhou Y, et al. VARIDT 1.0: variability of drug transporter database. Nucleic Acids Res. (2020) 48(D1):D1042–D50. doi: 10.1093/nar/gkz779
30. Ding Y, Tang J, Guo F. Predicting protein-protein interactions via multivariate mutual information of protein sequences. BMC Bioinf. (2016) 17:398. doi: 10.1186/s12859-016-1253-9
31. Cheng L, Zhao H, Wang P, Zhou W, Luo M, Li T, et al. Computational methods for identifying similar diseases. Mol Ther Nucleic Acids. (2019) 18:590–604. doi: 10.1016/j.omtn.2019.09.019
32. Wei L, Wan S, Guo J, Wong KK. A novel hierarchical selective ensemble classifier with bioinformatics application. Artif. Intell. Med. (2017) 83:82–90. doi: 10.1016/j.artmed.2017.02.005
33. Wei L, Xing P, Zeng J, Chen J, Su R, Guo F. Improved prediction of protein–protein interactions using novel negative samples, features, and an ensemble classifier. Artif Intell Med. (2017) 83:67–74. doi: 10.1016/j.artmed.2017.03.001
34. Yu L, Gao L. Human pathway-based disease network. IEEE/ACM Trans Comput Biol Bioinform. (2019) 16:1240–9. doi: 10.1109/TCBB.2017.2774802
35. Hao D, Li C, Zhang S, Lu J, Jiang Y, Wang S, et al. Network-based analysis of genotype-phenotype correlations between different inheritance modes. Bioinformatics. (2014) 30:3223–31. doi: 10.1093/bioinformatics/btu482
36. Wang Q, Sun J, Zhou M, Yang H, Li Y, Li X, et al. A novel network-based method for measuring the functional relationship between gene sets. Bioinformatics. (2011) 27:1521–8. doi: 10.1093/bioinformatics/btr154
37. Oti M, Snel B, Huynen MA, Brunner HG. Predicting disease genes using protein–protein interactions. J Med Genet. (2006) 43:691–8. doi: 10.1136/jmg.2006.041376
38. Lage K, Karlberg EO, Størling ZM, Olason PI, Pedersen AG, Rigina O, et al. A human phenome-interactome network of protein complexes implicated in genetic disorders. Nat Biotechnol. (2007) 25:309–16. doi: 10.1038/nbt1295
39. Goldenberg A, Mostafavi S, Quon G, Boutros PC, Morris QD. Unsupervised detection of genes of influence in lung cancer using biological networks. Bioinformatics. (2011) 27:3166–72. doi: 10.1093/bioinformatics/btr533
40. Chowdhury SA, Nibbe RK, Chance MR, Koyutürk M. Subnetwork state functions define dysregulated subnetworks in cancer. J Comput Biol. (2011) 18:263–81. doi: 10.1089/cmb.2010.0269
41. Vandin F, Upfal E, Raphael BJ. De novo discovery of mutated driver pathways in cancer. Genome Res. (2012) 22:375–85. doi: 10.1101/gr.120477.111
42. Tang W, Wan S, Yang Z, Teschendorff AE, Zou Q. Tumor origin detection with tissue-specific miRNA and DNA methylation markers. Bioinformatics. (2018) 34:398–406. doi: 10.1093/bioinformatics/btx622
43. Li YH, Li XX, Hong JJ, Wang YX, Fu JB, Yang H, et al. Clinical trials, progression-speed differentiating features and swiftness rule of the innovative targets of first-in-class drugs. Brief Bioinform. (2020) 21:649–62. doi: 10.1093/bib/bby130
44. Ji J, Tang J, Xia K-j, Jiang R. LncRNA in tumorigenesis microenvironment. Curr Bioinf. (2019) 14:640–1. doi: 10.2174/157489361407190917161654
45. Liao ZJ, Li DP, Wang XR, Li LS, Zou Q. Cancer diagnosis through IsomiR expression with machine learning method. Curr Bioinf. (2018) 13:57–63. doi: 10.2174/1574893611666160609081155
46. Xue W, Yang F, Wang P, Zheng G, Chen Y, Yao X, et al. What contributes to serotonin-norepinephrine reuptake inhibitors' dual-targeting mechanism? The key role of transmembrane domain 6 in human serotonin and norepinephrine transporters revealed by molecular dynamics simulation. ACS Chem Neurosci. (2018) 9:1128–40. doi: 10.1021/acschemneuro.7b00490
47. Zhang Y, Kou C, Wang S, Zhang Y. Genome-wide differential-based analysis of the relationship between DNA methylation and gene expression in cancer. Curr Bioinf. (2019) 14:783–92. doi: 10.2174/1574893614666190424160046
48. Feng YM. Gene therapy on the road. Curr Gene Ther. (2019) 19:6. doi: 10.2174/1566523219999190426144513
49. Yu L, Xu F, Gao L. Predict new therapeutic drugs for hepatocellular carcinoma based on gene mutation and expression. Front Bioeng Biotechnol. (2020) 8:8. doi: 10.3389/fbioe.2020.00008
50. Backes C, Rurainski A, Klau GW, Müller O, Stöckel D, Gerasch A, et al. An integer linear programming approach for finding deregulated subgraphs in regulatory networks. Nucleic Acids Res. (2012) 40:e43. doi: 10.1093/nar/gkr1227
51. Barabasi A-L, Oltvai ZN. Network biology: understanding the cell's functional organization. Nat Rev Genet. (2004) 5:101–13. doi: 10.1038/nrg1272
52. Sharan R, Ulitsky I, Shamir R. Network-based prediction of protein function. Mol Syst Biol. (2007) 3:88. doi: 10.1038/msb4100129
53. Yu L, Zhao J, Gao L. Drug repositioning based on triangularly balanced structure for tissue-specific diseases in incomplete interactome. Artif Intell Med. (2017) 77:53–63. doi: 10.1016/j.artmed.2017.03.009
54. Yu L, Su R, Wang B, Zhang L, Zou Y, Zhang J, et al. Prediction of novel drugs for hepatocellular carcinoma based on multi-source random walk. IEEE ACM Trans Comput Biol Bioinform. (2017) 14:966–77. doi: 10.1109/TCBB.2016.2550453
55. Lubovac Z. Investigating topological and functional features of multimodular proteins. BioMed Res Int. (2009) 2009:472415. doi: 10.1155/2009/472415
56. Sun J, Shi H, Wang Z, Zhang C, Liu L, Wang L, et al. Inferring novel lncRNA-disease associations based on a random walk model of a lncRNA functional similarity network. Mol Biosyst. (2014) 10:2074–81. doi: 10.1039/C3MB70608G
57. Zhou M, Wang X, Li J, Hao D, Wang Z, Shi H, et al. Prioritizing candidate disease-related long non-coding RNAs by walking on the heterogeneous lncRNA and disease network. Mol Biosyst. (2015) 11:760–9. doi: 10.1039/C4MB00511B
58. Mermel CH, Schumacher SE, Hill B, Meyerson ML, Beroukhim R, Getz G. GISTIC2. 0 facilitates sensitive and confident localization of the targets of focal somatic copy-number alteration in human cancers. Genome Biol. (2011) 12:R41. doi: 10.1186/gb-2011-12-4-r41
59. Li J, Han L, Roebuck P, Diao L, Liu L, Yuan Y, et al. TANRIC: an interactive open platform to explore the function of lncRNAs in cancer. Cancer Res. (2015) 75:3728–37. doi: 10.1158/0008-5472.CAN-15-0273
60. Cao W, Liu J-n, Liu Z, Wang X, Han Z-G, Ji T, et al. A three-lncRNA signature derived from the Atlas of ncRNA in cancer (TANRIC) database predicts the survival of patients with head and neck squamous cell carcinoma. Oral Oncol. (2017) 65:94–101. doi: 10.1016/j.oraloncology.2016.12.017
61. Zou Q, Lin G, Jiang X, Liu X, Zeng X. Sequence clustering in bioinformatics: an empirical study. Brief Bioinf. (2020) 21:1–10. doi: 10.1093/bib/bby090
62. Zhu X, Li H-D, Guo L, Wu F-X, Wang J. Analysis of single-cell RNA-seq data by clustering approaches. Curr Bioinf. (2019) 14:314–22. doi: 10.2174/1574893614666181120095038
63. Yang Q, Li B, Tang J, Cui X, Wang Y, Li X, et al. Consistent gene signature of schizophrenia identified by a novel feature selection strategy from comprehensive sets of transcriptomic data. Brief Bioinform. (2019) 21:1058–68. doi: 10.1093/bib/bbz049
64. Zhang L, He Y, Wang H, Liu H, Huang Y, Wang X, et al. Clustering count-based RNA methylation data using a nonparametric generative model. Curr Bioinf. (2019) 14:11–23. doi: 10.2174/1574893613666180601080008
65. Yang Q, Hong J, Li Y, Xue W, Li S, Yang H, et al. A novel bioinformatics approach to identify the consistently well-performing normalization strategy for current metabolomic studies. Brief Bioinform. (2019) bbz137. doi: 10.1093/bib/bbz137
66. Yang Y, Wu ZC, Kong W. Improving clustering of microRNA microarray data by incorporating functional similarity. Curr Bioinf. (2018) 13:34–41. doi: 10.2174/1574893611666160711162634
67. Tang J, Fu J, Wang Y, Li B, Li Y, Yang Q, et al. ANPELA: analysis and performance assessment of the label-free quantification workflow for metaproteomic studies. Brief Bioinform. (2020) 21:621–36. doi: 10.1093/bib/bby127
68. Li F, Zhou Y, Zhang X, Tang J, Yang Q, Zhang Y, et al. SSizer: determining the sample sufficiency for comparative biological study. J Mol Biol. (2020) 432:3411–21. doi: 10.1016/j.jmb.2020.01.027
Keywords: multi-omics data, bio-network model, compactness clustering, lncRNA, dysregulation
Citation: Wang C, Zhao N, Sun K and Zhang Y (2020) A Cancer Gene Module Mining Method Based on Bio-Network of Multi-Omics Gene Groups. Front. Oncol. 10:1159. doi: 10.3389/fonc.2020.01159
Received: 18 May 2020; Accepted: 08 June 2020;
Published: 19 June 2020.
Edited by:
Meng Zhou, Wenzhou Medical University, ChinaReviewed by:
Xiucai Ye, University of Tsukuba, JapanBalachandran Manavalan, Korea Institute for Advanced Study, South Korea
Copyright © 2020 Wang, Zhao, Sun and Zhang. This is an open-access article distributed under the terms of the Creative Commons Attribution License (CC BY). The use, distribution or reproduction in other forums is permitted, provided the original author(s) and the copyright owner(s) are credited and that the original publication in this journal is cited, in accordance with accepted academic practice. No use, distribution or reproduction is permitted which does not comply with these terms.
*Correspondence: Kai Sun, MTgwNDUwMTc1MTdAMTYzLmNvbQ==; Ying Zhang, emhhbmd5aW5nX2htdUAxNjMuY29t