 Wei Wu1,2
 Zhong Deng1,2Wahafu Alafate1,2Yichang Wang1,2Jianyang Xiang1,2
 Lizhe Zhu3Bolin Li4Maode Wang1,2*
 Jia Wang1,2*
- 1Department of Neurosurgery, The First Affiliated Hospital of Xi'an Jiaotong University, Xi'an, China
- 2Center of Brain Science, The First Affiliated Hospital of Xi'an Jiaotong University, Xi'an, China
- 3Department of Breast Surgery, The First Affiliated Hospital of Xi'an Jiaotong University, Xi'an, China
- 4Department of Cardiology, The First Affiliated Hospital of Xi'an Jiaotong University, Xi'an, China
Introduction: Traditional classification that divided gliomas into glioblastoma multiformes (GBM) and lower grade gliomas (LGG) based on pathological morphology has been challenged over the past decade by improvements in molecular stratification, however, the reproducibility and diagnostic accuracy of glioma classification still remains poor. This study aimed to establish and validate a novel nomogram for the preoperative diagnosis of GBM by using integrated data combined with feasible baseline characteristics and preoperative tests.
Material and method: The models were established in a primary cohort that included 259 glioma patients who had undergone surgical resection and were pathologically diagnosed from March 2014 to May 2016 in the First Affiliated Hospital of Xi'an Jiaotong University. The preoperative data were used to construct three models by the best subset regression, the forward stepwise regression, and the least absolute shrinkage and selection operator, and to furthermore establish the nomogram among those models. The assessment of nomogram was carried out by the discrimination and calibration in internal cohorts and external cohorts.
Results and discussion: Out of all three models, model 2 contained eight clinical-related variables, which exhibited the minimum Akaike Information Criterion (173.71) and maximum concordance index (0.894). Compared with the other two models, the integrated discrimination index for model 2 was significantly improved, indicating that the nomogram obtained from model 2 was the most appropriate model. Likewise, the nomogram showed great calibration and significant clinical benefit according to calibration curves and the decision curve analysis.
Conclusion: In conclusion, our study showed a novel preoperative model that incorporated clinically relevant variables and imaging features with laboratory data that could be used for preoperative prediction in glioma patients, thus providing more reliable evidence for surgical decision-making.
Introduction
Gliomas are the most common type of neuroepithelial neoplasm in the central nervous system (CNS) and account for ~3% of all systemic malignant tumors (1–3). Gliomas are traditionally divided into four grades according to the World Health Organization (WHO) classification and The Cancer Genome Atlas (TCGA) categorization, depending on the pathological signatures and specific molecular biomarkers (4, 5). The WHO grade II and grade III are defined as lower grade gliomas (LGG) while the WHO grade IV is identified as glioblastoma multiforme (GBM) which exhibits more aggressive and invasive features (6). Accumulating evidence showed that overall survival for GBM patients was remarkably prolonged after receiving a comprehensive clinical strategy including maximal surgical resection, radio treatment, and chemotherapy (7–9). Therefore, the precision of the preoperative classification of gliomas is crucial in deciding the pertinent operative strategy and for providing adequate information to the patient (10). However, there are few methods available for pre-surgical prediction of pathological grade in glioma patients. Recent studies recommended using an integrated classification system that combines histologic classification and genetic information, such as 1p/19q chromosomal co-deletion, IDH1 mutation, EGFR amplification, and BRAF mutation (4, 5). One obvious weakness for the current histopathological grading or molecular diagnose of gliomas is that these examinations can only be obtained and confirmed after surgical resection. This delayed process resulted in an ambivalent situation in which the clinicians cannot achieve sufficient evidence to help them formulate an operation strategy. Therefore, accurate pre-surgical prediction of the prognostic classification becomes an urgent need to improve the outcomes for glioma patients.
Recent studies suggested that the non-specific immune inflammatory response contributes to different signatures associated with glioma pathogenesis, overall survival, or response to treatment (11–15). The count of immune cells from preoperative blood routines were significantly related to the WHO classification and prognosis in glioma patients (16, 17). Immune responses in GBM is characterized by low peripheral lymphocyte counts, impaired mitogen-induced responses of peripheral mononuclear cells, and accumulation of CD8+ suppressor T cells and CD4+CD25+FoxP3+Treg cells, which have been reported to play a crucial role in cancer immune surveillance and defense by inducing cytotoxic cell death and inhibiting glioma cell proliferation and migration of glioma (18–20). Monocytes specifically were recruited from peripheral blood and associated with microglia to form the tumor-associated macrophage (TAMs), which proved to be essential for tumor microenvironment regulation and promoted tumorigenesis and metastasis via secretion of inflammatory factors, thus inducing activation of peripheral blood inflammatory cells (PBICs) in gliomas (21, 22). To further evaluate the clinical relevance between immune response and prognosis of tumor patients, the systemic inflammation response index (SIRI) based on peripheral neutrophil (N), monocyte (M), and lymphocyte (L) counts was used as a survival-related predictor in multiple solid tumors, including gastric cancer, hepatocellular carcinoma, and pancreatic cancer (11, 23, 24). Despite these findings, the functional role of SIRI in gliomas still remains unclear.
MRI could provide primary investigations of the subtype and malignancy of brain tumors, thus affording a potential presumptive diagnosis for further therapeutic regimens. Previous MRI-based radio genomics studies presented a nomogram for preoperative prediction molecular subgrouping for patients with medulloblastoma by using MRI features of tumors. Henker et al. also demonstrated that preoperatively measured necrosis volume and necrosis-tumor ratio was the most crucial radiological features of GBM with a strong influence on OS. Therefore, MRI features of gliomas could be rational for preoperational grading of gliomas (25, 26).
A single predictive index provides insufficient information on gliomas. Meanwhile, accumulating laboratory examinations or radiography was relevant with GBM progression (27, 28). However, the predictive value of a combination with SIRI and MRI in the preoperative diagnosis of GBM still remains unclear. Furthermore, the traditional statistical strategy, called “data snooping,” only adopted the variables which were significant on univariate analysis to establish the final prediction models, which led to model overfitting and showed poor results (29). There are some advanced statistical methodologies to minimize this limitation, such as the best subsets regression (BSR), the forward stepwise regression (FSR), and the least absolute shrinkage and selection operator (LASSO) (30–33). Therefore, our studies aimed to establish an effective and non-invasive nomogram for preoperative diagnosis and grading methods of gliomas by using feasible baseline measurements and preoperative tests combined with SIRI and MRI, as well as adopting advanced statistical analysis.
Method
Patients
The flow diagram for this study was described in Supplementary Figure 1. Clinical information of all glioma patients was consecutively enrolled and this study was approved by the Ethics Committee of the First Affiliated Hospital of Xi'an Jiaotong University. This was a retrospective study, for which formal consent was not required. All included patients were carefully screened for the following inclusion criteria: (a) pathologically diagnosed grade II–IV glioma based on the WHO classification of CNS tumors (2016) (4) which was performed by two independent pathologists, (b) no history of craniotomy or stereotactic biopsy, (c) available brain MRI and blood routines in the pre-surgery period and MRI features that were measured by two independent radiologists, (d) complete clinical characteristics, and (e) no disease causing elevated or decreased PBIC. Finally, a total of 365 patients with gliomas who underwent surgical resection at the Department of Neurosurgery, the First Affiliated Hospital of Xi'an Jiaotong University from January 2014 to November 2016 were enrolled in this retrospective study.
All patients were arranged in chronological order. The top 70% of patients were assigned as the primary cohort and the bottom 30% of patients were identified as an internal validation cohort. Validation of the nomogram was also evaluated in an independent external validation cohort which included 159 patients from June 2018 to April 2019 who underwent craniotomy in our hospital.
Clinical Characteristics
The clinical information, including sex, age, height, body weight, preoperative Karnofsky performance status (pKPS), tumor grade, the preoperative epilepsy occurrence (pEO), and preoperative blood routine tests including neutrophil, monocyte, and lymphocyte counts, were obtained from medical records. Features of MRI, comprising of tumor volume, location, multifocality, annular enhancement, necrosis volume, and peritumoral edema volume (PTE), were also involved in our analysis.
Body mass index (BMI) was defined as: BMI = height/body weight2. The threshold value for pKPS was <70 and ≥70 on the basis of WHO's standards (4). The SIRI was defined as: SIRI = N*M/L (22) and the PTE, tumor volume, and necrosis volume were calculated based on formulas described in the Supplementary Materials and Methods (26).
Variables Selection
In order to avoid over-fitting or under-fitting of the model, three advanced statistical methods, the BSR, the LASSO, and the FSR, were adopted to select variables in the primary cohort. The criterion of variable selection for the BSR and the FSR was determined by the Bayesian information criterion (BIC) (34).
Model Establishment
GBM-related predictive models were established in the primary cohort based on the selected variables by adopting binary logistic regression. Eventually, we developed three models as described below: (a) model 1 consisted of seven variables based on the BSR, (b) model 2 included SIRI besides the above seven variables according to the LASSO, and (c) model 3 also consisted of seven variables except for pEO according to the FSR.
The final model was determined by the Akaike Information Criterion (AIC) (35), the ROC curves, the Harrell concordance index (C-index), and the integrated discrimination index (IDI) (36, 37).
Similarly, these methods were also used to assess the performance of prediction models. Herein, the discrimination of the model was evaluated by the C-index among three cohorts, and the IDI was used to estimate whether the model's predictive ability could become better by adding one variable in model 1 or model 3. Conclusively, the nomogram was derived from the final model.
Apparent Performance of the Nomogram
The performance of the nomogram was also demonstrated by the calibration curve among three cohorts, except for the ability of discrimination. Meanwhile, the appropriateness of the current predictors involved in nomogram was tested. As a result, the Hosmer–Lemeshow test, the studentized residuals, the variance inflation factor (VIF), the Cook's distance, the hat value, and the Box-Tidwell test were performed to evaluate model fitting, outliers, collinearity, influential observations, high leverage cases of data, and the linear relationship between continuous independent variables and the logit transformation value of the dependent variable, respectively.
Clinical Usage
The decision curve analysis (DCA) was performed to assess the clinical usage of nomogram and a net benefit for diverse prediction models at different threshold probabilities by adding the benefits and minimizing the harms (38).
Statistical Analysis
All the statistical analyses were performed with the SPSS software (version 22.0, SPSS Inc., Chicago, IL) and R software (version 3.2.6; http://www.r-project.org). The packages in R which we used in this study were shown as follows: “glment,” “rms,” “proc,” “PredictABEL,” “rmda,” “car,” “leaps,” and “regplot.” Statistical significance levels were determined by two-sided tests and P < 0.05 was defined as statistically significant. The Mann–Whitney U-test was used for comparing two groups of continuous variables analysis, the Kruskal–Wallis H-test was used for three groups' continuous variables analysis, and the χ2 test for categorical variables analysis. The BSR, the LASSO, and the FSR were used to select variables. The binary logistic regression was performed for model construction.
Results
Clinical Characteristics
The baseline clinical and pathological characteristics of the three cohorts were presented in Table 1. The baseline characters showed gratifying similarity in the prevalence of GBM among the three cohorts (P = 0.682). The proportion of GBM was 55.2, 54.7, and 50.9% among the three cohorts, respectively. Also, the baseline clinical parameters, laboratory tests, and MRI factors showed no significant differences and were comparable among the three cohorts. Additionally, the clinical information after subgroup stratification based on pathological grade in all cohorts also showed none statistical significance (Supplementary Table 1). Altogether, all selected parameters in this study showed homogeneity and comparability among all cohorts, indicating that the source and collection for the clinical data were reliable and guaranteed with high-quality.
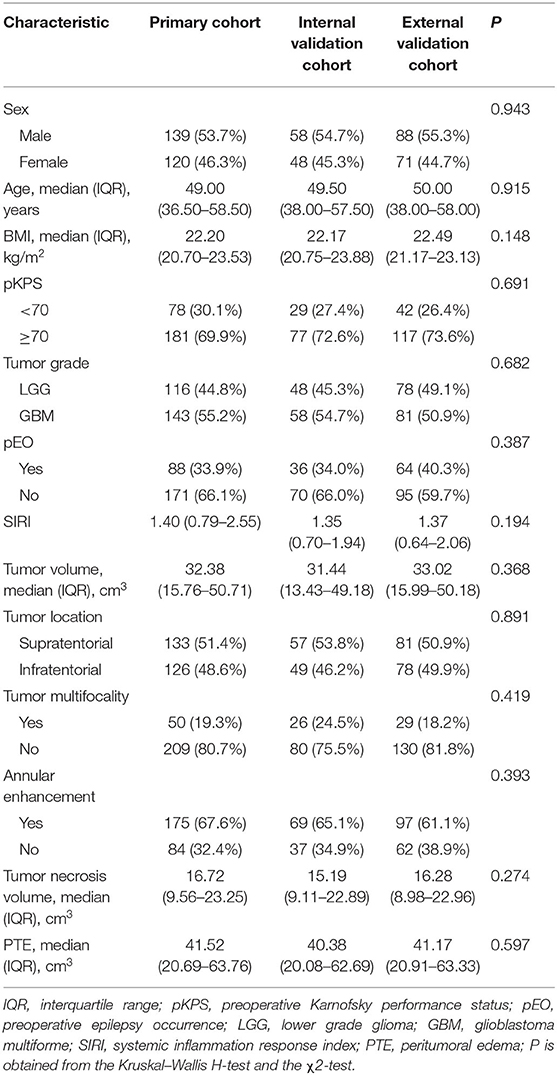
Table 1. Clinical characteristics of patients in the primary and validation cohorts.
Variables Selection Using the BSR
The BSR method showed great benefits on variables selection since all possible combinations of variables were calculated and the final selected combination should be optimal based on the minimum BIC. As shown in Figures 1A,B, the selection of all 12 parameters was presented and the minimum BIC was −150.The number of final variables was 7 because there was an inflection point, shown in the broken line of Figure 1A, and the dotted line referred to the final combination based on the BSR in Figure 1B, which incorporated clinical factors and MRI features in the primary cohort. All selected variables showed significantly statistical differences in all cohorts (all P < 0.05; Table 2, Supplementary Tables 2, 3). Consequently, model 1 was established.
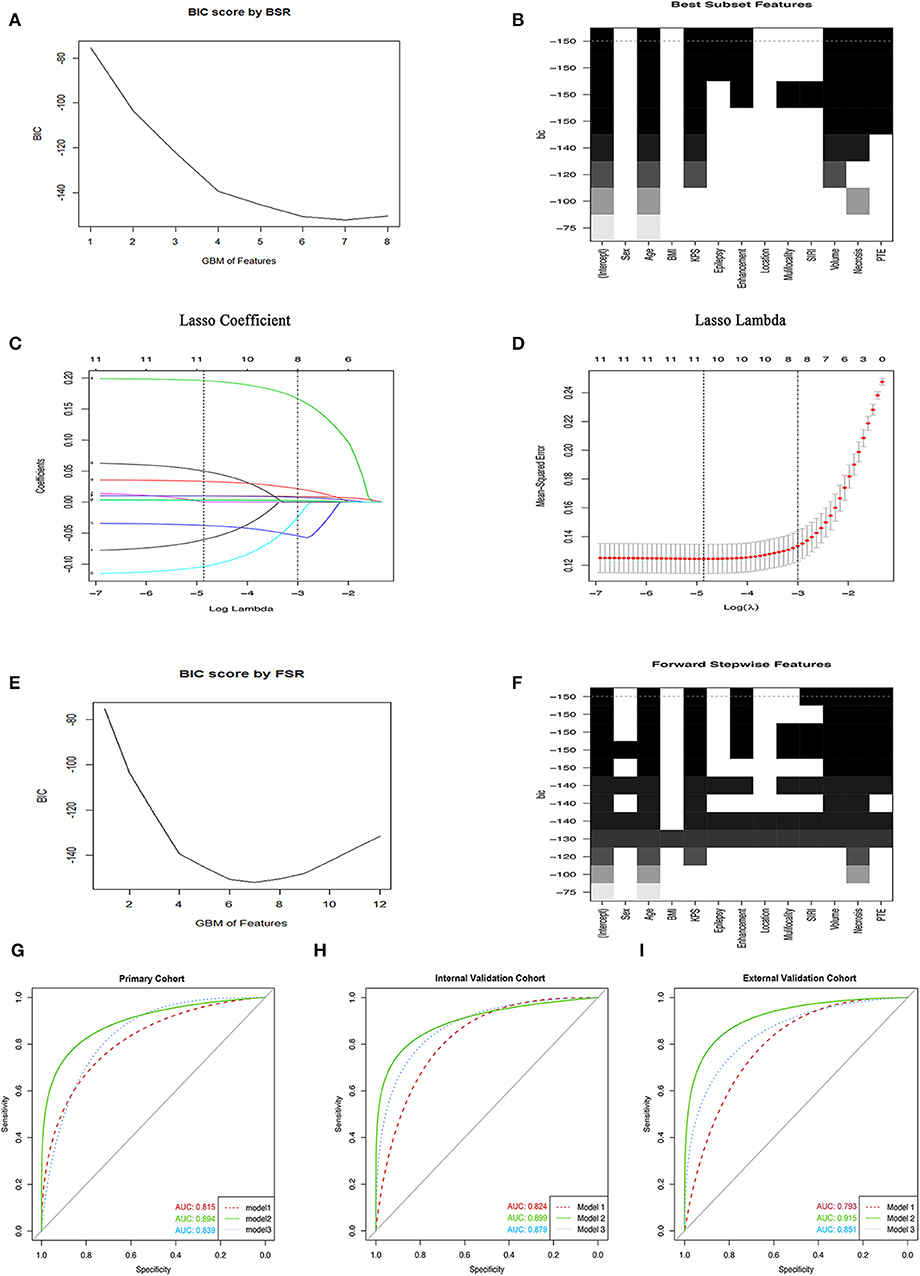
Figure 1. Variables selection methods. (A,B) The selection of variables using the BSR method. (C) The LASSO coefficient profile of 12 GBM-related variables in primary cohort. (D) 10-fold cross-validation (CV) for tuning parameter (λ) selection. (E,F) The FSR method was used to select variables. (G–I) The ROC curves of GBM in primary cohort and two validation cohorts, respectively. BIC, Bayesian information criterion; GBM, glioblastoma multiforme; BSR, best subsets regression; FSR, forward stepwise regression; BMI, body mass index; SIRI, systemic inflammation response index; pEO, preoperative epilepsy occurrence; pKPS, preoperative Karnofsky performance status; PTE, peritumoral edema.
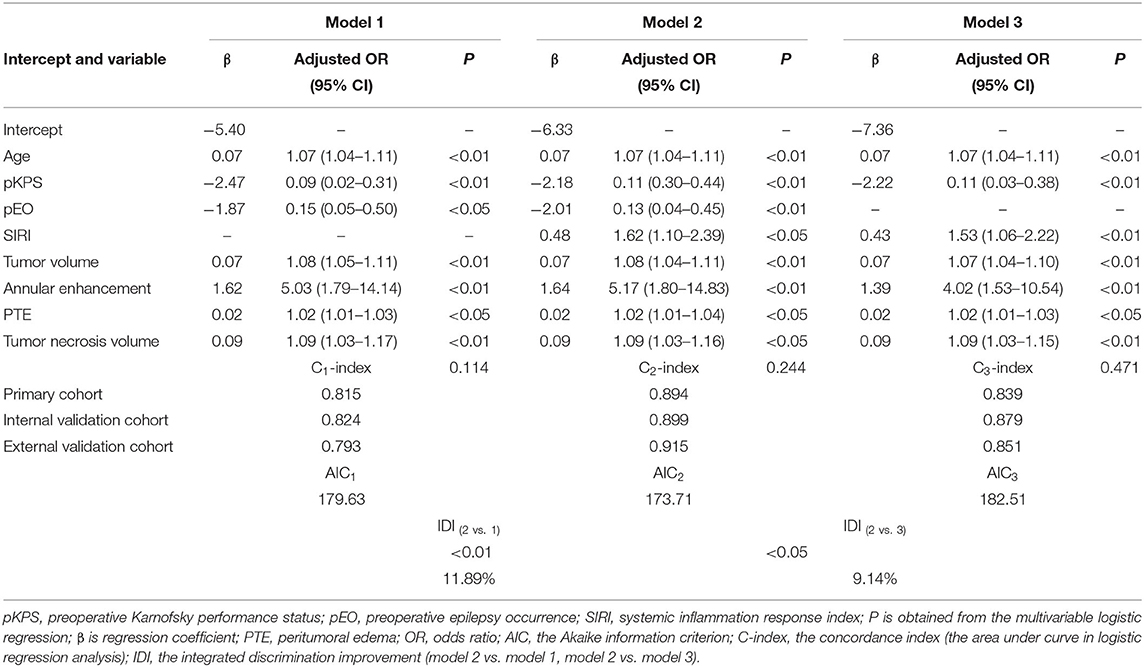
Table 2. Risk factors for GBM in primary cohort.
Variables Selection Using the LASSO
Considering that the number of independent variables included in the regression equation should be around 10 to 15 times the number of ending events, we further adopted the LASSO to select variables. As shown in Figures 1C,D, a coefficient profile figure was produced against the ln (λ) sequence. Two dotted vertical lines were drawn at the selected value with 10-fold cross-validation, where the optimal λ was 0.048 (1 standard error of the minimum criteria) and resulted in 8 non-zero coefficients, age, pKPS, pEO, SIRI, and Tumor necrosis volume, annular enhancement, PTE and tumor volume, being selected from all variables in the primary cohort. These variables were verified to exhibit significant differences (all P < 0.05; Table 2, Supplementary Tables 2, 3). Consequently, model 2 was established.
Variables Selection Using the FSR
Herein, we also used the most common variable selection method to choose combinations of potential predictors such as the FSR. Under this predominant process operation which involved a series of steps, we also obtained 7 variables and the minimum BIC was −150 because there was an inflection point in the broken line which was shown in Figures 1E,F. Similarly, all selected variables had significant statistical difference (all P < 0.05; Table 2, Supplementary Tables 2, 3) and model 3 was established.
Development of Final Prediction Model
In the primary cohort, each significant variable was first evaluated by using univariate logistic regression (Supplementary Table 3). Then multivariable logistic regression analysis demonstrated that multiple variables, including age, SIRI, Tumor necrosis volume, annular enhancement, PTE, and tumor volume, were independent risk factors, while pKPS and pEO were independent protective factors (Table 2). The choice of final prediction model was determined by AIC, the ROC curve, the C-index, and the IDI, which were also used to examine efficiency of the models (Table 2 and Figures 1G–I).
As a result, model 2 showed the smallest AIC (173.71) among the three regression models. The discrimination of model 2 was maximum in primary cohort with the C-index 0.894 (95% CI: 0.847–0.919, P < 0.05). Similarly, the discrimination of model 2 was also maximum in internal validation cohort with the C-index was 0.899 (95% CI: 0.856–0.922, P < 0.01) and external validation cohort with C-index was 0.915 (95% CI: 0.868–0.941, P < 0.01). The sensitivity and specificity of model 2 were 82.8 and 79.6% in the primary cohort, 82.1 and 86.2% in the internal validation cohort, and 84.3 and 82.1% in the external validation cohort, respectively, which were more appropriate than the other models. After adding one variable to the prediction model, the IDI was significantly improved (model 2 vs. model 1:11.89%, P < 0.01, model 2 vs. model 3: 9.14%, P < 0.05). Moreover, the random forest was used to screen out candidate variables and the ROC analysis presented that the Lasso was 0.893, which preceded the random forest combination based on increase in node purity method (Supplementary Figures 2A–C and Supplementary Table 4). Therefore, the nomogram obtained from the final model was optimal (Figure 2).
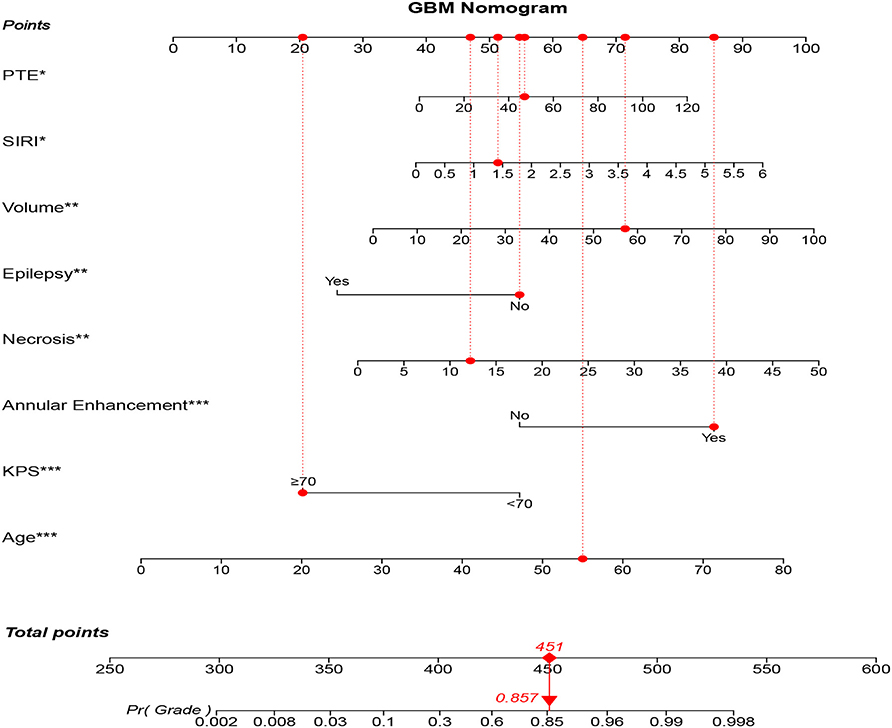
Figure 2. GBM-related nomogram prediction score. GBM-related nomogram was constructed to preoperatively predict GBM for glioma patients, with the age, pKPS, annular enhancement, tumor necrosis volume, pEO, tumor volume, SIRI and PTE. The nomogram showed the probability of having GBM in a randomized patient with a pathological diagnosis of GBM. SIRI, systemic inflammation response index; pEO, preoperative epilepsy occurrence; pKPS, preoperative Karnofsky performance status; PTE, peritumoral edema. *P < 0.05, **P < 0.01, ***P < 0.001.
Performance of Nomogram
We then verified a suitable calibration in the primary cohort and validation cohorts (Figures 3A–C). The solid straight line (the 45-degree line) showed an ideal prediction nomogram, and the other broken lines represented the observed nomogram for three models, of which a closer fit to the dashed line means a better prediction model. Consistent with the above results, the green solid broken line of calibration curves established via model 2 also showed a superior performance among the three cohorts. Moreover, the Hosmer–Lemeshow test indicated the nomogram model had a satisfactory fitting (P = 0.752). There were no outliers for data with the P < 0.05. All predictors had no multicollinearity because the VIF in all them was <1.5. The Box-Tidwell test showed a linear relationship between all continuous independent variables and the logit transformation value of the dependent variable (P = 0.474 for age, P = 0.421 for SIRI, P = 0.667 for tumor volume, P = 0.331 for PTE, P = 0.389 for tumor necrosis volume), and there were also no strong influential observations and high leverage cases as all of the Cook's distances were no more than 0.02 and all hat values were no more than 0.069 (Supplementary Figures 3A–C). Taken together, these results suggested that the nomogram was feasible.
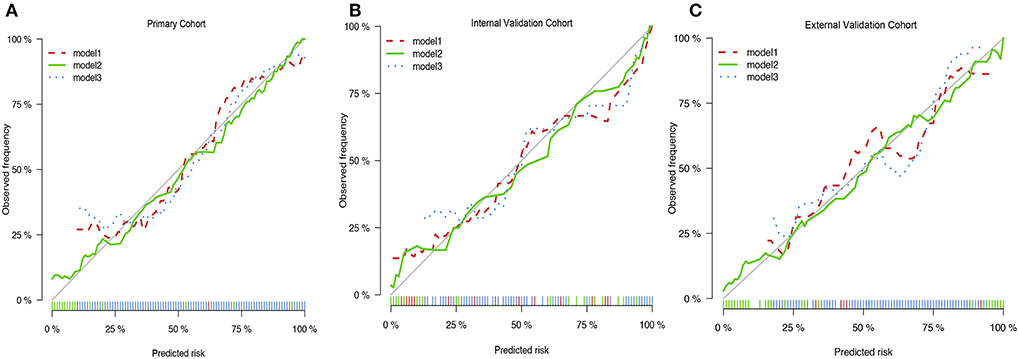
Figure 3. The Calibration curves of three prediction models. (A) The Calibration curves of three prediction models in primary cohort. (B) The Calibration curves of three prediction models in internal validation cohort. (C) The Calibration curves of three prediction models in primary cohort in external cohort.
Clinical Usage
Figures 4A–C showed a comparable net benefit if the threshold probability for a patient or a doctor was within a range from 0 to 0.85, according to DCA. The y-axis showed the net benefit, which was a difference value between the proportion of false positive patients and the proportion of true positive patients, weighted by the relative harm of deserting therapies compared with the negative effects of unnecessary therapies (39). The oblique smooth solid line represented a kind of hypothesis that all patients have GBM. The horizontal smooth solid line represented a kind of hypothesis that all patients have no GBM. The oblique broken lines represented all patients who were considered as GBM according to the constructed prediction model. In our current study, the decision curves in three cohorts showed that if the threshold probability was between 0 and 0.80, then using the comprehensive nomogram to preoperatively predict GBM added more benefit than treating either all or no patients, while the perfect model was the model with the highest net benefit under any threshold probability. The results also indicated that nomogram could improve current treatment standards for glioma.
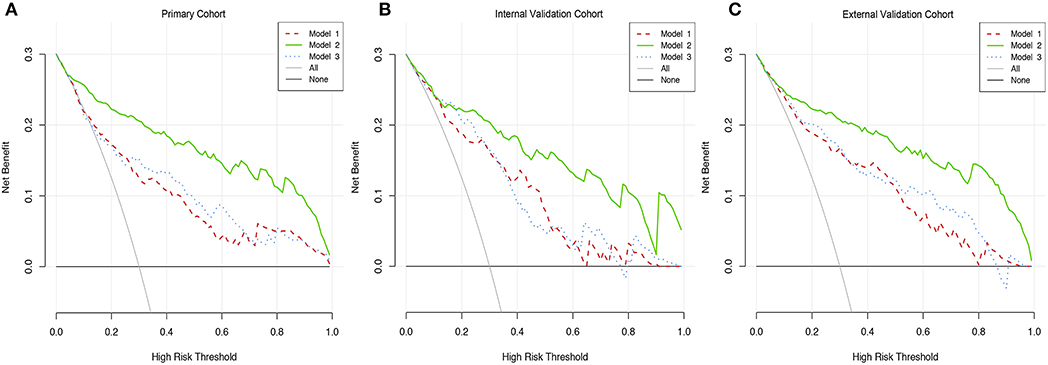
Figure 4. Decision curve analysis of three prediction models. (A) The DCA curves of three prediction models in primary cohort. (B) The DCA curves of three prediction models in internal validation cohort. (C) The DCA curves of three prediction models in primary cohort in external cohort.
Discussion
In order to rationally promote the individual multidisciplinary integrated treatment of gliomas, the development of a more efficient and comprehensive prediction system for gliomas becomes an urgent need. Instead of adopting only a single indicator to predict glioma grade (17), we established and validated an integrated nomogram to accurately predict the probability of pathological grade in glioma patients before undergoing craniotomy. Among the 365 patients, 259 were included in a primary cohort for creating the model and the remaining cases were arranged in an internal validation cohort for validating the model in a chronological order. Additionally, we also collected 159 patients to establish an external validation cohort in other time periods to ensure the extensibility and accuracy of the prediction model. Herein, we proposed that the three cohorts were homogeneous and comparable according to the statistical analysis. Considering some limitations from using traditional statistical strategy, we adopted three advanced statistical methods to select variables in the primary cohort. As a result, these methods reduced bias generated by “data snooping” and ensured the reliability of the model.
Based on the LASSO method, we screened out eight candidate indicators to construct model 2. The performance of model 2 was the most appropriate among the three models with the criterions. The LASSO, which not only avoided the mismatch between the number of independent variables and the ending events but also exceeded the high collinearity of the selected variables, has been proven to perform more favorably in a dataset with a lower number of ending events compared to the BSR and the FSR (40). Additionally, the ROC and calibration analysis were performed to validate the discrimination and calibration of model 2 among the three cohorts. With this combination, patients with suspicious GBM could be precisely identified before the surgical resection, which provided more evidence to the surgeon to formulate the surgical strategy. The rationality and feasibility of the data was also verified for further confirmation of the models. Moreover, the ability of discrimination between the Lasso and random forest methods were compared and the result suggested that the combination of selected variables based on increased mean squared error in random forest was similar to the Lasso while the other combination exhibited significant deficiency in random forest compared to Lasso according to the ROC analysis (Supplementary Figures 2A–C and Supplementary Table 4). Eventually, an integrated nomogram for pre-surgical prediction of GBM was established based on these novel findings and was confirmed by DCA analysis. Altogether, our nomogram could be helpful to separate GBM patients via a non-invasive method before surgery and make appropriate clinical therapeutic decisions.
To gain more insight into the clinical relevance of our nomogram in gliomas, the correlation between the nomogram score and overall survival rate were investigated based on the different WHO grades of gliomas. The results showed that the high nomogram score derived from our methods was strongly correlated with all WHO grades and overall survival of glioma patients. Additionally, the time-dependent ROC analysis indicated that the nomogram was appropriate (Supplementary Figures 4A,B). Moreover, we divided all glioma samples into two groups based on their malignant characters, GBM (Grade IV) and lower-grade gliomas (Grade II and III), according to the TCGA standards. Moreover, the Kaplan–Meier analysis showed that an elevated nomogram score revealed more severe prognosis in either LGG or GBM, indicating that our model was sensitive to gliomas despite the WHO grade (Supplementary Figures 4C,D). The pKPS and pEO could be independent protective factors while age, SIRI, PTE, annular enhancement, tumor volume, and tumor necrosis volume could be independent risk factors (Supplementary Figure 5). Lastly, the correlation between nomogram score and survival in patients who received different post-surgical treatment were explored. The results showed that increased nomogram score could be correlated with poor prognosis despite the patient having received TMZ/radiation or not (Supplementary Figures 6A–D). Altogether, these data suggested that our model could be used as a predictor for tumor grade and revealed prognosis in gliomas as well; moreover, it is independent from eventual modification of survival caused by post-surgical treatment.
Multiple studies that aimed to develop prognostic markers for malignant tumors by combining clinical characteristics with preoperative examinations have been previously reported (41, 42). It has been proven that the nomogram based on multimodal biomarkers could successfully predict axillary lymph node (ALN) metastasis in patients with breast cancer before surgery, which was rational in the training cohort (C-index: 0.856) and reliable in the validation cohort (C-index: 0.841) (43). Although a previous study also established a non-invasive risk score to predict ALN metastasis, the C-index remained at only 0.74 and showed a lack of comprehensive index (44). Therefore, integrated profiling could provide a more accurate preoperative diagnosis and result in reasonable clinical decisions.
Recent studies have indicated that MRI features of glioma, including tumor necrosis, volume, enhancement, and peritumoral edema, could present abundant information about glioma heterogeneity (26, 45, 46). Henker et al. (26) also demonstrated that preoperatively measured necrosis volume and necrosis-tumor ratios are the most important radiological features of GBM with a strong influence on OS. Liu et al. (45) investigated the correlation between progression-free survival (PFS) and MRI features among 300 patients with LGG (216 cases in a training cohort and 84 cases in a validation cohort). The results showed that MRI features were significantly associated with PFS (P < 0.05) and a comprehensive nomogram which had favorable discrimination and calibration for prediction of PFS was established; moreover, researchers considered that increased risk score of nomogram implied malignancy of glioma. Meanwhile, Muccio et al. (46) analyzed the differentiation between cerebral metastases (CM) and GBM for MRI and they suggested that the signal alteration in the adjacent cortex was specific for GBM and peripheral rim sign was specific for CM. Herein, we speculated that MRI reveals malignant characteristics of gliomas, including proliferation, tumor invasion, and microenvironment changes (47, 48). To this end, tumor volume, necrosis volume, and peritumoral edema volume were extracted from images from glioma patients and then enrolled in our nomogram. Compared to an isolated predictor of SIRI, the ROC and calibration curves of our nomogram were significantly improved (Supplementary Figures 7A,B).
Tumor-related inflammation has long been considered as an important hallmark of cancer (49). Accumulating evidence suggested that tumorigenesis and invasion of the tumor were closely related to the chronic non-specific inflammation process and were thought to play a crucial role in the survival of patients. This progress was mediated by inflammation cells and cytokines that can present and be detected in peripheral blood (50). Wang et al. (17) found that nutrition-related markers, including albumin-to-globulin and prognostic nutrition index (PNI), were negatively associated with glioma grades and were remarkably reduced in GBM in contrast to LGG (all P < 0.01). The diagnostic value of hematological markers in predicting glioma grade combined with age and PNI showed fantastic discrimination with AUC of 0.750. Furthermore, Geng et al. (51) found that the median overall survival rate in patients with SIRI≤1.2 was significantly higher than in patients with SIRI>1.2 and the nomogram including SIRI could more accurately predict OS compared with the TNM staging system. Therefore, an inflammation index such as SIRI proved to be a potential index for predicting tumorigenesis and metastasis of glioma and should be involved in the prediction model. In our study, SIRI was measured by counting of PBIC and it was found that SIRI was positively correlated with the pathological grade of gliomas (P < 0.01, Supplementary Table 2). Taken together, we constructed and evaluated a comprehensive probabilistic score for the preoperative prediction of GBM in glioma, which could be a crucial method for early diagnosis and support more rational treatment of GBM.
Although our nomogram showed encouraging discrimination and calibration among the three cohorts, there were still some limitations. Since a retrospective method was used in this study, inherent deviations such as selection deviation and detection deviation were inevitably generated. Also, continuous monitoring for the variation of some parameters cannot be achieved. Further, molecular mechanism studies and large-scale and multi-center clinical trials needed to be performed to modify the model.
Conclusion
In conclusion, our study showed a novel preoperative model incorporated clinically relevant variables and imaging features with laboratory data that could be used for preoperative prediction in glioma patients, thus providing more reliable evidence for surgical decision-making.
Data Availability Statement
The data generated during this study are included in this article. Raw data are available upon reasonable request.
Ethics Statement
This study was approved by the Ethics Committee, the First Affiliated Hospital of Xi'an Jiaotong University. This is a retrospective study, for which formal consent is not required.
Author Contributions
WW: collection and/or assembly of data, data analysis and interpretation, manuscript writing, methodology, and software. ZD: collection and/or assembly of data, data analysis and interpretation, manuscript writing, and editing. WA: data analysis, manuscript writing, and interpretation. YW: manuscript writing and project administration. JX: manuscript writing and project administration. LZ: manuscript writing. BL: conception/design. MW: conception/design, supervision, and editing. JW: conception/design, supervision, and editing. All authors contributed to the article and approved the submitted version.
Funding
This study was funded by the National Natural Science Fund of China (Grant No. 81802502), the Project Supported by the Natural Science Basic Research Plan in Shaanxi Province of China (Grant No. 2019JQ-958), the Fundamental Research Funds of Xi'an Jiaotong University (Grant No. 1191329177), and the Special Foundation for Class A Subject of the First Affiliated Hospital of Xi'an Jiaotong University.
Conflict of Interest
The authors declare that the research was conducted in the absence of any commercial or financial relationships that could be construed as a potential conflict of interest.
Supplementary Material
The Supplementary Material for this article can be found online at: https://www.frontiersin.org/articles/10.3389/fonc.2020.01750/full#supplementary-material
References
1. Ostrom QT, Gittleman H, Truitt G, Boscia A, Kruchko C, Barnholtz-Sloan JS. CBTRUS statistical report: primary brain and other central nervous system tumors diagnosed in the United States in 2011-2015. Neuro Oncol. (2018) 20:iv1–86. doi: 10.1093/neuonc/noy131
2. Delgado-Lopez PD, Corrales-Garcia EM, Martino J, Lastra-Aras E, Duenas-Polo MT. Diffuse low-grade glioma: a review on the new molecular classification, natural history and current management strategies. Clin Transl Oncol. (2017) 19:931–44. doi: 10.1007/s12094-017-1631-4
3. Bush NA, Chang SM, Berger MS. Current and future strategies for treatment of glioma. Neurosurg Rev. (2017) 40:1–14. doi: 10.1007/s10143-016-0709-8
4. Louis DN, Perry A, Reifenberger G, von Deimling A, Figarella-Branger D, Cavenee WK, et al. The 2016 world health organization classification of tumors of the central nervous system: a summary. Acta Neuropathol. (2016) 131:803–20. doi: 10.1007/s00401-016-1545-1
5. Wu F, Wang ZL, Wang KY, Li GZ, Chai RC, Liu YQ, et al. Classification of diffuse lower-grade glioma based on immunological profiling. Mol Oncol. (2020) 14:2081–95. doi: 10.1002/1878-0261.12707
6. Gusyatiner O, Hegi ME. Glioma epigenetics: from subclassification to novel treatment options. Semin Cancer Biol. (2018) 51:50–8. doi: 10.1016/j.semcancer.2017.11.010
7. Su YT, Chen R, Wang H, Song H, Zhang Q, Chen LY, et al. Novel targeting of transcription and metabolism in glioblastoma. Clin Cancer Res. (2018) 24:1124–37. doi: 10.1158/1078-0432.CCR-17-2032
8. Goldman DA, Hovinga K, Reiner AS, Esquenazi Y, Tabar V, Panageas KS. The relationship between repeat resection and overall survival in patients with glioblastoma: a time-dependent analysis. J Neurosurg. (2018) 129:1231–9. doi: 10.3171/2017.6.JNS17393
9. Adair JE, Beard BC, Trobridge GD, Neff T, Rockhill JK, Silbergeld DL, et al. Extended survival of glioblastoma patients after chemoprotective HSC gene therapy. Sci Transl Med. (2012) 4:133ra157. doi: 10.1126/scitranslmed.3003425
10. Arita K, Miwa M, Bohara M, Moinuddin FM, Kamimura K, Yoshimoto K. Precision of preoperative diagnosis in patients with brain tumor—a prospective study based on “top three list” of differential diagnosis for 1061 patients. Surg Neurol Int. (2020) 11:55. doi: 10.25259/SNI_5_2020
11. Qi Q, Zhuang L, Shen Y, Geng Y, Yu S, Chen H, et al. A novel systemic inflammation response index (SIRI) for predicting the survival of patients with pancreatic cancer after chemotherapy. Cancer. (2016) 122:2158–67. doi: 10.1002/cncr.30057
12. Fox P, Hudson M, Brown C, Lord S, Gebski V, De Souza P, et al. Markers of systemic inflammation predict survival in patients with advanced renal cell cancer. Br J Cancer. (2013) 109:147–53. doi: 10.1038/bjc.2013.300
13. Xie D, Marks R, Zhang M, Jiang G, Jatoi A, Garces YI, et al. Nomograms predict overall survival for patients with small-cell lung cancer incorporating pretreatment peripheral blood markers. J Thorac Oncol. (2015) 10:1213–20. doi: 10.1097/JTO.0000000000000585
14. van den Boom J, Wolter M, Kuick R, Misek DE, Youkilis AS, Wechsler DS, et al. Characterization of gene expression profiles associated with glioma progression using oligonucleotide-based microarray analysis and real-time reverse transcription-polymerase chain reaction. Am J Pathol. (2003) 163:1033–43. doi: 10.1016/S0002-9440(10)63463-3
15. Phillips HS, Kharbanda S, Chen R, Forrest WF, Soriano RH, Wu TD, et al. Molecular subclasses of high-grade glioma predict prognosis, delineate a pattern of disease progression, and resemble stages in neurogenesis. Cancer Cell. (2006) 9:157–73. doi: 10.1016/j.ccr.2006.02.019
16. Zheng SH, Huang JL, Chen M, Wang BL, Ou QS, Huang SY. Diagnostic value of preoperative inflammatory markers in patients with glioma: a multicenter cohort study. J Neurosurg. (2018) 129:583–92. doi: 10.3171/2017.3.JNS161648
17. Wang PF, Meng Z, Song HW, Yao K, Duan ZJ, Yu CJ, et al. Preoperative changes in hematological markers and predictors of glioma grade and survival. Front Pharmacol. (2018) 9:886. doi: 10.3389/fphar.2018.00886
18. Glass R, Synowitz M. CNS macrophages and peripheral myeloid cells in brain tumours. Acta Neuropathol. (2014) 128:347–62. doi: 10.1007/s00401-014-1274-2
19. El Andaloussi A, Lesniak MS. An increase in CD4+CD25+FOXP3+ regulatory T cells in tumor-infiltrating lymphocytes of human glioblastoma multiforme. Neuro Oncol. (2006) 8:234–43. doi: 10.1215/15228517-2006-006
20. Heimberger AB, Abou-Ghazal M, Reina-Ortiz C, Yang DS, Sun W, Qiao W, et al. Incidence and prognostic impact of FoxP3+ regulatory T cells in human gliomas. Clin Cancer Res. (2008) 14:5166–72. doi: 10.1158/1078-0432.CCR-08-0320
21. Hambardzumyan D, Gutmann DH, Kettenmann H. The role of microglia and macrophages in glioma maintenance and progression. Nat Neurosci. (2016) 19:20–7. doi: 10.1038/nn.4185
22. Muller S, Kohanbash G, Liu SJ, Alvarado B, Carrera D, Bhaduri A, et al. Single-cell profiling of human gliomas reveals macrophage ontogeny as a basis for regional differences in macrophage activation in the tumor microenvironment. Genome Biol. (2017) 18:234. doi: 10.1186/s13059-017-1362-4
23. Li S, Lan X, Gao H, Li Z, Chen L, Wang W, et al. Systemic Inflammation Response Index (SIRI), cancer stem cells and survival of localised gastric adenocarcinoma after curative resection. J Cancer Res Clin Oncol. (2017) 143:2455–68. doi: 10.1007/s00432-017-2506-3
24. Xu L, Yu S, Zhuang L, Wang P, Shen Y, Lin J, et al. Systemic inflammation response index (SIRI) predicts prognosis in hepatocellular carcinoma patients. Oncotarget. (2017) 8:34954–60. doi: 10.18632/oncotarget.16865
25. Dasgupta A, Gupta T, Pungavkar S, Shirsat N, Epari S, Chinnaswamy G, et al. Nomograms based on preoperative multiparametric magnetic resonance imaging for prediction of molecular subgrouping in medulloblastoma: results from a radiogenomics study of 111 patients. Neuro Oncol. (2019) 21:115–24. doi: 10.1093/neuonc/noy093
26. Henker C, Kriesen T, Glass A, Schneider B, Piek J. Volumetric quantification of glioblastoma: experiences with different measurement techniques and impact on survival. J Neurooncol. (2017) 135:391–402. doi: 10.1007/s11060-017-2587-5
27. Paech D, Windschuh J, Oberhollenzer J, Dreher C, Sahm F, Meissner JE, et al. Assessing the predictability of IDH mutation and MGMT methylation status in glioma patients using relaxation-compensated multipool CEST MRI at 7.0 T. Neuro Oncol. (2018) 20:1661–71. doi: 10.1093/neuonc/noy073
28. Zhang ZY, Zhan YB, Zhang FJ, Yu B, Ji YC, Zhou JQ, et al. Prognostic value of preoperative hematological markers combined with molecular pathology in patients with diffuse gliomas. Aging. (2019) 11:6252–72. doi: 10.18632/aging.102186
29. Harrell FE Jr, Lee KL, Matchar DB, Reichert TA. Regression models for prognostic prediction: advantages, problems, and suggested solutions. Cancer Treat Rep. (1985) 69:1071–7.
30. Collins GS, Reitsma JB, Altman DG, Moons KG, Group T. Transparent reporting of a multivariable prediction model for individual prognosis or diagnosis (TRIPOD): the TRIPOD statement. The TRIPOD group. Circuluation. (2015) 131:211–9. doi: 10.1161/CIRCULATIONAHA.114.014508
31. Debray TP, Damen JA, Snell KI, Ensor J, Hooft L, Reitsma JB, et al. A guide to systematic review and meta-analysis of prediction model performance. BMJ. (2017) 356:i6460. doi: 10.1136/bmj.i6460
33. Walter S, Tiemeier H. Variable selection: current practice in epidemiological studies. Eur J Epidemiol. (2009) 24:733–6. doi: 10.1007/s10654-009-9411-2
34. Li W, Nyholt DR. Marker selection by akaike information criterion and bayesian information criterion. Genet Epidemiol. (2001) 21 (Suppl. 1):S272–7. doi: 10.1002/gepi.2001.21.s1.s272
35. Rozet E, Ziemons E, Marini RD, Hubert P. Usefulness of information criteria for the selection of calibration curves. Anal Chem. (2013) 85:6327–35. doi: 10.1021/ac400630k
36. Harrell FE Jr Califf RM, Pryor DB, Lee KL, Rosati RA. Evaluating the yield of medical tests. JAMA. (1982) 247:2543–6. doi: 10.1001/jama.247.18.2543
37. Tzoulaki I, Liberopoulos G, Ioannidis JP. Use of reclassification for assessment of improved prediction: an empirical evaluation. Int J Epidemiol. (2011) 40:1094–105. doi: 10.1093/ije/dyr013
38. Van Calster B, Wynants L, Verbeek JFM, Verbakel JY, Christodoulou E, Vickers AJ, et al. Reporting and interpreting decision curve analysis: a guide for investigators. Eur Urol. (2018) 74:796–804. doi: 10.1016/j.eururo.2018.08.038
39. Vickers AJ, Cronin AM, Elkin EB, Gonen M. Extensions to decision curve analysis, a novel method for evaluating diagnostic tests, prediction models and molecular markers. BMC Med Inform Decis Mak. (2008) 8:53. doi: 10.1186/1472-6947-8-53
40. Steyerberg EW, Eijkemans MJ, Harrell FE Jr Habbema JD. Prognostic modelling with logistic regression analysis: a comparison of selection and estimation methods in small data sets. Stat Med. (2000) 19:1059–79. doi: 10.1002/(SICI)1097-0258(20000430)19:8<1059::AID-SIM412>3.0.CO;2-0
41. Birkhahn M, Mitra AP, Cote RJ. Molecular markers for bladder cancer: the road to a multimarker approach. Expert Rev Anticancer Ther. (2007) 7:1717–27. doi: 10.1586/14737140.7.12.1717
42. Huang YQ, Liang CH, He L, Tian J, Liang CS, Chen X, et al. Development and validation of a radiomics nomogram for preoperative prediction of lymph node metastasis in colorectal cancer. J Clin Oncol. (2016) 34:2157–64. doi: 10.1200/JCO.2015.65.9128
43. Xie X, Tan W, Chen B, Huang X, Peng C, Yan S, et al. Preoperative prediction nomogram based on primary tumor miRNAs signature and clinical-related features for axillary lymph node metastasis in early-stage invasive breast cancer. Int J Cancer. (2018) 142:1901–10. doi: 10.1002/ijc.31208
44. Dihge L, Bendahl PO, Ryden L. Nomograms for preoperative prediction of axillary nodal status in breast cancer. Br J Surg. (2017) 104:1494–505. doi: 10.1002/bjs.10583
45. Liu X, Li Y, Qian Z, Sun Z, Xu K, Wang K, et al. A radiomic signature as a non-invasive predictor of progression-free survival in patients with lower-grade gliomas. Neuroimage Clin. (2018) 20:1070–7. doi: 10.1016/j.nicl.2018.10.014
46. Muccio CF, Tedeschi E, Ugga L, Cuocolo R, Esposito G, Caranci F. Solitary cerebral metastases vs. high-grade gliomas: usefulness of two MRI signs in the differential diagnosis Anticancer Res. (2019) 39:4905–9. doi: 10.21873/anticanres.13677
47. Gillies RJ, Kinahan PE, Hricak H. Radiomics: images are more than pictures, they are data. Radiology. (2016) 278:563–77. doi: 10.1148/radiol.2015151169
48. Kelly PJ, Daumas-Duport C, Kispert DB, Kall BA, Scheithauer BW, Illig JJ. Imaging-based stereotaxic serial biopsies in untreated intracranial glial neoplasms. J Neurosurg. (1987) 66:865–74. doi: 10.3171/jns.1987.66.6.0865
49. Hanahan D, Weinberg RA. Hallmarks of cancer: the next generation. Cell. (2011) 144:646–74. doi: 10.1016/j.cell.2011.02.013
50. Diakos CI, Charles KA, McMillan DC, Clarke SJ. Cancer-related inflammation and treatment effectiveness. Lancet Oncol. (2014) 15:e493–503. doi: 10.1016/S1470-2045(14)70263-3
Keywords: preoperative prediction, GBM, nomogram, integrated profiling, diagnosis
Citation: Wu W, Deng Z, Alafate W, Wang Y, Xiang J, Zhu L, Li B, Wang M and Wang J (2020) Preoperative Prediction Nomogram Based on Integrated Profiling for Glioblastoma Multiforme in Glioma Patients. Front. Oncol. 10:1750. doi: 10.3389/fonc.2020.01750
Received: 27 April 2020; Accepted: 05 August 2020;
Published: 21 October 2020.
Edited by:
Giuseppe Lombardi, Veneto Institute of Oncology (IRCCS), ItalyReviewed by:
Tamara Ius, University Hospital of Udine, ItalyGiovanni Sabatino, Mater Olbia Hospital, Italy
Copyright © 2020 Wu, Deng, Alafate, Wang, Xiang, Zhu, Li, Wang and Wang. This is an open-access article distributed under the terms of the Creative Commons Attribution License (CC BY). The use, distribution or reproduction in other forums is permitted, provided the original author(s) and the copyright owner(s) are credited and that the original publication in this journal is cited, in accordance with accepted academic practice. No use, distribution or reproduction is permitted which does not comply with these terms.
*Correspondence: Jia Wang, amlhd2FuZ194anR1QDE2My5jb20=; Maode Wang, bWFvZGV3YW5nQDE2My5jb20=