 Lingyun Wang1†
 Yang Zhang2†Yong Chen1
 Jingwen Tan1Lan Wang1Jun Zhang3Chunxue Yang4
 Qianchen Ma4Yingqian Ge5
 Zhihan Xu5Zilai Pan6Lianjun Du1Fuhua Yan1
 Weiwu Yao7*
 Huan Zhang1*
- 1Department of Radiology, Ruijin Hospital, Shanghai Jiao Tong University School of Medicine, Shanghai, China
- 2Department of Radiology, Zhejiang Provincial People’s Hospital, People’s Hospital of Hangzhou Medical College, Hangzhou, China
- 3Department of Oncology, Ruijin Hospital, Shanghai Jiao Tong University School of Medicine, Shanghai, China
- 4Department of Pathology, Ruijin Hospital, Shanghai Jiao Tong University School of Medicine, Shanghai, China
- 5CHN DI CT Collaboration, Siemens Healthineers Ltd, Shanghai, China
- 6Department of Radiology, Ruijin Hospital North, Shanghai Jiao Tong University School of Medicine, Shanghai, China
- 7Department of Radiology, Tongren Hospital, Shanghai Jiao Tong University School of Medicine, Shanghai, China
Objectives: The aim was to determine whether the dual-energy CT radiomics model derived from an iodine map (IM) has incremental diagnostic value for the model based on 120-kV equivalent mixed images (120 kVp) in preoperative restaging of serosal invasion with locally advanced gastric cancer (LAGC) after neoadjuvant chemotherapy (NAC).
Methods: A total of 155 patients (110 in the training cohort and 45 in the testing cohort) with LAGC who had standard NAC before surgery were retrospectively enrolled. All CT images were analyzed by two radiologists for manual classification. Volumes of interests (VOIs) were delineated semi-automatically, and 1,226 radiomics features were extracted from every segmented lesion in both IM and 120 kVp images, respectively. Spearman’s correlation analysis and the least absolute shrinkage and selection operator (LASSO) penalized logistic regression were implemented for filtering unstable and redundant features and screening out vital features. Two predictive models (120 kVp and IM-120 kVp) based on 120 kVp selected features only and 120 kVp combined with IM selected features were established by multivariate logistic regression analysis. We then build a combination model (ComModel) developed with IM-120 kVp signature and ycT. The performance of these three models and manual classification were evaluated and compared.
Result: Three radiomics models showed great predictive accuracy and performance in both the training and testing cohorts (ComModel: AUC: training, 0.953, testing, 0.914; IM-120 kVp: AUC: training, 0.953, testing, 0.879; 120 kVp: AUC: training, 0.940, testing, 0.831). All these models showed higher diagnostic accuracy (ComModel: 88.9%, IM-120 kVp: 84.4%, 120 kVp: 80.0%) than manual classification (68.9%) in the testing group. ComModel and IM-120 kVp model had better performances than manual classification both in the training (both p<0.001) and testing cohorts (p<0.001 and p=0.034, respectively).
Conclusions: Dual-energy CT-based radiomics models demonstrated convincible diagnostic performance in differentiating serosal invasion in preoperative restaging for LAGC. The radiomics features derived from IM showed great potential for improving the diagnostic capability.
Introduction
Stomach cancer remains prevalent worldwide. There were over 1,000,000 new cases in 2018 from the disease, which resulted in an estimated 783,000 deaths (1 in every 12 deaths globally), making it the fifth most frequently diagnosed cancer and the third leading cause of cancer death. The incidence of stomach cancer in east Asia, particularly in China, is much higher than in any other region of the world (1). The high mortality rate is largely due to late diagnosis at locally advanced gastric cancer(LAGC) (2).Neoadjuvant chemotherapy(NAC) has been shown to significantly increase the curative resection rate, disease-free survival, and overall survival from this disease (3, 4). Serosal invasion and lymph node status after NAC were established to be independent prognostic factors (5, 6).
Endoscopic ultrasound (EUS) and computed tomography (CT) are the most frequently used methods for preoperative staging of gastric cancer and the accuracy varies among different studies: 78%–92% and 77%–89% for T staging and 57%–91% and 71%–90% for N staging for EUS and CT respectively (7–10). However, the accuracy of T and N restaging after NAC decreased to 47% and 39% by EUS, and to 57% and 37% by CT, respectively (11, 12). Compared with primary staging, restaging after NAC has been shown to be inaccurate and unreliable. The radiologic T stages were not significantly correlated with pathologic T stages, whereas the radiologic N and pathologic N stages were significantly correlated (12). At present, no diagnostic modality has been accepted as an effective method for restaging, particularly in T-restaging, which was once regarded as too weak for clinical decision-making. The accurate assessment of clinical T-restaging, particularly with the invasion of serosa after NAC, is critical for operative decision-making, as well as to evaluate prognosis. Therefore, improving the accuracy of restaging of serosal invasion after NAC is particularly critical.
Dual-energy CT (DECT) emerged as a cutting-edge technique that embraced a material decomposition algorithm (13, 14) to separate different materials and obtain quantitative material concentrations, such as iodine uptake (IU, mg/ml). Preliminary studies have reported the use of the IU in different tumors (15–17). A study in 2015 reported the utility of IU in evaluating the response after NAC in gastric cancer (14). However, this study only enrolled 20 patients, and the regions of interests (ROIs) were traced in round or oval shapes, which indicated that the diagnostic value of DECT had not yet been fully evaluated. In addition, there exist no related studies that assess the capacity of IU for restaging after chemotherapy in LAGC patients.
Radiomics extracts high-throughput quantitative imaging features and can characterize the spatial relationships and consistency of signal intensities within the tumor region. It has demonstrated the ability to predict treatment response or prognosis across a range of cancer types and imaging modalities, such as hepatocellular carcinoma, rectal cancer, breast cancer, and prostate cancer (18–20). By extracting image features such as shape, size, texture, and density, the images were then transformed into mineable high-dimensional data which improved medical decision-making and personalized precision medicine (19, 21). In addition, radiomics has shown its superiority in diagnosing lymph node metastasis and occult peritoneal metastasis (22, 23). However, the diagnosis value of radiomics, particularly combined with dual-energy technology in gastric cancer patients after NAC, remains unclear.
Our aim in this study was to explore the prediction performance of dual-energy CT-derived radiomics models and the incremental diagnostic value of IM features in preoperative restaging of serosal invasion with LAGC after NAC.
Materials and Methods
Patients
This study was approved by our Ethical Committee, and informed consent was waived for the patients. All procedures involving human participants adhered to the tenets of the Declaration of Helsinki.
A total of 184 patients were retrospectively enrolled from June 2014 to June 2018. The inclusion criteria were as follows: (1) confirmed gastric cancer by gastroscopic biopsy; (2) standard NAC before surgery; (3) availability of the pathology results after surgery; and (4) a visible tumor defined as cT2-4a/bNxM0 on CT images and CT scan performed ≤ 3 weeks before NAC and again ≤ 3 weeks before surgery, according to the gastric cancer CT protocol. The exclusion criteria were as follows: (1) insufficient CT imaging quality due to movement artifacts or other reasons (n=15); (2) any patients who did not complete NAC due to drug toxicity or disease progression (n=11); or (3) a history of previous or other concurrent tumor anywhere in the body (n=3). Ultimately, 155 patients were enrolled in our study (Figure 1). The median interval and interquartile range (IQR) between re-staging CT and surgery is 5 (IQR=2-6) days. The enrolled patients were randomly divided into a training cohort and testing cohort at the ratio of 7:3(110 and 45 patients), respectively, for model establishment and assessment.
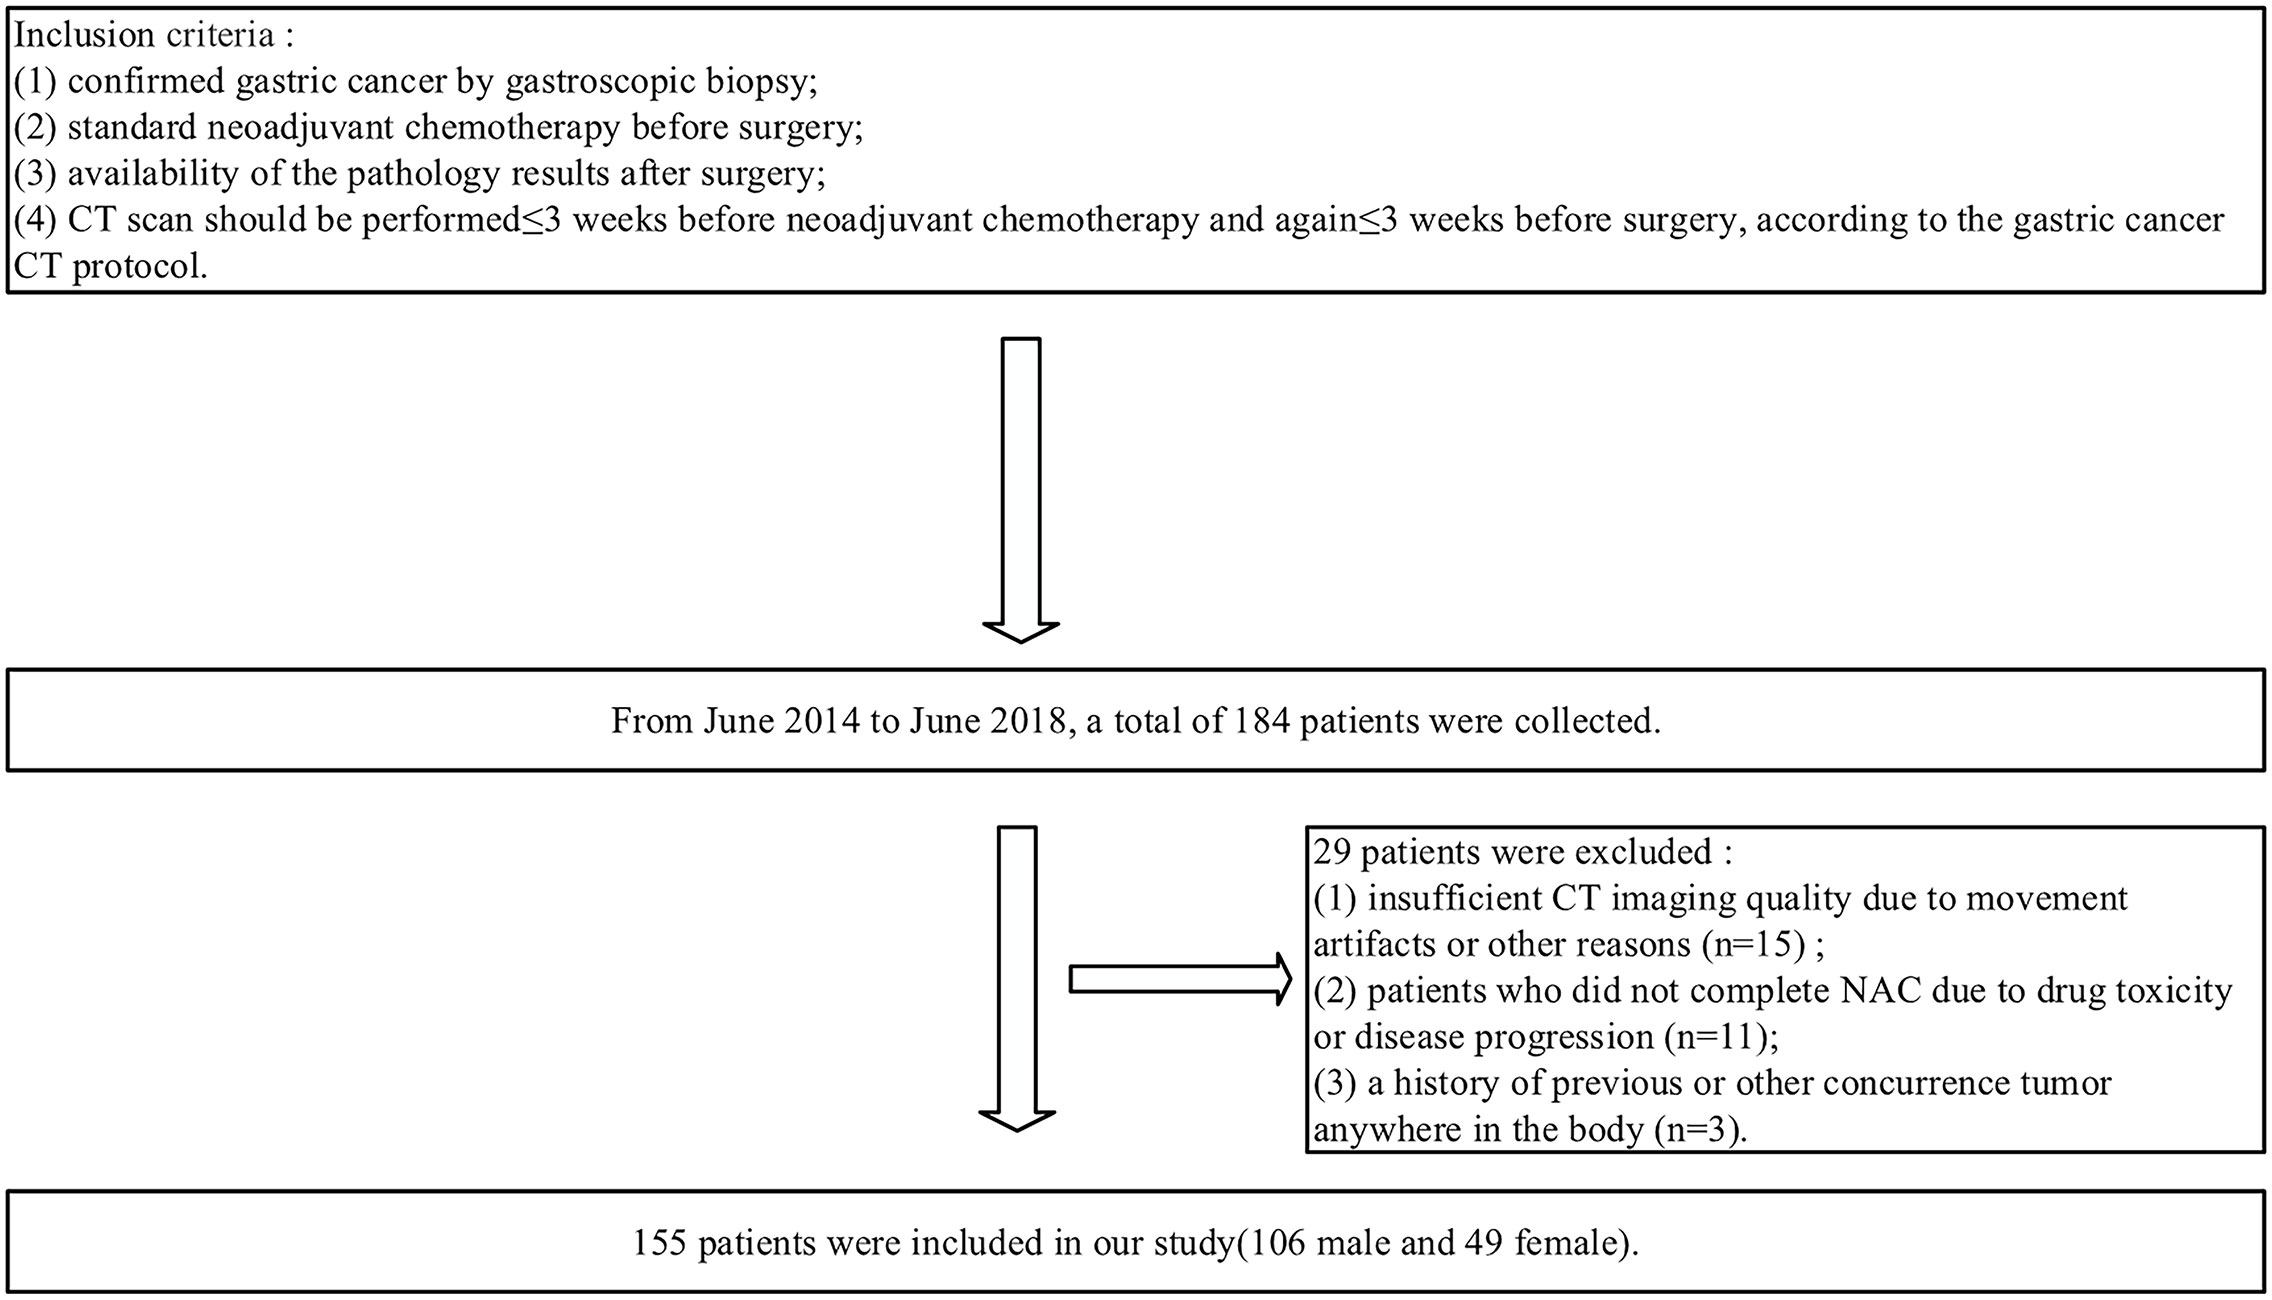
Figure 1 Flowchart of study enrollment.
Neoadjuvant Chemotherapy
In our study, NAC for enrolled patients was administered according to the MAGIC study (24), which comprised three preoperative cycles of intravenous epirubicin (50 mg/m² of body-surface area) and cisplatin (60 mg/m²) on day 1, a continuous intravenous infusion of fluorouracil (200 mg/m²) for 21 days, and three postoperative cycles of the same regimen.
Surgical and Pathological Evaluation
All the patients underwent gastrectomy with a standard D2 lymphadenectomy within three weeks after completion of chemotherapy (25, 26). Two pathologists (Ma QC and Yang CX) independently analyzed the surgical specimens for the invasion depth of the gastric wall (ypT staging) according to the pathologic TNM staging system developed by the American Joint Committee on Cancer and the International Union Against Cancer (25, 27). In addition, we also collected clinical factors including sex, location of the tumor, Borrmann type and tumor makers of all patients after chemotherapy, including alpha fetoprotein (AFP, normal reference value: <8.78ng/mL), carcinoembryonic antigen (CEA, normal reference value: <5ng/ml), carbohydrate antigen 125(CA 125, normal reference value: <35U/mL), carbohydrate antigen 724 (CA 724, normal reference value: <8.2U/mL), carbohydrate antigen (CA 199, normal reference value: <35U/mL) for univariate analysis.
CT Image Acquisition
All gastric CT scans were performed using a third-generation dual-source scanner (SOMATOM Force; Siemens Healthineers, Forchheim, Germany) with the same scan protocol. All the patients were placed in a supine position on the scanner, and the parameters were set as follows (28): tube voltage A 90 kVp; effective tube current-time product 200mAs; tube voltage B 150 kVp; effective tube current-time product 125mAs; FOV: 374×374 mm; rotation time: 5 s; pitch: 0.6; kernel: Qr40; and collimation: 128*0.6 mm. All the patients were required to fast for 6 -8 h and drink 1000-1500ml of water before the CT scan. Using the test bolus technique, 16 mL of contrast agent, as a test bolus, was injected to monitor the time to reach the peak of the celiac trunk. Then, the main contrast agent (Ultravist; Schering, Berlin, Germany) was injected intravenously through the cubital vein at a flow rate of 3 ml/s (1.5 ml/kg body weight) using a CT-compatible power injector. Two phase-enhanced DECT scans were performed, including the arterial phase (at the beginning of the peak of the celiac trunk) and portal phase (delays 20 seconds after the peak of the celiac trunk).
All portal phase datasets were reconstructed with 1.5 mm slice thickness and delivered to a dedicated workstation with dual-energy software (Syngo.via, Version VB10, Siemens Healthineers, Forchheim, Germany) for further dual-energy image post processing. In addition, 120-kV equivalent mixed images were generated, linearly blended with a weighted factor of 0.6 (120 kVp), and the iodine maps (IM) were reconstructed and obtained from the dual-energy datasets (13, 29). The iodine map was based on the dual-energy, 3-material decomposition algorithm and represented the absolute iodine uptake value in the field of view (30). These two types of images were ultimately acquired for analysis.
Image Analysis and Manual Classification
All 120 kVp CT images were independently analyzed by two radiologists experienced in gastrointestinal diseases (ZP and Ding B, both with more than 20 years of experience in the diagnosis of abdominal diseases). Both readers were partially blinded to the gastroscopic results (they knew that the patients had gastric cancer that had been diagnosed by endoscopic biopsy) and were completely unaware of the location, size, macroscopic features, and stage of gastric cancers. The inter-observer agreement of the two radiologists’ assessment of preoperative tumor restaging after NAC (ycT) were tested using weighted kappa statistics. The depth of tumor invasion judged by CT is based on the studies of Hasegawa and Habermann CR (31, 32). T1 tumors were defined as a tumor that cannot be seen on image or with focal thickening of the inner layer, visible in the outer layer of the gastric wall, and surrounded by a clear fat plane. T2 tumors were defined as localized or diffuse thickening of the gastric wall with transmural involvement and a smooth outer border of the wall or only a few small linear strands of soft tissue extending into the fat plane involving less than one-third of the tumor extent. T3 tumors were defined as transmural tumors with obvious blurring of at least one-third of the tumor extent or wide reticular strands surrounding the outer edge of the tumor. T4 tumors were defined as tumors in which the fat plane between the gastric tumor and the adjacent organs disappears or invaded the adjacent organs. T1, T2, and T3 tumors were defined as serosal invasion negative and T4 as serosal invasion positive.
All of the lesions were manually classified into a serosal invasion-negative group (−) and serosal invasion-positive group (+) by the radiologists on portal phase images. Finally, 57 cases of serosal invasion (−) and 98 cases of serosal invasion (+) were diagnosed.
Tumor Segmentation and Feature Extraction
Tumor segmentation and feature extraction were conducted with radiomics software (Radiomics 1.0.9a, Siemens Healthineers, Germany) on a research platform (Syngo.Via VB10, Research Frontier, Siemens Healthineers, Germany) (33). Two radiologists (Pan ZL and Du LJ) independently preformed tumor segmentation. Both of them were blinded to the pathological data but were informed that all the patients had gastric cancer. Volumes of interest (VOIs) were delineated semi-automatically in three dimensions on both 120 kVp images and were automatically matched to the IM images (Figure 2). Fat tissues or adjacent organs were excluded on coronal and sagittal panels. To ensure the consistency of the sketch between the two radiologists, 40 patients were randomly selected for secondary delineation.
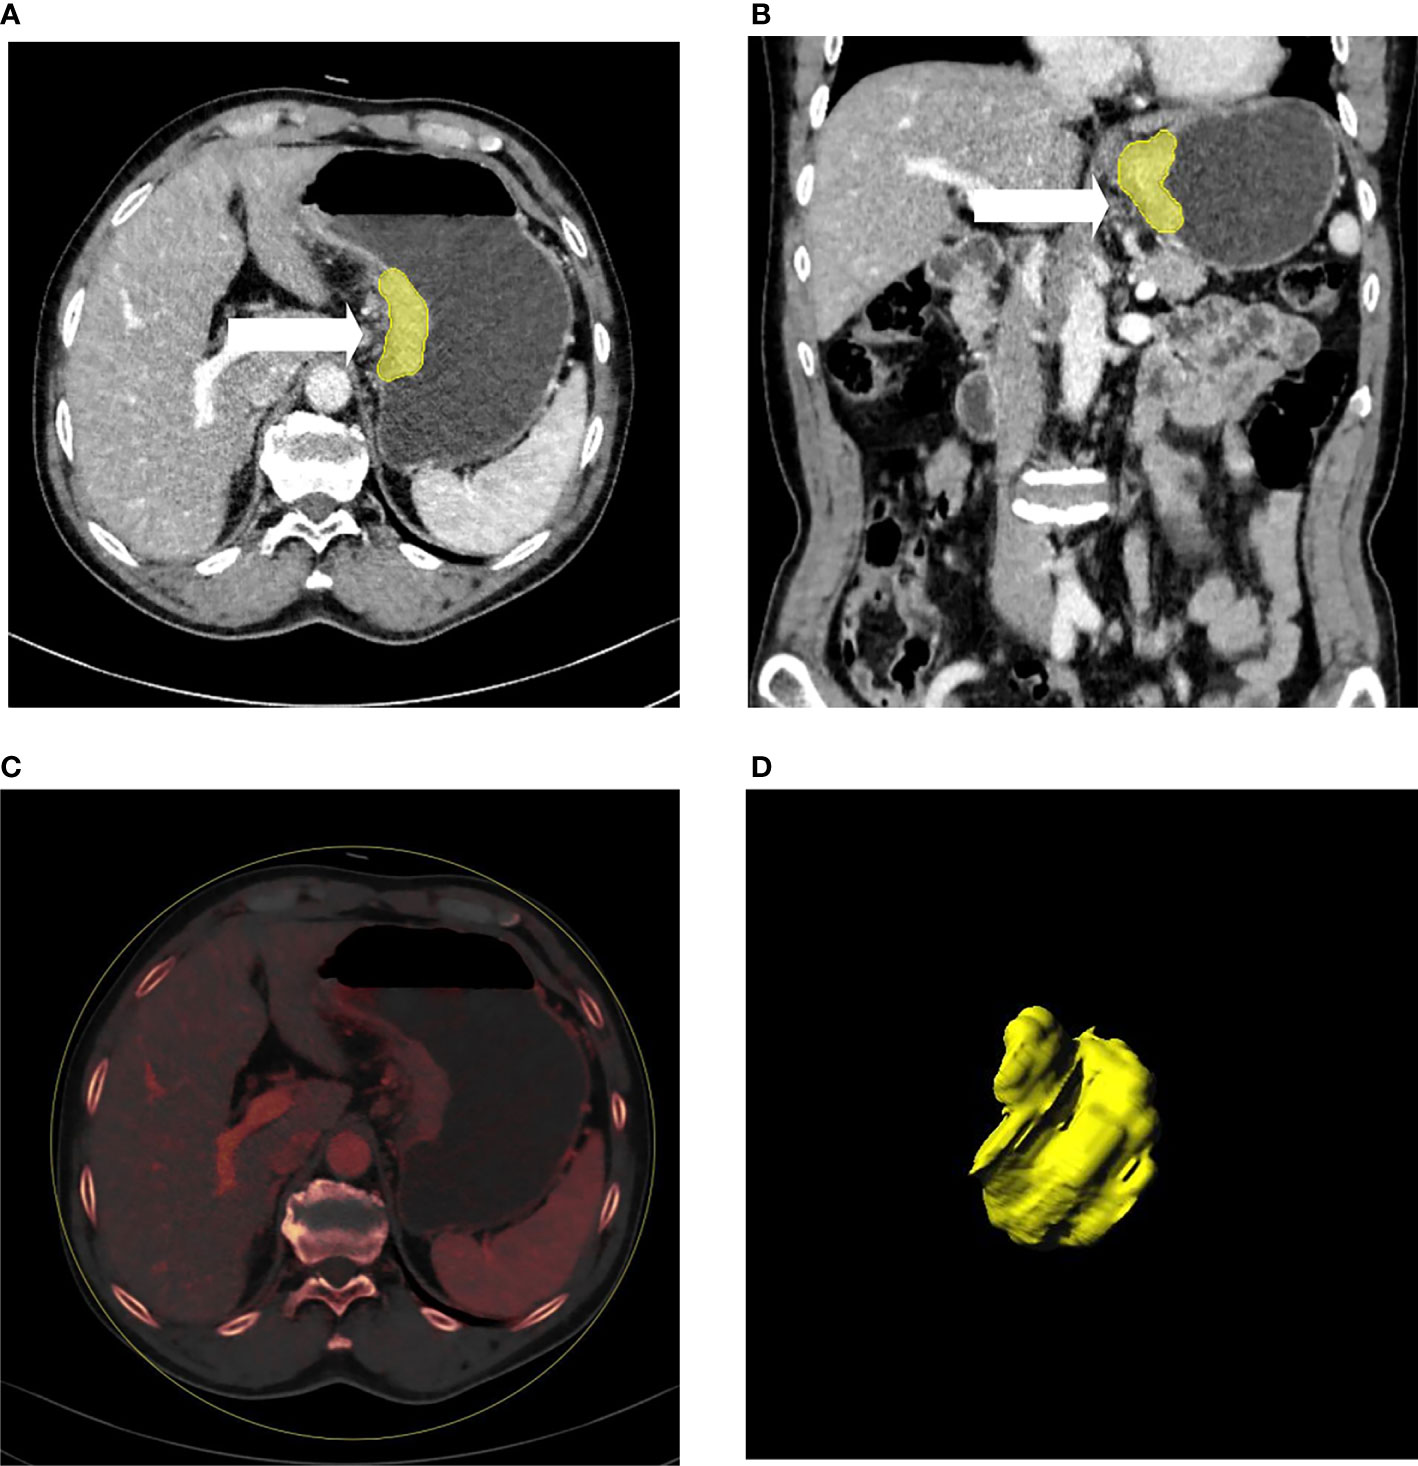
Figure 2 A patient with gastric cancer located in the cardia and lesser curve of the stomach (A–D). Axial (A) and coronal (B) multiplanar reconstruction from portal phase images showed abnormal enhancement accompanied by wall thickening of the stomach. The irregular outer layer of the gastric wall, blurring, and reticular strands surrounding the outer border (arrow heads) indicated that this patient was serosal invasion-positive, which was proven by histology. (C) showed the iodine map of the lesion. 3D reconstruction of the lesion is displayed (D).
The computation of radiomics features from VOIs of both 120 kVp and IM-120 kVp images was based on the PyRadiomics library (33). The extracted features were reproducible and matched the benchmarks of IBSI (34). In each set, there were 1,226 radiomics features extracted for each patient, including 234 first-order features, 17 shape features, and 975 texture features (texture features based on Gray Level Co-occurrence Matrix (GLCM) Features, Gray Level Size Zone Matrix (GLSZM) Features, Gray Level Run Length Matrix (GLRLM) Features, Gray Level Dependence Matrix (GLDM) Features, and Neighboring Gray Tone Difference Matrix (NGTDM) Features). A variety of options including Laplacian of Gaussian filtering, wavelet filtering, and non-linear intensity transforms including square, square root, logarithm and exponential, were provided by the software to customize image pre-processing before feature extraction.
Feature Selection and Model Establishment
The feature stability and repeatability were initially evaluated. To reduce the influence in the manual segmentation, we calculated the consistency of all the extracted features (120 kVp and IM) by using Spearman’s rank (SR) correlation method. Setting the threshold of Spearman as 0.8, features with high consistency (SR > 0.8) were selected.
After consistency analysis, least absolute shrinkage and selection operator (LASSO), which is appropriate for high-dimensional, low-sample size data with collinearity (35), was performed to screen out vital features for further analysis. Ten-fold cross-validation and minimum deviance information were used as the feature screening criteria. In our study, a multivariant logistic regression algorithm was applied as a classification model built with the remaining features. Based on these selected features with nonzero coefficients, two radiomics models were ultimately established: 120 kVp model (built with features extracted from 120 kVp images only) and IM-120 kVp model (built with features extracted from both 120 kVp and IM-120 kVp images). The process of LASSO is shown in Figure 3. In addition, a combination model (ComModel) was developed by adding independent preoperative predictors of serosal invasion from significant clinical characteristics for further evaluating the predictive value of dual-energy radiomics signatures.
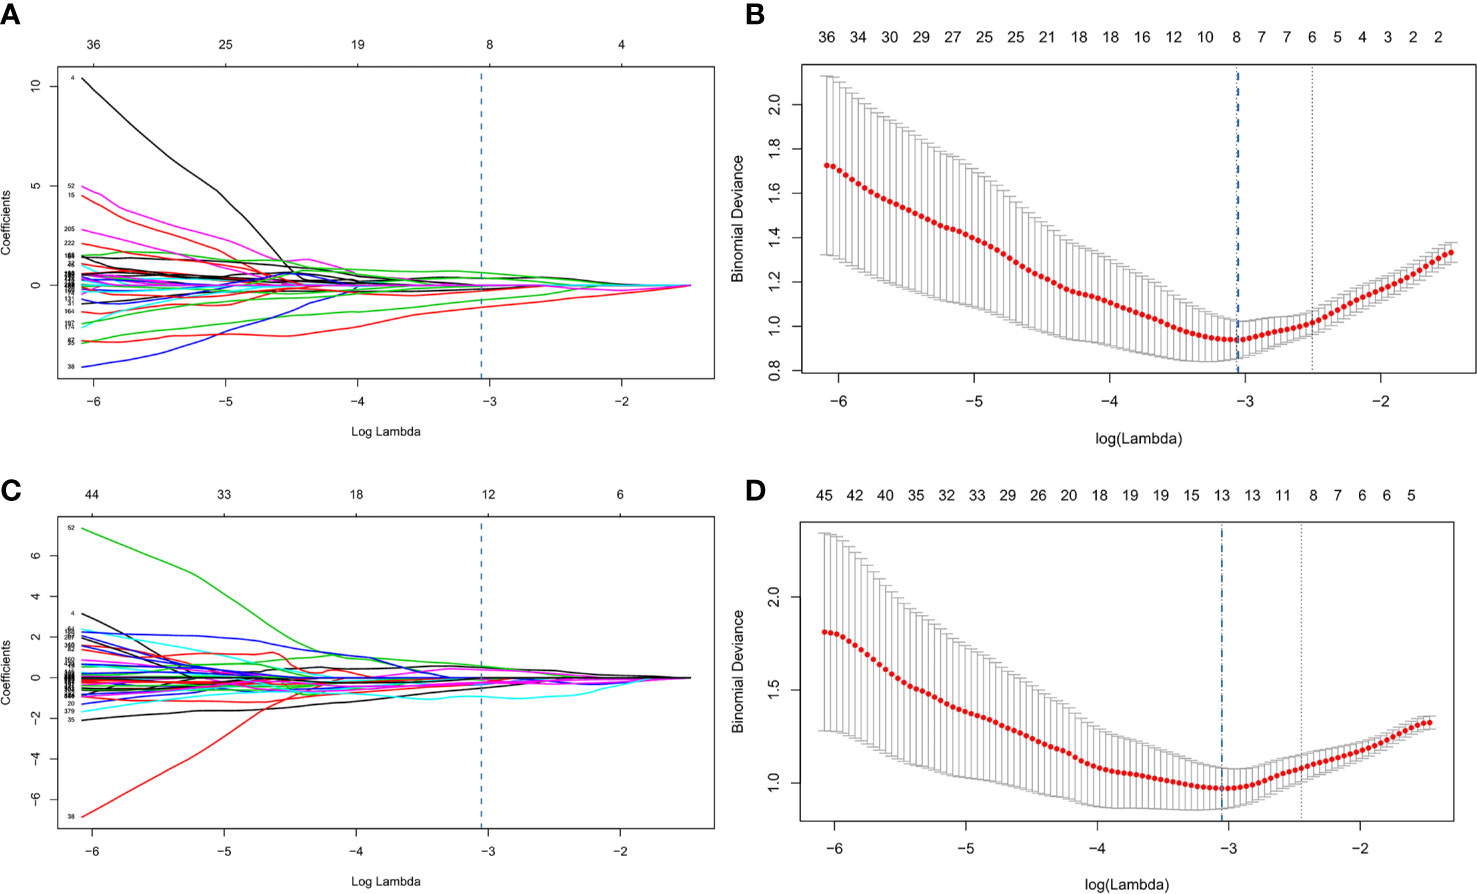
Figure 3 Process of least absolute shrinkage and selection operator (LASSO) logistic regression (A–D). (A, B) represented LASSO logistic regression of 120 kVp features and (C, D) represented LASSO logistic regression of IM-120 kVp features. (A, C) showed LASSO coefficient profiles for the 1,226 features. The vertical line showed the optimal value of λ (λ=0.046 for 120 kVp, λ=0.0445 for IM-120 kVp) resulting in eight and thirteen non-zero features, respectively, for 120 kVp and IM-120 kVp. (B, D) showed that the area under the curve (AUC) curve was plotted by the tuning parameter (λ) selection performed by 10-fold cross-validation with the minimum deviance criterion.
Model Performance and Comparison
The performance of all prediction models was evaluated by the receiver operating characteristics (ROC) curve and area under the curve (AUC). The optimal thresholds of the odds for different models were determined by maximizing Youden’s J statistics. Sensitivity, specificity, accuracy, and the AUC were reported, as well as the 95% confidence intervals (CIs). The confusion matrix was also derived to illustrate the prediction ability. Furthermore, a diagnostic accuracy for detecting serosal invasion was calculated for all the models. In terms of the comparison of diagnostic efficiency among different models, DeLong’s test was conducted with significant differences set at p <0.05. Regarding to the goodness of fit of models, the calibration curve and Brier score were implemented for three regression models (120 kVp, IM-120 kVp and ComModel). Additionally, decision curve analysis (DCA) was performed for all diagnostic models to further assessing clinical gain. Figure 4 shows the flowchart of our study.
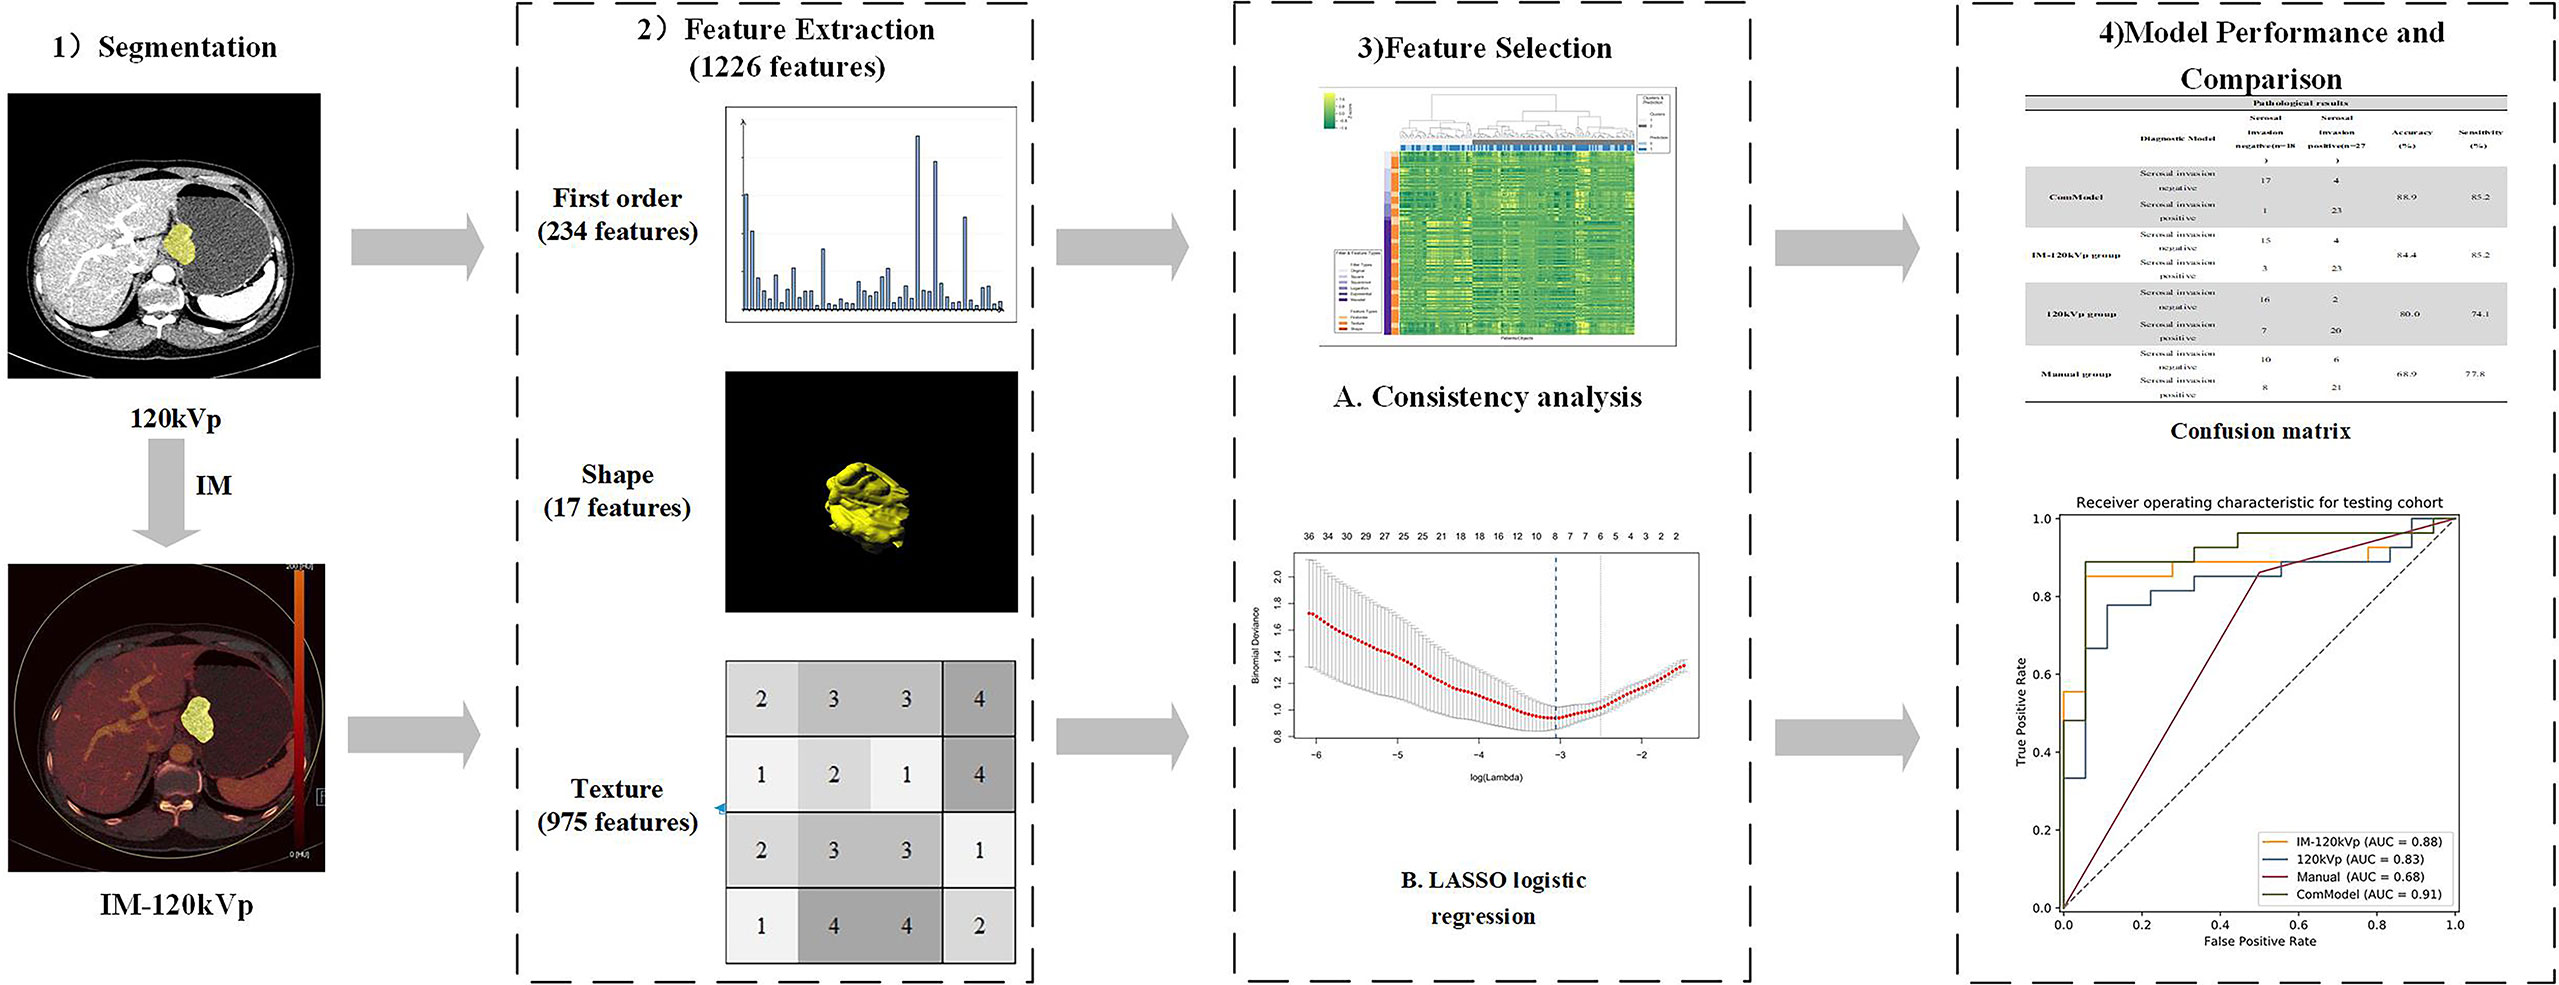
Figure 4 Flowchart of our study.
Statistical Analysis
Descriptive analysis was performed to describe the distribution of the variables of interest for the training and testing cohorts. The Kolmogorov-Smirnov test was used to test the normality of all the continuous variables. Student’s t-test or Wilcoxon rank sum test was used to compare normally or abnormally distributed continuous variables between the serosal invasion-positive and serosal invasion-negative groups, respectively. Categorical variables were compared between two groups using the chi-squared test or Fisher’s exact test, as appropriate. Inter-observer agreement was evaluated using the kappa coefficient. All tests were two-sided and p<0.05 was considered statistically significant. Feature selection, and model establishment and performance assessment were performed using the R software package (version 3.6.2). Other statistical analyses were implemented with SPSS (Version 25; IBM Corporation; Armonk, NY) and Medcalc Statistical Software (MedCalc Software, Ostend, Belgium; 2018).
Results
Clinical Characteristics of the Patients
Table 1 describe the characteristics of the study cohort. The mean ages were 58.58 ± 10.12 and 59.66 ± 11.60 for training group and testing group, respectively. There was no bias for serosal invasion in the two groups (p = 0.595, x2 = 0.282). Among all of the preoperative clinical factors, including sex, location of the tumor, Borrmann type and tumor markers were not significantly associated with serosal invasion after univariate analysis except ycT (both p<0.001, x2 = 19.563 and 32.308 for training group and testing group respectively), which was determined by radiologists as positive or negative.
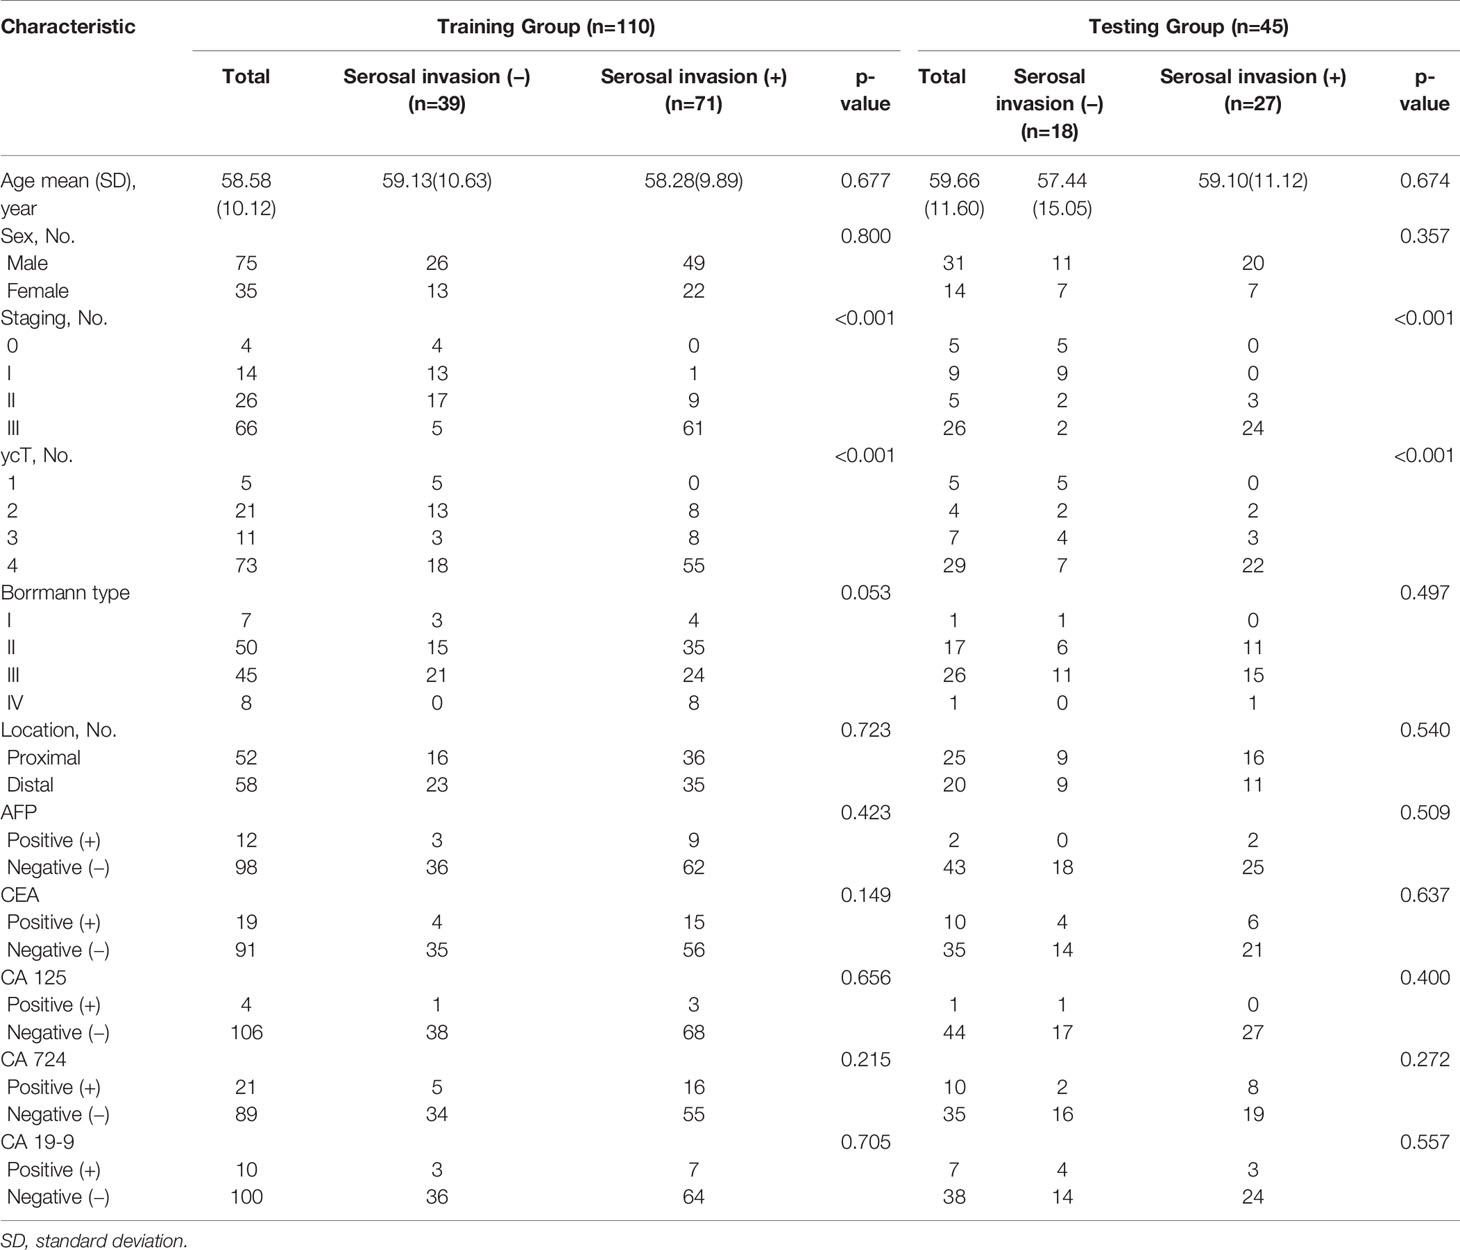
Table 1 Characteristics of the patients.
Radiomics Models Building and Validation
After consistent analysis, 234 features from the 120 kVp group and 468 features from the IM-120 kVp group were selected. Based on this analysis, eight features were selected during LASSO from 120 kVp images (two first-order features, one shape feature, and five gray level features). Through the same process, 13 texture features (six from 120 kVp imaging and seven from IM-120 kVp imaging), three first-order features and 10 gray level features were selected for the IM-120 kVp model (Supplementary 1). The details of the selected features (boxplots and heatmaps) for two models are recorded in Supplementary figures A–D. Features contained in the models (and their coefficients) are shown in Table 2. Based on the 120 kVp images set, the model reached an AUC of 0.940 (95% CI: 0.8993–0.9805) in the training cohort (Figure 5A). The IM-120 kVp model revealed some improvement, with an AUC of 0.953 (95% CI: 0.9185–0.9875). In addition, a ComModel, developed with IM-120 kVp signature and ycT showed similar performance with an AUC of 0.953 (95% CI: 0.9173–0.9894). There was no significant difference between these three models (p=0.4 between IM-120 kVp model and 120kVp model, p=0.989 between ComModel and IM-120 kVp model, p=0.628 between ComModel and 120 kVp model). For the testing cohort, ComModel demonstrated a slightly better predictive performance for the detection of serosal invasion (AUC=0.914, 95% CI: 0.8219–1.000) than IM-120 kVp (AUC=0.879, 95% CI: 0.7685–0.9887, p=0.203) and a significant improvement in diagnose ability than 120 kVp (AUC=0.831, 95% CI: 0.7058–0.9568, p=0.018, Figures 5A, B). While IM-120 kVp (AUC=0.879, 95% CI: 0.7685–0.9887) model also showed significant better performance than 120 kVp (AUC=0.831, 95% CI: 0.7058–0.9568, p=0.040, Figures 5A, B) model in testing group.
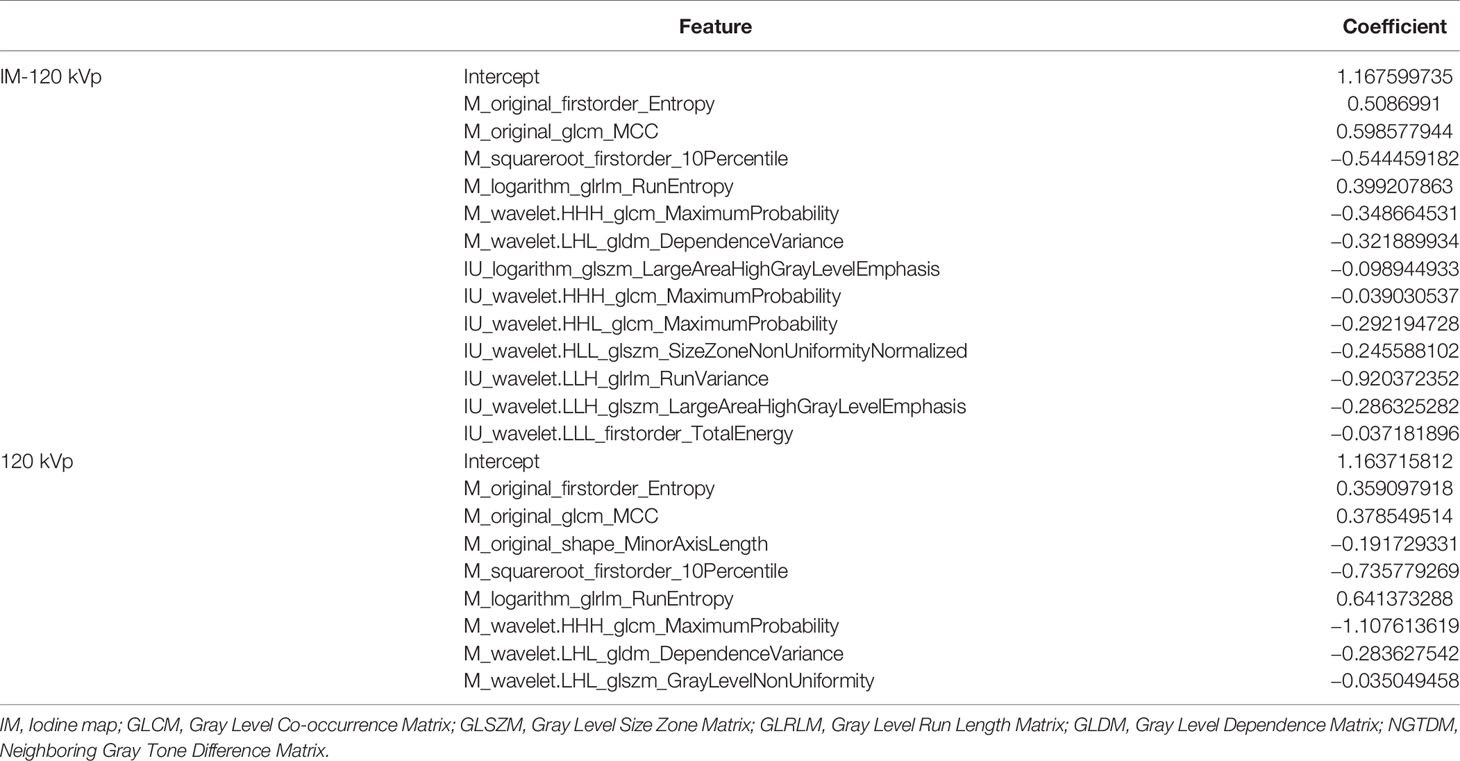
Table 2 Features contained in the models and their coefficients.
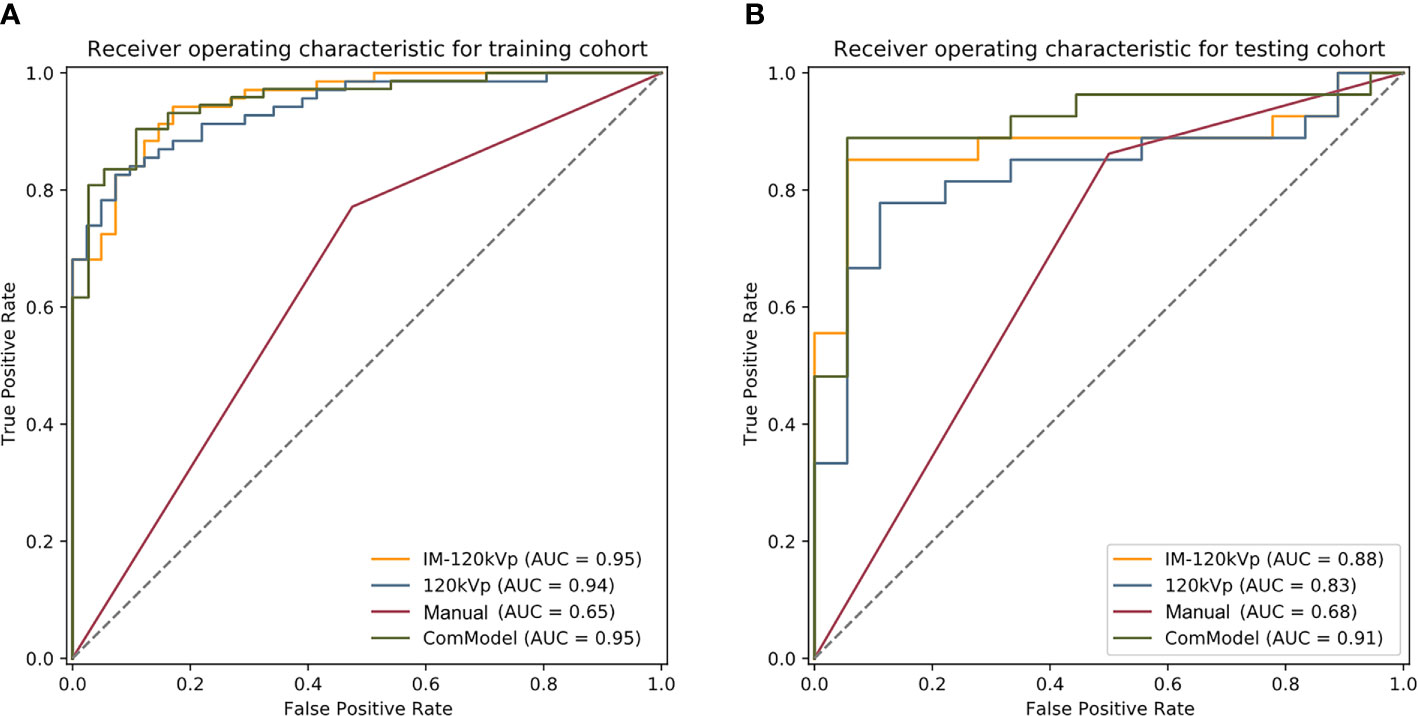
Figure 5 (A, B) Comparison among the four groups for the training and testing group, respectively.
Performance Comparison Between the 120 kVp Model, IM-120 kVp Model, ComModel and Manual Classification
Regarding the manual classification, the k value for inter-observer agreement was 0.823 (95% CI: 0.732–0.913), which showed good agreement. The AUC of the classification was 0.648 (95%CI: 0.5555–0.7409) and 0.681 (95% CI: 0.5393–0.8228) for the training and testing cohorts, respectively. According to the calibration curve and Brier score, ComModel showed best goodness of fit than IM-120 kVp and 120 kVp groups (Brier score=0.081, 0.101 and 0.116, respectively for ComModel, IM-120 kVp and 120 kVp groups) (Supplement Figure E). Subsequently, we separately compared the AUC between the ComModel, IM-120 kVp, 120 kVp and manual groups. For the training cohort, the ComModel, IM-120 kVp, 120 kVp models showed significant differences in comparison with manual classification (p<0.001). For the testing cohort, the ComModel showed significant improvement than the manual group (p<0.001), the p value between the IM-120 kVp group and manual group was 0.034, whereas the 120 kVp group did not display superiority (p=0.124). In terms of the clinical gain, decision curve analysis illustrated that ComModel owned larger net benefit among the range of threshold probabilities compared with IM-120 kVp and 120 kVp models (Supplement Figure F). Table 3 summarizes the accuracy, sensitivity, and specificity of the three models and manual classification of the testing group. The comparison among these four groups is shown in Figures 5A, B.
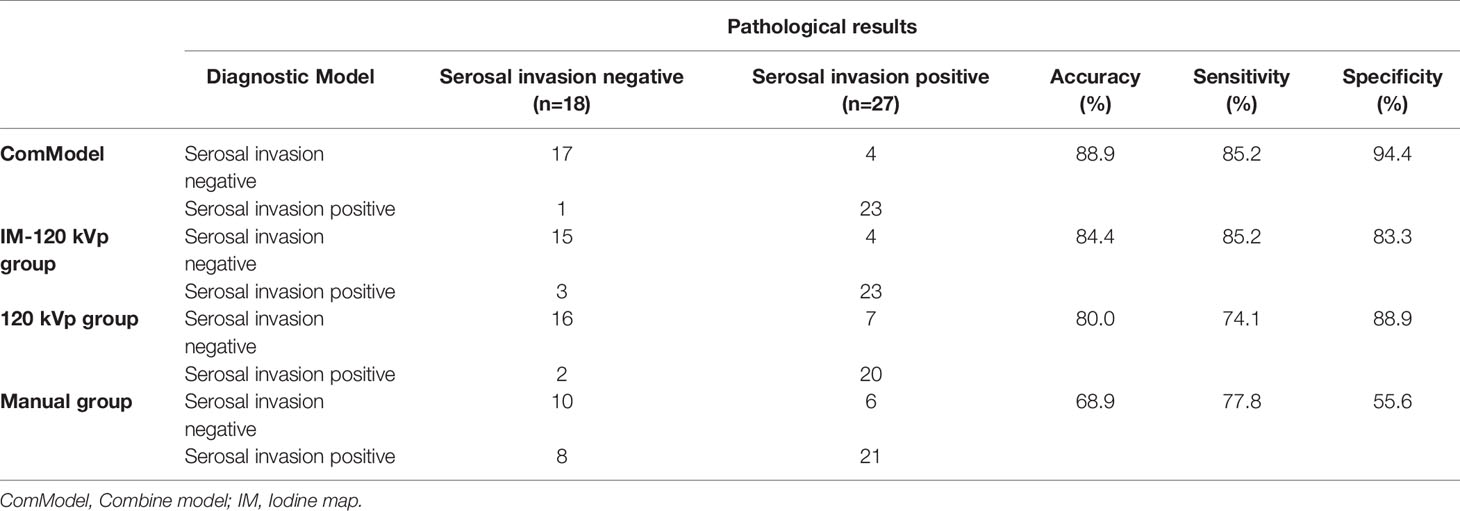
Table 3 Diagnostic performance of three models in testing group.
Discussion
In this study, we developed and validated an IM-120 kVp radiomics model, which was superior to the radiomics model built by conventional 120 kVp, indicating the discrimination value of iodine from DECT for serosal invasion in GC patients after NAC. Furthermore, the ComModel model outperformed 120 kVp model and manual classification, presenting the incremental value in diagnosing serosal invasion. This, provides an assessment tool for treatment strategies for LAGC patients after NAC.
Accurate evaluation of serosal invasion for restaging of LAGC after NAC is critical, as it involves the choice of different interventions and the prognosis of patients. However, previous studies have found that the restaging is unreliable; the accuracy of T staging by CT was between 42.7% and 57% (11, 12). Because of the decreased number of tumor cells, edema, fibrosis, and chronic inflammation after chemotherapy (36), the blurred border of lesions seriously hinders accurate judgment. By extracting high-throughput quantitative imaging features, radiomics can characterize the spatial relationships and consistency of signal intensities within the tumor region (18), showing their utility in discriminating serosal invasion in preoperative staging (37, 38). In summary, our radiomics models performed well in accurately classifying serosal invasion not only in the training cohort, with AUCs of 0.940, 0.953 and 0.953 for the 120 kVp model, IM-120 kVp model and ComModel, respectively, but also in the testing cohort, with the AUCs of 0.831, 0.879 and 0.914, respectively. All revealed better performance than manual classification, especially for the ComModel. Through analysis and calculation of the extracted features, radiomics is helpful for finding small tumor tissue invisible to the naked eye, so it improves the accuracy of diagnosing serosal invasion after NAC. Furthermore, it also reflects the importance of clinical and radiological features in the judgment.
Another finding is that the IM-120 kVp radiomics model showed better discrimination than the 120 kVp model in restaging serosal invasion with LAGC after NAC. Iodine-specific maps have the potential to increase the depiction and characterization of hypoattenuating malignancies by increasing the contrast between a hypoattenuating lesion and normally enhancing parenchyma on the basis of differences in tissue iodine content (39). IU is a feasible biomarker with potential benefit not only in the anti-EGFR therapy response assessment for non-small cell lung cancer but also in predicting the radio-chemotherapy outcome for cervical cancer (40, 41). Chemotherapeutic agents used in NAC can decrease the capacity of the vascular bed and thus reduce the blood supply to tumor tissue (42). Iodine-containing contrast medium reaches tumor tissue via blood perfusion; thus, the iodine concentration in the tumor site can reflect the tumor response to chemotherapy. Both of the radiomics models displayed significant differences when compared with manual classification in the training group, and the model based on IM-120 kVp images also showed significant differences in the testing. Furthermore, iodine map images can slightly improve the accuracy of staging of gastric cancer compared with normal 120 kVp images, so the model based on IM-120 kVp images showed a better performance than the model based on 120 kVp images.
Our findings showed that entropy was closely related to identification of serosal invasion as it was included in both of the two models. Previous studies demonstrated that entropy was connected with a shorter survival time and was useful for risk stratification in gastric cancer and salivary gland carcinoma (43, 44). Heterogeneity is widely recognized as a feature of malignancy associated with cancer treatment failure and thus results in a poor prognosis (45–47). According to our results, many gray level features were screened out and included in our models, as well, inferring that gray level features can contribute to higher diagnostic accuracy. Though-run entropy (RE) was not mentioned in other studies, and their innate meanings were consistent with other gray level features in our model. The heterogeneity information of gastric cancer strongly indicated that intratumor heterogeneity is an essential factor in the restaging of ycT.
Our study had some limitations: First, this was a single-center study. Thus, multicenter validation in a larger sample size is needed to acquire high-level evidence for applying the model to clinical practice. Second, we only considered the restaging of ycT. Given that the restaging of lymph nodes was also an important factor for predicting prognosis, further studies should be designed to evaluate the iodine values of the regional lymph nodes. Third, we still adopt CT staging criteria because there are no studies to date that report on restaging criteria using CT in LAGC patients after NAC. Restaging criteria using CT after NAC for gastric cancer are urgently needed for critical decision-making.
NAC has been shown to significantly increase the curative resection rate, disease-free survival, and overall survival. The accurate assessment of clinical restaging, particularly the invasion of serosa after NAC, is critical for operative decision-making, so as to avoid potential toxicity, as well as to evaluate prognosis. Thus far, no modality has been accepted as an effective diagnostic method. Our dual-energy CT based radiomics models could help differentiate serosal invasion in preoperative restaging for LAGC. The radiomics features derived from IM show great potential in improving the capacity for diagnosis. In addition, a larger group of patient cohorts is needed to validate our models.
Data Availability Statement
The raw data supporting the conclusions of this article will be made available by the authors, without undue reservation.
Ethics Statement
The studies involving human participants were reviewed and approved by Ruijin Hospital Ethics Committee. The patients/participants provided their written informed consent to participate in this study.
Author Contributions
The acquisition, data explanation, and manuscript draft were finished by LYW and YZ. ZP and BD are responsible for the analysis of CT images and the delineation of the VOIs. YC, JT, and LYW acquired the clinical information. JZ guided the chemotherapy regimen used. CY and QM analyzed and explained the pathological analysis. HZ and WY designed the study and made multiple revisions to the manuscript. All authors contributed to the article and approved the submitted version.
Funding
This work was funded by the National Natural Science Foundation of China (81771789, 81771790), Shanghai Science and Technology Commission Science and Technology Innovation Action Clinical Innovation Field (18411953000) and Medical engineering cross research foundation of Shanghai Jiaotong University (YG2019ZDB09).
Conflict of Interest
Authors YG and ZX were employed by the company Siemens Healthineers Ltd.
The remaining authors declare that the research was conducted in the absence of any commercial or financial relationships that could be construed as a potential conflict of interest.
Acknowledgments
We would like to thank Ping Li and Haoliang Sun from Shanghai Engineering Research Center for Broad Technologies and Applications for their help in understanding the technology.
Supplementary Material
The Supplementary Material for this article can be found online at: https://www.frontiersin.org/articles/10.3389/fonc.2020.562945/full#supplementary-material
Abbreviations
AUC, Area under the curve; DECT, Dual-energy CT; EUS, Endoscopic ultrasound; GLCM, Gray Level Co-occurrence Matrix; GLDM, Gray Level Dependence Matrix; GLRLM, Gray Level Run Length Matrix; GLSZM, Gray Level Size Zone Matrix; IM, Iodine map; LAGC, Locally-advanced gastric cancer; LASSO, Least Absolute Shrinkage and Selection Operator; NAC, Neoadjuvant chemotherapy; NGTDM, Neighboring Gray Tone Difference Matrix; ROC, Receiver operating curve; VOI, Volume of interests.
References
1. Bray F, Ferlay J, Soerjomataram I, Siegel RL, Torre LA, Jemal A. Global cancer statistics 2018: GLOBOCAN estimates of incidence and mortality worldwide for 36 cancers in 185 countries. CA Cancer J Clin (2018) 68(6):394–424. doi: 10.3322/caac.21492
2. Poh AR, O’Donoghue RJ, Ernst M, Putoczki TL. Mouse models for gastric cancer: Matching models to biological questions. J Gastroenterol Hepatol (2016) 31(7):1257–72. doi: 10.1111/jgh.13297
3. Ychou M, Boige V, Pignon J-P, Conroy T, Bouché O, Lebreton G, et al. Perioperative Chemotherapy Compared With Surgery Alone for Resectable Gastroesophageal Adenocarcinoma: An FNCLCC and FFCD Multicenter Phase III Trial. J Clin Oncol (2011) 29(13):1715–21. doi: 10.1200/jco.2010.33.0597
4. van Hagen P, Hulshof MCCM, van Lanschot JJB, Steyerberg EW, van Berge Henegouwen MI, Wijnhoven BPL, et al. Preoperative Chemoradiotherapy for Esophageal or Junctional Cancer. N Engl J Med (2012) 366:11. doi: 10.1056/NEJMoa1112088
5. Siewert JR, Böttcher K, Stein HJ, Roder JD. Relevant Prognostic Factors in Gastric Cancer Ten-Year Results of the German Gastric Cancer Study. Ann Surg (1998) 228(4):449–61. doi: 10.1097/00000658-199810000-00002
6. Wang H-h, Huang J-y, Wang Z-n, Sun Z, Li K, Xu H-m. Macroscopic Serosal Classification as a Prognostic Index in Radically Resected Stage pT3–pT4b Gastric Cancer. Ann Surg Oncol (2016) 23(1):149–55. doi: 10.1245/s10434-015-4656-3
7. Chen C-Y, Hsu J-S, Wu D-C, Kang W-Y, Hsieh J-S, Jaw T-S, et al. Gastric Cancer: Preoperative Local Staging with 3D Multi-Detector Row CT – Correlation with Surgical and Histopathologic Results. Radiology (2007) 242:11. doi: 10.1148/radiol.2422051557
8. Zheng Z, Yu Y, Lu M, Sun W, Wang F, Li P, et al. Double contrast-enhanced ultrasonography for the preoperative evaluation of gastric cancer: a comparison to endoscopic ultrasonography with respect to histopathology. Am J Surg (2011) 202(5):605–11. doi: 10.1016/j.amjsurg.2010.09.033
9. Wang J-Y, Hsieh J-S, Huang Y-S, Huang C-J, Hou M-F, Huang T-J. Endoscopic ultrasonography for preoperative locoregional staging and assessment of resectability in gastric cancer. Clin Imaging (1998) 22(5):355–9. doi: 10.1016/S0899-7071(98)00033-3
10. Ahn HS, Lee HJ, Yoo MW, Kim SG, Im JP, Kim SH, et al. Diagnostic accuracy of T and N stages with endoscopy, stomach protocol CT, and endoscopic ultrasonography in early gastric cancer. J Surg Oncol (2009) 99(1):20–7. doi: 10.1002/jso.21170
11. Park SR, Lee JS, Kim CG, Kim HK, Kook MC, Kim YW, et al. Endoscopic ultrasound and computed tomography in restaging and predicting prognosis after neoadjuvant chemotherapy in patients with locally advanced gastric cancer. Cancer (2008) 112(11):2368–76. doi: 10.1002/cncr.23483
12. Yoshikawa T, Tanabe K, Nishikawa K, Ito Y, Matsui T, Kimura Y, et al. Accuracy of CT staging of locally advanced gastric cancer after neoadjuvant chemotherapy: cohort evaluation within a randomized phase II study. Ann Surg Oncol (2014) 21 Suppl 3:S385–9. doi: 10.1245/s10434-014-3615-8
13. Graser A, Johnson TR, Chandarana H, Macari M. Dual energy CT: preliminary observations and potential clinical applications in the abdomen. Eur Radiol (2009) 19(1):13–23. doi: 10.1007/s00330-008-1122-7
14. Karcaaltincaba M, Aktaş A. Dual-energy CT revisited with multidetector CT: Review of principles and clinical applications. Diagn Interventional Radiol (Ankara Turkey) (2010) 17:181–94. doi: 10.4261/1305-3825.DIR.3860-10.0
15. Chen X, Xu Y, Duan J, Li C, Sun H, Wang W. Correlation of iodine uptake and perfusion parameters between dual-energy CT imaging and first-pass dual-input perfusion CT in lung cancer. Med (Baltimore) (2017) 96(28):e7479. doi: 10.1097/MD.0000000000007479
16. Marcon J, Graser A, Horst D, Casuscelli J, Spek A, Stief CG, et al. Papillary vs clear cell renal cell carcinoma. Differentiation and grading by iodine concentration using DECT-correlation with microvascular density. Eur Radiol (2020) 30:1–10. doi: 10.1007/s00330-019-06298-2
17. Sato K, Morohashi H, Tsushima F, Sakamoto Y, Miura T, Fujita H, et al. Dual energy CT is useful for the prediction of mesenteric and lateral pelvic lymph node metastasis in rectal cancer. Mol Clin Oncol (2019) 10(6):625–30. doi: 10.3892/mco.2019.1834
18. Avanzo M, Stancanello J, El Naqa I. Beyond imaging: The promise of radiomics. Phys Med (2017) 38:122–39. doi: 10.1016/j.ejmp.2017.05.071
19. Huang YQ, Liang CH, He L, Tian J, Liang CS, Chen X, et al. Development and Validation of a Radiomics Nomogram for Preoperative Prediction of Lymph Node Metastasis in Colorectal Cancer. J Clin Oncol (2016) 34(18):2157–64. doi: 10.1200/JCO.2015.65.9128
20. Xu X, Zhang HL, Liu QP, Sun SW, Zhang J, Zhu FP, et al. Radiomic analysis of contrast-enhanced CT predicts microvascular invasion and outcome in hepatocellular carcinoma. J Hepatol (2019) 70(6):1133–44. doi: 10.1016/j.jhep.2019.02.023
21. Soni N, Priya S, Bathla G. Texture Analysis in Cerebral Gliomas: A Review of the Literature. AJNR Am J Neuroradiol (2019) 40(6):928–34. doi: 10.3174/ajnr.A6075
22. Feng QX, Liu C, Qi L, Sun SW, Song Y, Yang G, et al. An Intelligent Clinical Decision Support System for Preoperative Prediction of Lymph Node Metastasis in Gastric Cancer. J Am Coll Radiol (2019) 16(7):952–60. doi: 10.1016/j.jacr.2018.12.017
23. Liu S, He J, Liu S, Ji C, Guan W, Chen L, et al. Radiomics analysis using contrast-enhanced CT for preoperative prediction of occult peritoneal metastasis in advanced gastric cancer. Eur Radiol (2020) 30(1):239–46. doi: 10.1007/s00330-019-06368-5
24. Cunningham D, Allum WH, Stenning SP, Thompson JN, Cornelis JH, Nicolson M, et al. Perioperative Chemotherapy versus Surgery Alone for Resectable Gastroesophageal Cancer. N Engl J Med (2006) 355(1):11–20. doi: 10.1056/NEJMoa055531
25. A. Japanese Gastric Cancer. New Japanese classifications and treatment guidelines for gastric cancer: revision concepts and major revised points. Gastric Cancer (2011) 14(2):101–12. doi: 10.1007/s10120-011-0041-5
26. A. Japanese Gastric Cancer. Japanese gastric cancer treatment guidelines 2014 (ver. 4). Gastric Cancer (2017) 20(1):1–19. doi: 10.1007/s10120-016-0622-4
27. Amin MB, Greene FL, Edge SB, Compton CC, Gershenwald JE, Brookland RK, et al. The Eighth Edition AJCC Cancer Staging Manual: Continuing to build a bridge from a population-based to a more "personalized" approach to cancer staging. CA Cancer J Clin (2017) 67(2):93–9. doi: 10.3322/caac.21388
28. Gao X, Zhang Y, Yuan F, Ding B, Ma Q, Yang W, et al. Locally advanced gastric cancer: total iodine uptake to predict the response of primary lesion to neoadjuvant chemotherapy. J Cancer Res Clin Oncol (2018) 144(11):2207–18. doi: 10.1007/s00432-018-2728-z
29. Albrecht MH, Trommer J, Wichmann JL, Scholtz JE, Martin SS, Lehnert T, et al. Comprehensive Comparison of Virtual Monoenergetic and Linearly Blended Reconstruction Techniques in Third-Generation Dual-Source Dual-Energy Computed Tomography Angiography of the Thorax and Abdomen. Invest Radiol (2016) 51(9):582–90. doi: 10.1097/RLI.0000000000000272
30. Sofue K, Itoh T, Takahashi S, Schmidt B, Shimada R, Negi N, et al. Quantification of Cisplatin Using a Modified 3-Material Decomposition Algorithm at Third-Generation Dual-Source Dual-Energy Computed Tomography: An Experimental Study. Invest Radiol (2018) 53(11):673–80. doi: 10.1097/RLI.0000000000000491
31. Habermann CR, Weiss F, Riecken R, Honarpisheh H, Bohnacker S, Staedtler C, et al. Preoperative staging of gastric adenocarcinoma: Comparison of helical CT and endoscopic US. Radiology (2004) 230:465–71.
32. Hasegawa S, Yoshikawa T, Shirai J, Fujikawa H, Cho H, Doiuchi T, et al. A prospective validation study to diagnose serosal invasion and nodal metastases of gastric cancer by multidetector-row CT. Ann Surg Oncol (2013) 20(6):2016–22. doi: 10.1245/s10434-012-2817-1
33. Wels MG, Lades F, Muehlberg A, Suehling M. General purpose radiomics for multi-modal clinical research. Proc SPIE 10950, Medical Imaging 2019: Computer-Aided Diagnosis (2019) 1095046. doi: 10.1117/12.2511856
34. Zwanenburg A, Leger S, Vallières M, Löck S. Image biomarker standardization initiative. ArXiv (2019) Prepr arXiv:161207003. doi: 10.17195/candat.2016.08.1
35. Huang Y, Liu Z, He L, Chen X, Pan D, Ma Z, et al. Radiomics Signature: A Potential Biomarker for the Prediction of Disease-Free Survival in Early-Stage (I or II) Non—Small Cell Lung Cancer. Radiology (2016) 281(3):947–57. doi: 10.1148/radiol.2016152234
36. Kiyabu M, Leichman L, Chandrasoma P. Effects of preoperative chemotherapy on gastric adenocarcinomas. A morphologic study of 25 cases. Cancer (1992) 70:2239–45. doi: 10.1002/1097-0142(19921101)70:9<2239::AID-CNCR2820700904>3.0.CO;2-M
37. Kim TU, Kim S, Lee JW, Lee NK, Jeon TY, Park DY. MDCT features in the differentiation of T4a gastric cancer from less-advanced gastric cancer: significance of the hyperattenuating serosa sign. Br J Radiol (2013) 86(1029):20130290. doi: 10.1259/bjr.20130290
38. Liu S, Shi H, Ji C, Zheng H, Pan X, Guan W, et al. Preoperative CT texture analysis of gastric cancer: correlations with postoperative TNM staging. Clin Radiol (2018) 73(8):756 e1–9. doi: 10.1016/j.crad.2018.03.005
39. Agrawal MD PD, Kulkarni NM, Hahn PF, Guimaraes AR, Sahani DV. Oncologic Applications of DualEnergy CT in the Abdomen. Radiographics A Rev Publ Radiol Soc North America Inc (2014) 34(3):589. doi: 10.1148/rg.343135041
40. Jiang C, Yang P, Lei J, Li J, Yan K, Li F, et al. The Application of Iodine Quantitative Information Obtained by Dual-Source Dual-Energy Computed Tomography on Chemoradiotherapy Effect Monitoring for Cervical Cancer: A Preliminary Study. J Comput Assist Tomogr (2017) 41(5):737–45. doi: 10.1097/RCT.0000000000000603
41. Baxa J, Matouskova T, Krakorova G, Schmidt B, Flohr T, Sedlmair M, et al. Dual-Phase Dual-Energy CT in Patients Treated with Erlotinib for Advanced Non-Small Cell Lung Cancer: Possible Benefits of Iodine Quantification in Response Assessment. Eur Radiol (2016) 26(8):2828–36. doi: 10.1007/s00330-015-4092-6
42. Zhang L, Tong Y, Zhang X, Pan M, Chen S. Arsenic sulfide combined with JQ1, chemotherapy agents, or celecoxib inhibit gastric and colon cancer cell growth. Drug Des Devel Ther (2015) 9:5851–62. doi: 10.2147/DDDT.S92943
43. Giganti F, Antunes S, Salerno A, Ambrosi A, Marra P, Nicoletti R, et al. Gastric cancer: texture analysis from multidetector computed tomography as a potential preoperative prognostic biomarker. Eur Radiol (2017) 27(5):1831–9. doi: 10.1007/s00330-016-4540-y
44. Cheng NM, Hsieh CE, Liao CT, Ng SH, Wang HM, Fang YD, et al. Prognostic Value of Tumor Heterogeneity and SUVmax of Pretreatment 18F-FDG PET/CT for Salivary Gland Carcinoma With High-Risk Histology. Clin Nucl Med (2019) 44(5):351–8. doi: 10.1097/RLU.0000000000002530
45. Burrell RA, McGranahan N, Bartek J, Swanton C. The causes and consequences of genetic heterogeneity in cancer evolution. Nature (2013) 501(7467):338–45. doi: 10.1038/nature12625
46. Brock A CH, Huang S. Non-genetic heterogeneity — a mutation-independent driving force for the somatic evolution of tumours. Nat Rev Genet (2009) 10:336–42. doi: 10.1038/nrg2556
Keywords: locally advanced gastric cancer, dual energy CT, iodine map, radiomics, neoadjuvant chemotherapy
Citation: Wang L, Zhang Y, Chen Y, Tan J, Wang L, Zhang J, Yang C, Ma Q, Ge Y, Xu Z, Pan Z, Du L, Yan F, Yao W and Zhang H (2021) The Performance of a Dual-Energy CT Derived Radiomics Model in Differentiating Serosal Invasion for Advanced Gastric Cancer Patients After Neoadjuvant Chemotherapy: Iodine Map Combined With 120-kV Equivalent Mixed Images. Front. Oncol. 10:562945. doi: 10.3389/fonc.2020.562945
Received: 21 May 2020; Accepted: 23 November 2020;
Published: 11 January 2021.
Edited by:
Freimut Dankwart Juengling, Universität Bern, SwitzerlandReviewed by:
Jianping Lu, Naval Medical University, ChinaYing-Shi Sun, Peking University Cancer Hospital, China
Copyright © 2021 Wang, Zhang, Chen, Tan, Wang, Zhang, Yang, Ma, Ge, Xu, Pan, Du, Yan, Yao and Zhang. This is an open-access article distributed under the terms of the Creative Commons Attribution License (CC BY). The use, distribution or reproduction in other forums is permitted, provided the original author(s) and the copyright owner(s) are credited and that the original publication in this journal is cited, in accordance with accepted academic practice. No use, distribution or reproduction is permitted which does not comply with these terms.
*Correspondence: Weiwu Yao, eWFvd2Vpd3VodWFuQDE2My5jb20=; Huan Zhang, aHVhbnpoYW5neUAxNjMuY29t
†These authors have contributed equally to this work