 Bin Yang1†
 Hengshan Ji2†Jing Zhong1†
 Lu Ma1†Jian Zhong1†
 Hao Dong3†Changsheng Zhou1
 Shaofeng Duan4Chaohui Zhu5Jiahe Tian6
 Longjiang Zhang1
 Feng Wang7Hong Zhu2*Guangming Lu1*
- 1Department of Medical Imaging, Affiliated Jinling Hospital, Medical School of Nanjing University, Nanjing, China
- 2Department of Nuclear Medicine, Affiliated Jinling Hospital, Medical School of Nanjing University, Nanjing, China
- 3College of Medical Imaging, Xuzhou Medical University, Xuzhou, China
- 4Institute of Precision Medicine, GE Healthcare China, Shanghai, China
- 5Department of Nuclear Medicine, Peking Union Medical College Hospital, Beijing, China
- 6Department of Nuclear Medicine, The Chinese People's Liberation Army (PLA) General Hospital, Beijing, China
- 7Department of Nuclear Medicine, First People’s Hospital of Nanjing, Nanjing, China
Objectives: To investigate the development and validation of a radiomics nomogram based on PET/CT for guiding personalized targeted therapy in patients with lung adenocarcinoma mutation(s) in the EGFR gene.
Methods: A cohort of 109 (77/32 in training/validation cohort) consecutive lung adenocarcinoma patients with an EGFR mutation was enrolled in this study. A total of 1672 radiomic features were extracted from PET and CT images, respectively. The least absolute shrinkage and selection operator (LASSO) Cox regression was used to select the radiomic features and construct the radiomics nomogram for the estimation of overall survival (OS), which was then assessed with respect to calibration and clinical usefulness. Patients with an EGFR mutation were divided into high- and low- risk groups according to their nomogram score. The treatment strategy for high- and low-risk groups was analyzed using Kaplan–Meier analysis and a log-rank test.
Results: The C-index of the radiomics nomogram for the prediction of OS in lung adenocarcinoma in patients with an EGFR mutation was 0.840 and 0.803 in the training and validation cohorts, respectively. Distant metastasis [(Hazard ratio, HR),1.80], metabolic tumor volume (MTV, HR, 1.62), and rad score (HR, 17.23) were the independent risk factors for patients with an EGFR mutation. The calibration curve showed that the predicted survival time was remarkably close to the actual time. Decision curve analysis demonstrated that the radiomics nomogram was clinically useful. Targeted therapy for patients with high-risk EGFR mutations attained a greater benefit than other therapies (p < 0.0001), whereas the prognoses of the two therapies were similar in the low-risk group (p = 0.85).
Conclusions: Development and validation of a radiomics nomogram based on PET/CT radiomic features combined with clinicopathological factors may guide targeted therapy for patients with lung adenocarcinoma with EGFR mutations. This is conducive to the advancement of precision medicine.
Introduction
Lung cancer is the leading cause of cancer deaths in the world and has the highest morbidity and mortality rates among all malignant tumors (1, 2). Non-small cell lung cancer (NSCLC) accounts for 85% of all lung cancers (3, 4). Due to the lack of early clinical symptoms, lymph node metastasis or distant metastasis has already occurred by the time of diagnosis, and it is usually too late for surgical intervention (5, 6). Although the prognosis of lung cancer has improved significantly with improvements in treatment methods, the 5-year survival rate for lung cancer patients remains at 17–18% (7, 8).
The tumor, node, and metastasis (TNM) staging system is currently the most valuable and commonly used tumor staging system for assessing the prognosis of malignant tumors (9–12). However, in clinical practice, it is found that the TNM staging system continues to have many shortcomings in the prognostic evaluation of lung cancer. The survival time of patients at the same stage may differ. Therefore, a TNM-based one-size-fits-all strategy might not be suitable for all patients. In addition, it is not currently possible to fully predict the progression and outcome of disease in patients with NSCLC. Therefore, identification of patients at high risk of death would be valuable for guiding therapy (13–15). New methods of prognostic assessment are urgently needed to achieve personalized treatment. A nomogram is an intuitive chart prepared by establishing a statistical prediction model, which includes important tumor prognosis factors. A nomogram is regarded as a tool for quantifying risks and has become the focus of cancer research (16–18).
The18F-fluordeoxyglucose positron emission tomography/computed tomography (18F-FDG PET/CT) can provide functional, metabolic, anatomical, and morphological imaging. Its’ metabolic parameters can reflect the metabolism of tumor tissue. Studies have shown that FDG uptake in primary tumors is an independent risk factor for patients with early NSCLC (19, 20), although the value of the prognosis in evaluation of advanced NSCLC patients remains controversial (21, 22). Moreover, the 18F-FDG PET/CT features of lung cancer are significantly correlated with T stages, N status, pathological stages, and tumor grades (23–25). Therefore, it has been widely used in the diagnosis, staging, and monitoring of the therapeutic effects and prognostic evaluation of NSCLC (26). Radiomics is the high-throughput extraction and analysis of quantitative features from images. Consequently, the prognostic evaluation of NSCLC by PET/CT can be improved (27). Currently, several attempts have been made to improve the performance of predictive models. However, the prognostic prediction performance of radiomics models in these studies was generally poor. Thus the prognostic performance of radiomics has room for further improvement (15, 28). A few studies have evaluated the use of 18F-FDG PET/CT radiomics features to predict the NSCLC prognosis; nevertheless the effect of the driver gene mutation status and treatment methods was ignored. The prognosis of patients with NSCLC is closely related to the driving gene mutation status and treatment. So, it is necessary to conduct independent research with these patients to achieve individualized treatment.
The main purpose of this study was to develop a radiomics nomogram based on 18F-FDG PET/CT radiomic features combined with clinicopathological factors to predict the survival outcomes of patients diagnosed with lung adenocarcinoma with an epidermal growth factor receptor (EGFR) mutation. We also endeavored to provide guidance for treatment strategies and prognostic evaluation of patients with an EGFR mutation.
Materials and Methods
Patients
The institutional review board of Affiliated Jinling Hospital, Medical School of Nanjing University approved this retrospective study and waived the requirement to obtain informed consent from the patients. In our retrospective investigation, the following inclusion criteria were applied to select patients from the medical database: a) an 18F-FDG PET/CT examination within 1 month prior to surgery or biopsy, b) no anti-tumor treatment received before the 18F-FDG PET/CT examination, c) with surgical or biopsy specimens confirmed by pathology, and d) with EGFR mutation detection results. The exclusion criteria were as follows: a) patients with partial loss of PET or CT images, b) patients with metastases in the lung, and c) images with unclear boundaries of the tumor that could not be accurately delineated.
Altogether, 174 consecutive lung adenocarcinoma patients were identified by applying the above-mentioned inclusion/exclusion criteria from the institutional database between July 2009 and August 2016, and 109 cases were patients with an EGFR mutation. Among those with EGFR mutations, 44 had the 19DEL, 61 had the 21L858R-mutation and four had other EGFR mutations sites. We randomly divided patients with the EGFR mutation into training (n = 77) and validation (n = 32) cohorts following a 7:3 ratio. The clinicopathological data obtained from medical records included age, sex, family history, smoking history, histological grade, lymph node metastasis, distant metastasis, TNM stage (defined according to the eighth edition of the TNM classification and staging system by the American Joint Committee on Cancer), thyroid transcription factor-1 (TTF-1) (− or one + was defined as negative, ≥two + was defined as positive), Ki-67 (≤25% was defined as low expression and >25% as high expression), carcinoembryonic antigen (CEA), and PET/CT metabolic parameters (Table 1). The follow-up time was from July 2009 to January 2019. The endpoint of this study was overall survival (OS), which was defined as the time from the date of the 18F-FDG PET/CT examination to the date of telephone follow-up or the date of the patient’s death.
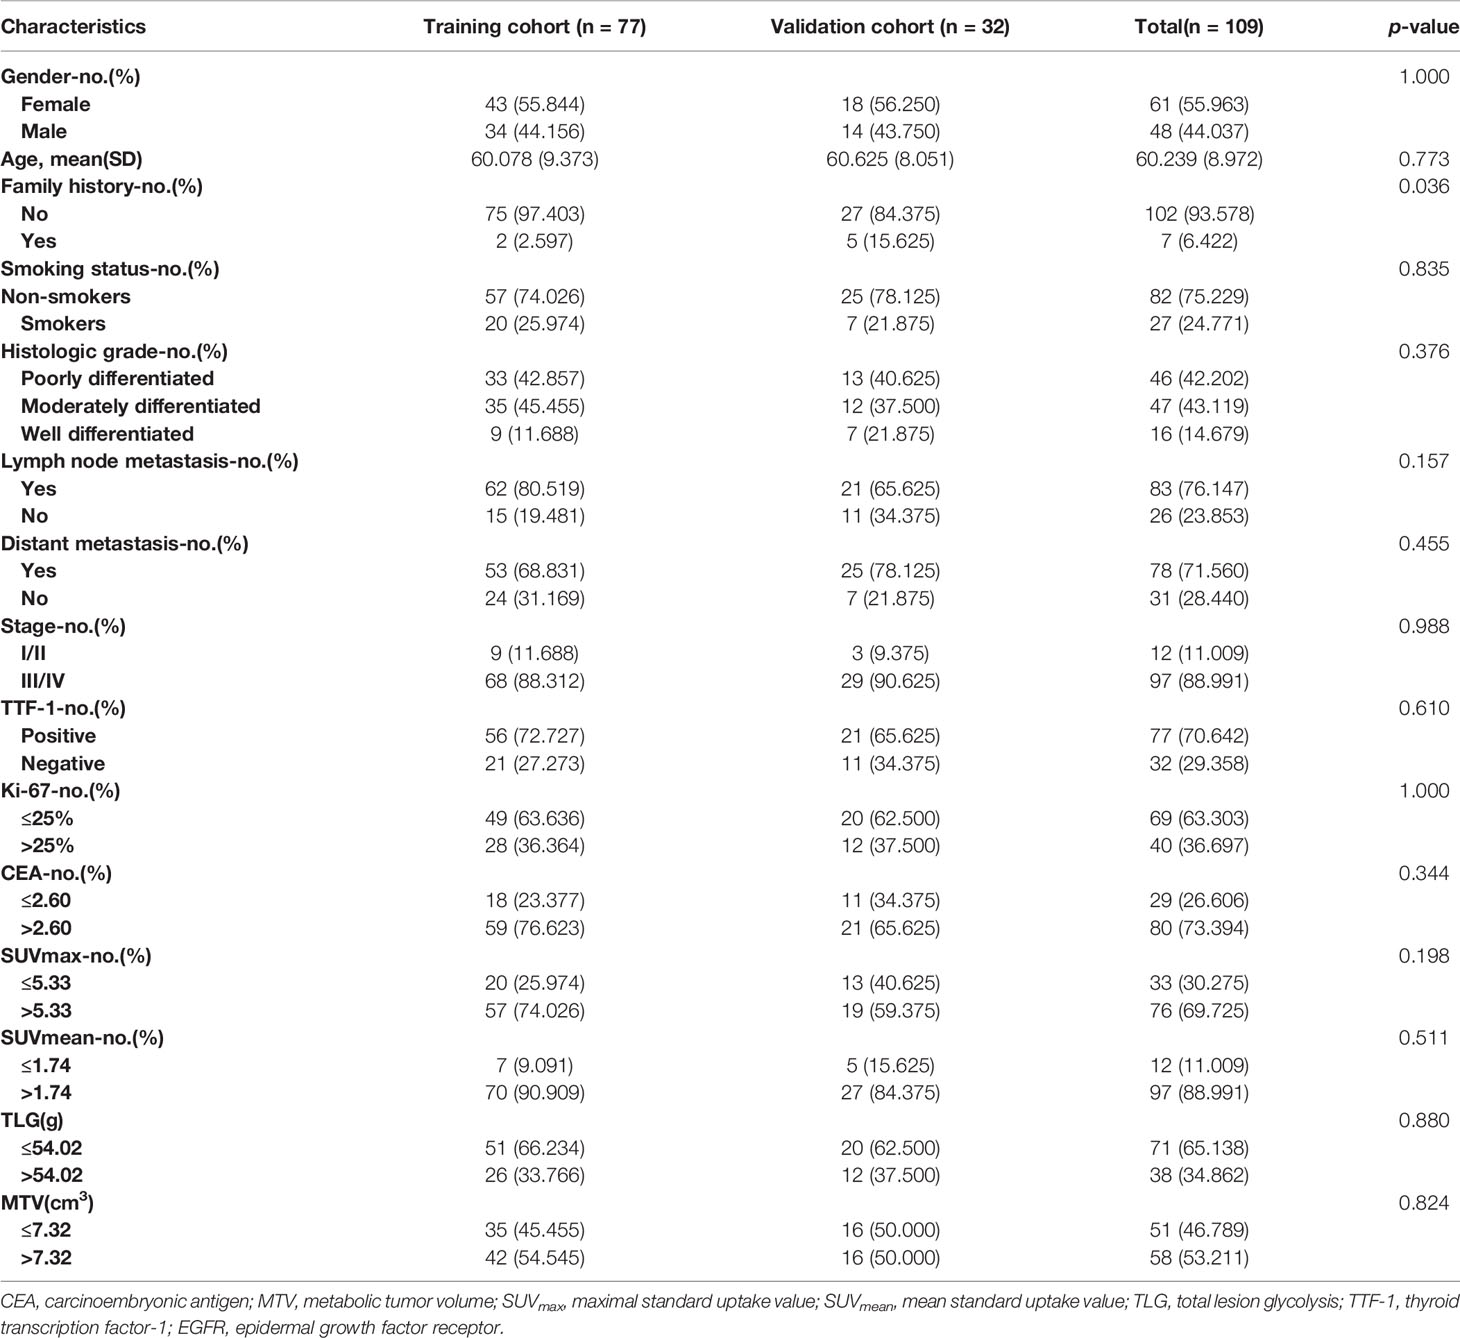
Table 1 Characteristics of the training and validation cohorts.
PET/CT Imaging Method, Image Acquisition, and Measurement of Metabolic Parameters
Patients underwent PET/CT imaging (Biography 16, Siemens, Erlangen, Germany) using 18F-FDG synthesized by the Canadian EBCO TR19 medical cyclotron and chemical synthesis system. The radiochemical purity was >95%. The patients fasted for 6–8 h before undergoing the scan. Patients were intravenously injected with 18F-FDG (3.7–6.66 MBq/kg) and underwent a whole-body PET/CT scan from the skull base to the upper section of the thigh. CT scan parameters were as follows: tube voltage120 kV, Tube current 140 mAs, and layer thickness and layer spacing 5 mm, matrix 512 × 512, and tube rotation speed 0.8 s/r. The PET acquisition parameters were as follows: three-dimensional at 3 min/bed, iterative algorithm, iterations four subsets, eight resolution, 4.1 mm lateral, 4.6 mm axial, matrix 128 × 128, voxel size 5.3 × 5.3 × 5.3 mm3. The images were reconstructed using an iterative reconstruction method resulting in CT, PET, and PET/CT fusion images that were transferred to a post-processing workstation. We used Microsoft Viewer software (version VB10, Siemens) to calculate the metabolic parameters on the PET images. PET images were first converted to SUV images in the software without other processing methods. Then, the three-dimensional region of interest (ROI) was manually delineated by a radiologist (YB) to calculate the maximum standard uptake value (SUVmax, with a threshold set to 40%), mean standard uptake value (SUVmean), and metabolic tumor volume (MTV). Subsequently, the total lesion glycolysis (TLG) (TLG = SUVmean × MTV) was calculated.
EGFR Gene Detection
EGFR genetic mutations were tested from the affected tumor tissue sample obtained by surgical resection or biopsy. The amplification refractory mutation system polymerase chain reaction method was used to detect mutation sites in four exons (exons 18–21) in the coding region of the EGFR gene, the results of which were acquired according to the interpretation principle provided by the reference test kit. If any exon mutation was detected, the tumor was identified as an EGFR mutant; otherwise, the tumor was identified as EGFR wild type.
Tumor Segmentation
A volume of interest (VOI) segmentation was semiautomatically produced by drawing a line across the boundary of the tumor and manually adjusted by a chest radiologist (YB, 9 years of experience in the lung diagnosis) in a three-dimensional domain using the radiomics prototype (Radiomics, Frontier, Siemens; Figure 1) and confirmed by another chest radiologist (JS, 15 years of experience). Then, the tool automatically found the neighboring voxels in 3D space with the same gray level through an automatic algorithm. This is the Random Walker-based lesion segmentation for solid and subsolid lung lesions (29). Both radiologists were blinded to the patients’ clinical information. The details of the tumor segmentation are described in Appendix 1.
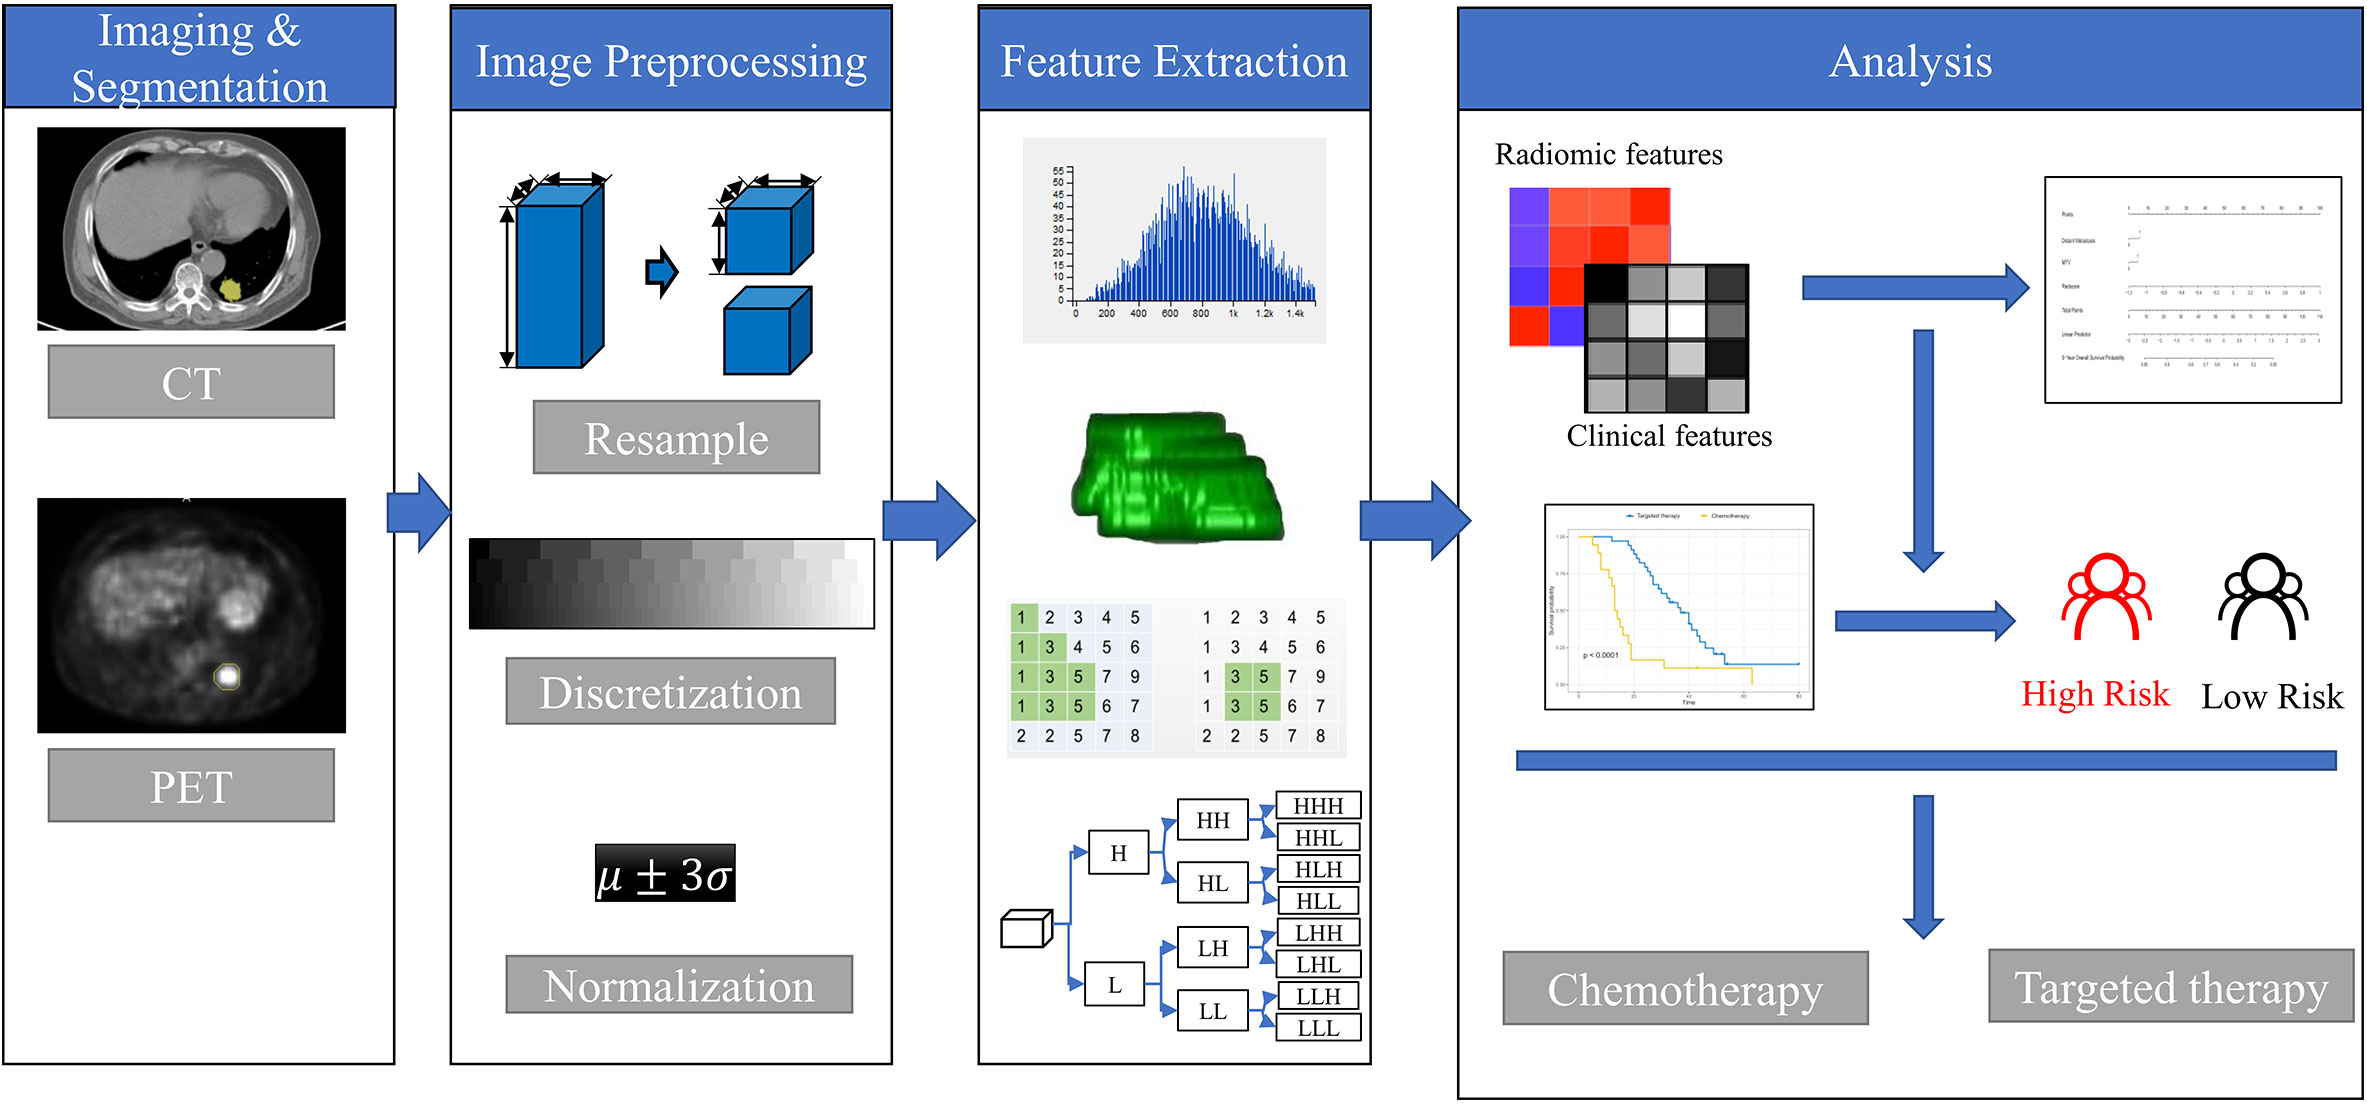
Figure 1 The framework for developing the radiomics nomogram and treatment strategy decisions. The lesions were segmented on Siemens Radiomics prototype semiautomatically, and 1,672 radiomics features, including first order features, shape related features, and texture features were extracted using the software after image pre-processing. The least absolute shrinkage and selection operator (LASSO) Cox regression was used to select radiomics features and clinicopathological factors to construct the radiomics nomogram. Patients with EGFR mutations were divided into high- and low-risk groups according to the rad score. The treatment strategy was analyzed in the high- and low-risk groups.
Feature Extraction, Feature Selection, and Radiomics Signature Construction
Our study followed and adhered to the Image Biomarker Standardization Initiative (IBSI) guidelines (30), and the software used was IBSI-compliant. The medical images were resampled to the 1 mm × 1 mm × 1 mm voxel size in millimeters before the subsequent feature extraction steps. The interpolator used for resampling was B-spline interpolation. For discretization of the image gray levels, the bin width was set as 25 for CT and 0.1 for PET-SUV. After preprocessing, a total of 1,672 × 2 radiomics features were extracted from the CT and PET images by the radiomics prototype after imaging preprocessing. The extracted radiomics feature groups were as follows: a) 18 first-order features, b) 16 size and shape features, and c) 74 texture encoding features. In total 1,672 radiomics features were extracted from each per lesion, including 108 from the original image, 460 [92 × 5] from the LoG-filtered images, 736 [92 × 8] from the wavelet-transformed images, and 368 [92 × 4] from non-linear intensity transforms (For detailed feature calculation formulas, please refer to the website: https://pyradiomics.readthedocs.io/en/latest/features.html#). A Spearman’s correlation test was performed using the ‘findCorrelation’ function in the caret package (cutoff, 0.9) to reduce feature redundancy. The least absolute shrinkage and selection operator (LASSO) Cox regression method, which is suitable for the regression of high dimensional data in survival analyses, was conducted to select the most useful predictive features from the training cohort (31). A radiomics score (rad score) was calculated for each patient via a linear combination of selected features that were weighted by their respective coefficients (32).
Prognostic Model Establishment
The clinicopathological factors were analyzed using univariate Cox proportional hazards (CPH) regression analysis to identify significant risk factors. Significant risk factors with p < 0.05 were analyzed using the Kaplan–Meier curve and log-rank test. Significant risk factors were analyzed using multivariate Cox proportional hazards (CPH) regression analysis to identify independent risk factors. A clinical model was constructed based on the independent risk factors. Rad score and independent risk factors were fused into a single predictive model based on a multivariate CPH model. The performance of models was evaluated with the concordance index (C-index).
Construction of the Radiomics Nomogram and Its Performance
The rad score and independent risk factors were based on multivariate Cox regression analysis to construct the radiomics nomogram. The prediction performance of the radiomics nomogram was assessed using the Harrell’s C-index in the training and validation cohorts. The C-index ranges from 0.5 to 1.0, where 0.5 indicates random data distribution and 1.0 suggests that the outcome of the model predicted the observed survival information perfectly. Calibration curves of the radiomics nomogram were then drawn for 5-year OS of the patients (33). The calibration curves illustrated both survival probabilities predicted by nomogram and the observed probabilities. A decision curve analysis determined the clinical usefulness of the radiomics nomogram by quantifying the net benefits at various threshold probabilities.
To Guide the Individualized Targeted Therapy for Patients With Lung Adenocarcinoma
Patients with an EGFR mutation were divided into high- and low-risk groups according to their nomogram score. The treatment strategy was explored separately in the high- and low-risk cohorts using Kaplan–Meier analysis and a log-rank test, to find the cohort that would benefit from the targeted treatment. Additionally, the various treatment strategies were explored in patients with different EGFR-mutation sites, to identify which patients could actually benefit from adjuvant therapy.
Statistical Analysis
The R software (version 3.5.0, www.Rproject.org) was used for all statistical analyses in this study. LASSO was conducted using the ‘glmnet’ package, while ‘hdnom’ was used for survival analysis. All statistical tests were two-sided and the significance level was set at p = 0.05.
Results
Clinical Characteristics
Patient characteristics of the training and validation cohorts were summarized in Table 1. There were no significant differences in age, sex, smoking status, lymph node metastasis, or distant metastasis, etc., between the two cohorts (p > 0.05).
Important Radiomics Feature Selection and Radiomics Signature Construction
In total, 1,672 radiomics features were extracted from the CT and PET images, respectively. We performed feature selection using the LASSO regression model with the PET/CT features (Figures 2A, B). The following ten important features were selected from 1,672 radiomics features (Figure 2C):
CT_wavelet−LLH_glcm_ClusterShade, CT_log−sigma−0−5−mm−3D_glcm_MaximumProbability,
CT_wavelet−LLH_firstorder_Skewness,PET_wavelet−HHL_firstorder_Mean,CT_wavelet−HLH_glcm_ClusterShade,PET_wavelet−HHL_glszm_SmallAreaLowGrayLevelEmphasis,CT_wavelet−LHL_glszm_SmallAreaHighGrayLevelEmphasis,PET_wavelet−HLL_firstorder_Kurtosis,PET_wavelet−LHL_glcm_Imc2, and CT_wavelet−LHL_firstorder_Mean.
Then the rad score was calculated using these ten radiomics features as follows: rad score = 0.051*PET_wavelet-HLL_firstorder_Kurtosis+0.006*PET_wavelet-HLL_glcm_Idn+-0.011*PET_wavelet-LHH_glcm_Imc1+0.047*PET_wavelet-LHL_glcm_Imc2+-0.011*PET_log-sigma-0-5-mm-3D_glszm_SmallAreaLowGrayLevelEmphasis + 0.093.
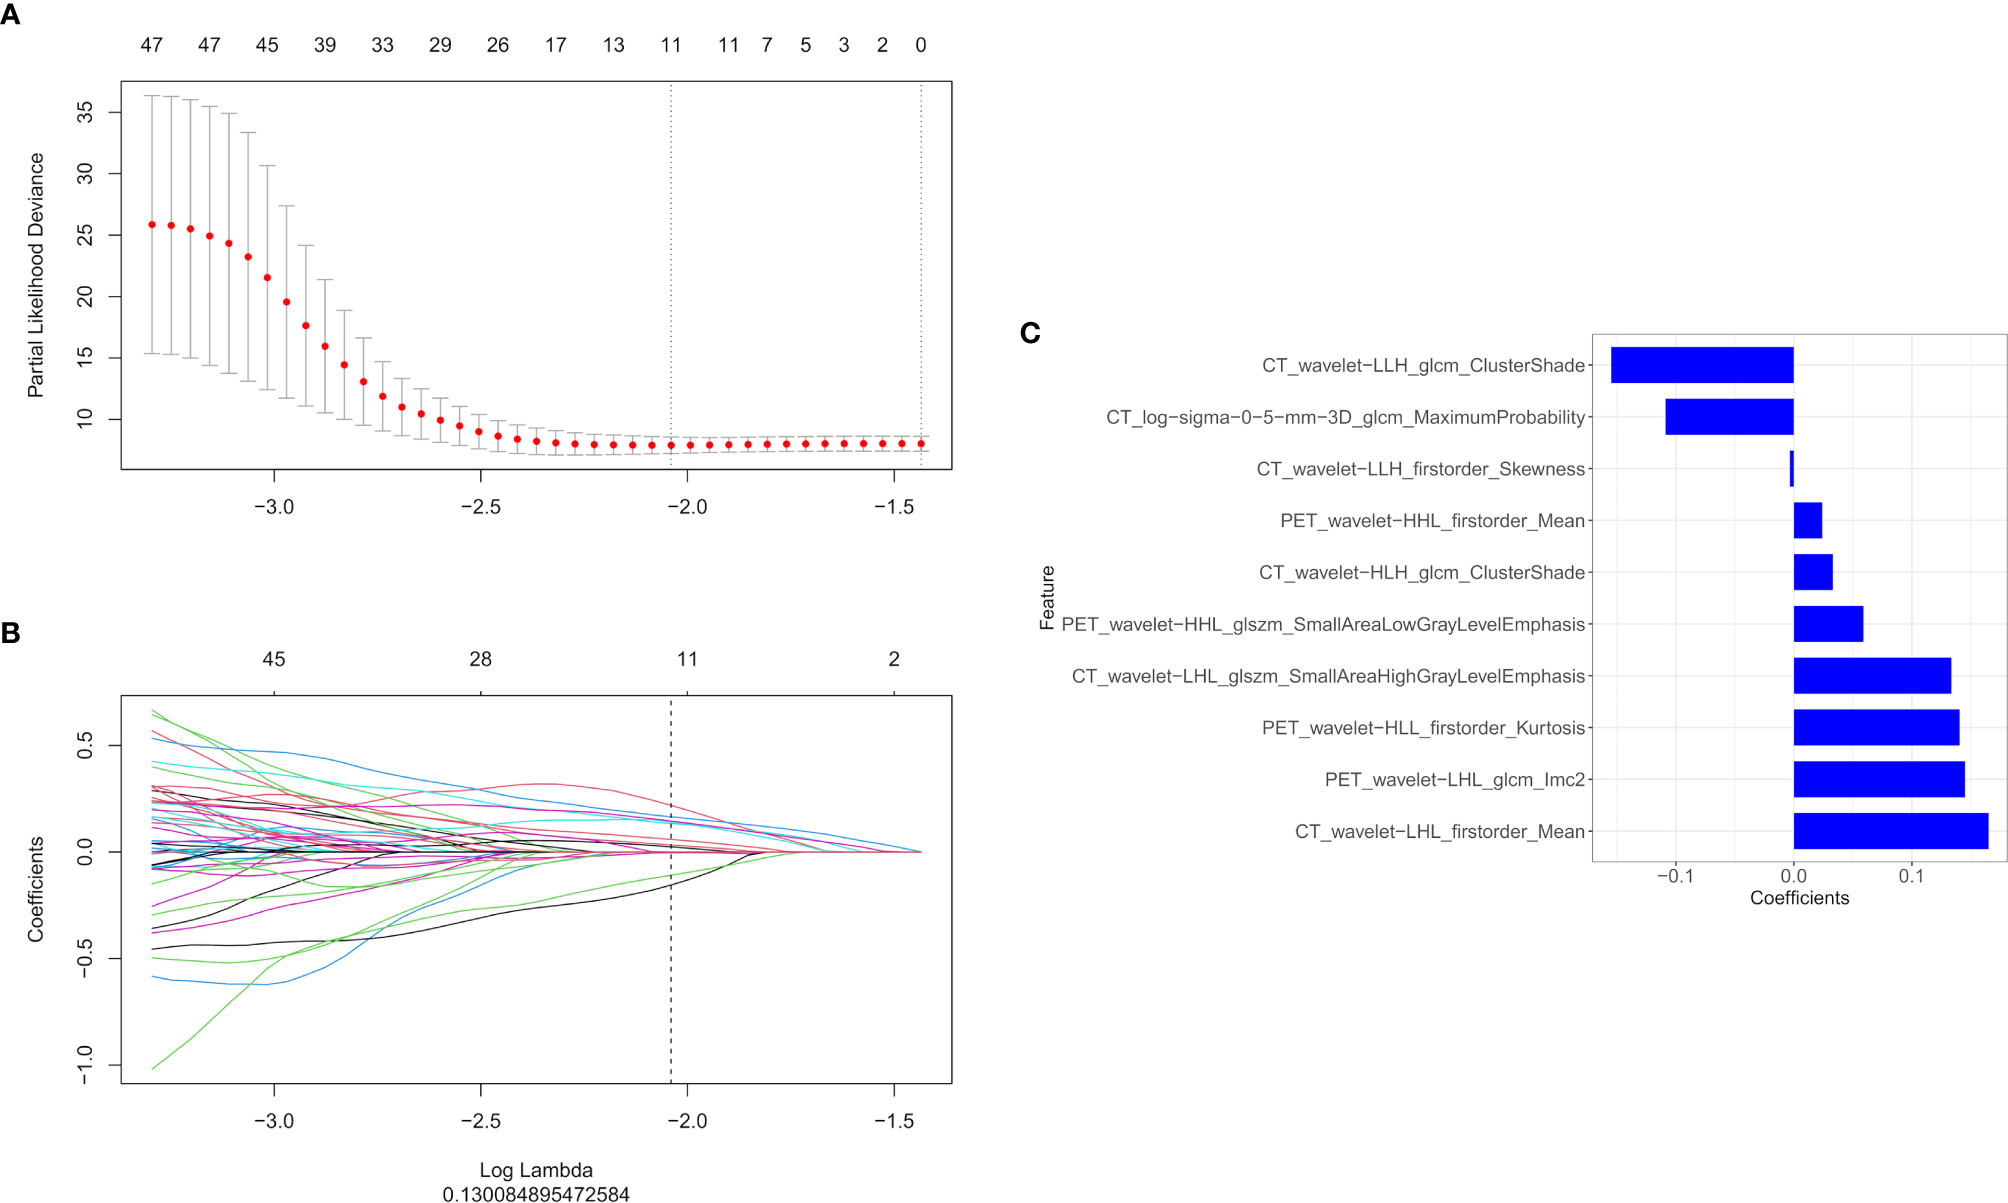
Figure 2 The LASSO and ten-fold cross-validation were used to extract the optimal subset of radiomics features. The following two steps were included: determining the hyperparameter/lambda with a partial likelihood deviance as the criterion (A) and using the optimized/lambda (the vertical dashed line) to select features with non-zero coefficients (B). (C) LASSO algorithm was used to select the ten radiomics features that contributed the most to the prognostic prediction model.
Prognostic Model Establishment and Performance of the Multimodality Prediction Model
We used a univariate Cox regression analysis to test the hazard ratio (HR) of each factor and to determine its’ significance in the probability of death. The results were as follows: distant metastasis (HR, 2.68), metabolic tumor volume (MTV, HR, 2.02), maximal standard uptake value (SUVmax, HR, 2.48), stage (HR, 4.29), and carcinoembryonic antigen (CEA, HR, 3.16) were the significant risk factors for patients with an EGFR mutation (P < 0.05).The significant risk factors with p < 0.05 were calculated using a log-rank test, and Kaplan–Meier curves were plotted. Figures 3A–E illustrate the survival probability of patients in the high-risk or low-risk cohorts. The results of the log-rank test indicate significant discrimination between the two groups. A clinical model was constructed based on multivariate Cox proportional hazards (CPH) regression analysis of significant risk factors. Distant metastasis [HR,2.97(95%CI, 1.36–6.51)] and metabolic tumor volume [MTV,HR,2.26(95%CI, 1.19–4.28)] were the independent risk factors in the training cohort. Rad score and independent risk factors were fused into a single predictive model based on the multivariate CPH regression analysis. Distant metastasis [HR,1.80(95%CI, 0.80–4.04)], metabolic tumor volume [MTV, HR,1.62(95%CI, 0.82–3.17)] and rad score [HR,17.23 (95%CI, 6.62–44.81)] were the independent risk factors in the training cohort. The C-index of the clinical model was 0.694 and 0.729 in the training and validation cohorts, respectively. The C-index of the rad score (radiomics model) was 0.819 and 0.737 in the training and validation cohorts, respectively. A rad score was combined with the independent risk factors to construct a combined model (radiomics nomogram) based on multivariate Cox regression analysis, and the C-index of the combined model (radiomics nomogram) was 0.840 and 0.803 in the training and validation cohorts, respectively (Table 2).
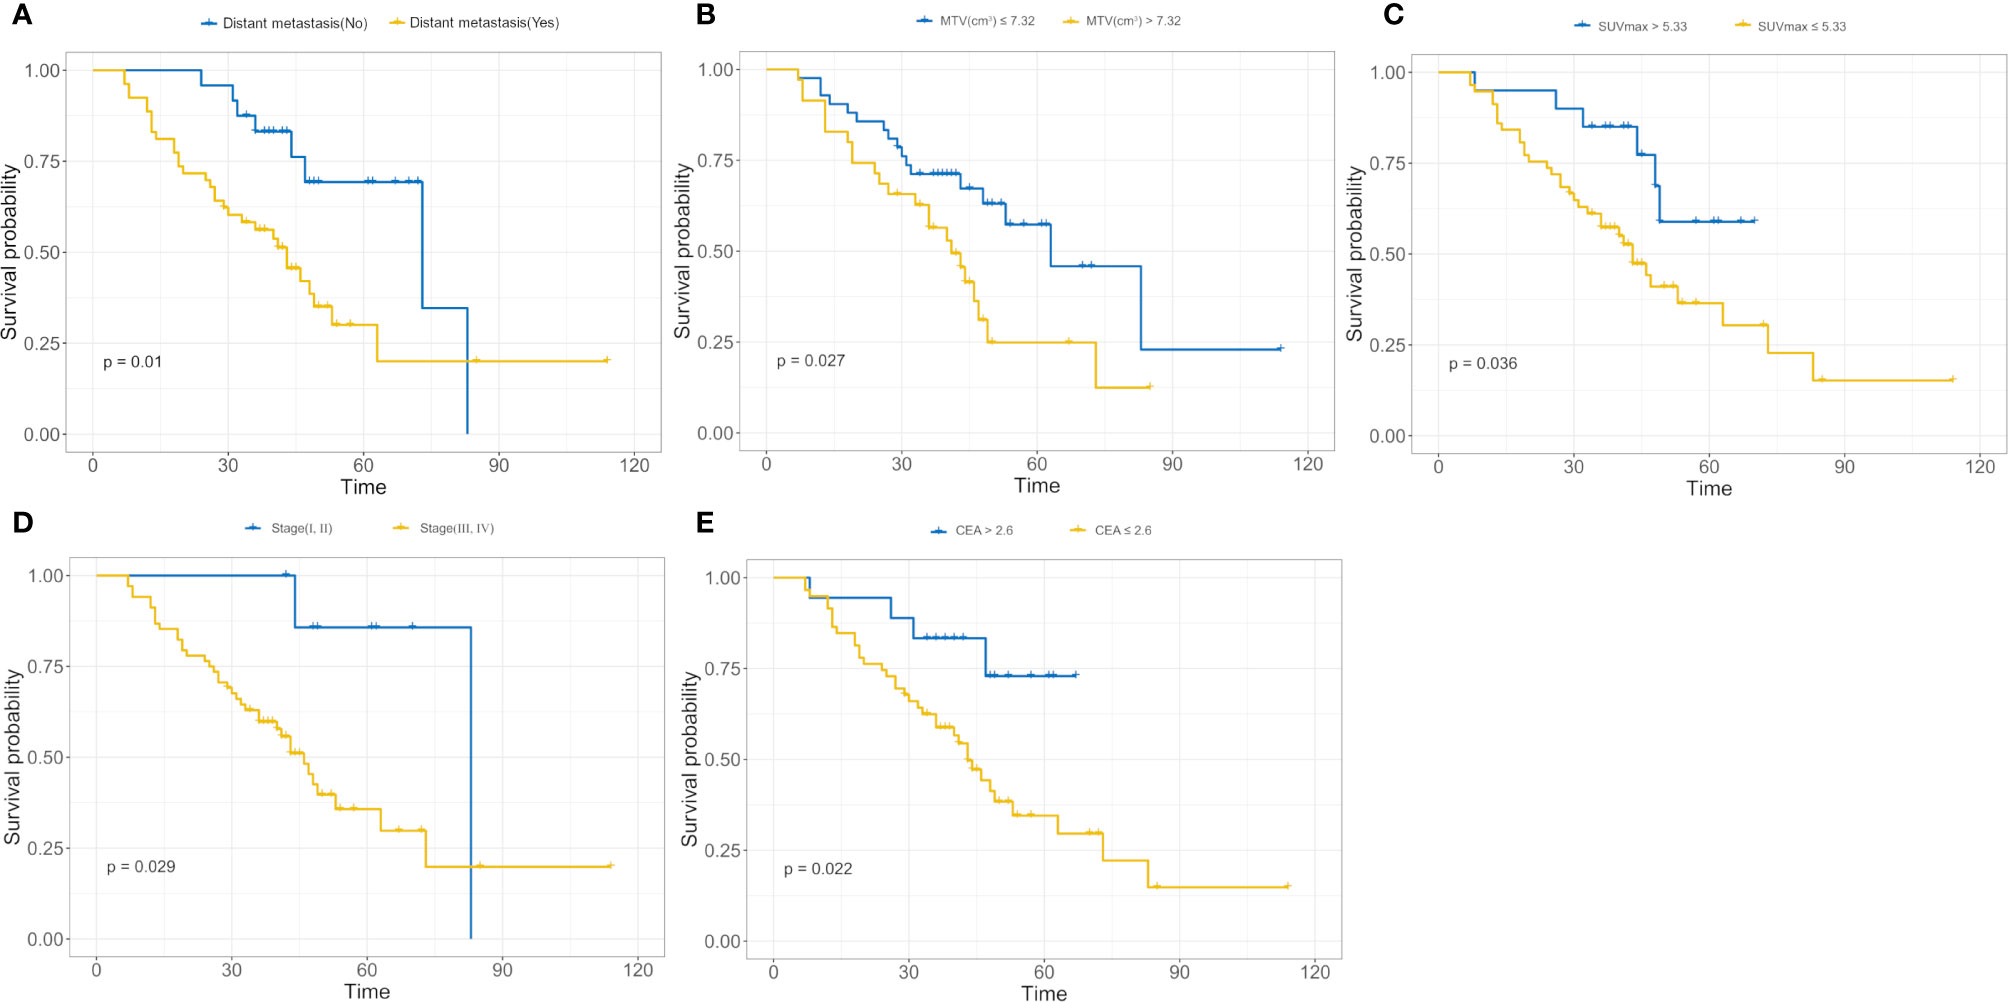
Figure 3 (A–E) Kaplan–Meier analysis for distant metastasis (A), metabolic tumor volume (MTV) (B), maximal standard uptake value (SUVmax); (C), stage (D), carcinoembryonic antigen (CEA); (E). The patients were stratified into high- and low-risk groups based on distant metastasis (A, p = 0.01, log-rank test), MTV (B, p = 0.027, log-rank test), SUVmax (C, p = 0.036, log-rank test), stage (D, p = 0.029, log-rank test), and CEA (E, p = 0.022, log-rank test).
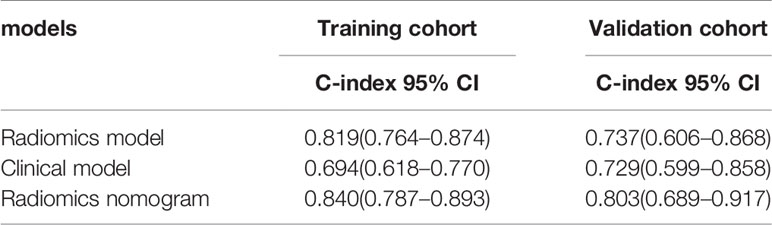
Table 2 The comparison of prognostic accuracy between the radiomics model and two other prognostic models.
Development of the Radiomics Nomogram and Its Performance
The rad score was combined with the independent risk factors to construct a radiomics nomogram based on multivariate Cox regression analysis (Figure 4A). The C-index of the radiomics nomogram was 0.840 and 0.803 in the training and validation cohorts, respectively. The calibration curve result showed that the predicted probability was remarkably close to the actual survival time of patients (Figures 4B, C). Kaplan–Meier survival analysis of patients in the high-risk and low-risk groups in the training cohort (log-rank test p = 0.001; Figure 4D). A decision curve analysis showed that the radiomics nomogram had a higher overall net benefit than the clinical model and the radiomics model, and had a higher overall net benefit across the majority of the range of reasonable threshold probabilities (Figure 4E).
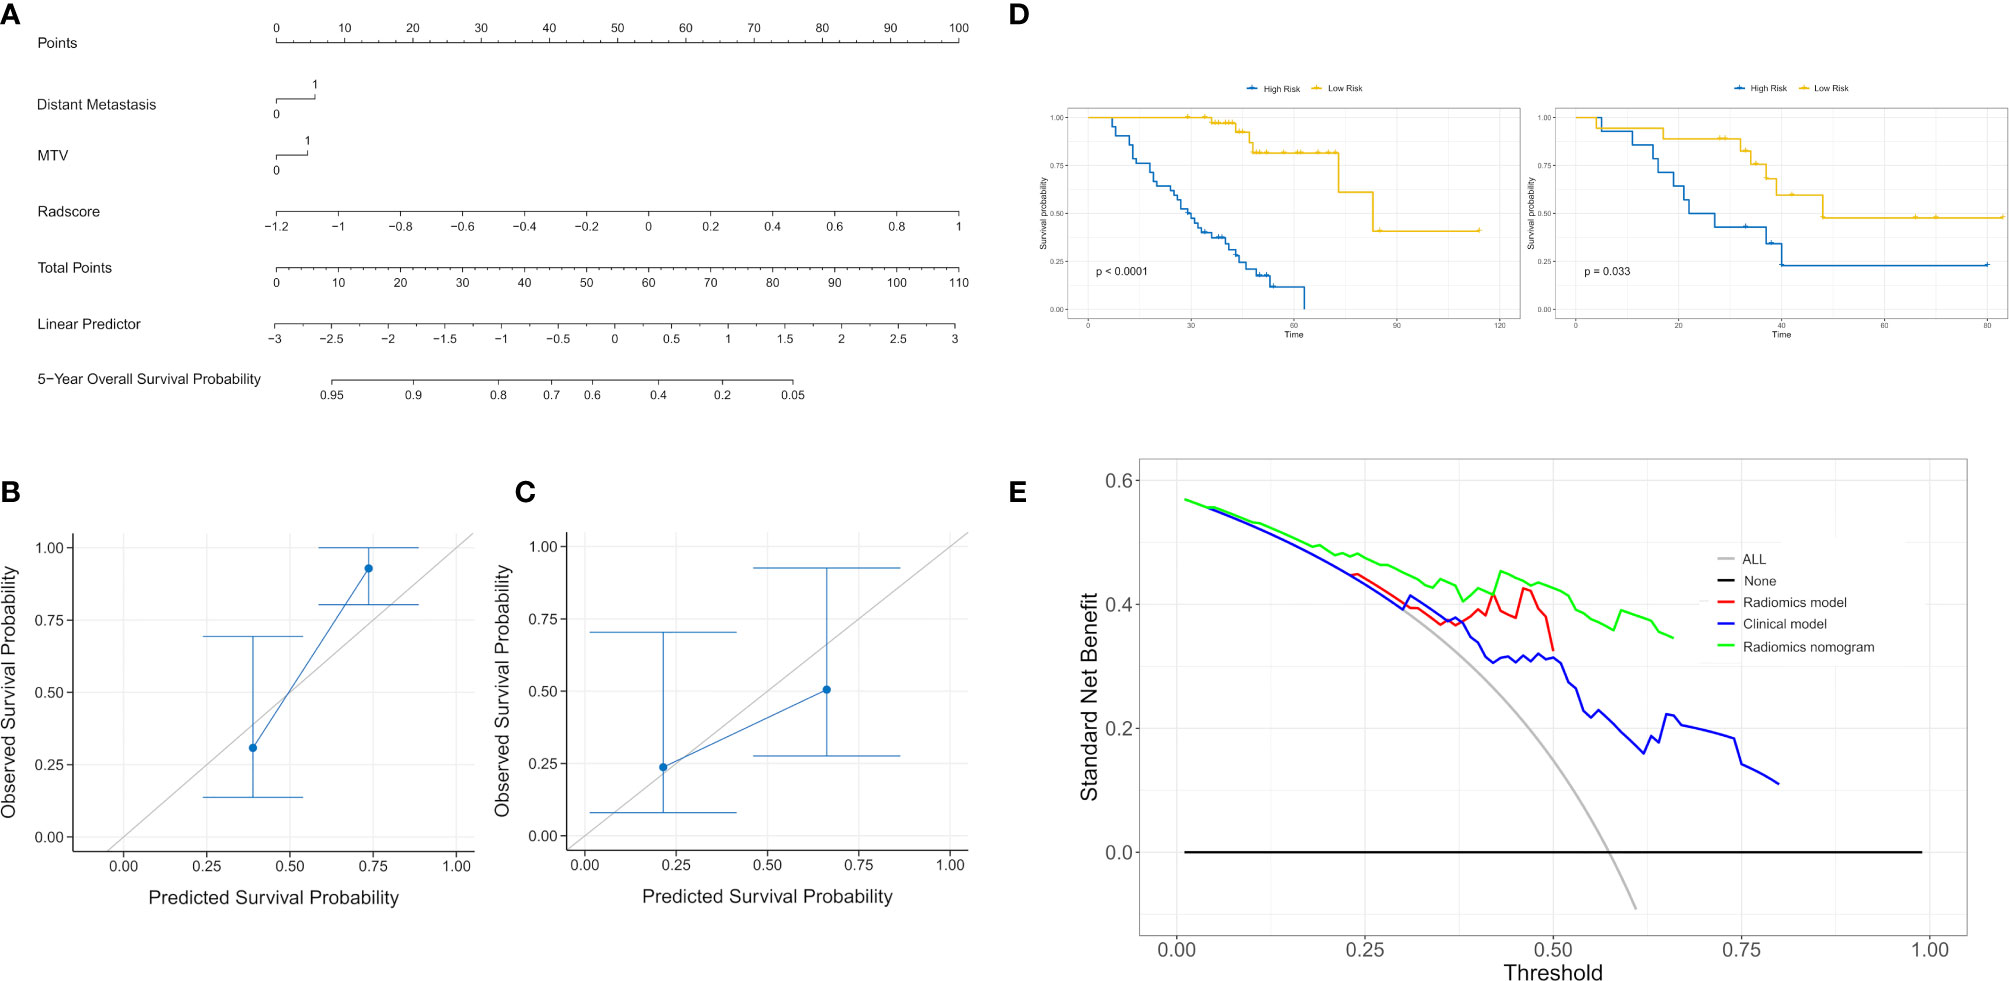
Figure 4 (A) A radiomics nomogram for prediction of 5-year overall survival for patients with lung adenocarcinoma of EGFR mutations. (B) Calibration curve of the radiomics nomogram in the training cohort. (C) Calibration curve of the radiomics nomogram in the validation cohort. Calibration curve for the estimation of 5-year overall survival as predicted by the nomogram. The nomogram-estimated overall survival is plotted on the x-axis, and the actual overall survival is plotted on the y-axis. Dash line represents an ideal agreement. (D) The Kaplan–Meier curve showed that this nomogram score could effectively discriminate high-risk patients from low-risk patients. (E) The decision curve analysis for each model. The y-axis denotes the net benefit, which was calculated using true-positive and false-positive results. The radiomics nomogram model has the highest net benefit at the threshold from 0.1 to 0.9 among all positive predictions (line labeled “All”); all negative predictions (line labeled “None”) and two other clinical models (line labeled “Radiomics model and clinical model”).
To Guide the Targeted Treatment for Lung Adenocarcinoma in Patients With EGFR Mutations
According to the cut-off value of nomogram score at 0.369, the corresponding 5-year overall survival probability was 0.58. Patients with an EGFR-mutation were divided into high- and low-risk groups, and the sensitivity of high- and low-risk patients to chemotherapy and targeted therapy was analyzed. The results showed that high-risk patients had a higher sensitivity to targeted therapy (p < 0.0001), indicating that targeted therapy is the main treatment method for patients with high-risk EGFR mutations, while the prognoses of the two therapies were similar in the low-risk group (p = 0.85, Figures 5A, B). In patients with an 19DEL mutation, there was no significant difference in the sensitivity to chemotherapy and targeted therapy (p = 0.45). The patients with a 21L858R-mutation had significant differences in sensitivity to chemotherapy and targeted therapy, and the patients with a 21L858R-mutation were more likely to benefit from targeted therapy (p = 0.042; Figures 5C, D). In addition, there was no significant difference between patients with a 19DEL-mutation and patients with a 21L858R-mutation in their benefit from chemotherapy (p = 0.29; Figure 5E).
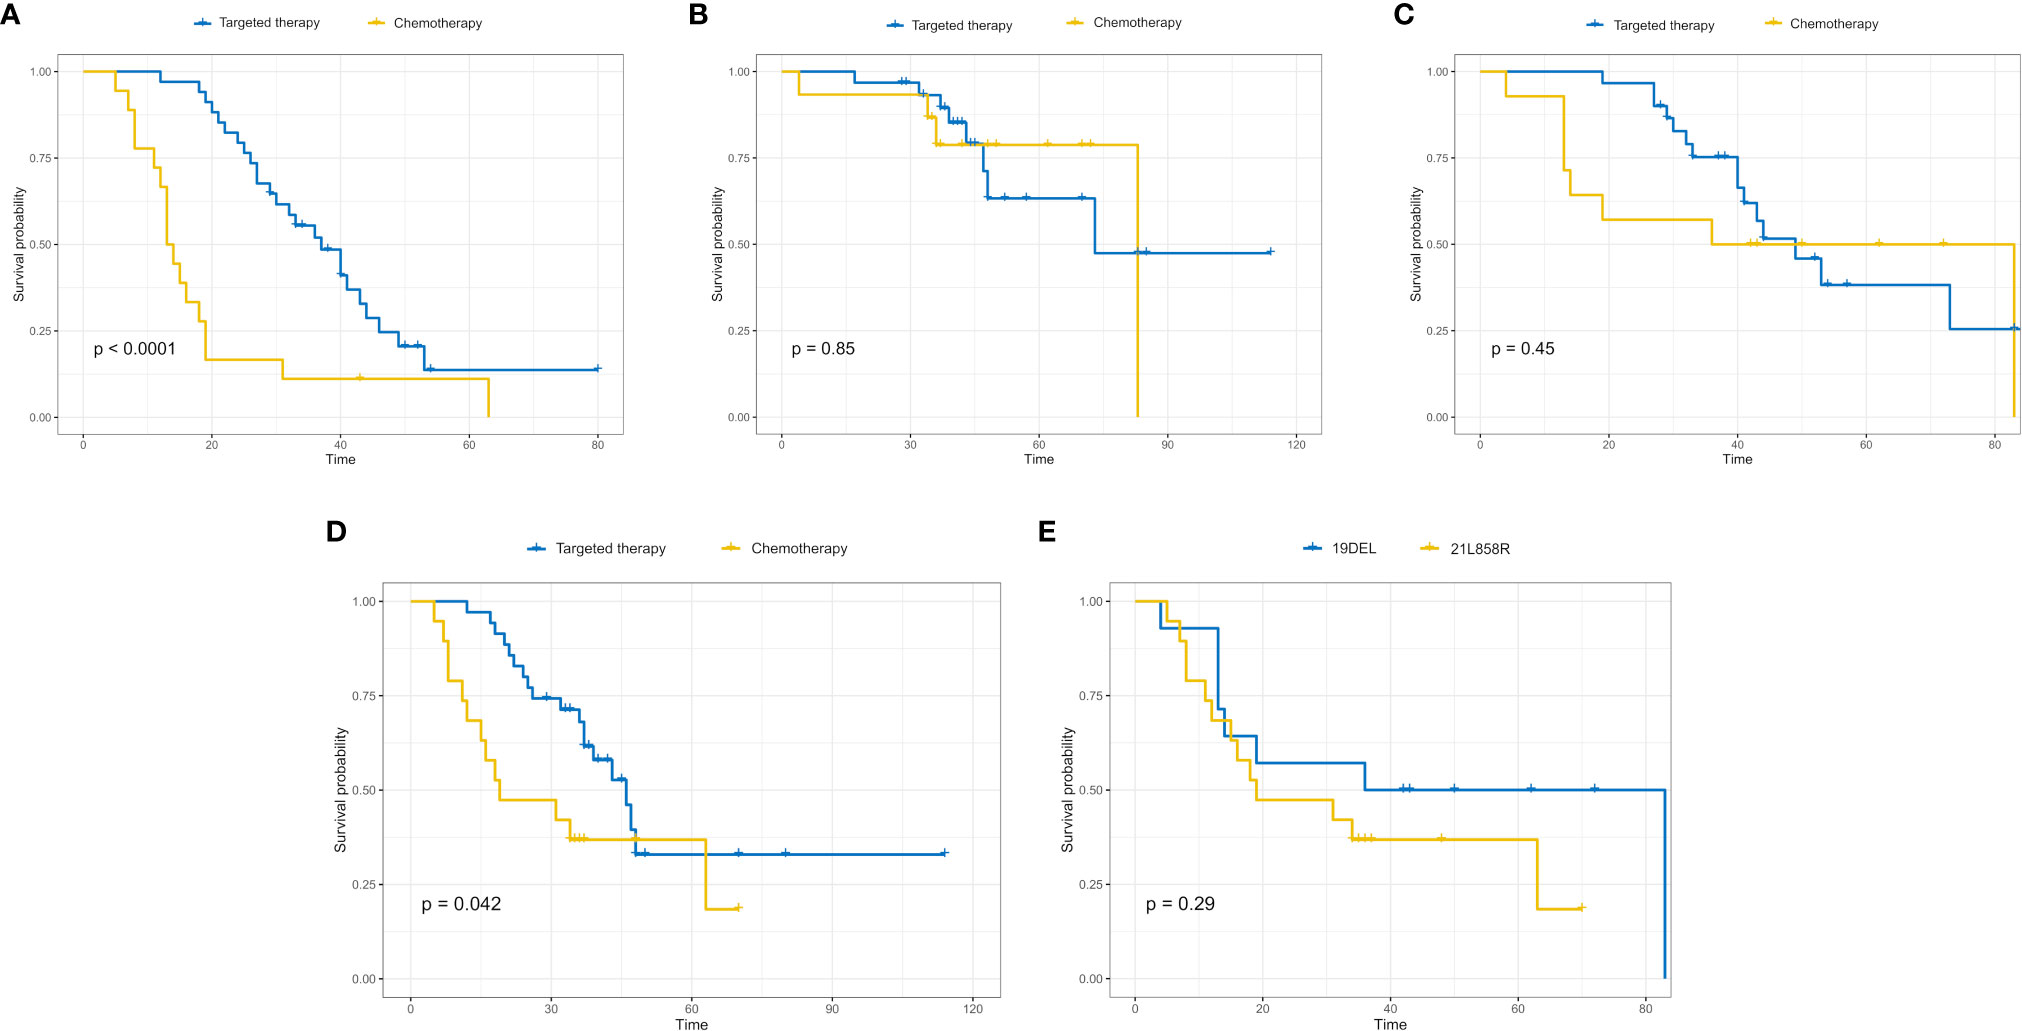
Figure 5 High-risk patients with EGFR mutations had a higher sensitivity to targeted therapy (p < 0.0001) (A), while the sensitivity of low-risk patients to targeted therapy and chemotherapy was not significantly different (p = 0.85) (B). In high-risk patients, the sensitivity of patients with the 19DEL mutation to chemotherapy and targeted therapy was not significantly different (p = 0.45) (C), while the sensitivity of patients with the 21L858R-mutation to chemotherapy and targeted therapy was significantly different (p = 0.042) (D). (E) The sensitivity of patients with the 19DEL- and 21L858R-mutations to chemotherapy was not significantly different (p = 0.29).
Discussion
In our study, we developed a radiomics nomogram based on 18F-FDG PET/CT radiomics features combined with clinicopathological factors to predict survival outcomes in patients with lung adenocarcinoma of EGFR mutations, with the aim of providing guidance for personalized targeted treatment of patients with lung adenocarcinoma with EGFR mutations.
In the CPH model for evaluating the prognosis of patients with EGFR mutations, distant metastasis, MTV, stage, CEA, and SUVmax were the significant prognostic risk factors. Among them, the patient’s risk of death was higher when the patient had MTV (>7.32). MTV is a parameter that reflected the metabolic burden of the whole-body tumor compared with other PET/CT semiquantitative parameters and related clinicopathological factors. It can more effectively stratify the risk of patients and identify high-risk groups. In particular, it can effectively evaluate the prognosis of patients with advanced lung cancer. This was consistent with our findings (34, 35). SUVmax is the most used metabolic parameter of PET/CT in clinical work and only represents a single pixel value of the tumor metabolism that is most active in the outlined area. Whether SUVmax is an independent risk factor for lung cancer remains controversial (22). Some studies believe that SUVmax can effectively indicate the degree of tumor differentiation and provide evidence for the prognosis of patients (36). Our study demonstrated that when SUVmax (>5.33), the patient’s risk of death increased. This was consistent with our findings.
In addition, we combined the rad score with independent risk factors (Distant metastasis and MTV) based on multivariate Cox regression analysis to construct a radiomics nomogram that predicted survival outcomes of patients with EGFR mutations. The results showed that a radiomics nomogram can predict survival outcomes very well. Its’ C-index was 0.840 and 0.803 in the training and validation cohorts, respectively, which could stratify high- and low-risk groups quite well. At present, few studies based on PET/CT radiomics have predicted the survival of lung cancer patients with EGFR mutations, and their predictive performances were generally poor (37, 38). Kirienko et al. (28) used radiomics signatures based on PET/CT to predict disease-free survival (DFS) of patients with NSCLC after surgery. The results showed that the AUC of the Cox model based on the radiomics signature was 0.68, and the AUC was 0.65 after combining it with clinical predictors. Moreover, the current study focused mainly on a CT modality while predicting survival, and the value of the C-index was usually not well i.e., did not exceed 0.70. The performance improved after combining it with clinicopathological factors (39, 40). Our results showed that the C-index reached 0.803, and our result was a small breakthrough in the results of previous studies. To guide the treatment of patients with EGFR mutations, our study analyzed the effects of different treatment strategies on the prognosis of patients with EGFR mutations. Our results showed that the rad score could stratify patients with EGFR mutations into high- and low-risk groups. For patients who were at high risk, targeted therapy is recommended to improve survival. For patients at low risk, there was no significant difference in survival regardless of whether targeted therapy or chemotherapy was chosen. The patients with a 21L858R-mutation had significant differences in sensitivity to chemotherapy and targeted therapy, and the patients with a 21L858R-mutation were more likely to benefit from targeted therapy. However, in patients with a 19DEL mutation, there was no significant difference in the sensitivity to chemotherapy and targeted therapy. It may be due to the small sample size and the bias caused by retrospective study. In addition, there was no significant difference between patients with a 19DEL mutation and patients with a 21L858R-mutation in their benefit from chemotherapy. It illustrated that patients with EGFR mutations may not benefit from chemotherapy. Our results indicated that radiomics features could identify patients who are more likely to benefit from targeted therapy among patients with EGFR mutations, and would benefit from treatment guidance.
Our study had many strengths. First, our study not only predicted survival outcomes in lung adenocarcinoma patients with EGFR mutations, but also identified patients with EGFR mutations who were likely to benefit from targeted therapy through rad score. We provided guidance for the selection of treatment methods in patients with EGFR mutations, which was rarely reported in previous studies. Second, patients in this study were scanned using the same PET/CT device used in a standard protocol, which avoided the heterogeneity of image impressions caused by the use of different scans and reconstruction parameters. This led to more stable and reliable results.
Our study had some limitations. First, this was a retrospective study with a small data set and no external validation, which may have introduced selection bias. Second, we only studied the effect of treatment on the prognosis of patients with lung adenocarcinoma and an EGFR mutation status and did not consider the influence of other genes. Further studies are essential to evaluate other genes comprehensively.
In conclusion, a 18F-FDG PET/CT rad score combined with clinicopathological factors can predict the survival outcomes of patients with lung adenocarcinoma with an EGFR mutation. This novel and non-invasive approach can be provide with a more precise imaging diagnosis and personalized treatment guidance for patients with an EGFR mutant and have a significant clinical application value.
Data Availability Statement
The raw data supporting the conclusions of this article will be made available by the authors, without undue reservation.
Ethics Statement
The institutional review board of Affiliated Jinling Hospital, Medical School of Nanjing University approved this retrospective study and waived the need to obtain informed consent from the patients.
Author contributions
BY conceived the idea of the study. BY, HJ, JinZ, LM, JiaZ, HD, and CZ collected the data. HZ and GL performed image analysis. BY wrote the manuscript. SD performed the statistical analysis. CZ, JT, LZ, FW, and GL edited and reviewed the manuscript. All authors contributed to the article and approved the submitted version.
Funding
This work was supported by the National Key Research and Development Program of China (2017YFC0113400 for LZ) and Natural Science Foundation of Jiangsu Province (BK2011665).
Conflict of Interest
S-fD was employed by GE Healthcare China.
The remaining authors declare that the research was conducted in the absence of any commercial or financial relationships that could be construed as a potential conflict of interest.
Acknowledgments
We would like to thank all the personnel from the Department of Nuclear Medicine and Department of Medical Imaging, Affiliated Jinling Hospital, Medical school of Nanjing University for their collective efforts on the image post-processing, clinical management, and follow-up.
Supplementary Material
The Supplementary Material for this article can be found online at: https://www.frontiersin.org/articles/10.3389/fonc.2020.567160/full#supplementary-material
Abbreviations
CEA, carcinoembryonic antigen; EGFR, epidermal growth factor receptor; MTV, metabolic tumor volume; NSCLC, non-small cell lung cancer; PET/CT, positron emission tomography/computed tomography; SUVmax, maximal standard uptake value; SUVmean, mean standard uptake value; TKIs, tyrosine kinase inhibitors; TLG, total lesion glycolysis.
References
1. Torre LA, Bray F, Siegel RL, Ferlay J, Lortet-Tieulent J, Jemal A. Global cancer statistics, 2012. CA Cancer J Clin (2015) 65:87–108. doi: 10.3322/caac.21262
2. Siegel RL, Miller KD. Cancer Statistics, 2017. CA Cancer J Clin (2017) 67:7–30. doi: 10.3322/caac.21387
3. Brawley OW. Avoidable cancer deaths globally. CA Cancer J Clin (2011) 61:67–8. doi: 10.3322/caac.20108
4. Oser MG, Niederst MJ, Sequist LV. Transformation from non-small cell lung cancer to small-cell lung cancer: molecular drivers and cells of origin. Lancet Oncol (2015) 16:e165–172. doi: 10.1016/S1470-2045(14)71180-5
5. Molina JR, Yang P, Cassivi SD, Schild SE, Adjei AA. Non-small cell lung cancer: epidemiology, risk factors, treatment, and survivorship. Mayo Clin Proc (2008) 83:584–94. doi: 10.4065/83.5.584
6. Curran WJ Jr, Paulus R, Langer CJ, Komaki R, Lee JS, Hauser S, et al. Sequential vs. concurrent chemoradiation for stage III non-small cell lung cancer: randomized phase III trial RTOG 9410. J Natl Cancer Inst (2011) 103:1452–60. doi: 10.1093/jnci/djr325
7. Ferlay J, Soerjomataram I, Dikshit R, Eser S, Mathers C, Rebelo M, et al. Cancer incidence and mortality worldwide: sources, methods and major patterns in GLOBOCAN 2012. Int J Cancer (2015) 136:E359–86. doi: 10.1002/ijc.29210
8. Siegel RL, Miller KD. Cancer statistics, 2018. CA Cancer J Clin (2018) 68:7–30. doi: 10.3322/caac.21442
9. Goldstraw P, Chansky K, Crowley J, Rami-Porta R, Asamura H, Eberhardt WE, et al. The IASLC Lung Cancer Staging Project: Proposals for Revision of the TNM Stage Groupings in the Forthcoming (Eighth) Edition of the TNM Classification for Lung Cancer. J Thorac Oncol (2016) 11:39–51. doi: 10.1016/j.jtho.2015.09.009
10. Sculier JP, Chansky K, Crowley JJ, Van Meerbeeck J, Goldstraw P. The impact of additional prognostic factors on survival and their relationship with the anatomical extent of disease expressed by the 6th Edition of the TNM Classification of Malignant Tumors and the proposals for the 7th Edition. J Thorac Oncol (2008) 3:457–66. doi: 10.1097/JTO.0b013e31816de2b8
11. Chansky K, Sculier JP, Crowley JJ, Giroux D, Van Meerbeeck J, Goldstraw P. The International Association for the Study of Lung Cancer Staging Project: prognostic factors and pathologic TNM stage in surgically managed non-small cell lung cancer. J Thorac Oncol (2009) 4:792–801. doi: 10.1097/JTO.0b013e3181a7716e
12. Kawaguchi T, Takada M, Kubo A, Matsumura A, Fukai S, Tamura A, et al. Performance status and smoking status are independent favorable prognostic factors for survival in non-small cell lung cancer: a comprehensive analysis of 26,957 patients with NSCLC. J Thorac Oncol (2010) 5:620–30. doi: 10.1097/JTO.0b013e3181d2dcd9
13. Higashi K, Ueda Y, Arisaka Y, Sakuma T, Nambu Y, Oguchi M, et al. 18F-FDG uptake as a biologic prognostic factor for recurrence in patients with surgically resected non-small cell lung cancer. J Nucl Med (2002) 43:39–45. doi: 10.1587/transcom.E96.B.802
14. Liang W, Zhang L, Jiang G, Wang Q, Liu L, Liu D, et al. Development and validation of a nomogram for predicting survival in patients with resected non-small-cell lung cancer. J Clin Oncol (2015) 33:861–9. doi: 10.1200/JCO.2014.56.6661
15. Wang L, Dong T, Xin B, Xu C, Guo M, Zhang H, et al. Integrative nomogram of CT imaging, clinical, and hematological features for survival prediction of patients with locally advanced non-small cell lung cancer. Eur Radiol (2019) 29:2958–67. doi: 10.1007/s00330-018-5949-2
16. Valentini V, van Stiphout RG, Lammering G, Gambacorta MA, Barba MC, Bebenek M, et al. Nomograms for predicting local recurrence, distant metastases, and overall survival for patients with locally advanced rectal cancer on the basis of European randomized clinical trials. J Clin Oncol (2011) 29:3163–72. doi: 10.1200/JCO.2010.33.1595
17. Han DS, Suh YS, Kong SH, Lee HJ, Choi Y, Aikou S, et al. Nomogram predicting long-term survival after d2 gastrectomy for gastric cancer. J Clin Oncol (2012) 30:3834–40. doi: 10.1200/JCO.2012.41.8343
18. Chun FK, Briganti A, Graefen M, Montorsi F, Porter C, Scattoni V, et al. Development and external validation of an extended 10-core biopsy nomogram. Eur Urol (2007) 52:436–44. doi: 10.1016/j.eururo.2006.08.039
19. Goodgame B, Pillot GA, Yang Z, Shriki J, Meyers BF, Zoole J, et al. Prognostic value of preoperative positron emission tomography in resected stage I non-small cell lung cancer. J Thorac Oncol (2008) 3:130–4. doi: 10.1097/JTO.0b013e318160c122
20. Kim HR, Kim DJ, Lee WW, Jheon S, Sung SW. The significance of maximum standardized uptake values in patients with stage I pulmonary adenocarcinoma. Eur J Cardiothorac Surg (2009) 35:712–6. doi: 10.1016/j.ejcts.2008.12.030
21. Hoang JK, Hoagland LF, Coleman RE, Coan AD, Herndon JE 2nd, Patz EF Jr. Prognostic value of fluorine-18 fluorodeoxyglucose positron emission tomography imaging in patients with advanced-stage non-small-cell lung carcinoma. J Clin Oncol (2008) 26:1459–64. doi: 10.1200/JCO.2007.14.3628
22. Inal A, Kucukoner M, Kaplan MA, Urakci Z, Karakus A, Komek H, et al. Prognostic value of fluorine-18 fluorodeoxyglucose positron emission tomography in patients with advanced non-small cell lung cancer: single center experience. J BUON (2012) 17:724–8. doi: 10.1097/MD.0000000000009877
23. Hatt M, Majdoub M, Vallières M, Tixier F, Le Rest CC, Groheux D, et al. 18F-FDG PET uptake characterization through texture analysis: investigating the complementary nature of heterogeneity and functional tumor volume in a multi-cancer site patient cohort. J Nucl Med (2015) 56:38–44. doi: 10.2967/jnumed.114.144055
24. Kirienko M, Gallivanone F, Sollini M, Veronesi G, Voulaz E, Antunovic L, et al. FDG PET/CT as theranostic imaging in diagnosis of non-small cell lung cancer. Front Biosci (Landmark Ed) (2017) 22:1713–23. doi: 10.2741/4567
25. Desseroit MC, Visvikis D, Tixier F, Majdoub M, Perdrisot R, Guillevin R, et al. Development of a nomogram combining clinical staging with (18)F-FDG PET/CT image features in non-small-cell lung cancer stage I-III. Eur J Nucl Med Mol Imaging (2016) 43:1477–85. doi: 10.1007/s00259-016-3325-5
26. Grootjans W, de Geus-Oei LF, Troost EG, Visser EP, Oyen WJ, Bussink J, et al. PET in the management of locally advanced and metastatic NSCLC. Nat Rev Clin Oncol (2015) 12:395–407. doi: 10.1038/nrclinonc.2015.75
27. Dou TH, Coroller TP, van Griethuysen JJM, Mak RH, Aerts HJWL. Peritumoral radiomics features predict distant metastasis in locally advanced NSCLC. PLoS One (2018) 13:e0206108. doi: 10.1371/journal.pone.0206108
28. Kirienko M, Cozzi L, Antunovic L, Lozza L, Fogliata A, Voulaz E, et al. Prediction of disease-free survival by the PET/CT radiomic signature in non-small cell lung cancer patients undergoing surgery. Eur J Nucl Med Mol Imaging (2018) 45:207–17. doi: 10.1007/s00259-017-3837-7
29. Wels MG, Lades F, Muehlberg A, et al. General purpose radiomics for multi-modal clinical research. In: Proceedings of the SPIE 10950, medical imaging 2019: computer-aided diagnosis,10950-150 (2019). doi: 10.1117/12.2511856
30. Zwanenburg A, Vallières M, Abdalah MA, Aerts HJWL, Andrearczyk V, Apte A, et al. The Image Biomarker Standardization Initiative: Standardized Quantitative Radiomics or High-Throughput Image-based Phenotyping. Radiology (2020) 295(2):328–38. doi: 10.1148/radiol.2020191145
31. Sauerbrei W, Royston P. Selection of important variables and determination of functional form for continuous predictors in multivariable model building. Stat Med (2007) 26:5512–28. doi: 10.1002/sim.3148
32. Huang YQ, Liang CH, He L, Tian J, Liang CS, Chen X, et al. Development and Validation of a Radiomics Nomogram for Preoperative Prediction of Lymph Node Metastasis in Colorectal Cancer. J Clin Oncol (2016) 34:2157–64. doi: 10.1200/JCO.2015.65.9128
33. Yang L, Yang J, Zhou X, Huang L, Zhao W, Wang T, et al. Development of a radiomics nomogram based on the 2D and 3D CT features to predict the survival of non-small cell lung cancer patients. Eur Radiol (2019) 29:2196–206. doi: 10.1007/s00330-018-5770-y
34. Liao S, Penney BC, Zhang H, Suzuki K, Pu Y. Prognostic value of the quantitative metabolic volumetric measurement on 18F-FDG PET/CT in Stage IV nonsurgical small-cell lung cancer. Acad Radiol (2012) 19:69–77. doi: 10.1016/j.acra.2011.08.020
35. Hyun SH, Ahn HK, Kim H, Ahn MJ, Park K, Ahn YC, et al. Volume-based assessment by (18)F-FDG PET/CT predicts survival in patients with stage III non-small-cell lung cancer. Eur J Nucl Med Mol Imaging (2014) 41:50–8. doi: 10.1007/s00259-013-2530-8
36. Duan XY, Wang W, Li M, Li Y, Guo YM. Predictive significance of standardized uptake value parameters of FDG-PET in patients with non-small cell lung carcinoma. Braz J Med Biol Res (2015) 48:267–72. doi: 10.1590/1414-431x20144137
37. Kim DH, Jung JH, Son SH, Kim CY, Hong CM, Oh JR, et al. Prognostic Significance of Intratumoral Metabolic Heterogeneity on 18F-FDG PET/CT in Pathological N0 Non-Small Cell Lung Cancer. Clin Nucl Med (2015) 40:708–14. doi: 10.1097/RLU.0000000000000867
38. Tixier F, Hatt M, Valla C, Fleury V, Lamour C, Ezzouhri S, et al. Visual versus quantitative assessment of intratumor 18F-FDG PET uptake heterogeneity: prognostic value in non-small cell lung cancer. J Nucl Med (2014) 55:1235–41. doi: 10.2967/jnumed.113.133389
39. Lee J, Li B, Cui Y, Sun X, Wu J, Zhu H, et al. A Quantitative CT Imaging Signature Predicts Survival and Complements Established Prognosticators in Stage I Non-Small Cell Lung Cancer. Int J Radiat Oncol Biol Phys (2018) 102:1098–106. doi: 10.1016/j.ijrobp.2018.01.006
Keywords: lung adenocarcinoma, positron emission tomography/computed tomography, radiomics, nomogram, targeted therapy
Citation: Yang B, Ji H, Zhong J, Ma L, Zhong J, Dong H, Zhou C, Duan S, Zhu C, Tian J, Zhang L, Wang F, Zhu H and Lu G (2020) Value of 18F-FDG PET/CT-Based Radiomics Nomogram to Predict Survival Outcomes and Guide Personalized Targeted Therapy in Lung Adenocarcinoma With EGFR Mutations. Front. Oncol. 10:567160. doi: 10.3389/fonc.2020.567160
Received: 29 May 2020; Accepted: 05 October 2020;
Published: 11 November 2020.
Edited by:
Laurent Dercle, Columbia University Irving Medical Center, United StatesReviewed by:
Yuming Jiang, Stanford University, United StatesLiyu Huang, Xidian University, China
Ying Liu, Tianjin Medical University Cancer Institute and Hospital, China
Copyright © 2020 Yang, Ji, Zhong, Ma, Zhong, Dong, Zhou, Duan, Zhu, Tian, Zhang, Wang, Zhu and Lu. This is an open-access article distributed under the terms of the Creative Commons Attribution License (CC BY). The use, distribution or reproduction in other forums is permitted, provided the original author(s) and the copyright owner(s) are credited and that the original publication in this journal is cited, in accordance with accepted academic practice. No use, distribution or reproduction is permitted which does not comply with these terms.
*Correspondence: Guangming Lu, Y2pyLmx1Z3VhbmdtaW5nQHZpcC4xNjMuY29t; Hong Zhu, emhfenlAMTYzLmNvbQ==
†These authors have contributed equally to this work