 Mohit Arora
 Sarita Kumari
 Jay Singh
 Anita Chopra
 Shyam S. Chauhan
- 1Department of Biochemistry, All India Institute of Medical Sciences, New Delhi, India
- 2Laboratory Oncology Unit, Dr. B. R. Ambedkar Institute Rotary Cancer Hospital (Dr. BRA-IRCH), All India Institute of Medical Sciences, New Delhi, India
Melanoma associated antigen (MAGE) is an extensively studied family of tumor-associated genes that share a common MAGE homology domain (MHD). Based upon their expression pattern, MAGE genes have been broadly classified into type 1 MAGEs (T1Ms) and type 2 MAGEs (T2Ms) categories. Interestingly, several T2Ms are highly expressed in the brain and involved in the regulation of neuronal development, differentiation, and survival. Available literature suggests possible tumor suppressor functions of a few T2Ms, while information available about their expression, regulation, and clinical significance in glioma is scanty. This prompted us to perform a comprehensive analysis of T2M expression in glioma. Gene expression data from glioma datasets: Oncomine, TCGA, and REMBRANDT study, were used to assess the mRNA expression of T2M genes (MAGED1, MAGED2, MAGED3, MAGED4, MAGED4B, MAGEE1, MAGEE2, MAGEF1, MAGEH1, MAGEL2, NSMCE3, and NDN), and their association with clinical characteristics and composition of the tumor microenvironment. Further, mutation, copy number alteration, and DNA methylation data from TCGA were assessed for determining potential mechanisms of T2Ms expression in glioma. Expression analysis revealed overexpression of MAGED subfamily genes in glioma, while other genes of this family exhibited reduced expression in advanced grades of this malignancy. Further, the expression of T2Ms exhibited varying extent of positive correlations with each other. Amongst downregulated T2Ms, MAGEH1 expression exhibited negative correlations with DNA methylation. Additionally, genes associated with MAGEH1 were enriched in Myc and Hedgehog signaling. Furthermore, T2Ms downregulation was associated with immune infiltration in glioma tissues and poor overall survival of glioma patients. In multivariate Cox regression analysis, MAGEH1 emerged as an independent prognosticator in lower grade glioma. Conclusively, these results suggest that expression of T2Ms is associated with important clinical and molecular features in glioma. Mechanistic studies may further provide novel insights into their role in glioma progression.
Introduction
Gliomas are a group of heterogeneous primary malignant brain tumors with a dismal outcome (1). Histopathological classification of glioma has been constantly evolving with the most recent WHO classification, 2016, classifying gliomas as astrocytic, oligodendroglial or mixed oligo-astrocytic, and further graded as WHO grade I and II (low grades), III (anaplastic) or IV (glioblastoma multiforme) (2). Molecular alterations in glioma including genetic as well as epigenetic changes have been constantly determined and integrated into common clinical practice (2, 3). Isocitrate dehydrogenase gene (IDH) mutation and co-deletion of chromosome 1p and 19q (1p/19q codeletion) are frequently observed in low grade gliomas and associated with better patient prognosis (4). IDH mutation confers global epigenomic changes, commonly called the CpG island methylation phenotype (G-CIMP) leading to suppression of tumor suppressor genes (5). Also, methylation O-6-methylguanine-DNA methyltransferase (MGMT) gene promoter is associated with better response to temozolomide (TMZ) chemotherapy (6). While these biomarkers help in the management of glioma with the current treatment regimen, identification of novel molecular features may provide better therapeutic opportunities in glioma.
Melanoma associated antigen (MAGE) gene family consists of more than 50 genes that share a common MAGE homology domain (MHD) (7, 8). MAGE genes evolved through transposition and segmental duplications in the genome (9). Based on chromosomal location and pattern of gene expression, members of this family are further subdivided into two types. Type 1 MAGEs (T1Ms) include MAGE-A, B, and C subfamilies. The human T1Ms are present as clusters on the X chromosome. T1Ms display germ cell and cancer specific expression, and thereby fulfill the criteria of cancer testis antigens. T1M peptides are recognized by cytotoxic T lymphocytes (CTLs) in a variety of cancers and serve as ideal candidate antigens for tumor vaccines (10–12). Human Genome Organisation (HUGO) has approved the inclusion of twelve Type 2 MAGEs (T2Ms), including MAGED1, MAGED2, MAGED3 (TRO), MAGED4, MAGED4B, MAGEE1, MAGEE2, MAGEF1, MAGEH1, MAGEL2, NSMCE3, and NDN (Necdin). T2Ms are not restricted to X chromosome and are expressed in a variety of tissues.
The current knowledge of the physiological functions of the MAGE genes is mostly related to T1Ms. Several T1Ms form complex with E3 RING ubiquitin ligases to form MAGE-RING ligases (MRLs) that are involved in ubiquitination mediated protein degradation and other cellular processes such as regulation of transcription and cell cycle (8). T1Ms have also been implicated in apoptosis, cancer cell invasion (13), stem cell maintenance, and DNA repair (14). However, information about the functions of T2Ms is limited. MAGED1, MAGEH1, and NDN are highly expressed in the brain and involved in neuronal development (8, 15, 16). MAGEE1 and MAGED4 were initially identified as brain specific members of the MAGE gene family and were significantly enriched in glial tissues (17, 18). However, Necdin is a neuron specific growth suppressor, is downregulated in tumors, including glioma and tumor cell lines, thereby confirming its tumor suppressor functions (19, 20). Low frequency mutations of MAGEH1 in glioma have been shown to affect its nuclear localization (21). Furthermore, aberrant MAGEH1 expression has been linked to dementia (22). These studies suggest crucial roles of T2Ms in neuronal growth, survival and possibly in the pathogenesis of central nervous system diseases, including glioma.
Although wide variations in the nucleotide sequences of regulatory regions of T1Ms enables their differential expression (9), epigenetic alterations including DNA methylation and histone modification underlie the co-expression of several T1Ms and other tumor associated antigens in cancers (23). On the contrary, all T2Ms display striking sequence homology in their regulatory regions which possibly permit a common mechanism to control their expression (9). Although contradictory reports also exist regarding maternal imprinting of the Necdin gene (24, 25), epigenetic regulation of MAGED4 in glioma is documented (18). While current evidence suggests crucial roles of T2Ms in normal brain functions and neurological disorders, no systematic study has been done to investigate the expression, regulation, cellular function, and clinical significance of T2Ms in glioma. Therefore, the current study was undertaken to investigate the regulatory mechanism responsible for altered expression of T2Ms, their cellular functions, and clinical significance in glioma using large scale multi-omics datasets.
Materials and Methods
Cell Culture
Human glioblastoma cells U87MG and LN229 (National Centre for Cell Science, Pune, India) were grown in a medium containing RPMI-1640 (HiMedia Laboratories, India), supplemented with 10% (v/v) Fetal bovine serum (Gibco Thermo Fisher Scientific Inc.), 1% penicillin and streptomycin (Gibco, Thermo Fisher Scientific Inc.) in a humidified atmosphere containing 5% CO2 at 37°C.
5’Azacytidine Treatment and qRT-PCR
Human glioblastoma cells (2X 10⁴) were plated in each well of 6 well dish. The next day the cells were treated with 1 µM Azacytidine (#A2385, Sigma-Aldrich). After 48 h the cells were washed twice with ice-cold PBS and processed for total cellular RNA isolation using Trizol reagent (Thermo Fisher Scientific Inc.) as per manufacturer’s protocol. One µg of total RNA was reverse transcribed using random hexamers, dNTPs, and M-MuLV reverse transcriptase enzyme (Fermentas, USA). The MAGEH1 expression was determined by quantitative Real-time PCR using primers Forward, 5’-CGGAGCAATTTTCAGGGCAC-3’; Reverse, 5’- AGCACTTTCCAGACCAGAGC-3’. The mRNA expression of MAGEH1 was normalized to 18S ribosomal RNA using primers: Forward, 5’-GTAACCCGTTGAACCCCATT-3’; Reverse, 5’-CCATCCAATCGGTAGTAGCG-3’. Ct values for each PCR were analyzed by the 2-ΔCt method. Total cellular RNA isolated from vehicle-treated glioblastoma cells was processed identically and served as control. Depicted results were drawn based on three biological replicates.
Data Retrieval
For mRNA expression analysis, two datasets were utilized. First, RNA seq data of TCGA-LGG-GBM dataset, which was originally sourced from Broad GDAC Firehose (http://gdac.broadinstitute.org/) contained 515 patients (TCGA-LGG dataset, grade 2 and grade 3 combined) and 152 GBM samples (TCGA-GBM dataset). Second, microarray gene expression data from REMBRANDT (REpository for Molecular BRAin Neoplasia DaTa) was sourced from NCBI-GEO (accession number GSE108476, https://www.ncbi.nlm.nih.gov/geo/) consisting 28 non-tumor brain tissues, 225 lower grade (grade II +III), and 219 GBM tumor samples. Both the datasets were accessed from the GlioVis web server (http://gliovis.bioinfo.cnio.es/) and used for analysis using tools provided in the webserver (26–28). Expression, correlation, and survival analysis were performed using default parameters, without modifications.
Correlation and Pathway Enrichment Analysis
For correlation analysis in TCGA-LGG and GBM data, the correlation module of the GlioVis tool was used. Gene expression data from three randomly chosen TCGA datasets including TCGA skin cutaneous melanoma, TCGA breast cancer and TCGA lung squamous cell carcinoma, along with CCLE pan-cancer cell line data of 1156 cell lines, were downloaded from cBioPortal website (https://www.cbioportal.org/) (29, 30). Spearman’s correlation analysis was performed followed by heatmap generation and hierarchical clustering using HemI software (31). The default parameters of hierarchical clustering using the average linkage method and Pearson distance were used. Similarly, whole transcriptome correlations of MAGEH1 were extracted for TCGA-LGG dataset using cBioPortal. After applying a filter for a cutoff of FDR corrected p-value of 0.05 for Spearman’s r value, a total of 13,536 genes with Spearman’s r value ranging from 0.689 to -0.660 were available for gene set enrichment analysis in GSEA software (Broad Institute, http://www.broad.mit.edu/gsea/) (32). Predefined molecular signature database hallmark gene set (version 7.1) was used as a reference gene set for pathway enrichment (33).
DNA Methylation Analysis
DNA methylation of T2Ms in TCGA cancer datasets was estimated and visualized using MEXPRESS web server (https://mexpress.be) (34, 35). The MEXPRESS web server uses DNA methylation data of cancer and normal tissues from TCGA datasets, which were originally developed on the “Illumina 450k Beadchip” platform. The predesignated methylation probes for each gene were taken into consideration.
Survival Analysis
Kaplan-Meier survival analysis was performed using a survival tool available at the GlioVis web server, which utilized the “survival” package in R to generate Kaplan-Meier plots. Hazard ratios are determined to utilize the “coxph” function from the “survival” package. For Kaplan-Meier analysis, Patients were distributed in high and low expression groups based on optimal cutoff determined using maximally selected rank statistics (maxstat) function for continuous variables, as provided in the “survminer” package. For survival analysis using univariate and multivariate Cox regression, MAGEH1 and MAGED1 expression was taken as a continuous variable. For TCGA-LGG and TCGA-GBM datasets, information on overall survival, disease-specific survival, progression-free interval, and the disease-free interval was available. For, TCGA-GBM data, disease-free interval events were excluded as suggested previously (36).
TIMER Analysis
Tumor immune estimation score (TIMER) database (https://cistrome.shinyapps.io/timer/), which utilized the RNA sequencing data from TCGA for estimating the correlation between gene expression and level of tumor-infiltrating immune cells (37). We utilized TIMER to calculate the association between gene expression of T2Ms with tumor purity and infiltration of immune cells including B cells, CD4+ T cells, CD8+ T cells, neutrophils, macrophages and dendritic cells in LGG and GBM datasets.
Statistical Analysis
Data analysis was performed using Graphpad (version 6) and Stata software (version 11). Chi-square test was used to calculate the expression fold change with threshold p-value <0.001) between normal and glioma in Oncomine datasets analysis. Mann-Whitney U-test was used for comparison among histological subtypes, molecular subtype and grades (**p<0.001; **p<0.01; *p<0.05; ns, p>0.05). Pearson correlation was used to calculate the correlation of DNA methylation of T2M genes to its expression in LGG and GBM dataset. Kaplan-Meier survival analysis was performed using Wilcoxon and log-rank test, p-value <0.05 was considered as statistically significant.
Results
Expression Pattern of T2Ms in Glioma
To compare the expression of T2Ms in glioma with normal brain tissue, we utilized publicly available gene expression datasets: Oncomine, TCGA, and REMBRANDT study. The outline of the study has been depicted in Figure 1A. Oncomine analysis was performed to compare gene expression in multiple datasets in parallel to get reliable information regarding the change in T2Ms gene expression (Figure 1B). Interestingly, Oncomine analysis revealed that in glioma, several MAGE genes, including MAGED1, MAGED4, and MAGED4B exhibited elevated expression (Figure 1B). In contrast, an opposite pattern was observed for TRO (MAGED3), MAGEE1, MAGEE2, MAGEH1, MAGEL2, and NDN, which exhibited reduced expression in tumors compared to normal brain tissues. NSMCE3, MAGED2, and MAGEF1 did not exhibit a clear pattern of overexpression/downregulation in Oncomine analysis.
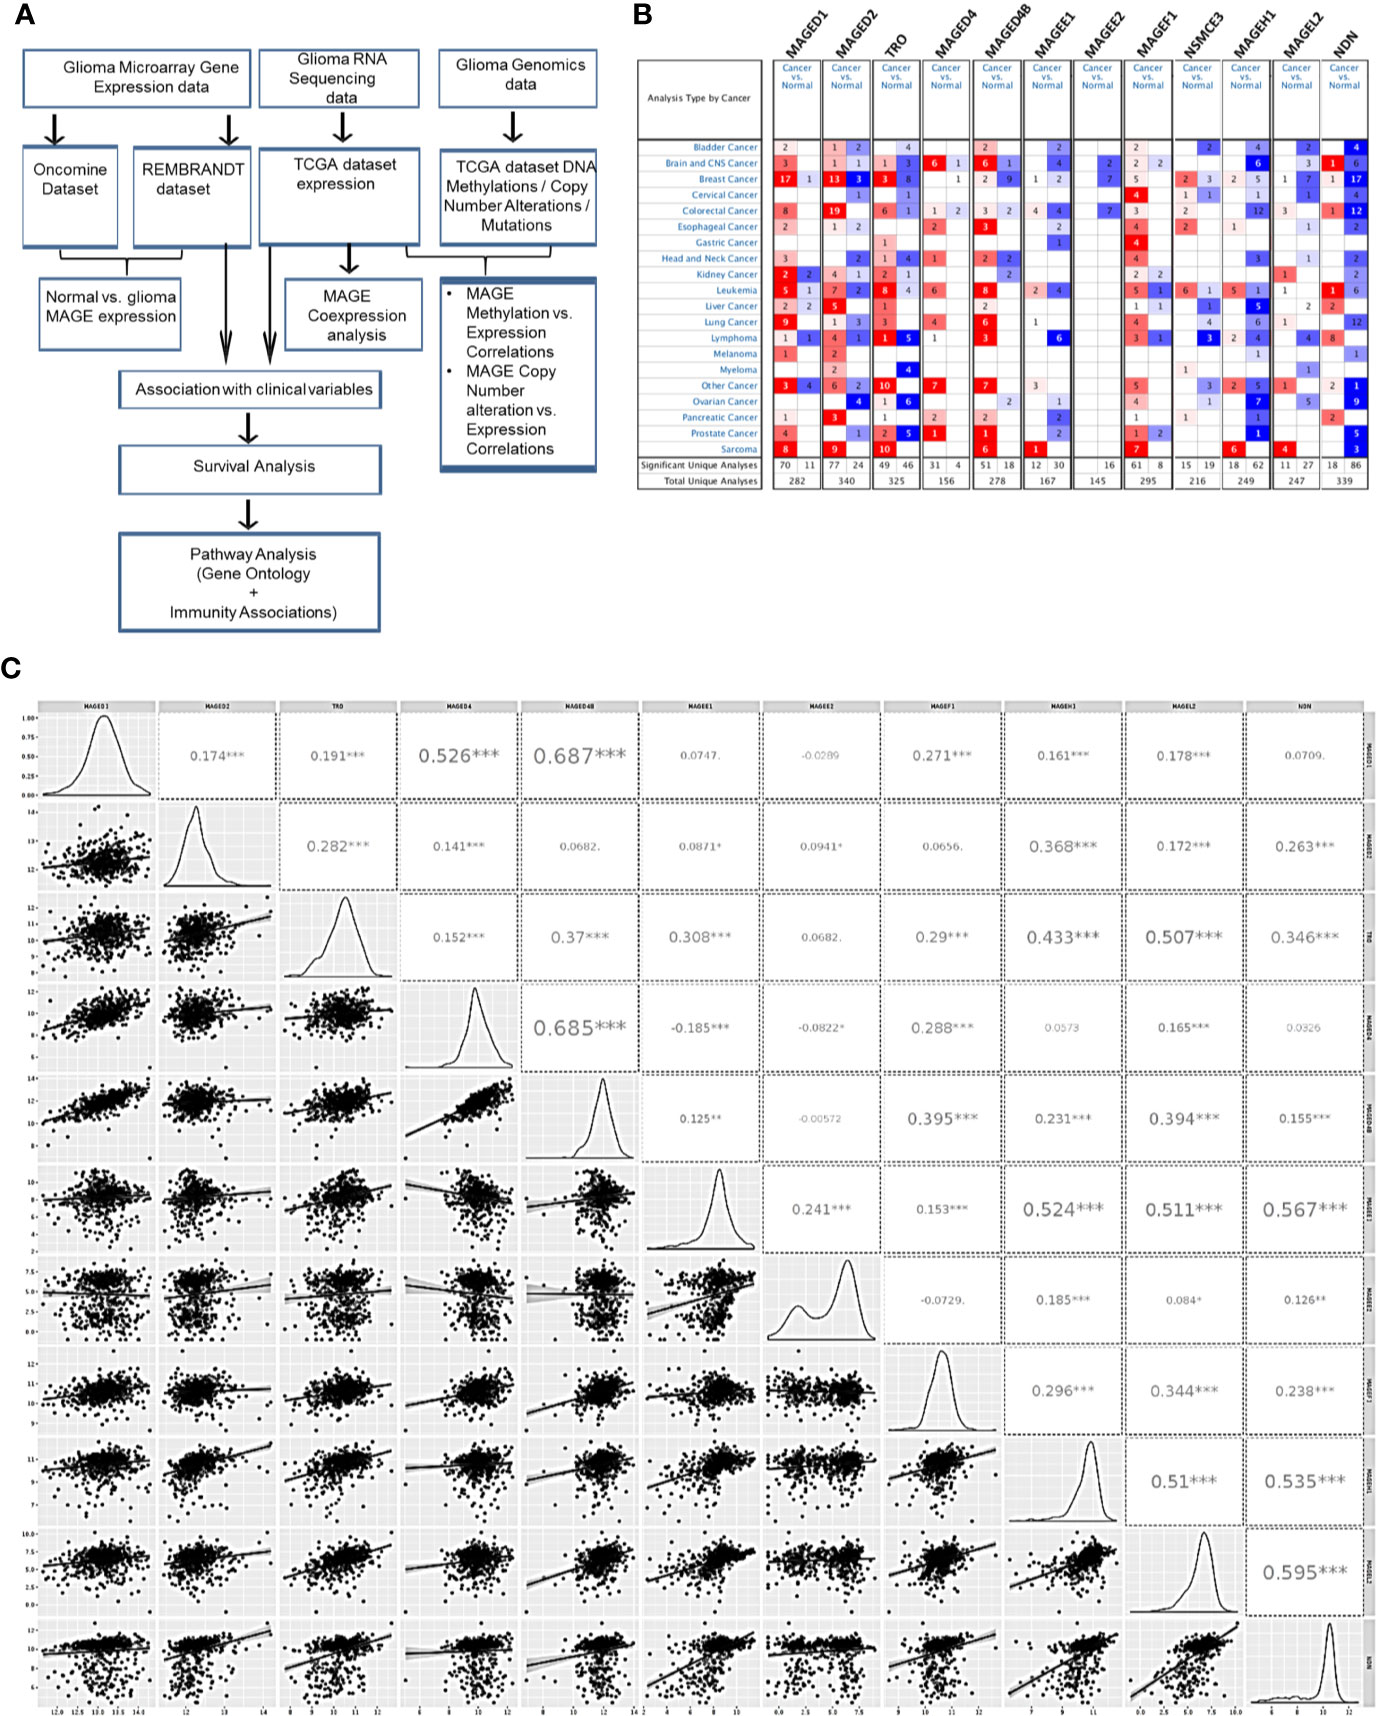
Figure 1 Type 2 MAGE expression in glioma. (A) Outline of the current study. (B) Oncomine analysis showing the general pattern of overexpression (red color)/downregulation (blue color) of T2Ms in cancer vs. normal tissues in different cancers. (C) Correlation matrix of T2Ms in a combined group of TCGA lower grade glioma and glioblastoma dataset. The distribution of variables is shown in left while Pearson correlation coefficients along with the level of significance have been shown on right. (***p<0.001; **p<0.01; *p<0.05).
We further analyzed the coexpression pattern of T2Ms in TCGA datasets of glioma and the results are presented in Figure 1C. This analysis revealed a strong positive correlation among MAGED1, MAGED4, and MAGED4B (r>0.4) while they exhibited a comparatively weak correlation (r <0.3) to other MAGEs. Similarly, TRO, MAGEE1, MAGEH1, MAGEL2, and NDN exhibited positive correlations (r >0.3), while others exhibited varying levels of weaker correlations (r <0.3) (Figure 1C). We further performed similar co-expression analysis on gene expression datasets for lower grade glioma (LGG) and glioblastoma multiforme (GBM), separately, and observed broadly similar coexpression pattern of T2Ms in LGG and GBM (Supplementary Figures S1A, B). Furthermore, we also assessed the correlation of T2Ms expression in other TCGA cancer datasets to determine whether these coexpression patterns are unique to glioma or are common to most cancers. Interestingly, we observed that in TCGA datasets of cutaneous melanoma (TCGA-SKCM), breast cancer (TCGA-BRCA), and lung squamous cell carcinoma (TCGA-LUSC), T1Ms and T2Ms form distinct clusters (Supplementary Figures S2A–C). However, within the cluster, they display varying degrees of positive correlations, thereby supporting the possibility of common regulatory mechanisms for their expression. These co-expression patterns also reflected well in a pan-cancer cell line gene expression dataset from Cancer Cell Line Encyclopedia (CCLE, Supplementary Figure S2D). Therefore, expression of T2Ms is highly coordinated in two distinct subgroups of T2Ms in glioma, one of which is overexpressed while the other exhibits downregulation in glioma. In view of the reported overexpression of MAGED4 in glioma (18), we focused our further analysis on downregulated T2Ms using MAGEH1 as a representative member of this highly co-expressed T2M subgroup. Interestingly, all T2Ms which were found to be downregulated in the expression analysis exhibited preferential enrichment in the brain, as determined by the Genotype-Tissue Expression (GTEx) project whole-body gene expression data (Supplementary Figures S3A–E).
Expression of T2Ms in Different Histological Subtypes
REMBRANDT dataset contains normal brain tissues, therefore it was used to validate the expression of different T2Ms in glioma compared to the normal glial tissue. For all subsequent analyses, TCGA along with the REMBRANDT dataset was utilized for clinical correlations. REMBRANDT dataset revealed reduced MAGEH1 expression in glioma compared to its normal counterpart. Interestingly, analysis of both REMBRANDT and TCGA datasets brought out a steady decrease in MAGEH1 expression with advancing grades of glioma (Figures 2A, B). Furthermore, the analysis of histopathological data revealed a strong correlation of MAGEH1 downregulation with astrocytoma histology (Figures 2C, D). Among TCGA defined molecular subtypes of GBM described by Wang et al. 2017 (38), MAGEH1 exhibited the highest expression in the proneural subtype while classical and mesenchymal subtypes exhibited its comparable expression (Figures 2E, F). Regarding epigenetic alterations, higher MAGEH1 expression was observed in G-CIMP GBMs compared to non-G-CIMP GBMs in the REMBRANDT dataset (p<0.01, Figure 2G). In TCGA dataset, IDH mutant tumors, which are closely associated with the G-CIMP phenotype, exhibited higher MAGEH1 expression than non-IDH mutant gliomas (p<0.001, Figure 2H). Furthermore, IDH mutant tumors that harbor 1p/19q co-deletion expressed higher levels of MAGEH1 compared to the non co-deletion tumors with IDH mutation (p<0.001), which together indicate epigenetic regulation as possible mechanisms of T2Ms expression.
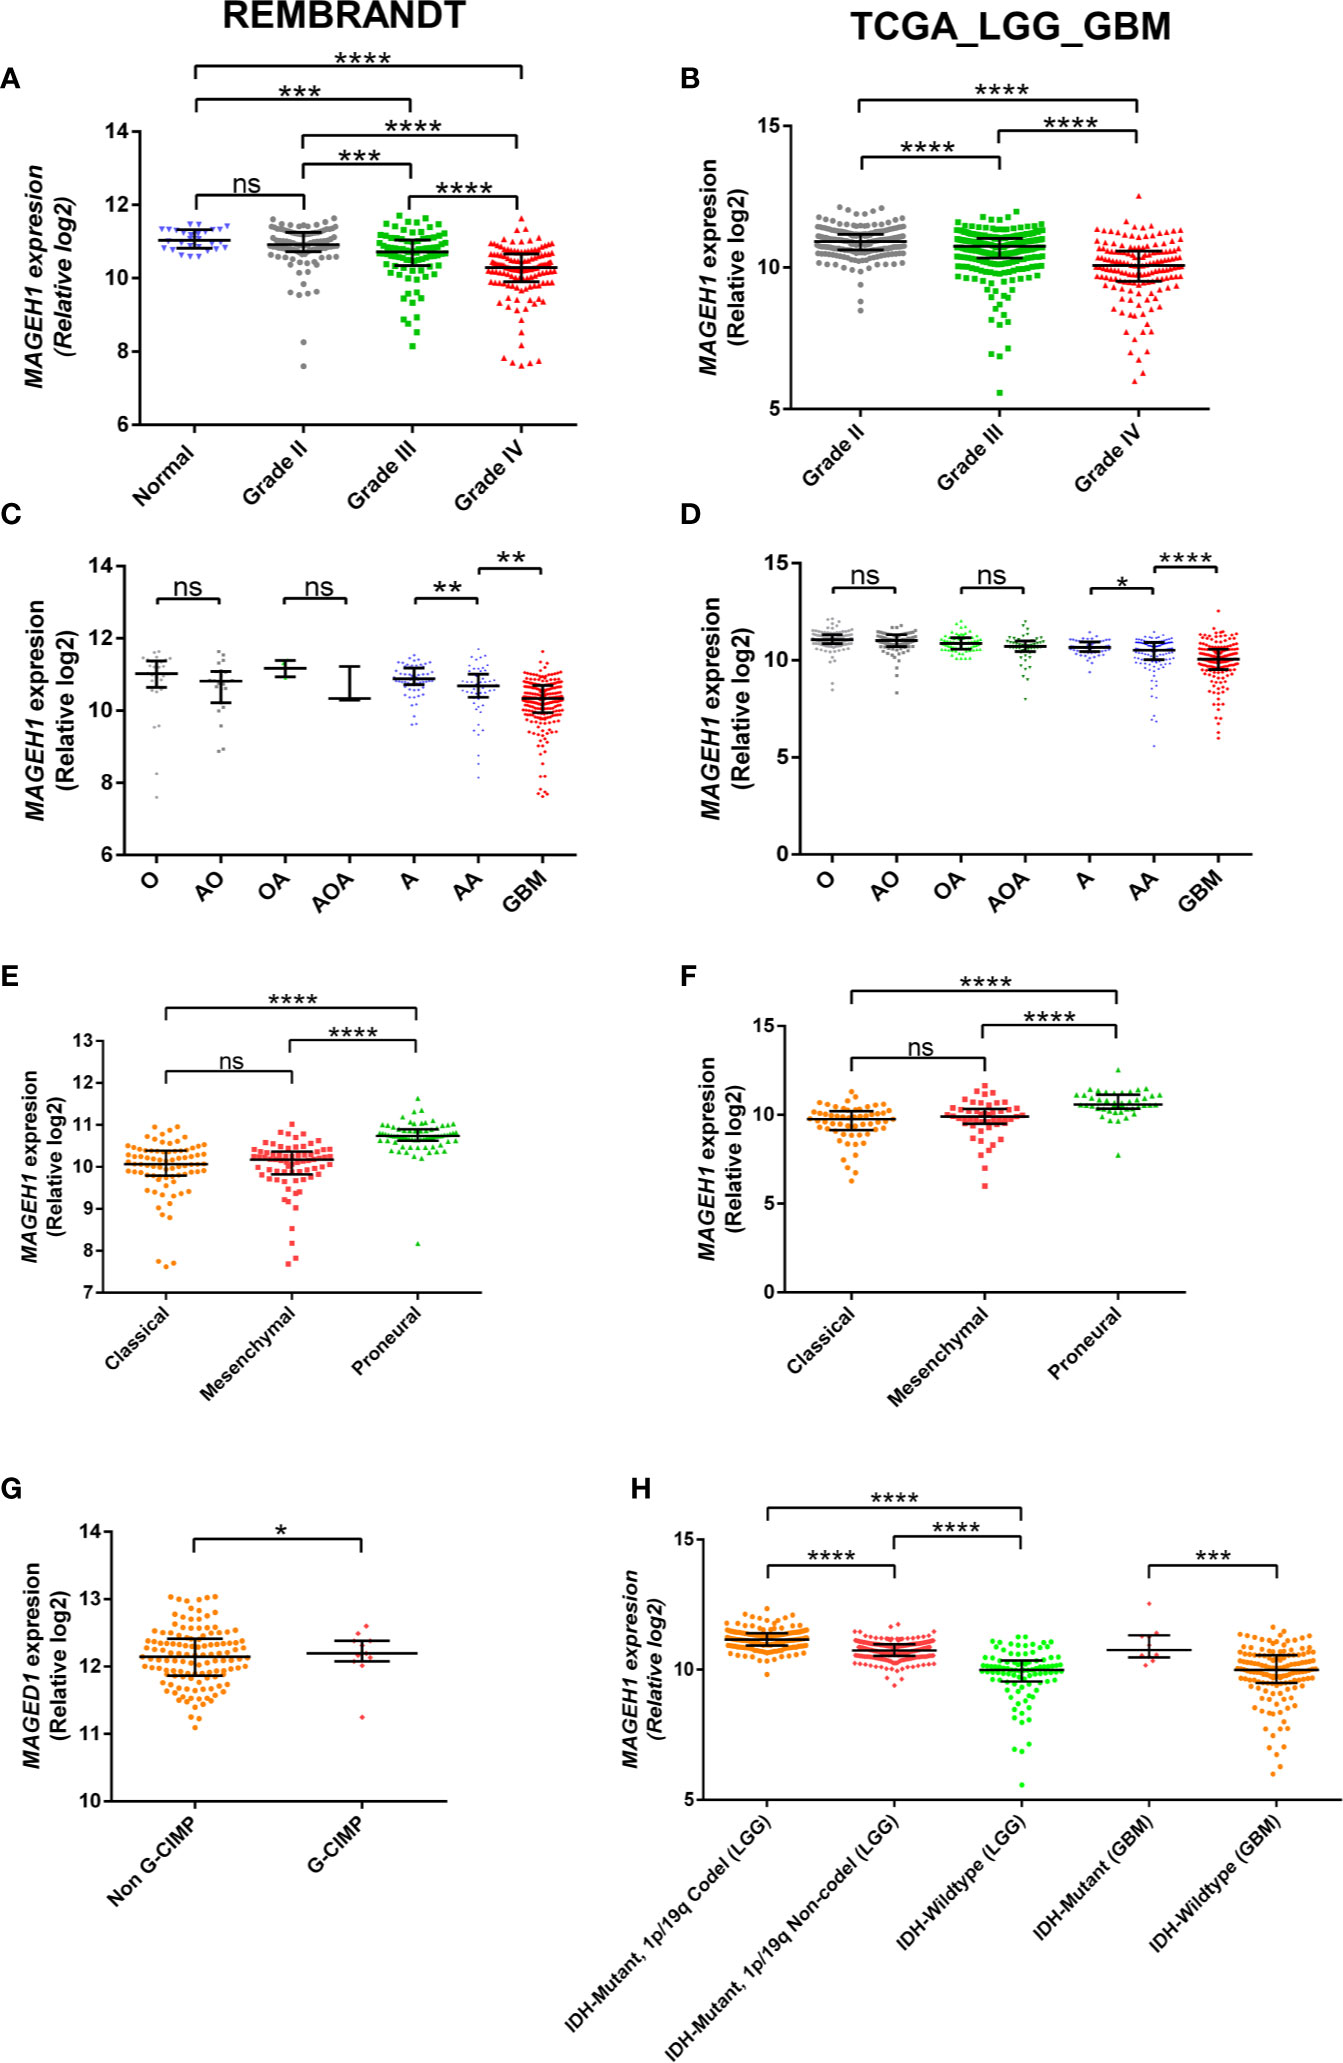
Figure 2 MAGEH1 gene expression in glioma datasets, Rembrandt (left) and TCGA-LGG-GBM dataset (right) for (A, B) Different glioma grades, (C, D) Histological subtypes of LGG with GBM, (E, F) Molecular subtypes of GBM, (G) G-CIMP status in Rembrandt dataset, (H) IDH and 1p19q codeletion status in TCGA dataset. ****p<0.0001, ***p<0.001; **p<0.01; *p<0.05; ns, not significant.
Alterations in T2M Genes in Glioma
To determine the possible contribution of genetic alterations in altered expression of T2Ms in glioma, copy number variation (CNV), and mutation data of TCGA-LGG (lower grade glioma consisting grade II +III) and TCGA-GBM (glioblastoma) dataset were assessed. Our results showed heterozygous deletion and copy number gain to be common events in T2M genes. However, they rarely undergo mutations, or display amplification and/or deep deletion events (Figure 3A). Interestingly, it was also observed that some glioma patients harbor heterozygous deletion of multiple T2Ms. Further, to determine the effect of copy number variation (CNV) on T2Ms expression, we compared their expression in glioma patients based on CNV data and observed no difference in expression of MAGEH1 (Figure 3B) and MAGEE1 (Figure 3C) between tumors with diploid and shallow deletion status, and between diploid and copy number gain status for the respective genes. In TCGA-LGG dataset, shallow copy number deletion was indeed associated with higher expression of MAGEH1 compared to tumors with diploid status for this gene (p=0.0009, Figure 3D), while no such difference was observed for MAGEE1 (Figure 3E).
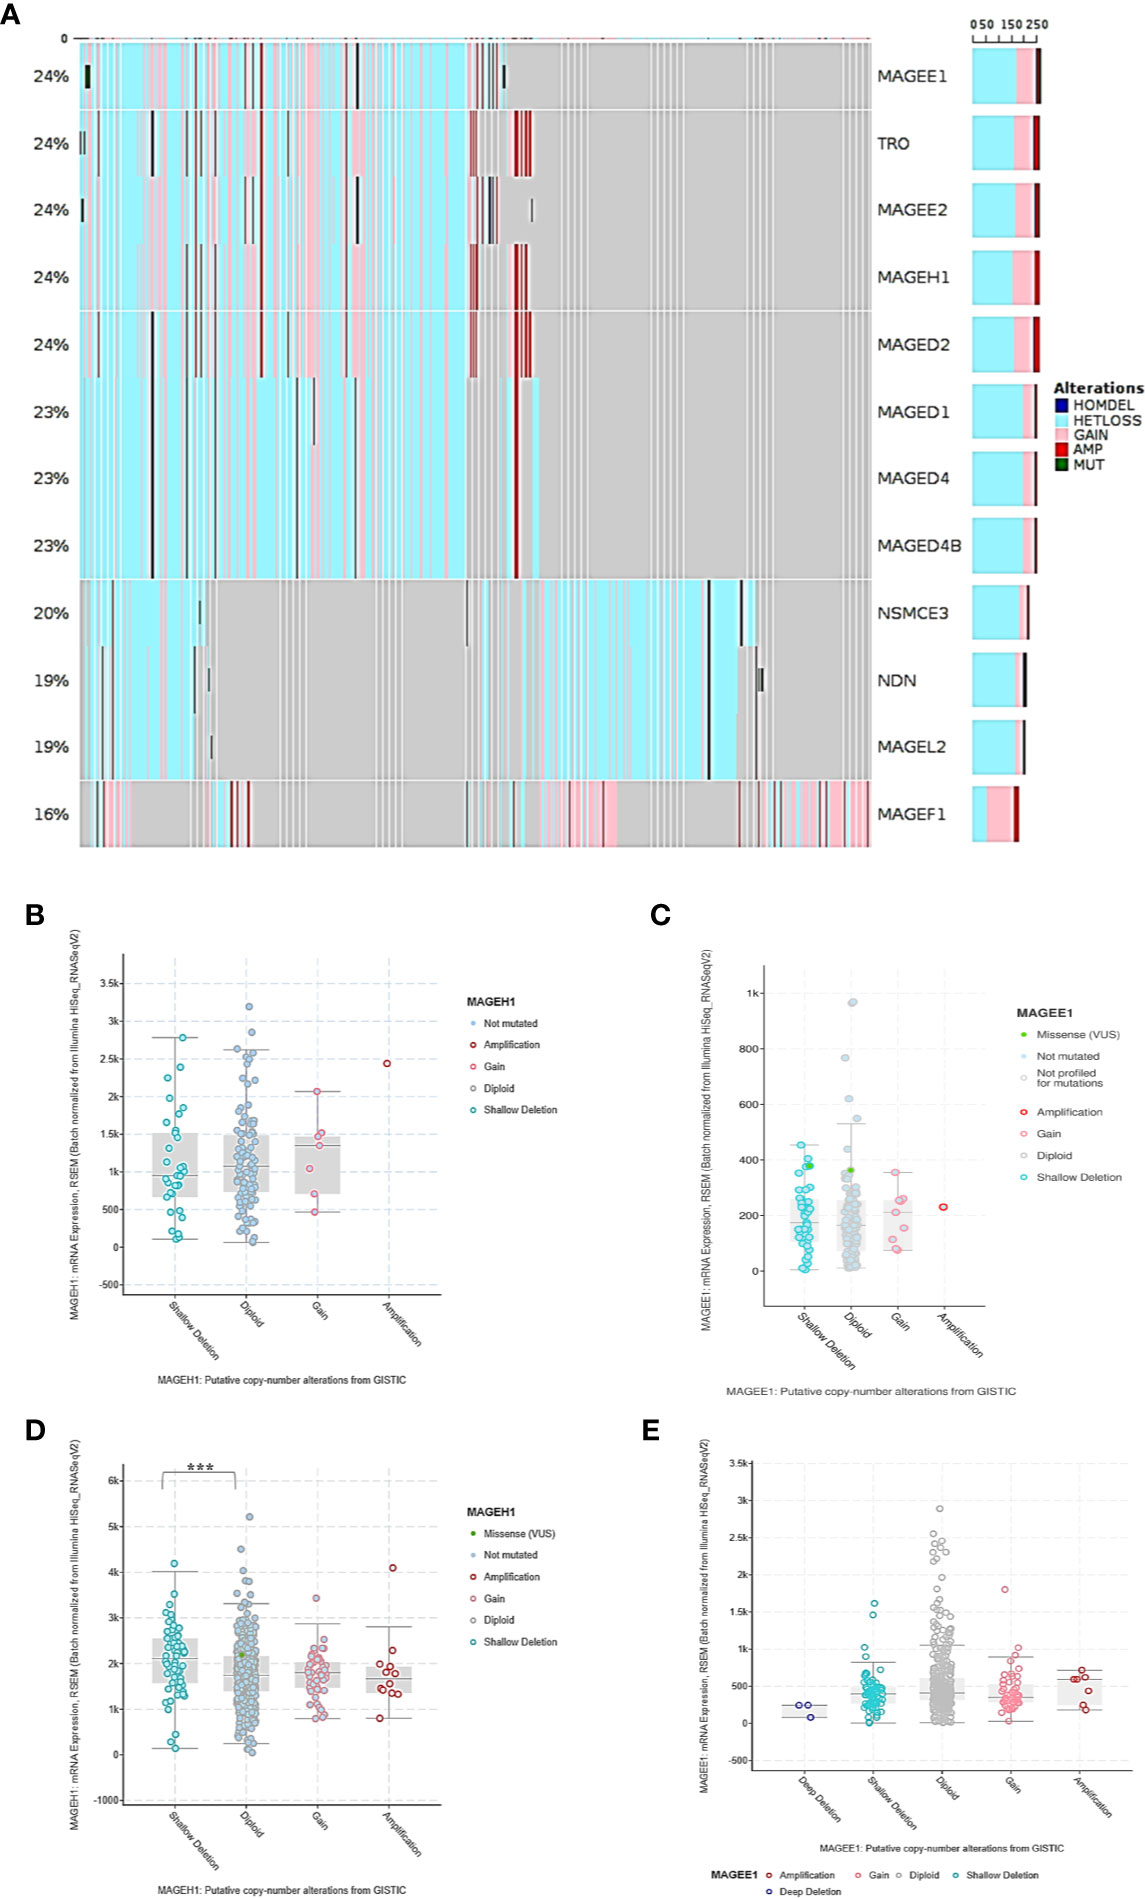
Figure 3 Genetic regulation of T2Ms expression in glioma. (A) Mutation and copy number alteration profile of glioma patients from TCGA dataset. (B, C) Association of copy number alterations and expression of MAGEH1 and MAGEE1 in TCGA-GBM dataset. (D, E) Association of copy number alteration and expression of MAGEH1 and MAGEE1 in TCGA-LGG dataset. ***p<0.001; results with p>0.05 have not been indicated.
NA Methylation of MAGEH1 in Glioma
While DNA methylation is known to regulate MAGED4 expression in glioma, no information about its role in regulating the expression of other T2M genes is available. We observed that MAGEH1 expression was associated with IDH mutation status and G-CIMP status. Therefore, we utilized DNA methylation data from TCGA-LGG and TCGA-GBM datasets to analyze the association of MAGEH1 expression with DNA methylation. Correlation analysis was performed between MAGEH1 expression and its gene methylation. While the MAGEH1 gene does not contain a CpG island, we observed that in LGG, methylation of CpG sites with probe ids cg18869368, cg04029630, and cg01172484, which have binding sites near TSS of the MAGEH1 gene were negatively associated with its expression (r= -0.119, r= -0.109 and r= -0.128, respectively, Figure 4A). Interestingly, methylation levels of two intragenic CpG sites cg22604777 and cg22574818 exhibited the highest negative correlation with MAGEH1 expression in LGG (r= -0.157 and r= -0.392, respectively, Figure 4B). However, in the GBM dataset, DNA methylation level of only one site (cg01172484) with a binding site near TSS was significantly correlated with gene expression (r= -0.255, Supplementary Figure S4A) while comparatively higher negative correlations of gene expression with DNA methylation were observed at intragenic CpG sites cg22604777 and cg22574818 (r= -0.314 and r= -0.505, respectively, Supplementary Figure S4B). Treatment of GBM cell line U87MG and LN229 with DNA methyltransferase (DNMT) inhibitor 5-Azacytidine enhanced MAGEH1 mRNA expression thereby confirming the role of epigenetic regulation in MAGEH1 expression in glioma (Figure 4C).
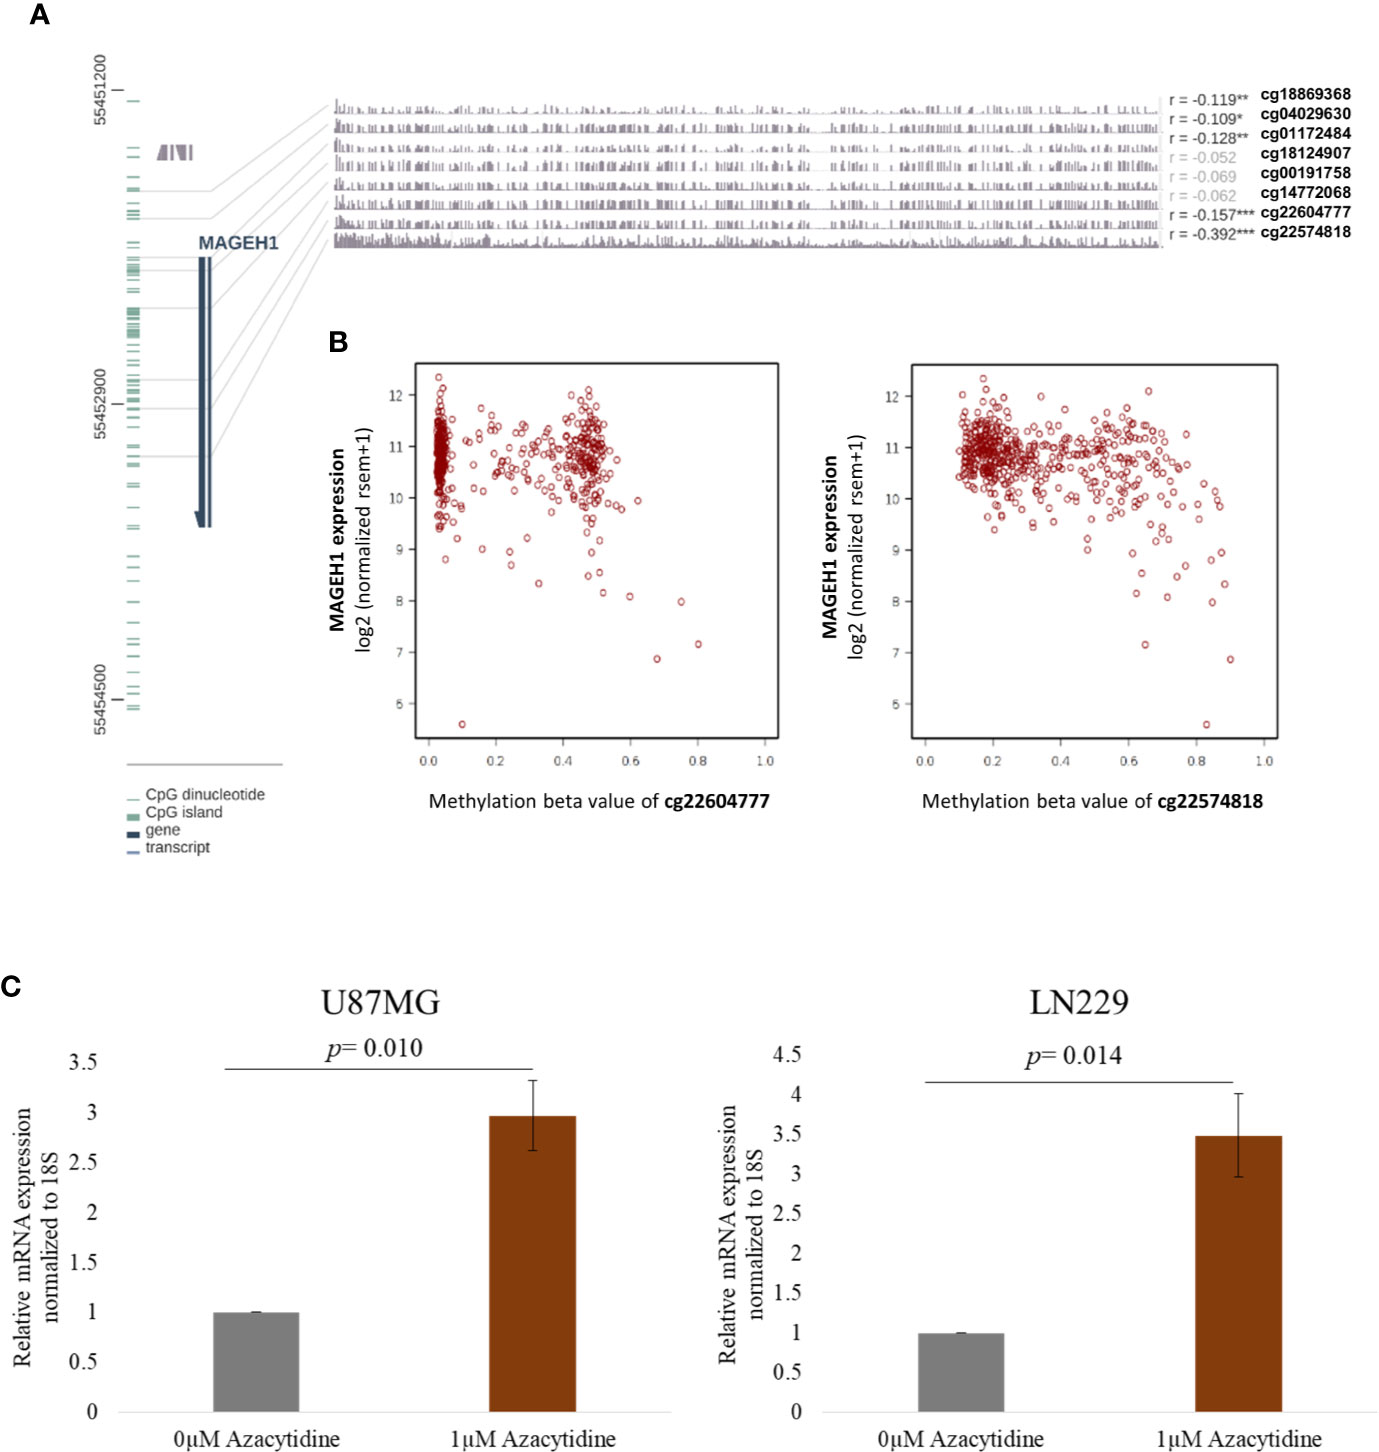
Figure 4 DNA methylation and its correlation with MAGEH1 expression (A) DNA methylation of the MAGEH1 promoter region in TCGA-LGG dataset (B) Correlation of DNA methylation at cg22604777 and cg22574818 with MAGEH1 expression in TCGA-LGG dataset. (C) Effect of 5-Azacytidine treatment on MAGEH1 expression in GBM cell line U87MG and LN229. ***p<0.001; **p<0.01; *p<0.05. Faded correlation values shows non significant associations.
Association of T2Ms With Glioma Patient Survival
Using Kaplan-Meier analysis, we assessed the association of MAGEH1 expression with overall survival in glioma patients in the REMBRANDT and TCGA-LGG-GBM dataset. Pan-glioma analysis revealed association of MAGEH1 with better survival in both, REMBRANDT (HR=2.92, 95% CI=2.3–3.71, p<0.001, Figure 5A) and TCGA dataset (HR=5.76, 95% CI=4.39–7.55, p<0.001, Figure 5B). We also performed a survival analysis on other T2Ms in REMBRANDT dataset, which revealed that all genes in downregulated T2M subgroup is associated with poor overall survival, such as TRO ((HR=1.49, 95%CI=1.19-1.87, p<0.001), Figure 5C), MAGEE1 (HR=2.25, 95% CI=1.79–2.85, p=0, Figure 5E), MAGEL2 (HR=1.81, 95% CI=1.45–2.27, p=0, Figure 5G), NDN (HR= 2.2, 95% CI=1.76–2.76, p=0, Figure 5I). Similar association of T2M downregulation with poor OS was observed in TCGA dataset, such as TRO (HR=2.58, 95%CI=1.99-3.35, p=0, Figure 5D), MAGEE1 (HR=5.16, 95% CI=3.95–6.74, p=0 in TCGA dataset, Figure 5F), MAGEL2 (HR=3.3, 95% CI=2.53–4.29, p=0 in TCGA dataset, Figure 5H) and NDN (HR=5.09, 95% CI= 3.85–6.72, p=0, Figure 5J).
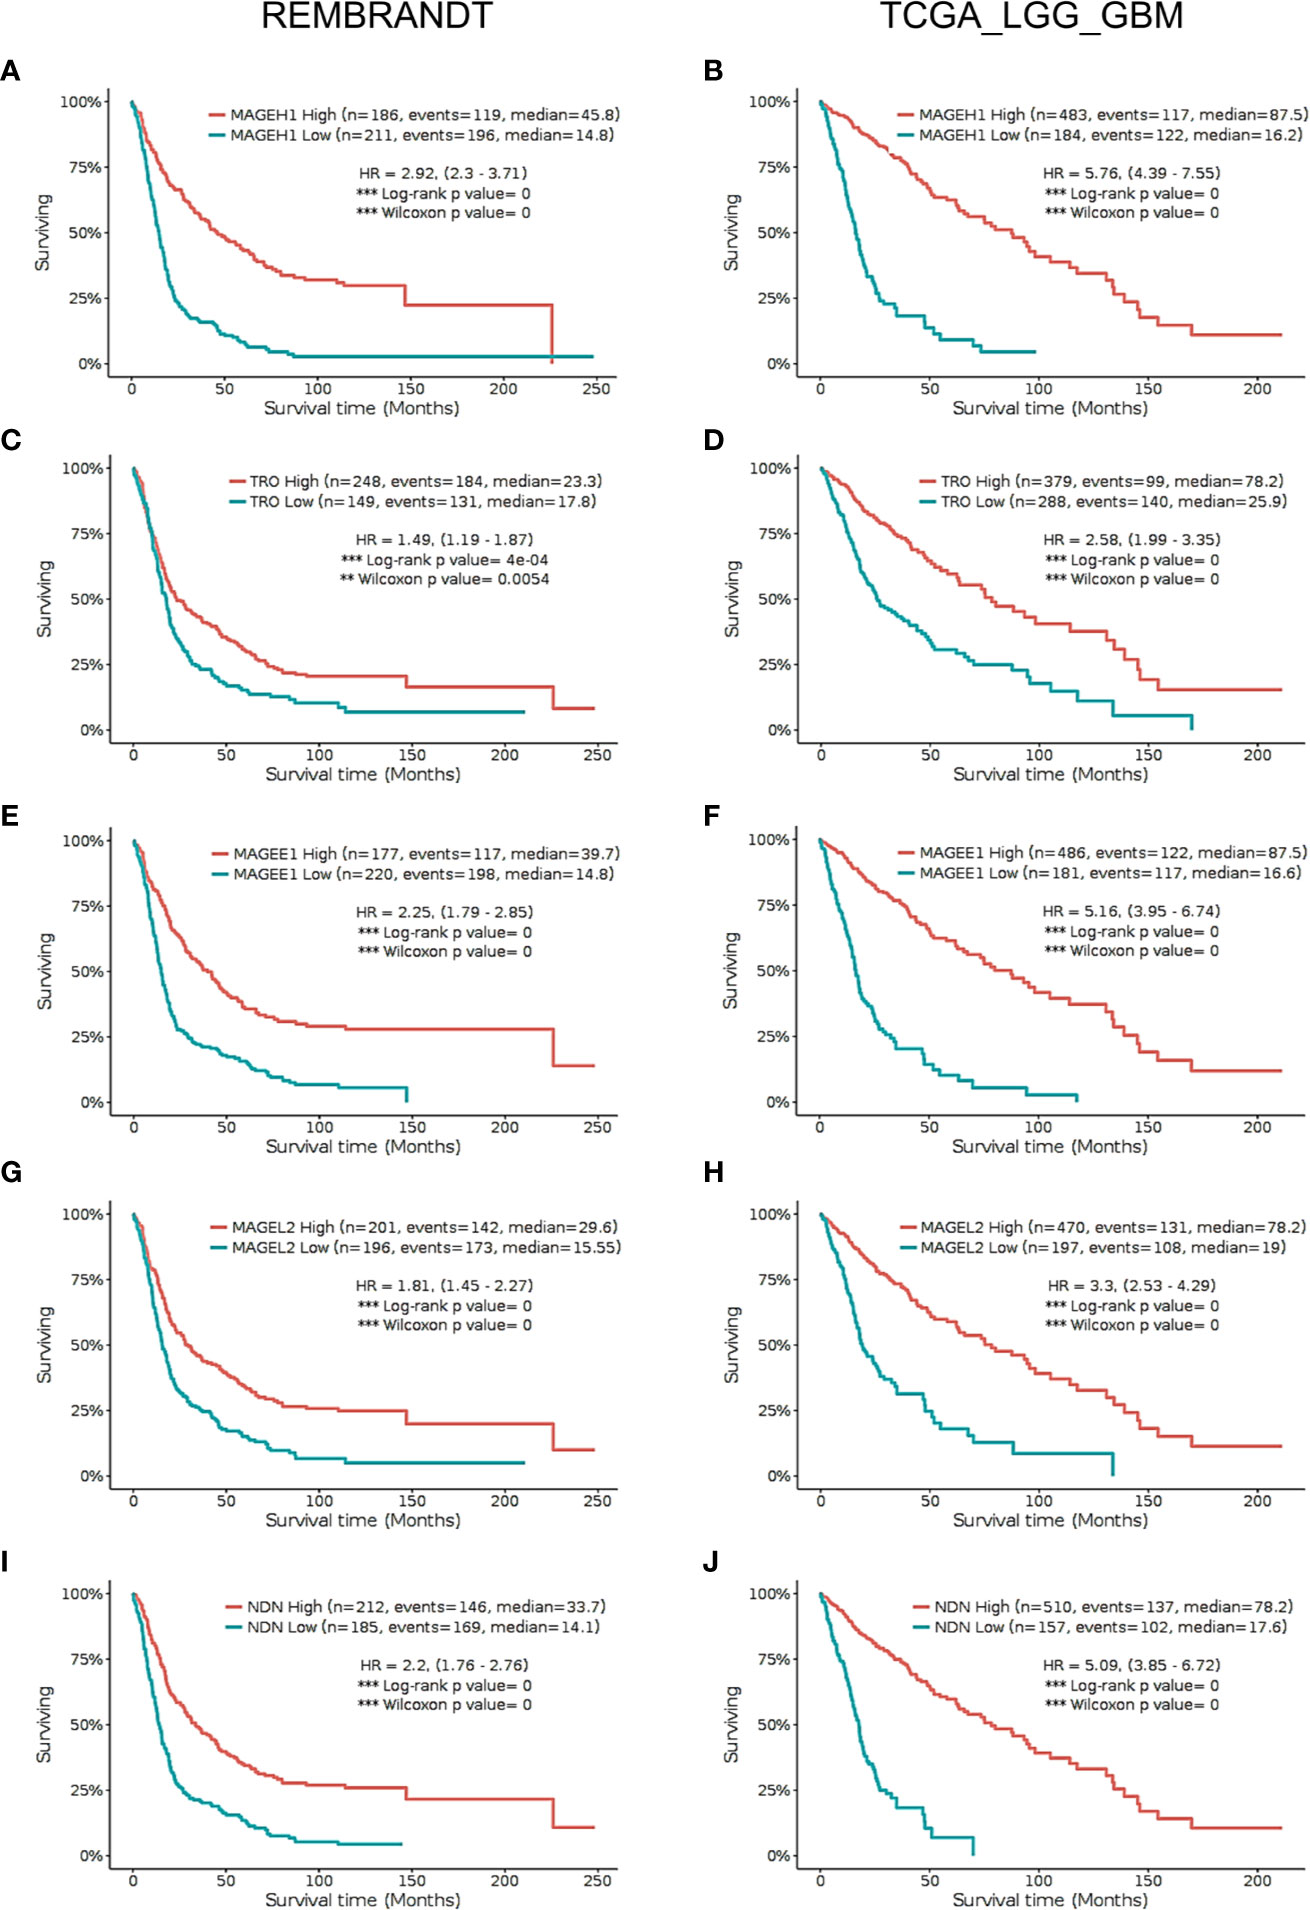
Figure 5 Kaplan Meier survival analysis in REMBRANDT dataset (Left panel) and TCGA dataset (right panel) for selected type 2 MAGE genes including all cases. (A, B) MAGEH1 (C, D) TRO (E, F) MAGEE1 (G, H) MAGEL2 (I, J) NDN. Patients were divided into two groups based on maximally selected rank statistics function available in the GlioVis web server (see Materials and Methods for detail). The Log-rank p-value has been depicted in each graph. ***p<0.001; **p<0.01; *p<0.05.
Further, we sought to analyze subgroup specific associations of MAGEH1 expression with overall survival in different histological subtypes of gliomas. In REMBRANDT dataset, a clear association of MAGEH1 downregulation with poor OS was observed in astrocytoma (HR=2.75, 95% CI=1.69–4.46, p=0, Figure 6A) and oligodendroglioma (HR=2.82, 95% CI= 1.3–6.1, p<0.01, Figure 6C). Since the sample size for mixed glioma (oligoastrocytoma) in the REMBRANDT dataset was small (n=7), no conclusion on the association of MAGEH1 expression with survival could be drawn (Figure 6E). However, in TCGA dataset also, reduced MAGEH1 expression was associated with poor OS in astrocytoma (HR=6.72, 95% CI=3.78–11.93, p=0, Figure 6B), oligodendroglioma (HR=7.75, 95% CI = 3.68–16.33, p=0, Figure 6D) and mixed glioma (HR=7.29, 95% CI=2.63–20.21, p=0, Figure 6F).
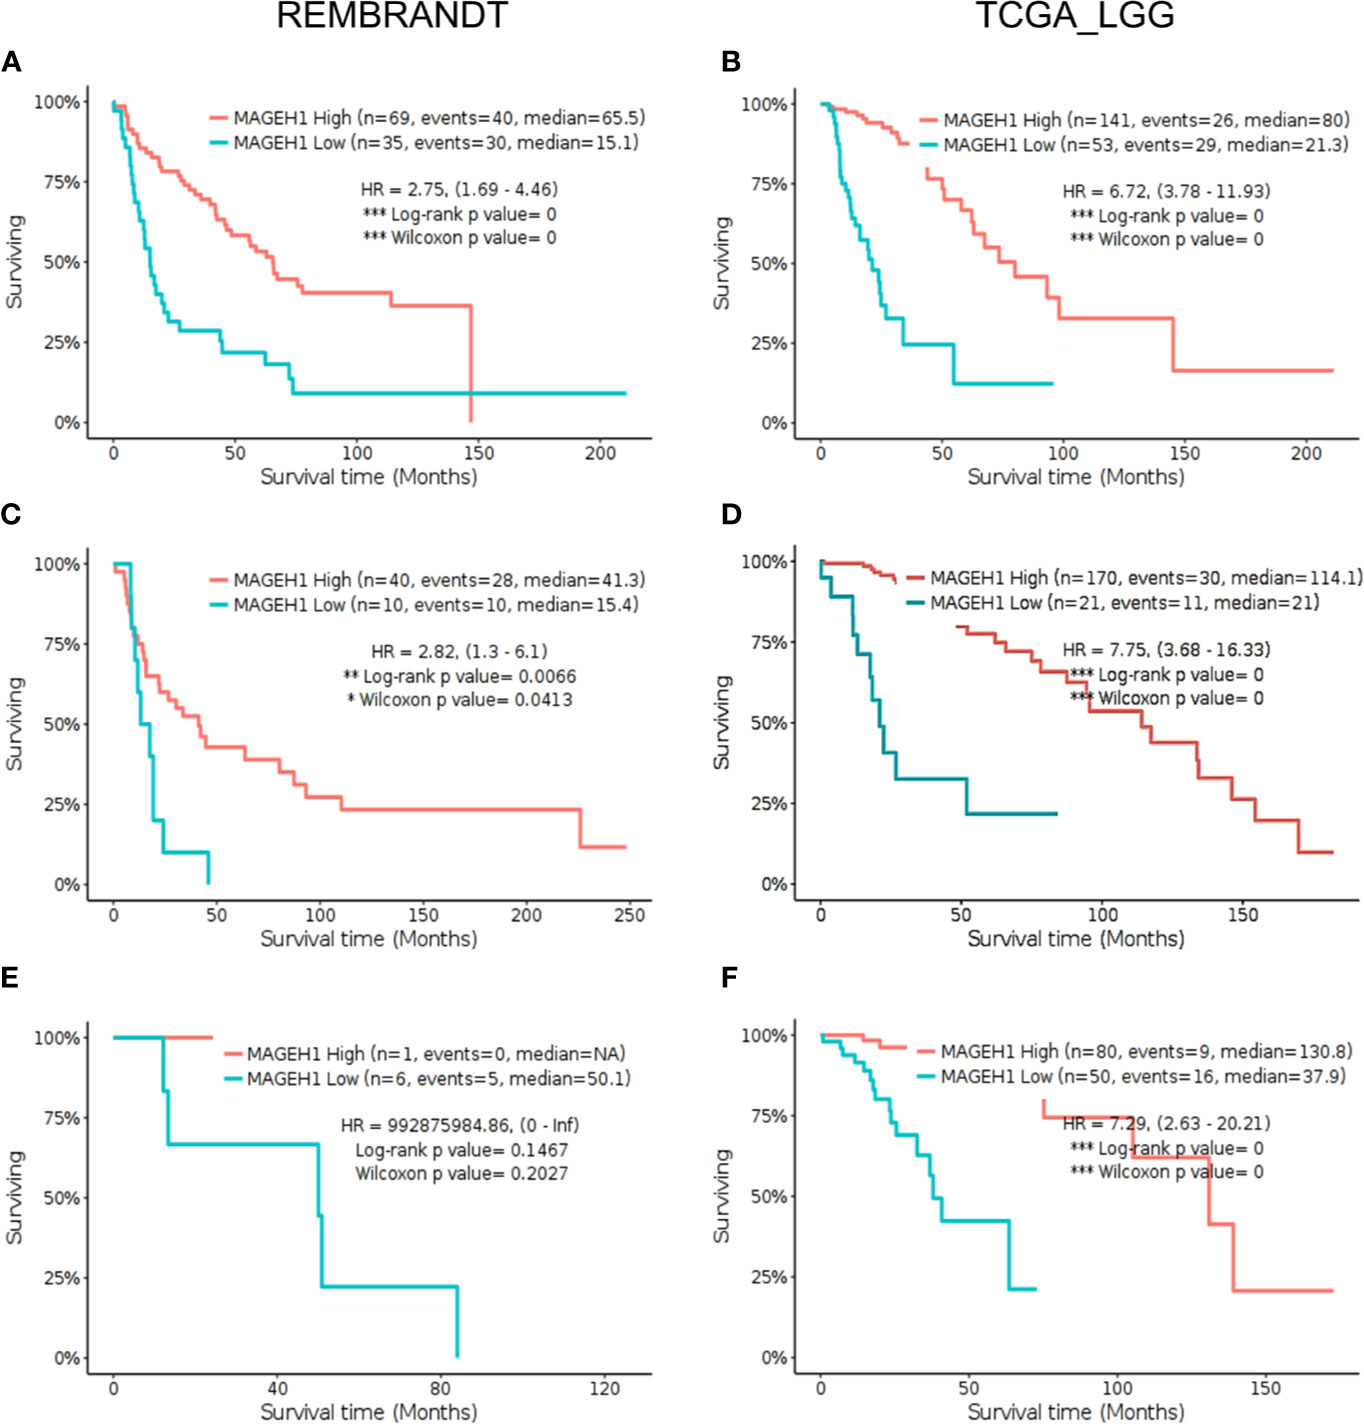
Figure 6 Kaplan Meier survival analysis for MAGEH1 in different histological subtypes of lower grade glioma from Rembrandt and TCGA dataset (A, B) Astrocytoma (C, D) oligodendroglioma (E, F) mixed glioma. Patients were divided into two groups based on maximally selected rank statistics function available in the GlioVis web server (see Materials and Methods for detail). The Log-rank p-value has been depicted in each graph. ***p<0.001; **p<0.01; *p<0.05.
Further, we separately analyzed the prognostic significance of MAGEH1 in GBM using REMBRANDT and TCGA datasets. This analysis also brought out the association of reduced MAGEH1 expression with poor OS in both REMBRANDT (HR=1.55, 95% CI=1–2.39, p<0.05, Figure 7A), and TCGA (HR=2.09, 95% CI=1.18–3.68, p<0.01, Figure 7B) dataset. Since IDH mutation are associated with poor patient survival in glioblastoma, we separately assessed the prognostic significance of MAGEH1 in patients harboring these IDH genotypes, Interestingly, reduced MAGEH1 expression exhibited a strong association with poor OS in glioma patients harboring either wild type (HR=2.37, 95% CI=1.42–3.94, p<0.001, Figure 7C) or mutant (HR= 1.94, 95% CI=1.2–3.16, p<0.01, Figure 7D) genotypes.
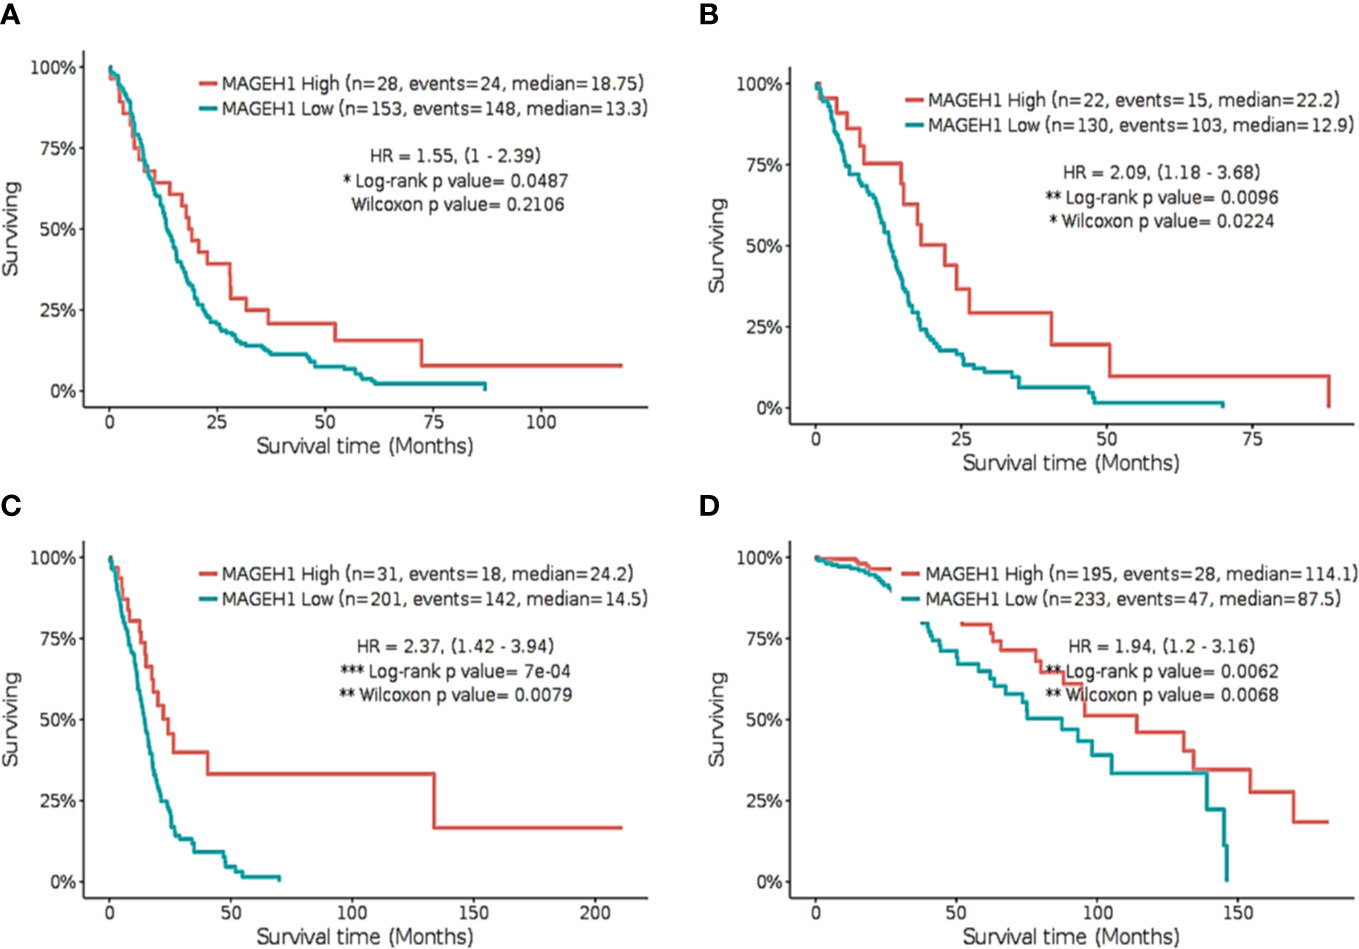
Figure 7 Kaplan Meier survival analysis for MAGEH1 in Rembrandt and TCGA dataset (A) GBM tissues from REMBRANDT (B) GBM tissues from TCGA (C) IDH wild type from TCGA dataset (D) IDH mutant type from TCGA dataset. Patients were divided into two groups based on maximally selected rank statistics function available in the GlioVis web server (see Materials and Methods for detail). The Log-rank p-value has been depicted in each graph. ***p<0.001; **p<0.01; *p<0.05.
Additionally, we performed univariate and multivariate Cox regression analysis for prognostic significance of relevant clinicopathological features along with MAGED1 and MAGEH1 expression in TCGA-LGG (a combined group of grade II and grade III) and TCGA-GBM datasets, separately. Overall survival (OS), disease specific survival (DSS), disease free interval (DFI) and progression-free interval (PFI) were taken as outcome measures. In the univariate analysis for LGG, we used MAGEH1 expression, MAGED1 expression, age, gender, tumor histology, WHO grade, IDH mutation status, 1p/19q codeletion status, and MGMT promoter methylation status to analyze the association of these variables to patient outcome. Among these, age, tumor grade and astrocytoma histology were associated with poor OS, DSS and PFI, while IDH mutation status, 1p/19q codeletion status, and MGMT promoter methylation status were associated with better OS, DSS, and PFI (Table 1). Additionally, IDH mutation status was also associated with DFI. Interestingly, MAGEH1 expression, but not MAGED1 expression was associated with better OS, DSS, and PFI in LGG. Furthermore, multivariate analysis revealed that higher MAGEH1 expression is also an independent prognostic indicator of the better OS, DSS, and PFI in LGG (Table 2). On the other hand, multivariate analysis using LGG dataset for MAGED1 suggested no association of MAGED1 with patient survival (Table 3).
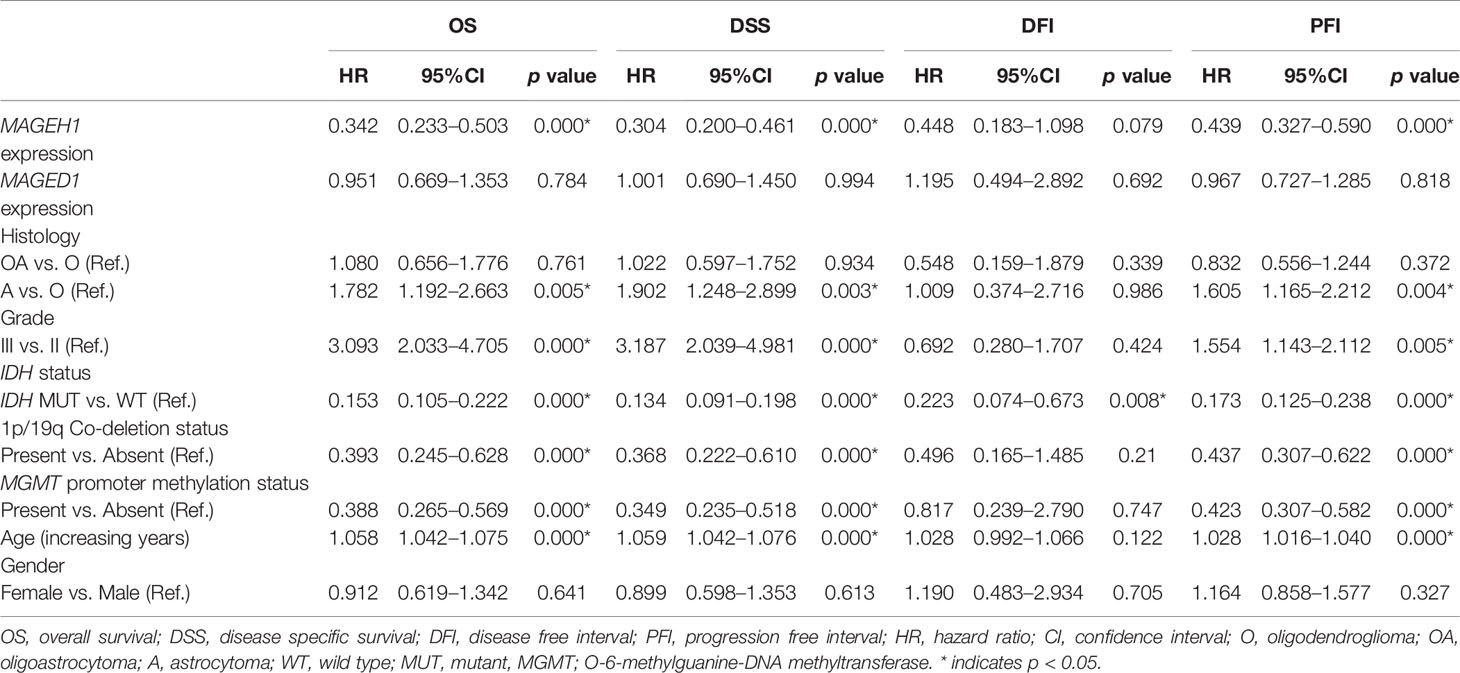
Table 1 Univariate survival analysis in TCGA-LGG dataset.

Table 2 Multivariate survival analysis for MAHGEH1 in TCGA-LGG dataset.
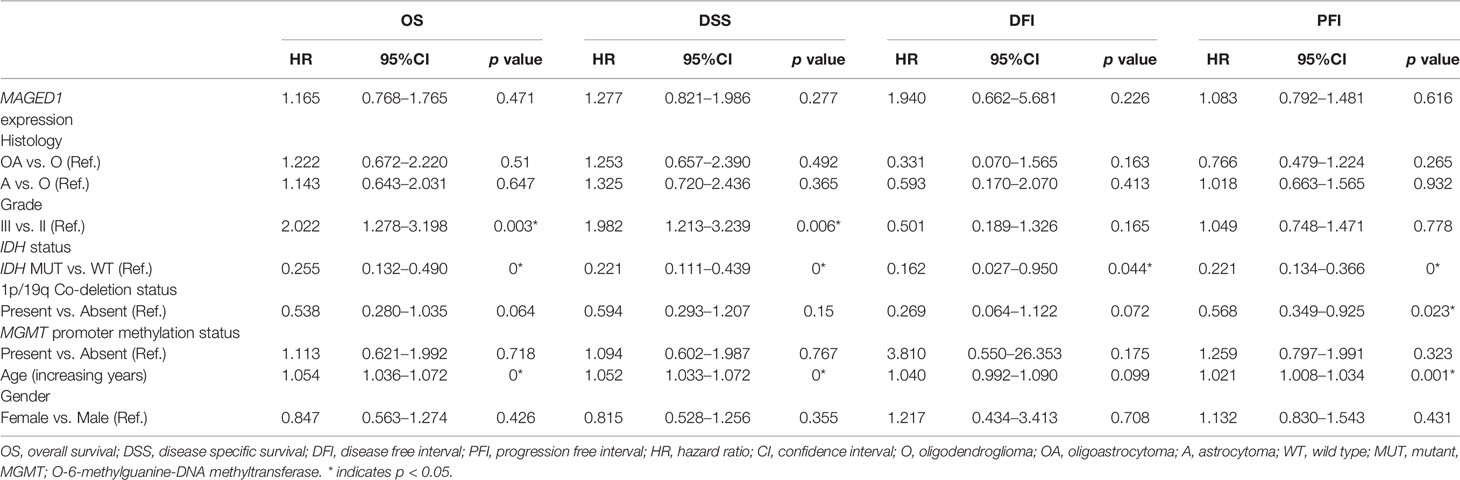
Table 3 Multivariate survival analysis for MAHGED1 in TCGA-LGG dataset.
Next, we performed survival analysis for TCGA-GBM data with MAGEH1 and MAGED1 expression, along with age, gender, molecular subtypes (38), IDH mutation status, and MGMT promoter methylation status (Table 4). In univariate analysis, we observed an association of higher MAGEH1 expression with favorable PFI, while no association of MAGED1 was observed with the disease outcome. Additionally, multivariate analysis of the association of MAGEH1 with PFI revealed only marginal significance (p=0.07), while no association of MAGEH1 was observed with OS, DSS, and DFI (Table 5). Similar to univariate analysis, multivariate analysis for prognostic significance of MAGED1 in TCGA-GBM dataset revealed no association of MAGED1 expression with patient survival (Table 6).
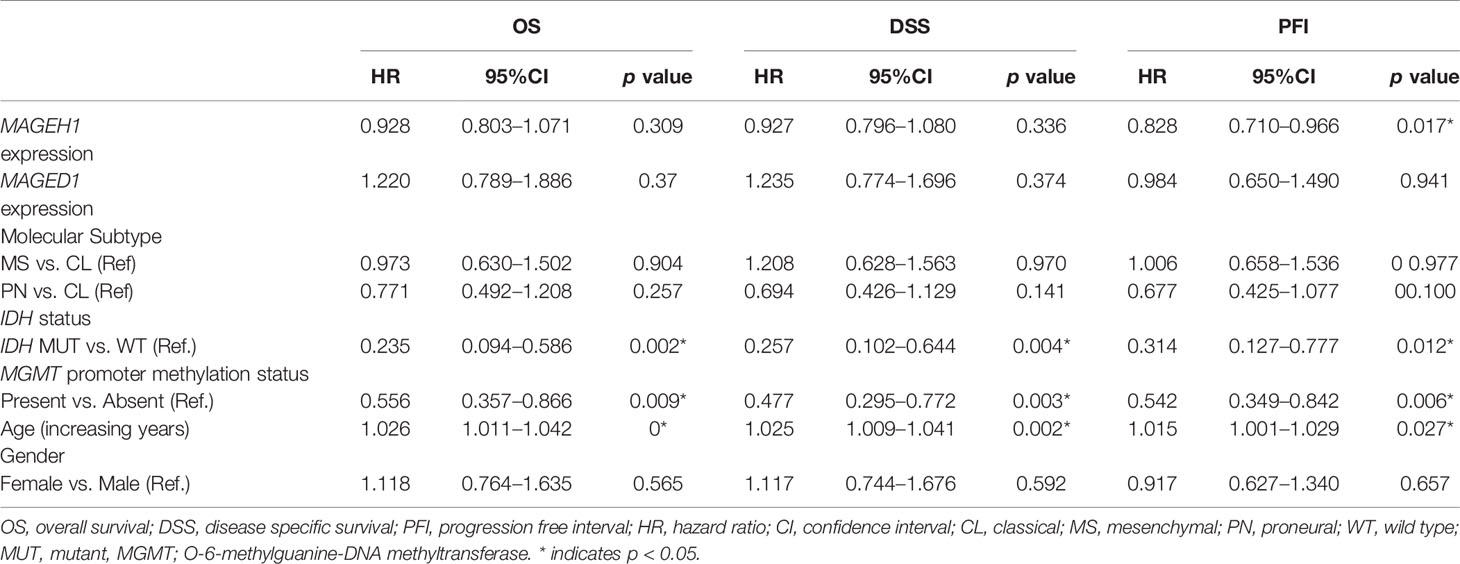
Table 4 Univariate survival analysis in TCGA-GBM dataset.
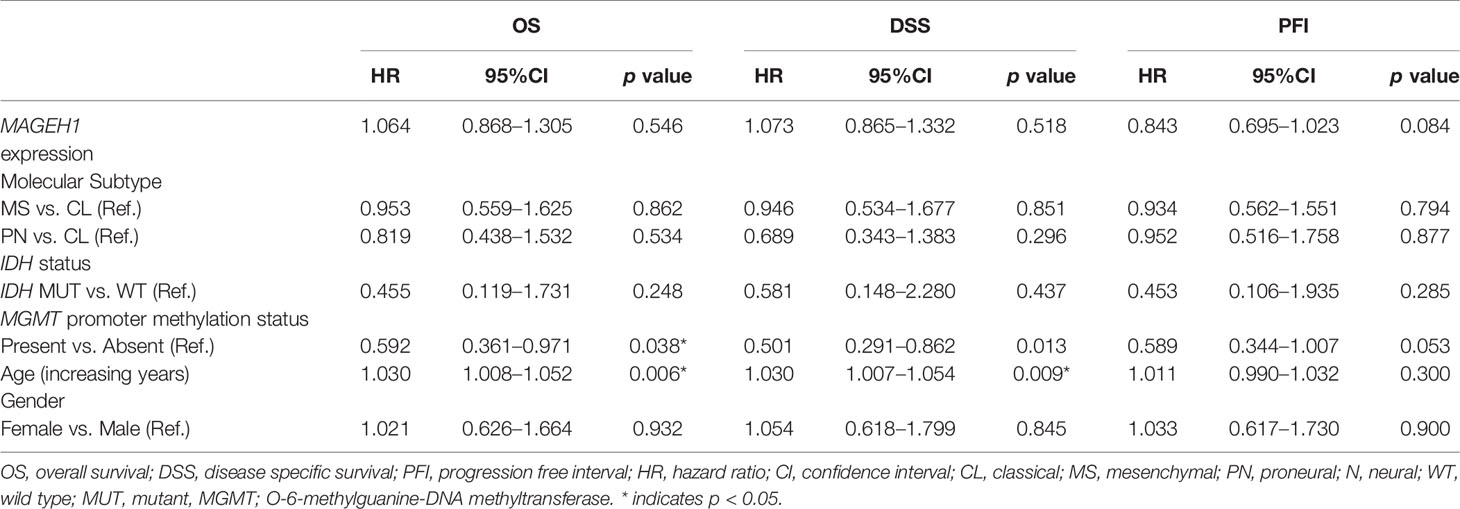
Table 5 Multivariate survival analysis for MAGEH1 in TCGA-GBM dataset.

Table 6 Multivariate survival analysis for MAGED1 in TCGA-GBM dataset.
MAGEH1 Associated Pathways in Glioma
Considering its prognostic significance in LGG, we determined the potential functional associations of MAGEH1 in LGG by performing gene set enrichment analysis over whole transcriptome correlations of MAGEH1 expression in TCGA-LGG dataset. Interestingly, positively correlated genes were highly enriched in Myc target genes (Figures 8A, B) and Hedgehog signaling (Figure 8C). Further, genes negatively correlated to MAGEH1 expression were enriched in different immune associated pathways (Figures 8D–G, I–K) and cancer associated pathways including epithelial to mesenchymal transition (Figure 8H) and apoptosis (Figure 8L).
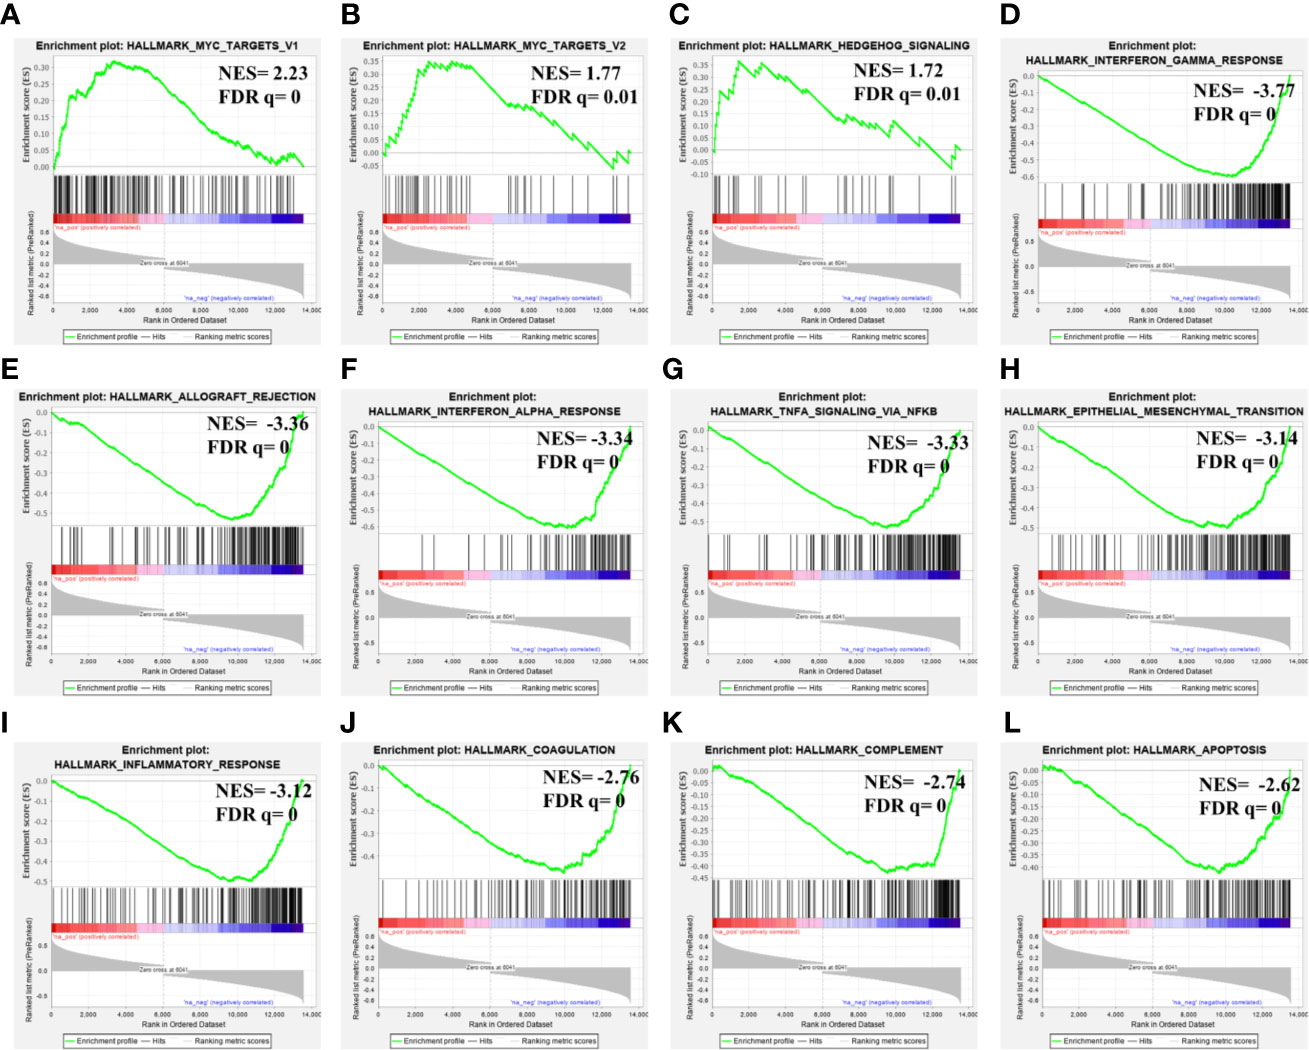
Figure 8 Gene set enrichment analysis for MAGEH1 associations in lower grade glioma from TCGA dataset. (A–C) positively associated pathways, (D–L) negatively associated pathways. NES, normalized enrichment score; FDR q, false detection rate corrected p value.
Association of T2M Expression With Immune Response in Glioma
Pathway analysis revealed that MAGEH1 correlated genes are involved in tumor immunity. Further, we explored the association of its expression with the level of infiltration of six different immune cell types using RNA deconvolution based TIMER analysis. This analysis in LGG revealed a negative correlation between MAGEH1 expression and infiltration of multiple immune cells, such as B cells (r= -0.21, p<0.001), CD4 T cells (r=-0.337, p<0.001), macrophages (r=-0.377, p<0.001), neutrophils (r=-0.384, p<0.001), and dendritic cells (r=-0.342, r<0.001) (Figure 9A). However in GBM, MAGEH1 exhibited positive correlation with CD8 T cells (r=0.134, p<0.01) and neutrophils (r=0.331, p<0.001) and a negative correlation with dendritic cells (r=-0.176, p<0.001). Further, other downregulated T2Ms in glioma, including MAGEE1 (Figure 9B), MAGEL2 (Figure 9C), TRO (Figure 9D), and NDN (Figure 9E) also exhibited similar negative correlations with immune cell infiltration in LGG, while in GBM they showed a varying degree of positive correlations with infiltration of different immune cells.
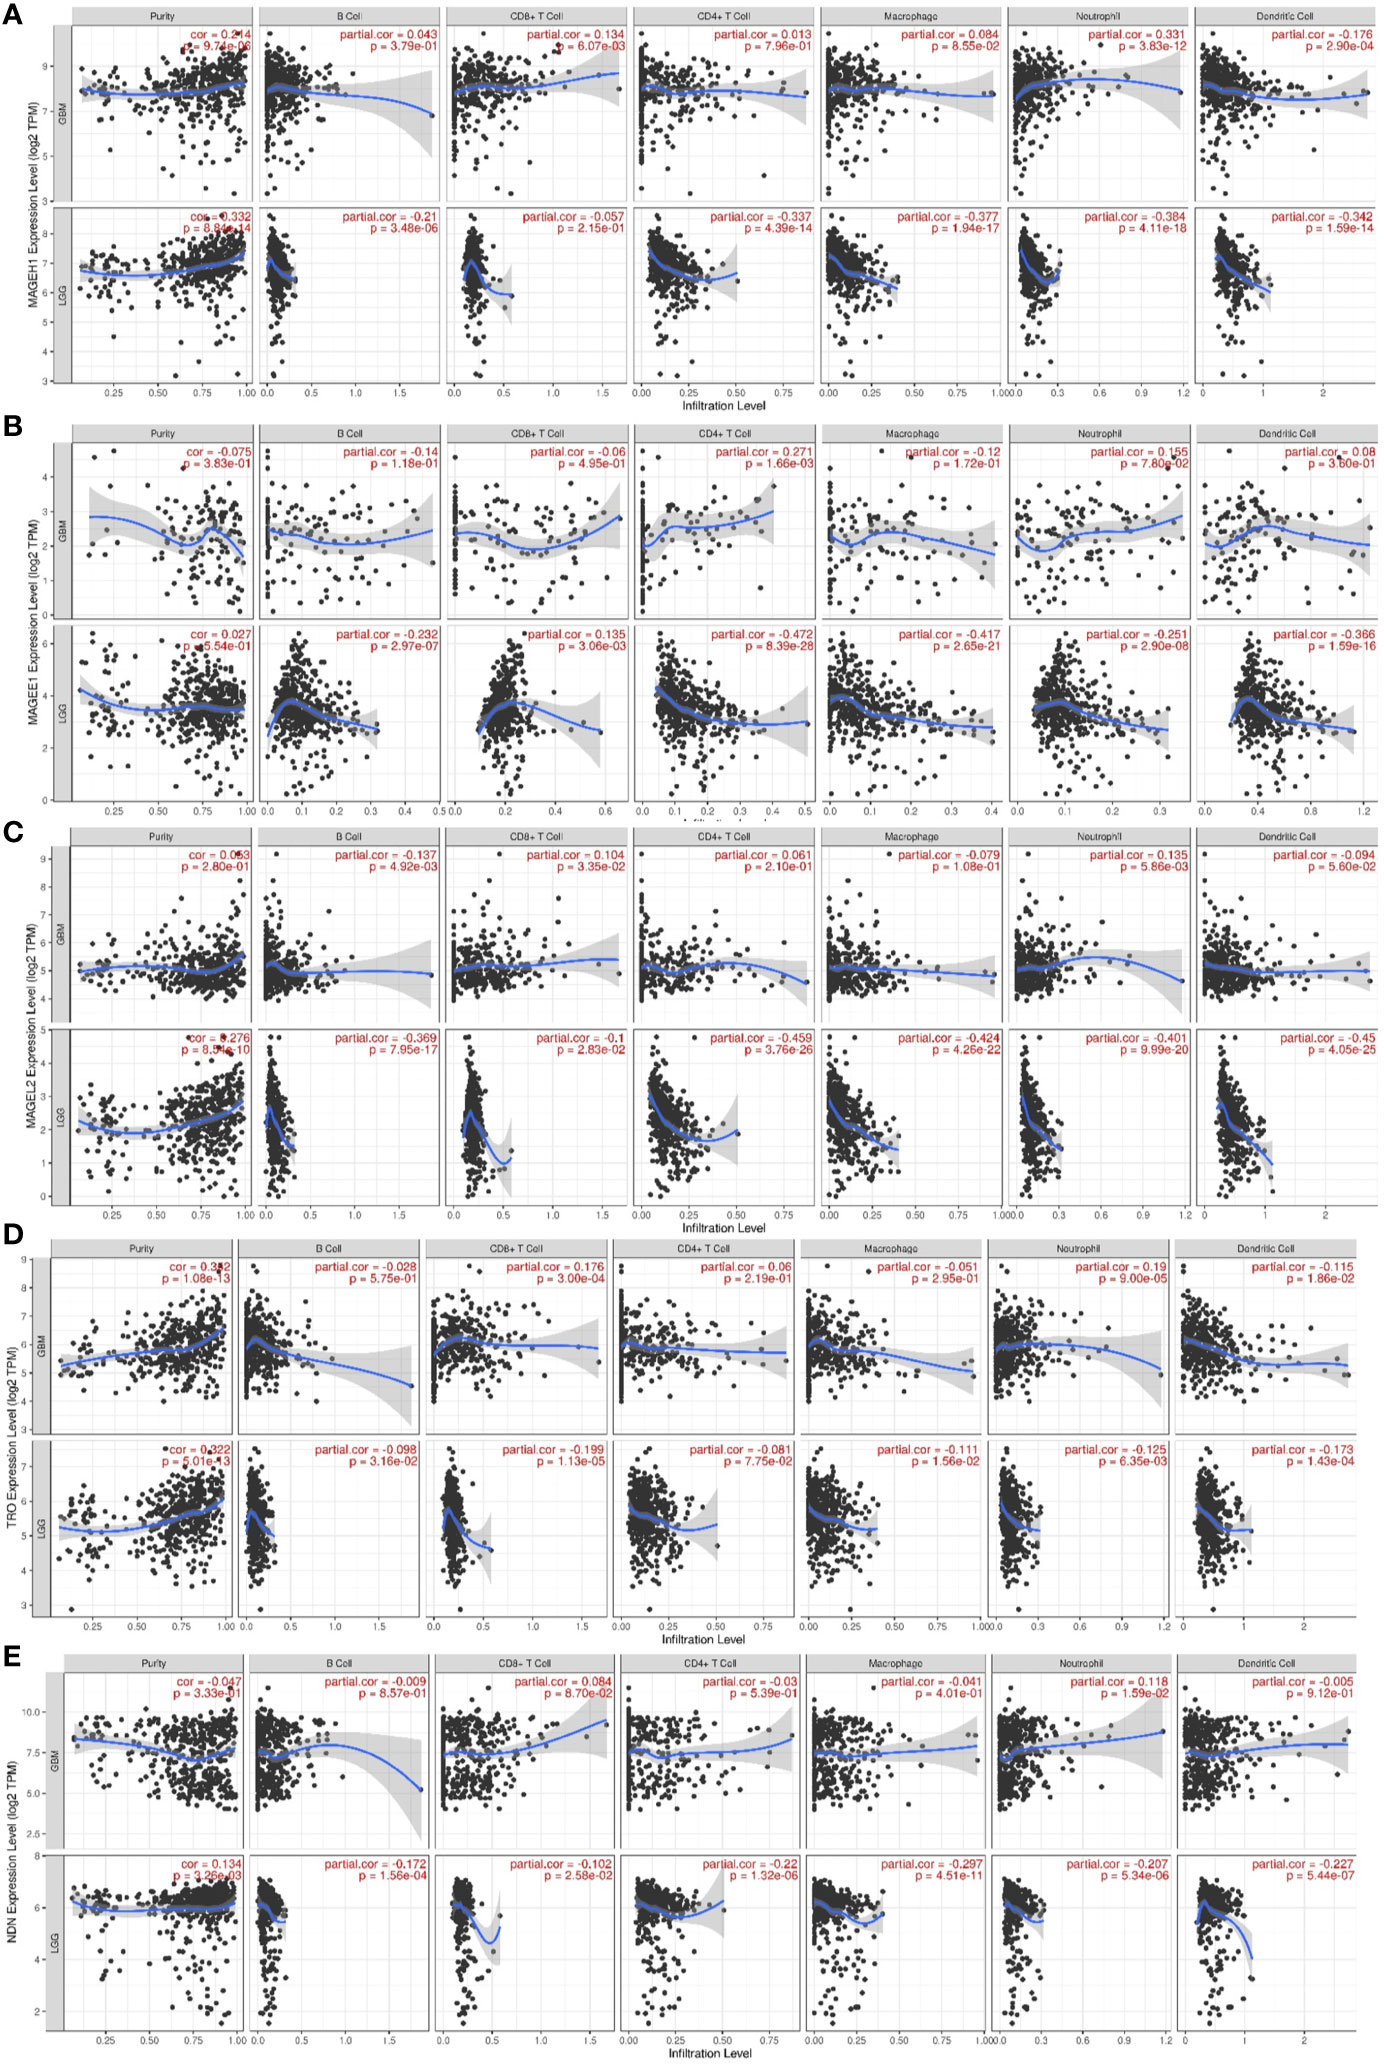
Figure 9 Association of T2M expression with immune infiltration in glioma. TIMER analysis for Type 2 MAGE genes in TCGA-LGG and TCGA-GBM dataset. Analysis outputs for (A) MAGEH1 (B) MAGEE1 (C) MAGEL2 (D) TRO (E) NDN.
Discussion
Despite of the recent advances in the understanding of glioma biology, limited improvements have been observed in patient survival (1). The current study was undertaken to analyze the clinical utility of T2Ms expression in glioma. We further focused our analysis to determine the coexpression pattern, underlying regulatory mechanism, and association of T2Ms with tumor immunity. Oncomine analysis provided the benefit of comparing gene expression between tumor and normal brain tissues from multiple datasets, in parallel. This would compensate for the dataset dependent variations and only highly significant observations were considered using a stringent cutoff value of p<0.001. This analysis revealed that some MAGEs including MAGED subfamily are overexpressed, while most others including MAGEE1, MAGEE2, MAGEL2, MAGEH1, NDN, and TRO are downregulated in glioma. The downregulation of these T2Ms suggests their potential tumor suppressor functions in glioma. Downregulation and tumor suppressor functions of Necdin in glioma have been previously reported in detail (19). MAGEH1 expression has been reported to be downregulated in hepatocellular carcinoma (39) and cholangiocarcinoma (40). Further, MAGEH1 overexpression inhibits proliferation, cell migration, and invasion in hepatocellular carcinoma (39), induces apoptosis in melanoma cell lines (41), and cell cycle arrest in multiple cancer cell lines (40, 42). In agreement with these studies, we also observed that MAGEH1 is significantly downregulated with advanced grade of glioma. Further, higher MAGEH1 was also associated with age, IDH mutation, and 1p/19q co-deletion status.
Similar to T1Ms, which are coordinately expressed (23), our correlation analysis revealed that T2Ms are also co-expressed in glioma tissues. Further, we observed highly coordinated expression within two major groups of the MAGE gene family in multiple cancers, including glioma. Interestingly, while MAGED subfamily members showed upregulation in glioma, they also exhibited strong positive correlation among themselves, therefore suggesting common regulation and functions. Theoretically, co-expression of structurally similar MAGE proteins can regulate a large number of oncogenic functions. Nevertheless, functional interaction of two MAGE proteins to perform a single oncogenic function has also been reported (43). Furthermore, both MAGEH1 and Necdin have been shown to interact with p75 neurotrophin receptors, a class of receptors that regulate cell growth and neuronal survival (44).
We hypothesized that the coexpression pattern observed for the downregulated T2Ms is guided by a common regulatory mechanism, including DNA methylation. DNA hypomethylation associated overexpression of MAGED4 has previously been reported in glioma (18). Therefore, it was to our interest whether the downregulated T2Ms that emerged in the expression analysis are also regulated by DNA methylation. Interestingly, we identified several intragenic CpG sites in MAGEH1 gene, where DNA methylation was closely associated with its gene expression. Although the IDH mutation in glioma leads to a hypermethylation phenotype and global gene repression, interestingly, MAGEH1 exhibited higher expression in IDH mutant tumors. This is in agreement with previous reports which demonstrated that DNA hypermethylation may also upregulate some genes by promoting transcription accessibility at some genomic regions (45).
The prognostic utility of T2Ms was revealed by survival analysis in TCGA datasets. Interestingly, the association of MAGEH1 with better survival of patients was separately validated in major histological and molecular subtypes of glioma. Further, this association was independent of IDH status and other clinically relevant variables. The association of MAGED4 overexpression with poor prognosis of glioma patients has been previously reported (46). In agreement to this, our analysis revealed that while MAGED1, which is co-expressed with MAGED4, was associated with poor prognosis in glioma, it did not emerge as an independent prognostic factor in multivariate analysis. Using a similar analysis of cancer-testis antigens in TCGA datasets, association of Necdin expression with favorable overall survival in glioma has also been reported (20). Our study revealed that NDN expression is downregulated in a coordinated manner with other T2Ms and higher expression of these T2Ms is associated with better patient prognosis in lower grade glioma.
While the current pieces of evidence strongly suggest tumor suppressor functions of some T2Ms, limited information is available for detailed functions of these proteins in glioma. We, therefore, performed pathway analysis for MAGEH1 co-expressed genes, which revealed strong positive enrichment of Myc and Hedgehog signaling genes. While both of these signaling pathways promote glioma progression (47, 48), their functional association with MAGEH1 remains unclear. Nevertheless, a higher c-Myc expression is indeed associated with better prognosis in glioma patients (49). This might be partially due to less characterized proapoptotic properties of c-Myc, which may sensitize Myc overexpressing glioma cells to DNA damaging agents, such as chemotherapy and radiotherapy (49).
Recent evidence suggests that immune response plays a crucial role in glioma and immunity associated pathways are associated with therapeutic response and clinical outcome. Further, analysis of immunogenomic profiles has led to the identification of several immunomodulatory pathways, such as DNA damage repair (50) and tumor-associated immunomodulatory proteins, such as Galectin-1 and IGFBP2 (51, 52). Pathway analysis revealed that the expression of MAGEH1 was negatively correlated with several immunity associated pathways along with level of immune infiltration in LGG. Contrary to this, a positive correlation of MAGEH1 with different immune cell population was observed in GBM. These results suggest that T2Ms might be involved in regulating tumor immune infiltration distinctly in LGG compared to GBM. LGG have been shown to exhibit distinct immune composition compared to GBMs (53, 54). In addition to expected intratumor heterogeneity, the microenvironment composition variably influences gene expression profiles (55, 56).
In conclusion, the current study provides intrinsic details of coordinated expression, epigenetic regulation, and prognostic significance of T2Ms in glioma. These findings will provide a strong basis and resource for designing future research on Type 2 MAGE proteins. However, this study is limited by the utilization of gene expression as the primary measure for alterations of T2Ms. Therefore, a protein level study with mechanistic exploration may provide better insights into the role of T2M proteins in glioma biology.
Data Availability Statement
The datasets used in this study are publicly available. The source datasets are available at the following links: TCGA-LGG and TCGA-GBM dataset, https://portal.gdc.cancer.gov/; REMBRANDT dataset, https://www.ncbi.nlm.nih.gov/geo/query/acc.cgi?acc=GSE108476; Oncomine tool is freely available after registration at https://www.oncomine.org/resource/login.html.
Ethics Statement
Ethical review and approval was not required for the study on human participants in accordance with the local legislation and institutional requirements. Written informed consent for participation was not required for this study in accordance with the national legislation and the institutional requirements.
Author Contributions
MA conceptualized the study. SC supervised the study and provided essential infrastructure. MA, SK, and JS and AC performed data curation, interpretation, and statistical analysis. MA and SK wrote the original manuscript. All authors contributed to the article and approved the submitted version.
Funding
This work is supported by the Wellcome Trust/DBT India Alliance Fellowship (grant number: IA/CPHI/17/1/503333) awarded to AC and project support under young scientist scheme from Department of Health Research, Government of India granted to SK.
Conflict of Interest
The authors declare that the research was conducted in the absence of any commercial or financial relationships that could be construed as a potential conflict of interest.
Acknowledgments
MA acknowledges financial support as a fellowship from Council of Scientific and Industrial Research, Government of India. JS acknowledges financial support as a fellowship from Department of Biotechnology, Government of India.
Supplementary Material
The Supplementary Material for this article can be found online at: https://www.frontiersin.org/articles/10.3389/fonc.2020.573378/full#supplementary-material
References
1. Bray F, Ferlay J, Soerjomataram I, Siegel RL, Torre LA, Jemal A. Global cancer statistics 2018: GLOBOCAN estimates of incidence and mortality worldwide for 36 cancers in 185 countries. CA Cancer J Clin (2018) 68:394–424. doi: 10.3322/caac.21492
2. Louis DN, Perry A, Reifenberger G, von Deimling A, Figarella-Branger D, Cavenee WK, et al. The 2016 World Health Organization Classification of Tumors of the Central Nervous System: a summary. Acta Neuropathol (2016) 131:803–20. doi: 10.1007/s00401-016-1545-1
3. Boots-Sprenger SHE, Sijben A, Rijntjes J, Tops BBJ, Idema AJ, Rivera AL, et al. Significance of complete 1p/19q co-deletion, IDH1 mutation and MGMT promoter methylation in gliomas: use with caution. Mod Pathol (2013) 26:922–9. doi: 10.1038/modpathol.2012.166
4. Cancer Genome Atlas Research Network, Brat DJ, Verhaak RGW, Aldape KD, Yung WKA, Salama SR, et al. Comprehensive, Integrative Genomic Analysis of Diffuse Lower-Grade Gliomas. N Engl J Med (2015) 372:2481–98. doi: 10.1056/NEJMoa1402121
5. Noushmehr H, Weisenberger DJ, Diefes K, Phillips HS, Pujara K, Berman BP, et al. Identification of a CpG island methylator phenotype that defines a distinct subgroup of glioma. Cancer Cell (2010) 17:510–22. doi: 10.1016/j.ccr.2010.03.017
6. Hegi ME, Diserens A-C, Gorlia T, Hamou M-F, de Tribolet N, Weller M, et al. MGMT gene silencing and benefit from temozolomide in glioblastoma. N Engl J Med (2005) 352:997–1003. doi: 10.1056/NEJMoa043331
7. Chomez P, Backer OD, Bertrand M, Plaen ED, Boon T, Lucas S. An Overview of the MAGE Gene Family with the Identification of All Human Members of the Family. Cancer Res (2001) 61:5544–51.
8. Lee AK, Potts PR. A comprehensive guide to the MAGE family of ubiquitin ligases. J Mol Biol (2017) 429:1114–42. doi: 10.1016/j.jmb.2017.03.005
9. Zhao Q, Caballero OL, Simpson AJG, Strausberg RL. Differential Evolution of MAGE Genes Based on Expression Pattern and Selection Pressure. PLoS One (2012) 7:e48240. doi: 10.1371/journal.pone.0048240
10. Junwei W, Xiumin Z, Jing Y, Shoujing Y, Zengshan L. In vivo enhancement of the MAGE-specific cellular immune response by a recombinant MAGE1-MAGE3-TBHSP70 tumor vaccine. Cancer Cell Int (2016) 16:45. doi: 10.1186/s12935-016-0317-2
11. Zajac P, Schultz-Thater E, Tornillo L, Sadowski C, Trella E, Mengus C, et al. MAGE-A Antigens and Cancer Immunotherapy. Front Med (Lausanne) (2017) 4:18. doi: 10.3389/fmed.2017.00018
12. Zhang X-M, Zhang Y-F, Huang Y, Qu P, Ma B, Si S-Y, et al. The anti-tumor immune response induced by a combination of MAGE-3/MAGE-n-derived peptides. Oncol Rep (2008) 20:245–52.
13. Song X, Hao J, Wang J, Guo C, Wang Y, He Q, et al. The cancer/testis antigen MAGEC2 promotes amoeboid invasion of tumor cells by enhancing STAT3 signaling. Oncogene (2017) 36:1476–86. doi: 10.1038/onc.2016.314
14. Lian Y, Meng L, Ding P, Sang M. Epigenetic regulation of MAGE family in human cancer progression-DNA methylation, histone modification, and non-coding RNAs. Clin Epigenet (2018) 10:115. doi: 10.1186/s13148-018-0550-8
15. Maruyama K, Usami M, Aizawa T, Yoshikawa K. A novel brain-specific mRNA encoding nuclear protein (necdin) expressed in neurally differentiated embryonal carcinoma cells. Biochem Biophys Res Commun (1991) 178:291–6. doi: 10.1016/0006-291x(91)91812-q
16. Kuwajima T. Necdin Promotes GABAergic Neuron Differentiation in Cooperation with Dlx Homeodomain Proteins. J Neurosci (2006) 26:5383–92. doi: 10.1523/JNEUROSCI.1262-06.2006
17. Sasaki M, Nakahira K, Kawano Y, Katakura H, Yoshimine T, Shimizu K, et al. MAGE-E1, a new member of the melanoma-associated antigen gene family and its expression in human glioma. Cancer Res (2001) 61:4809–14.
18. Zhang Q-M, Shen N, Xie S, Bi S-Q, Luo B, Lin Y-D, et al. MAGED4 expression in glioma and upregulation in glioma cell lines with 5-aza-2’-deoxycytidine treatment. Asian Pac J Cancer Prev (2014) 15:3495–501. doi: 10.7314/apjcp.2014.15.8.3495
19. Chapman EJ, Knowles MA. Necdin: A multi functional protein with potential tumor suppressor role? Mol Carcinog (2009) 48:975–81. doi: 10.1002/mc.20567
20. Li X, Hughes SC, Wevrick R. Evaluation of melanoma antigen (MAGE) gene expression in human cancers using The Cancer Genome Atlas. Cancer Genet (2015) 208:25–34. doi: 10.1016/j.cancergen.2014.11.005
21. Erdem-Eraslan L, Heijsman D, de Wit M, Kremer A, Sacchetti A, van der Spek PJ, et al. Tumor-specific mutations in low-frequency genes affect their functional properties. J Neurooncol (2015) 122:461–70. doi: 10.1007/s11060-015-1741-1
22. Ehrlich M, Hallmann A-L, Reinhardt P, Araúzo-Bravo MJ, Korr S, Röpke A, et al. Distinct Neurodegenerative Changes in an Induced Pluripotent Stem Cell Model of Frontotemporal Dementia Linked to Mutant TAU Protein. Stem Cell Rep (2015) 5:83–96. doi: 10.1016/j.stemcr.2015.06.001
23. Garcia-Soto AE, Schreiber T, Strbo N, Ganjei-Azar P, Miao F, Koru-Sengul T, et al. Cancer-testis antigen expression is shared between epithelial ovarian cancer tumors. Gynecol Oncol (2017) 145:413–9. doi: 10.1016/j.ygyno.2017.03.512
24. Chibuk TK, Bischof JM, Wevrick R. A necdin/MAGE-like gene in the chromosome 15 autism susceptibility region: expression, imprinting, and mapping of the human and mouse orthologues. BMC Genet (2001) 2:22. doi: 10.1186/1471-2156-2-22
25. Jay P, Rougeulle C, Massacrier A, Moncla A, Mattei MG, Malzac P, et al. The human necdin gene, NDN, is maternally imprinted and located in the Prader-Willi syndrome chromosomal region. Nat Genet (1997) 17:357–61. doi: 10.1038/ng1197-357
26. Bowman RL, Wang Q, Carro A, Verhaak RGW, Squatrito M. GlioVis data portal for visualization and analysis of brain tumor expression datasets. Neuro Oncol (2017) 19:139–41. doi: 10.1093/neuonc/now247
27. Ceccarelli M, Barthel FP, Malta TM, Sabedot TS, Salama SR, Murray BA, et al. Molecular Profiling Reveals Biologically Discrete Subsets and Pathways of Progression in Diffuse Glioma. Cell (2016) 164:550–63. doi: 10.1016/j.cell.2015.12.028
28. Gusev Y, Bhuvaneshwar K, Song L, Zenklusen J-C, Fine H, Madhavan S. The REMBRANDT study, a large collection of genomic data from brain cancer patients. Sci Data (2018) 5. doi: 10.1038/sdata.2018.158
29. Cerami E, Gao J, Dogrusoz U, Gross BE, Sumer SO, Aksoy BA, et al. The cBio Cancer Genomics Portal: An Open Platform for Exploring Multidimensional Cancer Genomics Data. Cancer Discov (2012) 2:401–4. doi: 10.1158/2159-8290.CD-12-0095
30. Gao J, Aksoy BA, Dogrusoz U, Dresdner G, Gross B, Sumer SO, et al. Integrative analysis of complex cancer genomics and clinical profiles using the cBioPortal. Sci Signal (2013) 6:pl1. doi: 10.1126/scisignal.2004088
31. Deng W, Wang Y, Liu Z, Cheng H, Xue Y. HemI: A Toolkit for Illustrating Heatmaps. PLoS One (2014) 9:e111988. doi: 10.1371/journal.pone.0111988
32. Subramanian A, Tamayo P, Mootha VK, Mukherjee S, Ebert BL, Gillette MA, et al. Gene set enrichment analysis: A knowledge-based approach for interpreting genome-wide expression profiles. Proc Natl Acad Sci (2005) 102:15545–50. doi: 10.1073/pnas.0506580102
33. Liberzon A, Birger C, Thorvaldsdóttir H, Ghandi M, Mesirov JP, Tamayo P. The Molecular Signatures Database (MSigDB) hallmark gene set collection. Cell Syst (2015) 1:417–25. doi: 10.1016/j.cels.2015.12.004
34. Koch A, De Meyer T, Jeschke J, Van Criekinge W. MEXPRESS: visualizing expression, DNA methylation and clinical TCGA data. BMC Genomics (2015) 16:636. doi: 10.1186/s12864-015-1847-z
35. Koch A, Jeschke J, Van Criekinge W, van Engeland M, De Meyer T. MEXPRESS update 2019. Nucleic Acids Res (2019) 47:W561–5. doi: 10.1093/nar/gkz445
36. Liu J, Lichtenberg T, Hoadley KA, Poisson LM, Lazar AJ, Cherniack AD, et al. An Integrated TCGA Pan-Cancer Clinical Data Resource to Drive High-Quality Survival Outcome Analytics. Cell (2018) 173:400–16.e11. doi: 10.1016/j.cell.2018.02.052
37. Li T, Fan J, Wang B, Traugh N, Chen Q, Liu JS, et al. TIMER: A Web Server for Comprehensive Analysis of Tumor-Infiltrating Immune Cells. Cancer Res (2017) 77:e108–10. doi: 10.1158/0008-5472.CAN-17-0307
38. Wang Q, Hu B, Hu X, Kim H, Squatrito M, Scarpace L, et al. Tumor Evolution of Glioma-Intrinsic Gene Expression Subtypes Associates with Immunological Changes in the Microenvironment. Cancer Cell (2017) 32:42–56.e6. doi: 10.1016/j.ccell.2017.06.003
39. Wang P-C, Hu Z-Q, Zhou S-L, Zhan H, Zhou Z-J, Luo C-B, et al. Downregulation of MAGE family member H1 enhances hepatocellular carcinoma progression and serves as a biomarker for patient prognosis. Future Oncol (2018) 14:1177–86. doi: 10.2217/fon-2017-0672
40. Zheng J, Li Q, Wang W, Wang Y, Fu X, Wang W, et al. Apoptosis-related protein-1 acts as a tumor suppressor in cholangiocarcinoma cells by inducing cell cycle arrest via downregulation of cyclin-dependent kinase subunits. Oncol Rep (2016) 35:809–16. doi: 10.3892/or.2015.4422
41. Selimovic D, Sprenger A, Hannig M, Haïkel Y, Hassan M. Apoptosis related protein-1 triggers melanoma cell death via interaction with the juxtamembrane region of p75 neurotrophin receptor. J Cell Mol Med (2012) 16:349–61. doi: 10.1111/j.1582-4934.2011.01304.x
42. Fu H, Yang G, Lu F, Wang R, Yao L, Lu Z. Transcriptional up-regulation of restin by all-trans retinoic acid through STAT1 in cancer cell differentiation process. Biochem Biophys Res Commun (2006) 343:1009–16. doi: 10.1016/j.bbrc.2006.02.176
43. Laiseca JE, Ladelfa MF, Cotignola J, Peche LY, Pascucci FA, Castaño BA, et al. Functional interaction between co-expressed MAGE-A proteins. PLoS One (2017) 12. doi: 10.1371/journal.pone.0178370
44. Tcherpakov M, Bronfman FC, Conticello SG, Vaskovsky A, Levy Z, Niinobe M, et al. The p75 neurotrophin receptor interacts with multiple MAGE proteins. J Biol Chem (2002) 277:49101–4. doi: 10.1074/jbc.C200533200
45. Ren J, Lou M, Shi J, Xue Y, Cui D. Identifying the genes regulated by IDH1 via gene-chip in glioma cell U87. Int J Clin Exp Med (2015) 8:18090–8.
46. Yan J, Wen J, Wei Z-D, Li X-S, Li P, Xiao S-W. Prognostic and clinicopathological value of melanoma-associated antigen D4 in patients with glioma. Oncol Lett (2018) 15:4151–60. doi: 10.3892/ol.2018.7884
47. Annibali D, Whitfield JR, Favuzzi E, Jauset T, Serrano E, Cuartas I, et al. Myc inhibition is effective against glioma and reveals a role for Myc in proficient mitosis. Nat Commun (2014) 5:4632. doi: 10.1038/ncomms5632
48. Takezaki T, Hide T, Takanaga H, Nakamura H, Kuratsu J-I, Kondo T. Essential role of the Hedgehog signaling pathway in human glioma-initiating cells. Cancer Sci (2011) 102:1306–12. doi: 10.1111/j.1349-7006.2011.01943.x
49. Cenci T, Martini M, Montano N, D’Alessandris QG, Falchetti ML, Annibali D, et al. Prognostic Relevance of c-Myc and BMI1 Expression in Patients With Glioblastoma. Am J Clin Pathol (2012) 138:390–6. doi: 10.1309/AJCPRXHNJQLO09QA
50. Meng X, Duan C, Pang H, Chen Q, Han B, Zha C, et al. DNA damage repair alterations modulate M2 polarization of microglia to remodel the tumor microenvironment via the p53-mediated MDK expression in glioma. EBioMedicine (2019) 41:185–99. doi: 10.1016/j.ebiom.2019.01.067
51. Cai J, Chen Q, Cui Y, Dong J, Chen M, Wu P, et al. Immune heterogeneity and clinicopathologic characterization of IGFBP2 in 2447 glioma samples. Oncoimmunology (2018) 7:e1426516. doi: 10.1080/2162402X.2018.1426516
52. Chen Q, Han B, Meng X, Duan C, Yang C, Wu Z, et al. Immunogenomic analysis reveals LGALS1 contributes to the immune heterogeneity and immunosuppression in glioma. Int J Cancer (2019) 145:517–30. doi: 10.1002/ijc.32102
53. Lu J, Li H, Chen Z, Fan L, Feng S, Cai X, et al. Identification of 3 subpopulations of tumor-infiltrating immune cells for malignant transformation of low-grade glioma. Cancer Cell Int (2019) 19. doi: 10.1186/s12935-019-0972-1
54. Weenink B, Draaisma K, Ooi HZ, Kros JM, Sillevis Smitt PAE, Debets R, et al. Low-grade glioma harbors few CD8 T cells, which is accompanied by decreased expression of chemo-attractants, not immunogenic antigens. Sci Rep (2019) 9:14643. doi: 10.1038/s41598-019-51063-6
55. DeCordova S, Shastri A, Tsolaki AG, Yasmin H, Klein L, Singh SK, et al. Molecular Heterogeneity and Immunosuppressive Microenvironment in Glioblastoma. Front Immunol (2020) 11:1402. doi: 10.3389/fimmu.2020.01402
Keywords: glioma, glioblastoma, melanoma associated antigen, The Cancer Genome Atlas (TCGA), epigenetics, DNA methylation
Citation: Arora M, Kumari S, Singh J, Chopra A and Chauhan SS (2020) Downregulation of Brain Enriched Type 2 MAGEs Is Associated With Immune Infiltration and Poor Prognosis in Glioma. Front. Oncol. 10:573378. doi: 10.3389/fonc.2020.573378
Received: 16 June 2020; Accepted: 10 November 2020;
Published: 23 December 2020.
Edited by:
Leonora Balaj, Massachusetts General Hospital and Harvard Medical School, United StatesReviewed by:
Jason M. Miska, Northwestern University, United StatesJinquan Cai, Harbin Medical University, China
Copyright © 2020 Arora, Kumari, Singh, Chopra and Chauhan. This is an open-access article distributed under the terms of the Creative Commons Attribution License (CC BY). The use, distribution or reproduction in other forums is permitted, provided the original author(s) and the copyright owner(s) are credited and that the original publication in this journal is cited, in accordance with accepted academic practice. No use, distribution or reproduction is permitted which does not comply with these terms.
*Correspondence: Shyam S. Chauhan, c19zX2NoYXVoYW5AaG90bWFpbC5jb20=; Anita Chopra, Y2hvcHJhYW5pdGEyMDA1QGdtYWlsLmNvbQ==
†These authors have contributed equally to this work