 Shuanbao Yu1†
 Guodong Hong1†Jin Tao1†Yan Shen2†Junxiao Liu1Biao Dong1Yafeng Fan1Ziyao Li1Ali Zhu1
 Xuepei Zhang1,3*
- 1Department of Urology, The First Affiliated Hospital of Zhengzhou University, Zhengzhou, China
- 2Department of Nosocomial Infection Management, The First Affiliated Hospital of Zhengzhou University, Zhengzhou, China
- 3Key Laboratory of Precision Diagnosis and Treatment for Chronic Kidney Disease in Henan Province, Zhengzhou, China
Purpose: We sought to develop diagnostic models incorporating mpMRI examination to identify PCa (Gleason score≥3+3) and CSPCa (Gleason score≥3+4) to reduce overdiagnosis and overtreatment.
Methods: We retrospectively identified 784 patients according to inclusion criteria between 2016 and 2020. The cohort was split into a training cohort of 548 (70%) patients and a validation cohort of 236 (30%) patients. Age, PSA derivatives, prostate volume, and mpMRI parameters were assessed as predictors for PCa and CSPCa. The multivariable models based on clinical parameters were evaluated using area under the curve (AUC), calibration plots, and decision curve analysis (DCA).
Results: Univariate analysis showed that age, tPSA, PSAD, prostate volume, MRI-PCa, MRI-seminal vesicle invasion, and MRI-lymph node invasion were significant predictors for both PCa and CSPCa (each p≤0.001). PSAD has the highest diagnostic accuracy in predicting PCa (AUC=0.79) and CSPCa (AUC=0.79). The multivariable models for PCa (AUC=0.92, 95% CI: 0.88–0.96) and CSPCa (AUC=0.95, 95% CI: 0.92–0.97) were significantly higher than the combination of derivatives for PSA (p=0.041 and 0.009 for PCa and CSPCa, respectively) or mpMRI (each p<0.001) in diagnostic accuracy. And the multivariable models for PCa and CSPCa illustrated better calibration and substantial improvement in DCA at threshold above 10%, compared with PSA or mpMRI derivatives. The PCa model with a 30% cutoff or CSPCa model with a 20% cutoff could spare the number of biopsies by 53%, and avoid the number of benign biopsies over 80%, while keeping a 95% sensitivity for detecting CSPCa.
Conclusion: Our multivariable models could reduce unnecessary biopsy without comprising the ability to diagnose CSPCa. Further prospective validation is required.
Introduction
Prostate cancer (PCa) is the most common malignancy of the male reproductive system, and the fifth leading cause of cancer death among men worldwide, with over one million new cases and 358,989 deaths in 2018 (1, 2). Although the incidence of PCa in China is relatively low compared with western countries, it has been progressively rising due to the aging population, changing diets, and availability of medical screening in recent decades (3–5).
A dozen of nomograms for prediction of PCa and/or clinically significant prostate cancer (CSPCa) with Gleason score (GS) ≥3+4 had been developed in Western countries (6–9). Researchers found that the models derived from Western populations overestimated the predicated risk of PCa and CSPCa among the East Asian populations, mainly due to the racial differences between two populations (10, 11). It may indicate the essentiality of developing risk prediction models among Chinese and Asian population. Additionally, the predict models for PCa and CSPCa among Chinese populations were mostly based on age, prostate-specific antigen (PSA) derivatives, prostate volume (PV), transrectal ultrasound (TRUS) finding, and digital rectal examination in the current studies (12–15).
Studies have validated the clinical utility of multiparametric magnetic resonance imaging (mpMRI) for the detection and localization of International Society of Urological Pathology (ISUP) grade ≥2 cancers (16), and demonstrated that the mpMRI may help mitigate the racial disparities of PCa (17). However, as far as we know, the knowledge about the performance of risk prediction models incorporating mpMRI findings is limited. In our study, we evaluated the diagnostic accuracy of age, PSA derivatives (tPSA, f/tPSA, and PSAD), PV, and mpMRI parameters for predicting PCa and CSPCa, respectively. Additionally, multivariable models based on age, PSA derivates, PV, and mpMRI parameters were developed to predict PCa and CSPCa. Overall, this study will be useful for developing the Chinese and international multivariable model based on clinical parameters to diagnose PCa and CSPCa, thereby reducing unnecessary prostate biopsy, and selecting the best clinical strategy.
Materials and Methods
Study Populations
This retrospective study was approved by the Institutional Ethics Review Board, and a waiver of informed consent was obtained. Between April 2016 and March 2020, mpMRI examination and TRUS-guided prostate biopsy was performed among 903 consecutive patients without a prior PCa diagnosis. The 25 patients diagnosed with other type of tumor/cancer and 94 patients with incomplete data were excluded leaving 784 cases available for analysis (Figure 1).
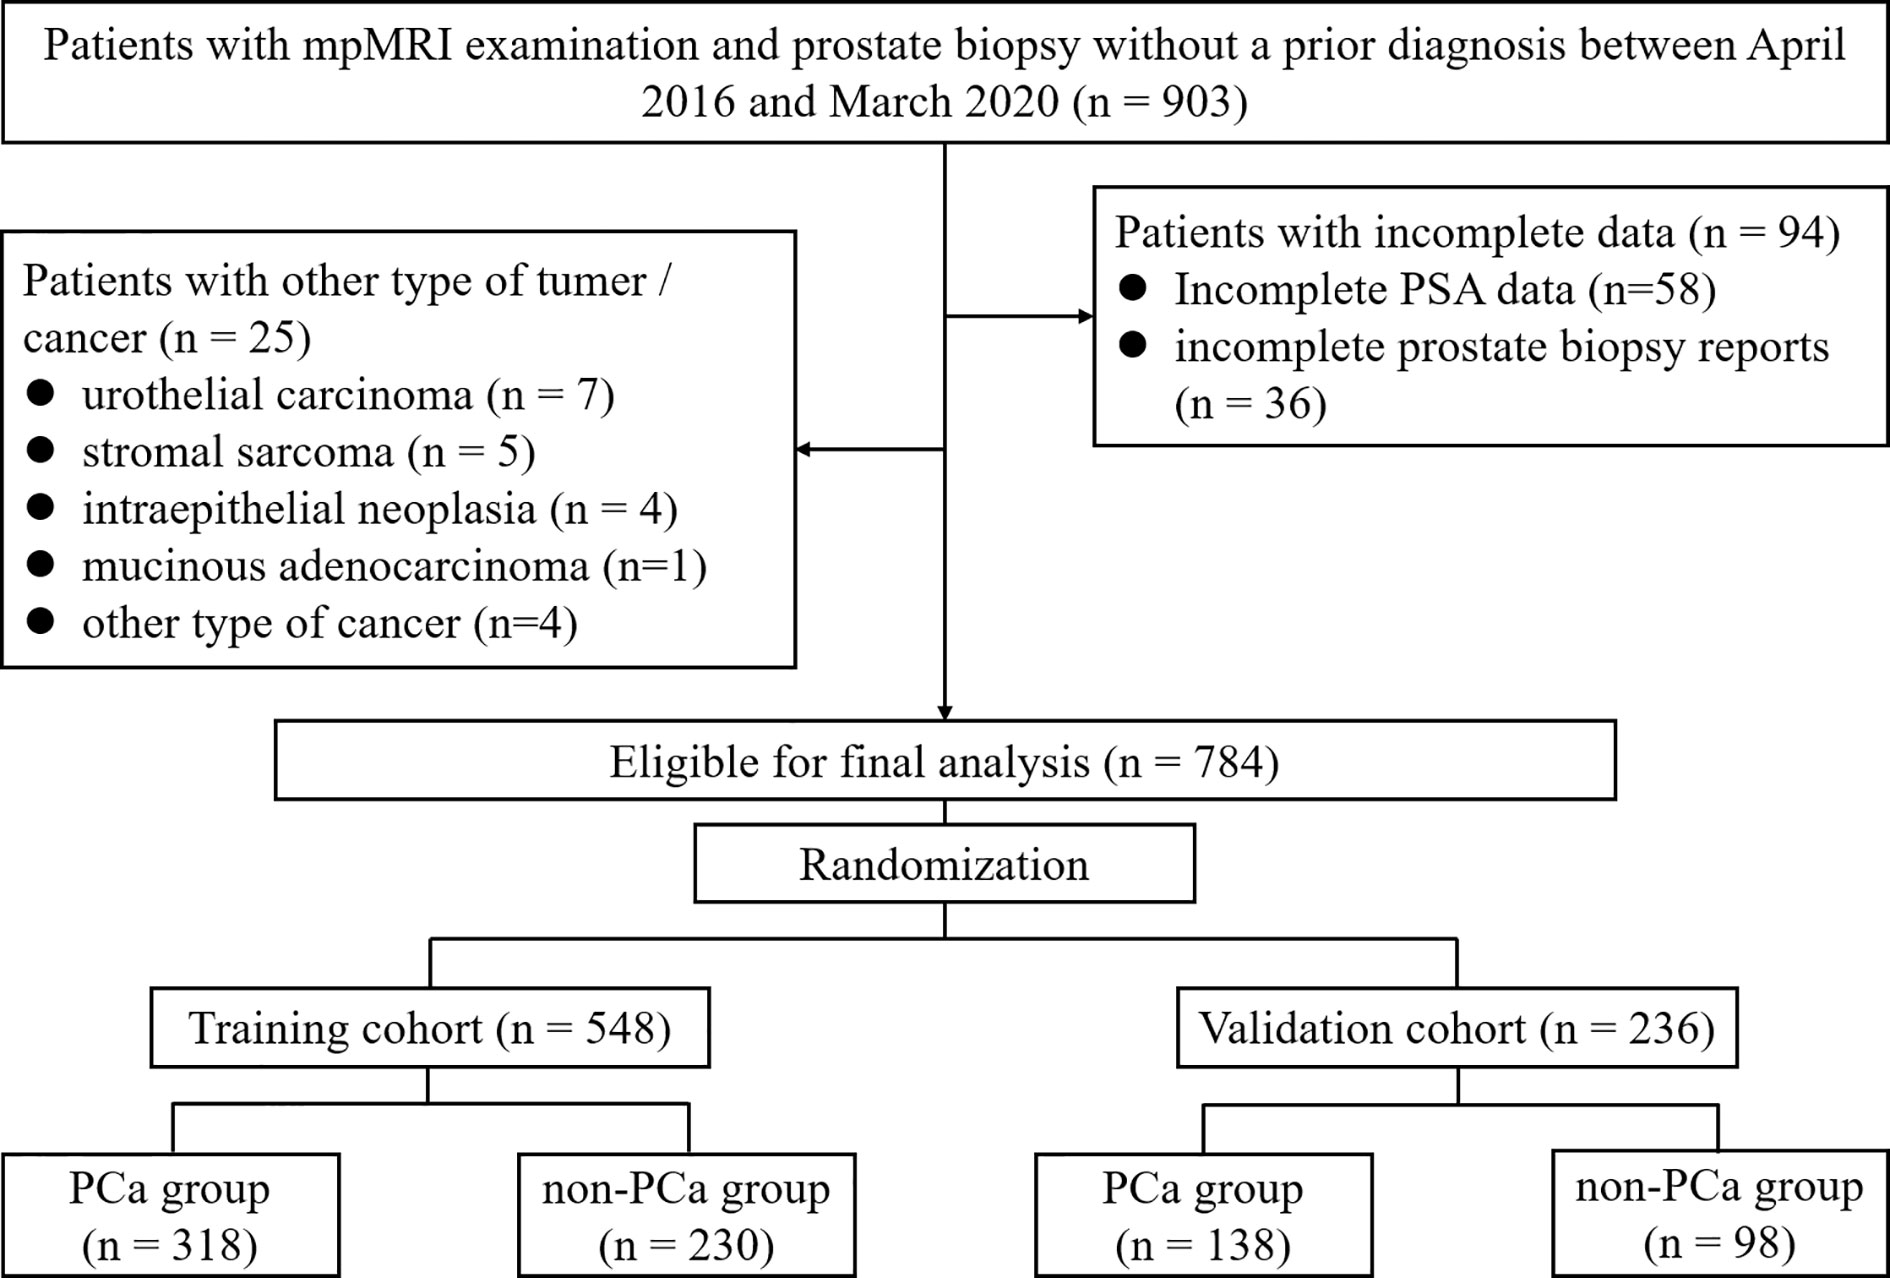
Figure 1 Flowchart of study participants selection.
Clinical, Imaging, and Pathological Parameters Collection
The clinical variables including the age at prostate biopsy, serum tPSA and fPSA level, PV, reports of mpMRI examination, and results of prostate biopsy were extracted from clinical records. PV was measured by 3.0-T MRI system (Siemens, Germany) using the exact prolate ellipsoid formula: PV = transversal diameter × anteroposterior diameter × vertical diameter × π/6 (18). The f/tPSA was calculated by dividing fPSA by tPSA, and the PSAD was calculated by dividing tPSA by PV.
All mpMRI examinations were performed using the 3.0-T MRI system with a pelvic phased-array coil, complied with European Society of Urology Radiology guidelines. The scan protocol for all patients included T2-weighted imaging (T2WI), diffusion-weighted imaging (DWI) and dynamic contrast-enhanced imaging (DCE). Additionally, 513 patients included the magnetic resonance spectroscopic imaging (MRSI). The prostate mpMRI images were interpreted by two experienced genitourinary radiologists with at least three years of prostate mpMRI experience. The mpMRI results were divided into groups according to the reports: “negative”, “equivocal”, and “suspicious” for the presence of PCa (MRI-PCa), seminal vesicle invasion (MRI-SVI), and lymph node invasion (MRI-LNI). The “negative”, “equivocal”, and “suspicious” for MRI-PCa corresponded to the PI-RADS 1 or 2, PI-RADS 3, and PI-RADS 4 or 5 according to the latest Prostate Imaging Reporting and Data System version 2 (PI-RADS v2) guideline. The suspicious MRI-SVI was defined as loss of normal high signal within and/or along the seminal vesicles (19). The suspicious MRI-LNI was defined as lymph nodes >8 mm in short-axis dimension and those with a high signal intensity on DWI (20).
All patients underwent TRUS-guided systematic 12-point biopsy according to the same protocol by three surgeons. If suspected malignant nodules by mpMRI and/or ultrasound, additional 1–5 needles were performed in regions with cognitive MRI-TURS fusion and/or abnormal ultrasound echoes. Biopsy cores were analyzed according to the standards of ISUP (21).
Statistical Analysis
We described the profile of age, PSA derivatives (tPSA, f/tPSA, PSAD), PV, and mpMRI parameters (MRI-PCa, MRI-SVI, and MRI-LNI) of enrolled patients by pathological diagnosis. Student’s t test or ANOVA was used to analyze continuous data. The Mann-Whitney U test was used to analyze ranked data. The χ2 test or Fisher’s exact test was used to analyze categorical data. The Bonferroni method for multiple comparisons was used if significant difference between groups was noted. The univariable and multivariable logistic regression were performed to identify significant predictors of PCa and CSPCa on biopsy. The models were examined with the receiver operating characteristics (ROC) curve and calibration plots, and the clinical utility was evaluated with a decision-curve analysis (DCA) (22). The ROC curve, calibration plots, and DCA was constructed with the package of “plotROC”, “ggplot2”, and “rmda”. Differences between the area under the curve (AUC) were compared using the method of DeLong et al. The calibration was assessed by grouping men in the validation cohort into delices (each of size 23 or 24), and then comparing the mean of predicated probabilities and the observed proportions. The sum squares of the residues (SSR) was used to assess the deviation of calibration plots form the 45° line. All tests were two sided with significance level set at 0.05. Data cleaning and analyses were conducted using R statistical software (Version 3.6.2).
Results
A total of 784 cases met study inclusion criteria. The training and validation cohorts consisted of 548 (70%) and 236 (30%) men, respectively (Figure 1 and Supplementary Table 1). The patient characteristics are summarized in Supplementary Table 1. The median [interquartile range (IQR)] age, tPSA, f/tPSA, PSAD, and PV values were 68 (62–74) years, 14.7 (8.22–29.0) ng/ml, 0.13 (0.09–0.20), 0.28 (0.15–0.61) ng/ml2, and 51 (34–74) ml, respectively. The MRI-PCa, -SVI, and -LNI were classified as “suspicious” in 355 (45%), 118 (15%), and 32 (4%) patients, respectively. Prostate biopsy results were negative for 457 (58%) cases and positive for 327 (42%) cases. Of the 327 PCa patients, 46 (14%) were with GS≤3+3, 50 (15%) were with GS=3+4, 88 (27%) were with GS=4+3, and 143 (44%) were with GS≥4+4 (Supplementary Table 1).
The Clinical Characteristics of Enrolled Patients by Pathological Results
Table 1 listed clinical characteristics including mpMRI parameters of enrolled patients by GS. The age (70 vs 66 years, p<0.001), tPSA (26.5 vs 10.9 ng/ml, p<0.001), and PSAD (0.62 vs 0.19 ng/ml2, p<0.001) were significantly higher in PCa patients compared with no-PCa (Supplementary Table 2). Additionally, the concentration of tPSA increased in serum with the GS (Table 1). The f/tPSA (0.11 vs 0.15, p<0.001) and PV (41 vs 59 ml, p<0.001) was smaller in CSPCa compared with patients without CSPCa (Table 1). However, the f/tPSA and PV increased with GS among CSPCa patients (Table 1). As the GS increased, the proportions for suspicious presence of PCa, SV1, and LNI by mpMRI examination also increased (Table 1).
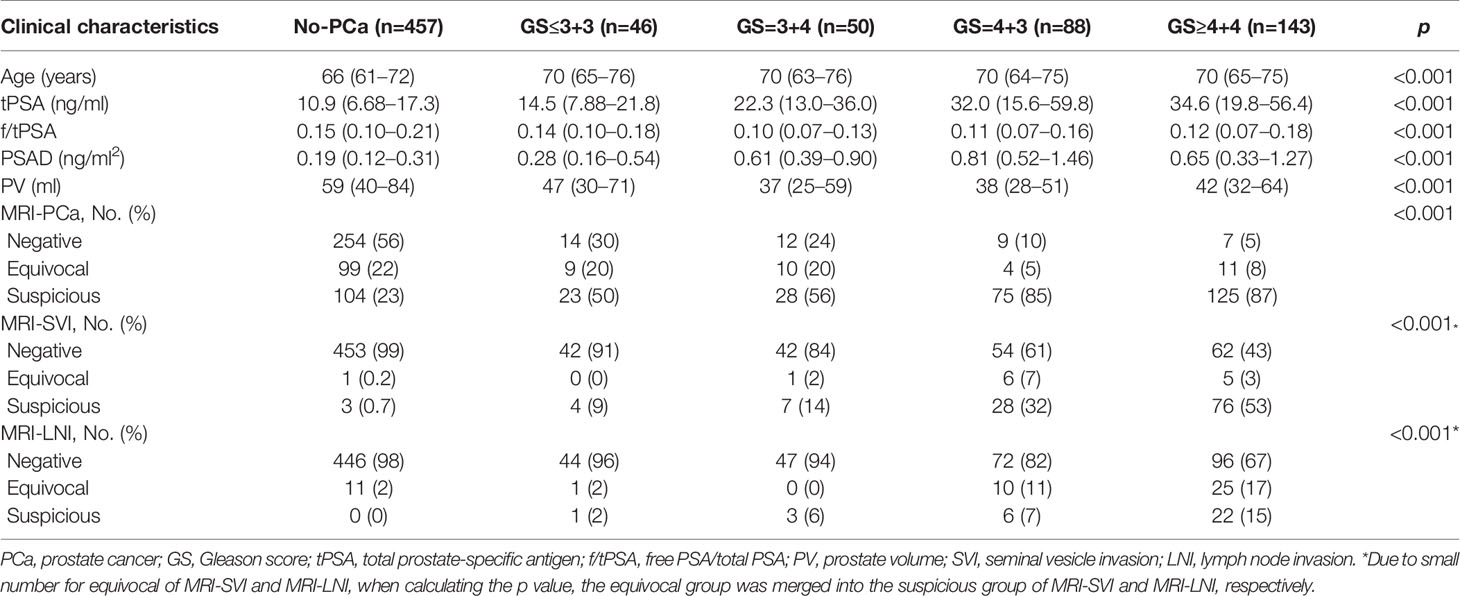
Table 1 The clinical characteristics of enrolled patients by Gleason score between April 2016 and March 2020.
Univariable Analysis of Clinical Parameters for Predicting PCa and CSPCa
In univariable logistic regression analysis, all clinical variables excepting f/tPSA were significant predictors for PCa and CSPCa (each p≤0.001, Table 2). Regarding PSA derivatives, the risk of PCa and CSPCa increased with tPSA (OR=1.05 for both PCa and CSPCa) and PSAD (OR=3.27 for PCa, and OR=19.6 for CSPCa). PSAD performed best in predicting PCa (AUC=0.79, 95% CI: 0.75–0.83) and CSPCa (AUC=0.79, 95% CI: 0.75–0.83) (Table 2). The risk of PCa (OR=0.99, 95% CI: 0.98–0.99) and CSPCa (OR=0.98, 95% CI: 0.98–0.99) was negatively associated with prostate volume, which displayed relatively low diagnostic accuracy in prediction of PCa (AUC=0.65, 95% CI: 0.61–0.70) and CSPCa (AUC=0.65, 95% CI: 0.61–0.70). Regarding mpMRI examination, MRI-PCa achieved the highest diagnostic accuracy in prediction of PCa (AUC=0.78, 95% CI: 0.74–0.82) and CSPCa (AUC=0.78, 95% CI: 0.74–0.82) (Table 2). The combination of PSA derivatives (AUC=0.88 for PCa, and AUC=0.90 for CSPCa) or mpMRI derivatives (AUC=0.84 for PCa, and AUC=0.86 for CSPCa) outperformed single derivatives in diagnostic of PCa and CSPCa (all p<0.05).
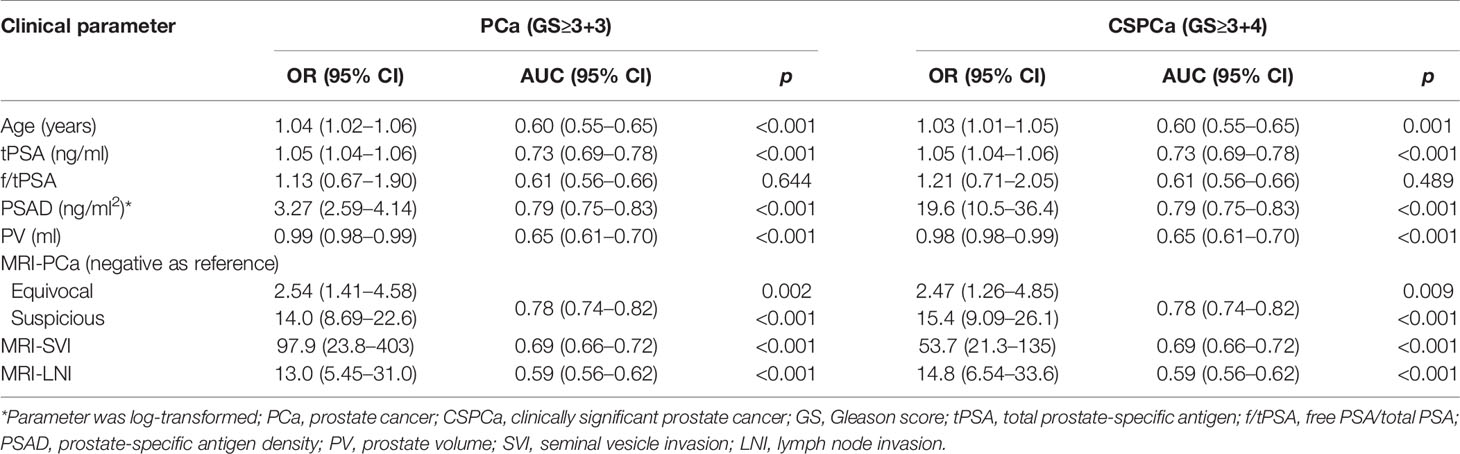
Table 2 Univariable regression analysis of clinical parameters to predict PCa and CSPCa.
Development of Multivariable Models Incorporating PSA Derivates, Prostate Volume, and mpMRI Parameters
In a stepwise multivariable analysis, age, tPSA, PV, MRI-PCa, and MRI-SVI reminded in the model for detection of PCa (each p≤0.001). The multivariable model for CSPCa was established including age (p=0.002), tPSA (p<0.001), PV (p<0.001), MRI-PCa (p<0.001), MRI-SVI (p<0.001), and MRI-LNI (p<0.001) (Table 3). The multivariable models for PCa (AUC=0.92, 95%CI: 0.88–0.96) and CSPCa (AUC=0.95, 95%CI: 0.92–0.97) were significantly higher than the combination of derivates for PSA (p=0.041 and 0.009 for PCa and CSPCa, respectively) or mpMRI examination (each p<0.001) in diagnostic accuracy (Figure 2). The calibration plots of predicated risk against observed PCa and CSPCa risk indicated excellent concordance in multivariable models (SSR=0.033 for PCa, and SSR=0.025 for CSPCa), followed by PSA derivatives (SSR=0.130 for PCa, and SSR=0.086 for CSPCa) and mpMRI derivatives (SSR=0.190 for PCa, and SSR=0.083 for CSPCa) (Figure 3).
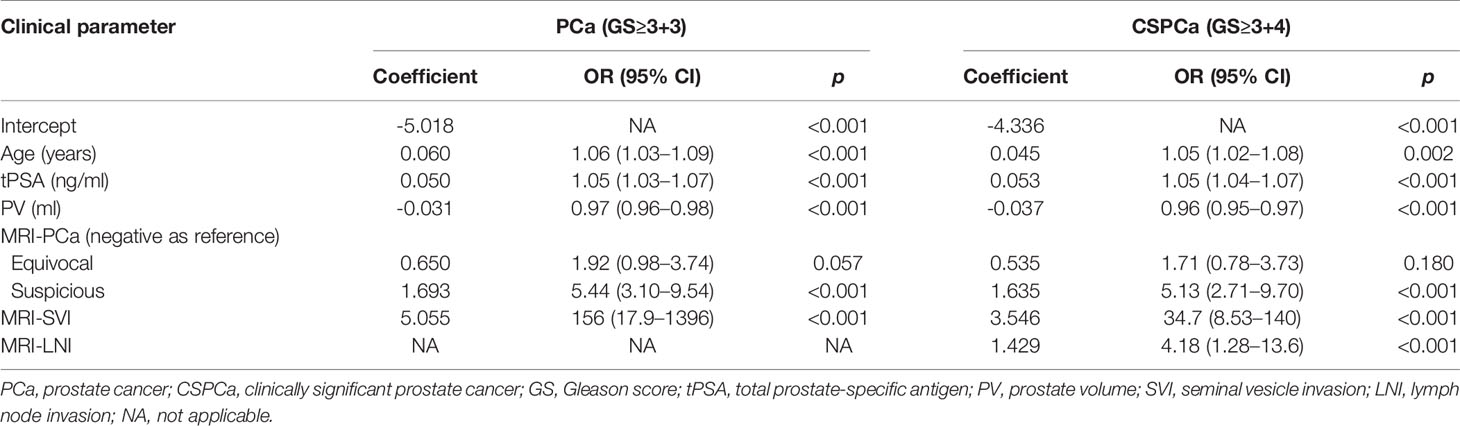
Table 3 Multivariable regression analysis of clinical parameters to predict PCa and CSPCa.
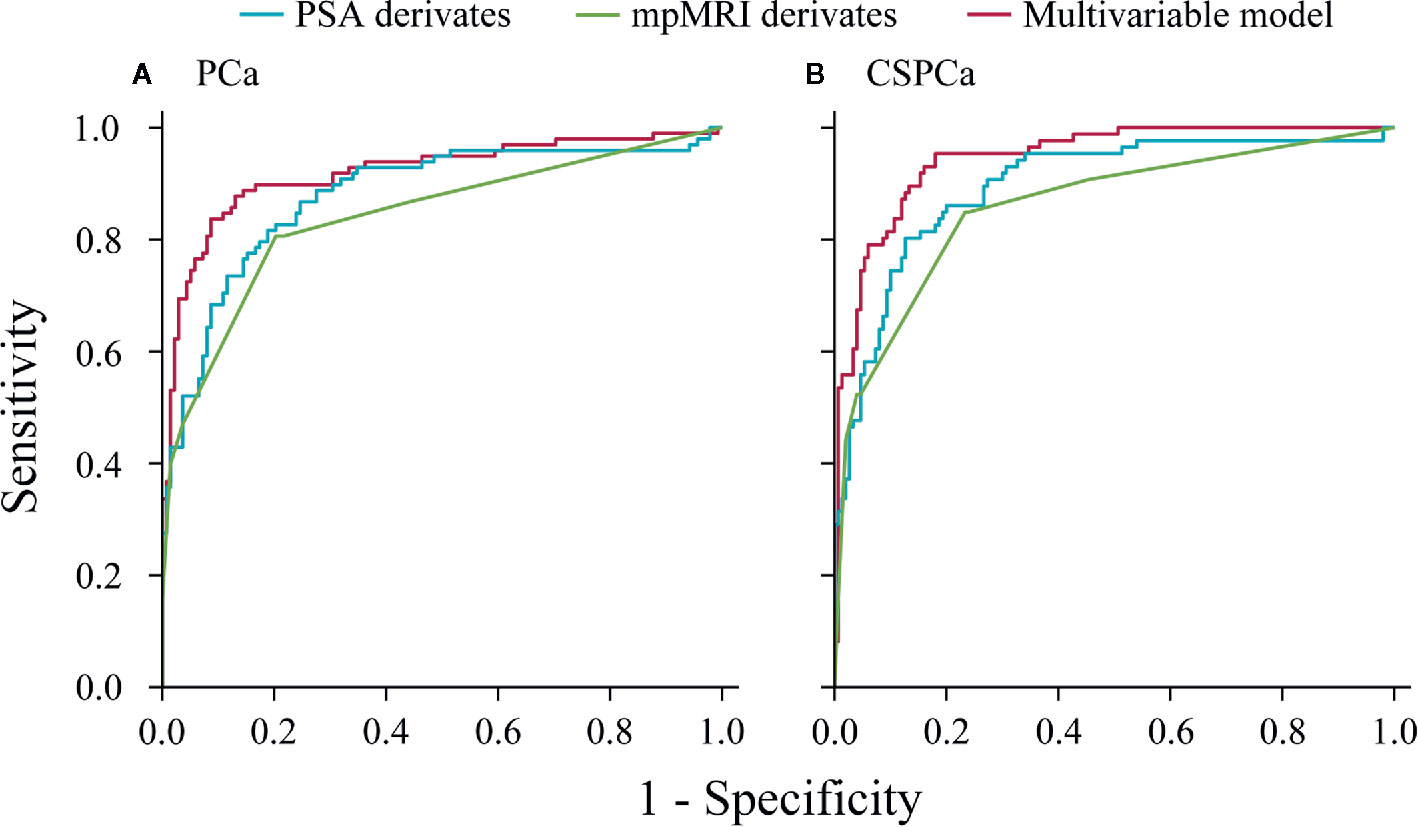
Figure 2 Receive operating characteristic curves of PSA derivatives, mpMRI derivatives, and multivariable models for predicting prostate cancer and clinically significant prostate cancer in the validation cohort. (A) PCa: Gleason score≥3+3, (B) CSPCa: Gleason score≥3+4.
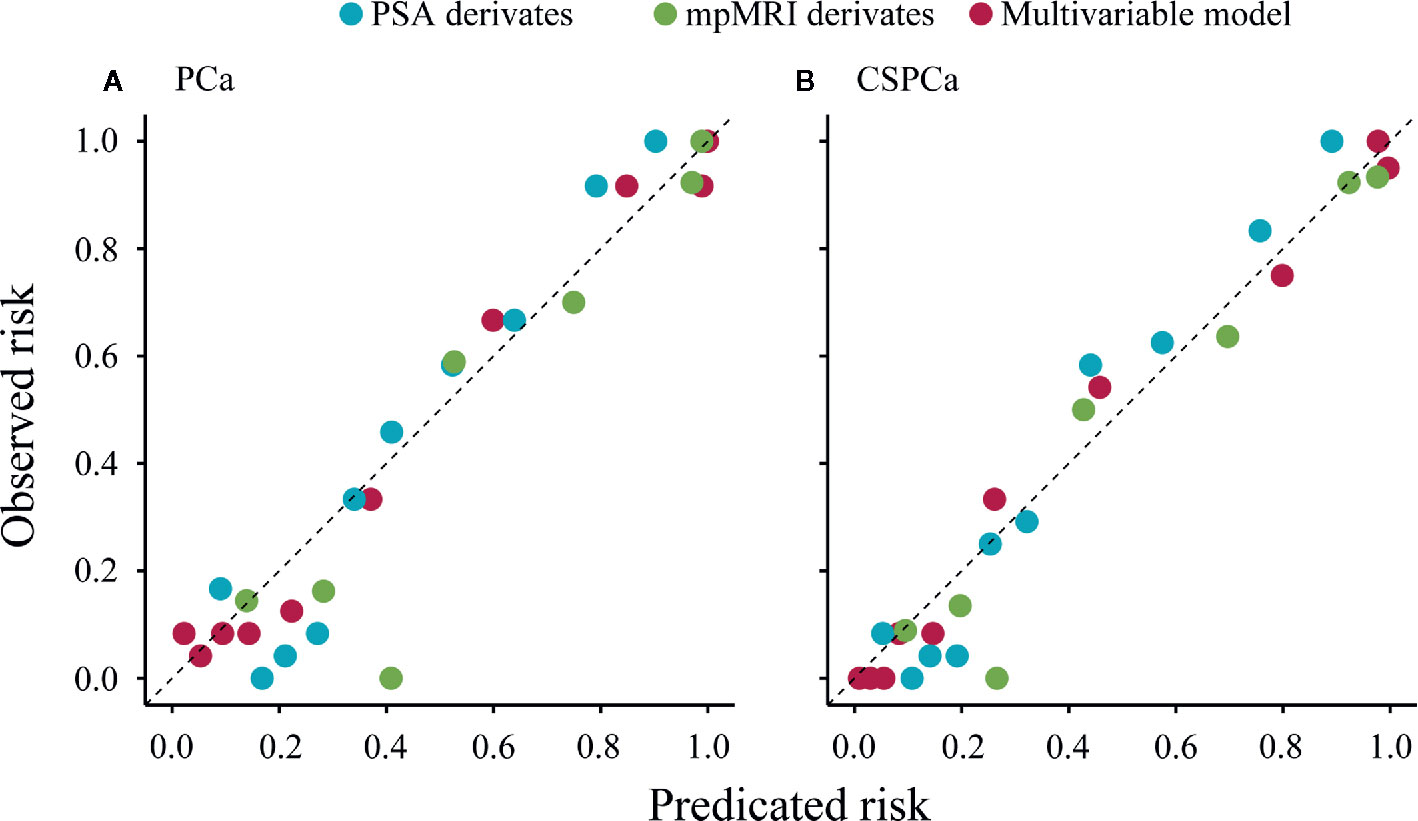
Figure 3 Calibration plot of observed vs predicted rick of prostate cancer and clinically significant prostate cancer using PSA derivatives, mpMRI derivatives, and multivariable models in the validation cohort. (A) PCa: Gleason score≥3+3, (B) CSPCa: Gleason score≥3+4.
Impact of Multivariable Model on Biopsies Averted and CSPCa Diagnosis Delayed
To further assess potential clinical benefit of the multivariable models, we performed DCA using the predicted risk in the validation cohort. It was observed that the multivariable model for PCa had the highest net benefit across the threshold probabilities above 10% (Figure 4A), and the CSPCa model had the highest clinical benefit across a range of relevant threshold probabilities, compared with the combination of PSA derivatives or mpMRI derivatives (Figure 4B). Clinical consequences of using various cut-offs for PSA derivatives, mpMRI derivatives, and multivariable models (compared with the strategy of biopsy all patients), including the number of biopsies that could be avoided and the number of PCa by GS that would be missed was displayed in Table 4. Using of a 30% cutoff for the PCa model would allow for sparing 124/236 (53%) of prostate biopsy, avoiding 114/138 (83%) of benign biopsies and reducing 6/12 (50%) of low-risk PCa diagnosis at the cost of delaying 4/86 (5%) of CSPCa (Table 4). At the same level of sensitivity as the PCa model to detect CSPCa, CSPCa model with a threshold of 20% could spare the number of biopsies by 126/236 (53%), avoid the number of benign biopsies by 116/138 (84%), and reduce the number of low-risk PCa diagnosis by 6/12 (50%) (Table 4).
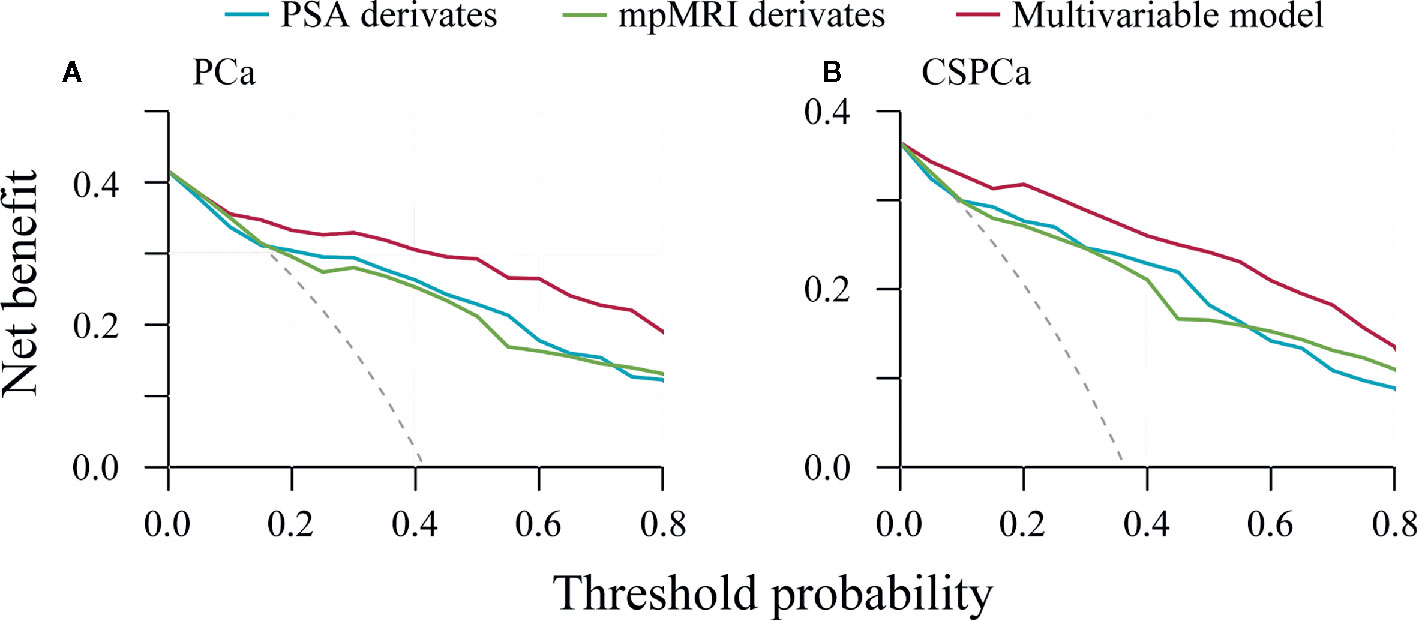
Figure 4 Decision curve analysis of PSA derivatives, mpMRI derivatives, and multivariable models for predicting prostate cancer and clinically significant prostate cancer in the validation cohort. (A) PCa: Gleason score≥3+3, (B) CSPCa: Gleason score≥3+4.
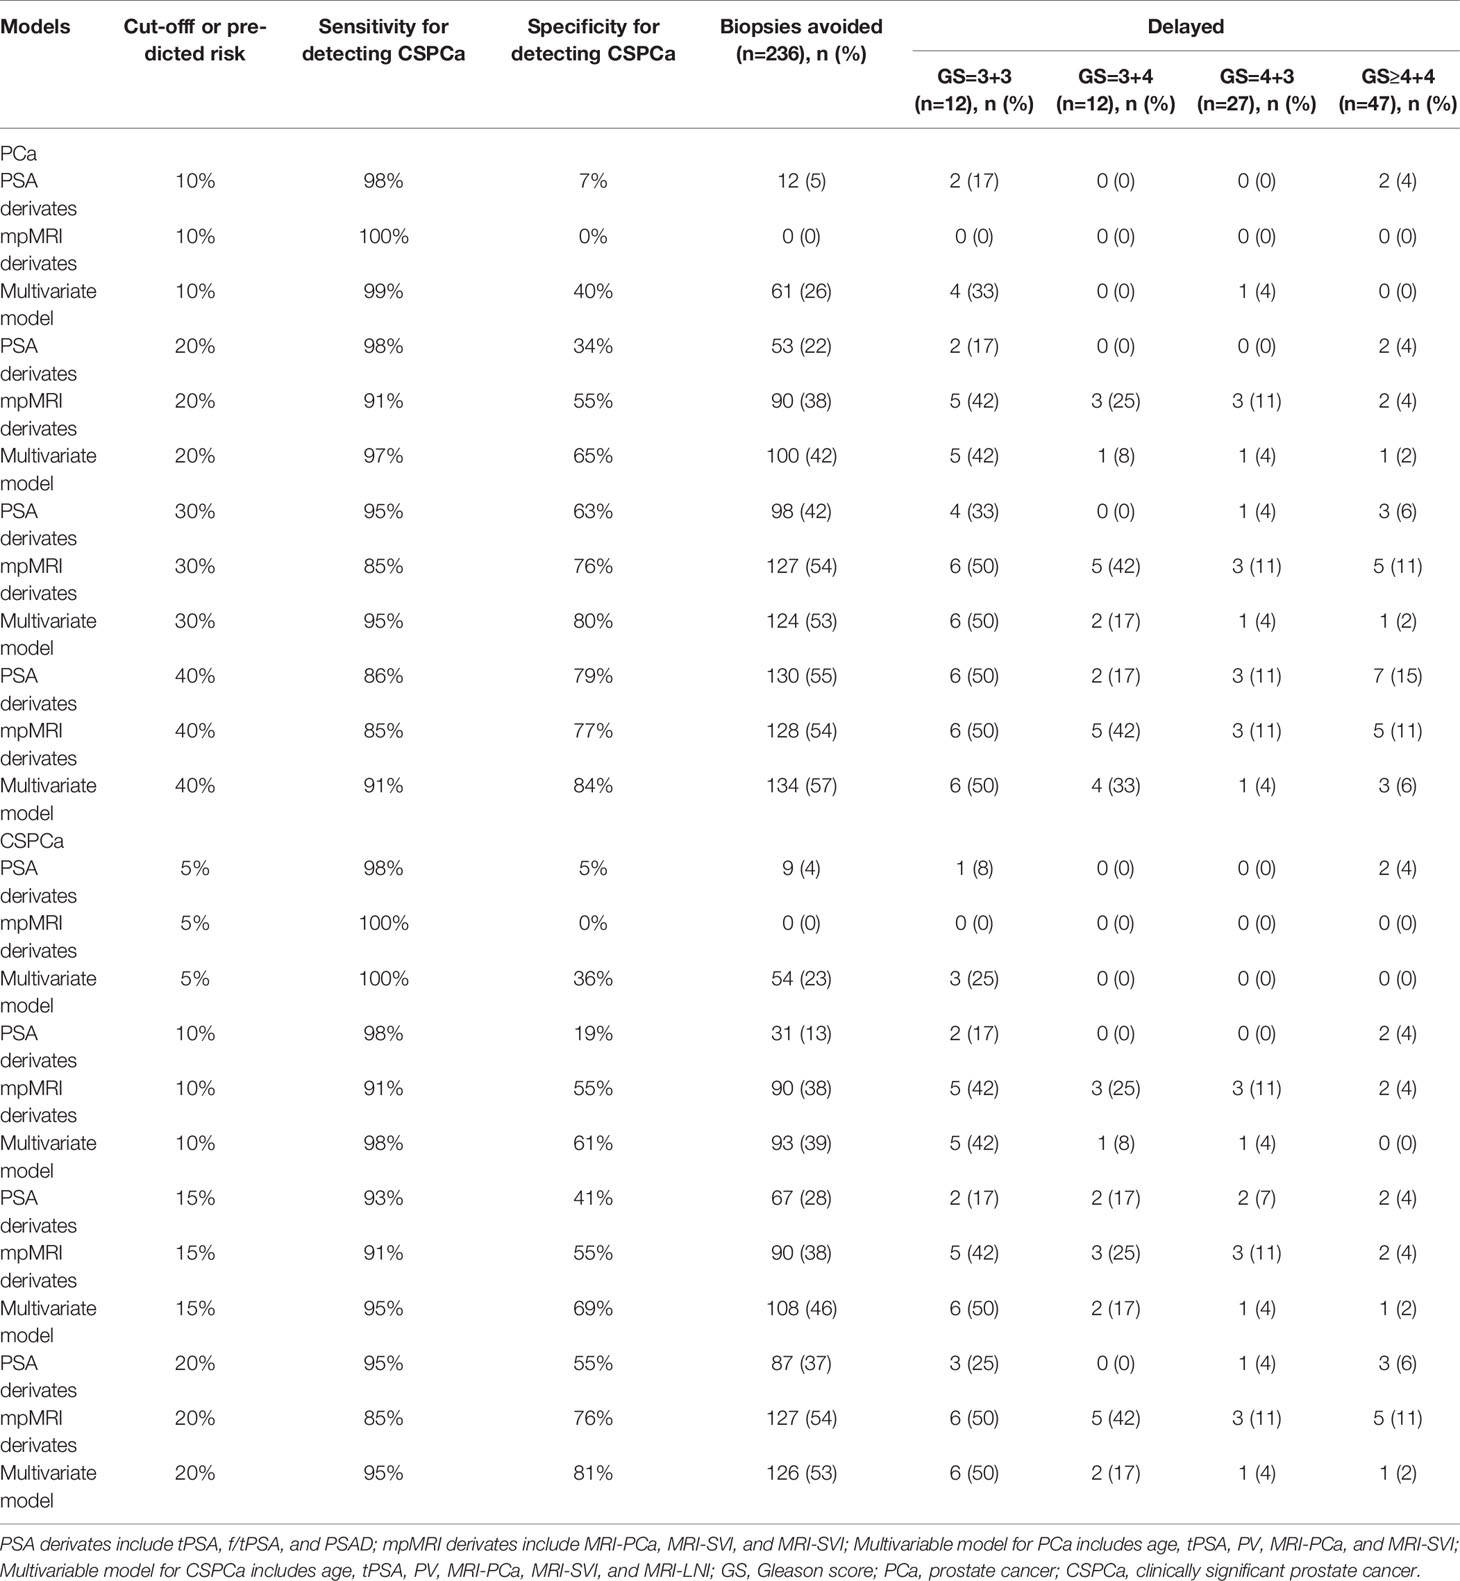
Table 4 Impact of using PSA derivates, mpMRI derivates, and multivariable model on biopsies avoided or delayed.
Discussion
In our study, we assessed the performance of age, PSA derivatives, PV, and mpMRI parameters in diagnostic of PCa and CSPCa. This study revealed that age, tPSA, PSAD, PV, MRI-PCa, MRI-SVI, and MRI-LNI were significant predictors for both PCa and CSPCa. Additionally, we developed multivariable models based on clinical parameters including mpMRI derivatives, which outperformed the combination of PSA or mpMRI derivatives in diagnostic of PCa and CSPCa. Use the multivariable PCa model with a cutoff of 30% or CSPCa model with a cutoff of 20% could spare the number of prostate biopsies by 53%, avoid the number of benign biopsies over 80%, and reduce the number of low-risk PCa diagnosis by 50%. Importantly, this can be achieved without compromising the ability to detection of CSPCa.
In this study, we analyzed the relationship between clinical characteristics and GS, and found the non-linear pattern between f/tPSA and PV, and GS. This may explain the inconsistent performance of f/tPSA in detecting of PCa (23, 24), and the relatively low diagnostic accuracy of PV in prediction of PCa and CSPCa (25). PSAD performed best in prediction of PCa and CSPCa among PSA derivates in our study. However, the stepwise multivariable models included tPSA and PV, rather than the PSAD. This may suggest that fitting independent variable individually rather than the PSAD was superior in constructing multivariable models (26). The DRE was excluded as a risk factor because of potential interobserver variability in its assessment (7).
The mpMRI improved the detection of CSPCa due to its anatomic detail, emerging accessibility, and addition of functional data. A growing body of literatures has validated the clinical utility of mpMRI in the detection and localization of CSPCa (16, 27, 28). In our study, the MRI-PCa also had the highest performance in PCa (AUC=0.78) and CSPCa (AUC=0.78) detection among mpMRI parameters. Additionally, we found that the combination of mpMRI parameters including MRI-PCa, MRI-SVI, and MRI-LNI could enhance the diagnostic accuracy in prediction of PCa (AUC=0.84) and CSPCa (AUC=0.86) compared with single mpMRI parameter. Moreover, mpMRI radiomics features significantly associated with PCa aggressiveness on the histopathological and genomics levels (29, 30). And mpMRI parameters including MRI-extracapsular extension (ECE), -SVI, -LNI had been recognized as significant predictors of LNI (20). These may suggest that addition of objective mpMRI parameters could increase the performance, and reduce the inter-reader (31) and inter-center variability (32) of PI-RADS v2 for PCa and CSPCa diagnosis.
Furthermore, we developed multivariable models, which outperformed PSA and mpMRI derivatives in prediction of PCa and CSPCa. Using a PCa risk threshold of 30% or CSPCa risk threshold of 20% would spare 53% of prostate biopsies and avoid over 80% of benign biopsies at the cost of missing 5% of CSPCa. Although cross-study comparisons are challenging, the multivariable models based on clinical parameters performed better than Huashan risk calculators (AUC=0.85 and 0.86 for PCa and CSPCa, respectively) (13), CRCC-PC (AUC=0.80 and 0.83 for PCa and CSPCa, respectively) (15) and MRI-ERSPC-RC (AUC=0.85 for CSPCa) (6). However, our results compared unfavorably to those Risk calculators incorporating novel markers, including 4Kscore-ERSPC (reduced biopsies by 66% at the cost of missing 2% of CSPCa) (33), PCA3-based nomogram (reduced biopsies by 55% at the cost of missing 2% of CSPCa) (8), and MiPS-PCPT RC (reduced biopsies by 47% at the cost of missing 2% of CSPCa) (34). These differences further demonstrate that the novel molecular biomarkers add value in detection of PCa and CSPCa. In the future, the multivariable models combining molecular biomarkers, mpMRI parameters, and clinical parameters should be developed to better identify PCa and CSPCa, and avoid unnecessary prostate biopsy and overtreatment. Overall, our study provided basis for developing the model based on clinical parameter including mpMRI parameters to diagnosis PCa and CSPCa among Chinese population.
Our study was subject to several limitations. First, this study was a single center study and limited by the inherent drawbacks of its retrospective design. Second, the PI-RADS v2 scores were not used in our study and no central review of mpMRI examination was present. However, the combination of mpMRI parameters including MRI-PCa, -SVI, and -LNI performed similar with PI-RADS v2 in diagnostic of PCa (AUC=0.84 vs 0.83–0.86) (35, 36), and CSPCa (AUC=0.86 vs 0.87–0.91) (35, 37). Third, we acknowledge that the inclusion of new biomarkers, for example, prostate cancer susceptibility loci, 4K score, prostate cancer gene 3, and other genomic markers may strengthen our diagnostic models and may be considered for future studies. However, the advantage of our model is its simplicity and cheapness, which could facilitate its implementation in clinical practice.
Conclusions
Our study found the non-linear pattern between f/tPSA and PV, and GS, and demonstrated that age, tPSA, PSAD, PV, and mpMRI parameters were significant predictors for both PCa and CSPCa. The multivariable model for PCa with a 30% cutoff or the CSPCa model with a 20% cutoff, could spare the number of unnecessary biopsies by 53%, avoid the number of benign biopsies over 80%, and reduce the number of low-risk PCa diagnosis by 50%, while missing only a minimal number (5%) of CSPCa. Further prospective validation is required.
Data Availability Statement
The raw data supporting the conclusions of this article will be made available by the authors, without undue reservation.
Ethics Statement
The studies involving human participants were reviewed and approved by Ethics Review Committee of life sciences, Zhengzhou University. Written informed consent for participation was not required for this study in accordance with the national legislation and the institutional requirements.
Author Contributions
XZ and SY conceptualized, designed, and supervised the study. GH, SY, JT, YS, JL, BD, YF, ZL, and AZ coordinated and participated data collection. SY and YS carried out the statistical analysis and drafted the manuscript. XZ and JT provided guidance on data analysis. XZ and YS revised the manuscript. All authors contributed to the article and approved the submitted version.
Funding
This work was supported by grants from the Henan Medical Science and Technology Project [grant no. LHGJ20190181] and the Henan Science and Technology Project [grant No. 162102310204].
Conflict of Interest
The authors declare that the research was conducted in the absence of any commercial or financial relationships that could be construed as a potential conflict of interest.
Supplementary Material
The Supplementary Material for this article can be found online at: https://www.frontiersin.org/articles/10.3389/fonc.2020.575261/full#supplementary-material
References
1. Torre LA, Bray F, Siegel RL, Ferlay J, Lortet-Tieulent J, Jemal A. Global cancer statistics, 2012. CA Cancer J Clin (2015) 65(2):87–108. doi: 10.3322/caac.21262
2. International Agency for Research on Cancer. GLOBAL CANCER OBSERVATORY. (2018). Available at : http://gco.iarc.fr/ [Accessed July 15, 2020].
3. Ye D, Zhu Y. Epidemiology of prostate cancer in China: an overview and clinical implication. Zhonghua wai ke za zhi [Chinese J surgery] (2015) 53(4):249–52. doi: 10.3760/cma.j.issn.0529-5815.2015.04.003
4. Xia J, Gulati R, Au M, Gore JL, Lin DW, Etzioni R. Effects of screening on radical prostatectomy efficacy: the prostate cancer intervention versus observation trial. J Natl Cancer Institute (2013) 105(8):546–50. doi: 10.1093/jnci/djt017
5. Center MM, Jemal A, Lortet-Tieulent J, Ward E, Ferlay J, Brawley O, et al. International variation in prostate cancer incidence and mortality rates. Eur Urol (2012) 61(6):1079–92. doi: 10.1016/j.eururo.2012.02.054
6. Alberts AR, Roobol MJ, Verbeek JFM, Schoots IG, Chiu PK, Osses DF, et al. Prediction of High-grade Prostate Cancer Following Multiparametric Magnetic Resonance Imaging: Improving the Rotterdam European Randomized Study of Screening for Prostate Cancer Risk Calculators. Eur Urol (2019) 75(2):310–8. doi: 10.1016/j.eururo.2018.07.031
7. Van Neste L, Hendriks RJ, Dijkstra S, Trooskens G, Cornel EB, Jannink SA, et al. Detection of High-grade Prostate Cancer Using a Urinary Molecular Biomarker-Based Risk Score. Eur Urol (2016) 70(5):740–8. doi: 10.1016/j.eururo.2016.04.012
8. Hansen J, Auprich M, Ahyai SA, de la Taille A, van Poppel H, Marberger M, et al. Initial prostate biopsy: development and internal validation of a biopsy-specific nomogram based on the prostate cancer antigen 3 assay. Eur Urol (2013) 63(2):201–9. doi: 10.1016/j.eururo.2012.07.030
9. Cormio L, Cindolo L, Troiano F, Marchioni M, Di Fino G, Mancini V, et al. Development and Internal Validation of Novel Nomograms Based on Benign Prostatic Obstruction-Related Parameters to Predict the Risk of Prostate Cancer at First Prostate Biopsy. Front Oncol (2018) 8:438. doi: 10.3389/fonc.2018.00438
10. Zhu Y, Wang J-Y, Shen Y-J, Dai B, Ma C-G, Xiao W-J, et al. External validation of the Prostate Cancer Prevention Trial and the European Randomized Study of Screening for Prostate Cancer risk calculators in a Chinese cohort. Asian J Androl (2012) 14(5):738–44. doi: 10.1038/aja.2012.28
11. Yoon DK, Park JY, Yoon S, Park MS, Moon DG, Lee JG, et al. Can the prostate risk calculator based on Western population be applied to Asian population? Prostate (2012) 72(7):721–9. doi: 10.1002/pros.21475
12. Tang P, Chen H, Uhlman M, Lin Y-R, Deng X-R, Wang B, et al. A nomogram based on age, prostate-specific antigen level, prostate volume and digital rectal examination for predicting risk of prostate cancer. Asian J Androl (2013) 15(1):129–33. doi: 10.1038/aja.2012.111
13. Wu Y-S, Zhang N, Liu S-H, Xu J-F, Tong S-J, Cai Y-H, et al. The Huashan risk calculators performed better in prediction of prostate cancer in Chinese population: a training study followed by a validation study. Asian J Androl (2016) 18(6):925–9. doi: 10.4103/1008-682X.181192
14. Huang Y, Cheng G, Liu B, Shao P, Qin C, Li J, et al. A prostate biopsy strategy based on a new clinical nomogram reduces the number of biopsy cores required in high-risk patients. BMC Urol (2014) 14:8–. doi: 10.1186/1471-2490-14-8
15. Chen R, Xie L, Xue W, Ye Z, Ma L, Gao X, et al. Development and external multicenter validation of Chinese Prostate Cancer Consortium prostate cancer risk calculator for initial prostate biopsy. Urol Oncol (2016) 34(9):416.e1–.e4167. doi: 10.1016/j.urolonc.2016.04.004
16. Bratan F, Niaf E, Melodelima C, Chesnais AL, Souchon R, Mege-Lechevallier F, et al. Influence of imaging and histological factors on prostate cancer detection and localisation on multiparametric MRI: a prospective study. Eur Radiol (2013) 23(7):2019–29. doi: 10.1007/s00330-013-2795-0
17. Falagario UG, Ratnani P, Lantz A, Jambor I, Dovey Z, Verma A, et al. Staging Accuracy of Multiparametric Magnetic Resonance Imaging in Caucasian and African American Men Undergoing Radical Prostatectomy. J Urol (2020) 204(1):82–90. doi: 10.1097/ju.0000000000000774
18. Christie DRH, Sharpley CF. How Accurately Can Prostate Gland Imaging Measure the Prostate Gland Volume? Results of a Systematic Review. Prostatic Dis (2019) 2019:6932572. doi: 10.1155/2019/6932572
19. Weinreb JC, Barentsz JO, Choyke PL, Cornud F, Haider MA, Macura KJ, et al. PI-RADS Prostate Imaging - Reporting and Data System: 2015, Version 2. Eur Urol (2016) 69(1):16–40. doi: 10.1016/j.eururo.2015.08.052
20. Hou Y, Bao M-L, Wu C-J, Zhang J, Zhang Y-D, Shi H-B. A machine learning-assisted decision-support model to better identify patients with prostate cancer requiring an extended pelvic lymph node dissection. BJU Int (2019) 124(6):972–83. doi: 10.1111/bju.14892
21. Liu J, Dong B, Qu W, Wang J, Xu Y, Yu S, et al. Using clinical parameters to predict prostate cancer and reduce the unnecessary biopsy among patients with PSA in the gray zone. Sci Rep (2020) 10(1):5157. doi: 10.1038/s41598-020-62015-w
22. Vickers AJ, Elkin EB. Decision curve analysis: a novel method for evaluating prediction models. Med Decis Making (2006) 26(6):565–74. doi: 10.1177/0272989X06295361
23. Bachour DM, Chahin E, Al-Fahoum S. Human Kallikrein-2, Prostate Specific Antigen and Free- Prostate Specific Antigen in Combination to Discriminate Prostate Cancer from Benign Diseases in Syrian Patients. Asian Pacific J Cancer Prev APJCP (2015) 16(16):7085–8. doi: 10.7314/apjcp.2015.16.16.7085
24. Huang Y, Li ZZ, Huang YL, Song HJ, Wang YJ. Value of free/total prostate-specific antigen (f/t PSA) ratios for prostate cancer detection in patients with total serum prostate-specific antigen between 4 and 10 ng/mL: A meta-analysis. Medicine (2018) 97(13):e0249. doi: 10.1097/md.0000000000010249
25. Liu C, Liu SL, Wang ZX, Yu K, Feng CX, Ke Z, et al. Using the prostate imaging reporting and data system version 2 (PI-RIDS v2) to detect prostate cancer can prevent unnecessary biopsies and invasive treatment. Asian J Androl (2018) 20(5):459–64. doi: 10.4103/aja.aja_19_18
26. Kawakami S, Numao N, Okubo Y, Koga F, Yamamoto S, Saito K, et al. Development, validation, and head-to-head comparison of logistic regression-based nomograms and artificial neural network models predicting prostate cancer on initial extended biopsy. Eur Urol (2008) 54(3):601–11. doi: 10.1016/j.eururo.2008.01.017
27. Falagario UG, Martini A, Wajswol E, Treacy PJ, Ratnani P, Jambor I, et al. Avoiding Unnecessary Magnetic Resonance Imaging (MRI) and Biopsies: Negative and Positive Predictive Value of MRI According to Prostate-specific Antigen Density, 4Kscore and Risk Calculators. Eur Urol Oncol (2019) 3(5):700–4. doi: 10.1016/j.euo.2019.08.015
28. Falagario U, Jambor I, Taimen P, Syvänen KT, Kähkönen E, Merisaari H, et al. Added value of systematic biopsy in men with a clinical suspicion of prostate cancer undergoing biparametric MRI-targeted biopsy: multi-institutional external validation study. World J Urol (2020). doi: 10.1007/s00345-020-03393-8
29. Hectors SJ, Cherny M, Yadav KK, Beksaç AT, Thulasidass H, Lewis S, et al. Radiomics Features Measured with Multiparametric Magnetic Resonance Imaging Predict Prostate Cancer Aggressiveness. J Urol (2019) 202(3):498–505. doi: 10.1097/JU.0000000000000272
30. Chaddad A, Niazi T, Probst S, Bladou F, Anidjar M, Bahoric B. Predicting Gleason Score of Prostate Cancer Patients Using Radiomic Analysis. Front Oncol (2018) 8:630:630. doi: 10.3389/fonc.2018.00630
31. Wajswol E, Winoker JS, Anastos H, Falagario U, Okhawere K, Martini A, et al. A cohort of transperineal electromagnetically tracked magnetic resonance imaging/ultrasonography fusion-guided biopsy: assessing the impact of inter-reader variability on cancer detection. BJU Int (2020) 125(4):531–40. doi: 10.1111/bju.14957
32. Jambor I, Falagario U. Does prostate magnetic resonance imaging (MRI) reporting system affect performance of MRI in men with a clinical suspicion of prostate cancer? BJU Int (2020) 125(1):4–5. doi: 10.1111/bju.14960
33. Verbeek JFM, Bangma CH, Kweldam CF, van der Kwast TH, Kümmerlin IP, van Leenders G, et al. Reducing unnecessary biopsies while detecting clinically significant prostate cancer including cribriform growth with the ERSPC Rotterdam risk calculator and 4Kscore. Urol Oncol (2019) 37(2):138–44. doi: 10.1016/j.urolonc.2018.11.021
34. Tomlins SA, Day JR, Lonigro RJ, Hovelson DH, Siddiqui J, Kunju LP, et al. Urine TMPRSS2:ERG Plus PCA3 for Individualized Prostate Cancer Risk Assessment. Eur Urol (2016) 70(1):45–53. doi: 10.1016/j.eururo.2015.04.039
35. Kasel-Seibert M, Lehmann T, Aschenbach R, Guettler FV, Abubrig M, Grimm MO, et al. Assessment of PI-RADS v2 for the Detection of Prostate Cancer. Eur J Radiol (2016) 85(4):726–31. doi: 10.1016/j.ejrad.2016.01.011
36. Washino S, Okochi T, Saito K, Konishi T, Hirai M, Kobayashi Y, et al. Combination of prostate imaging reporting and data system (PI-RADS) score and prostate-specific antigen (PSA) density predicts biopsy outcome in prostate biopsy naïve patients. BJU Int (2017) 119(2):225–33. doi: 10.1111/bju.13465
Keywords: prostate cancer, prostate-specific antigen, prostate volume, multiparametric magnetic resonance imaging, prostate biopsy
Citation: Yu S, Hong G, Tao J, Shen Y, Liu J, Dong B, Fan Y, Li Z, Zhu A and Zhang X (2020) Multivariable Models Incorporating Multiparametric Magnetic Resonance Imaging Efficiently Predict Results of Prostate Biopsy and Reduce Unnecessary Biopsy. Front. Oncol. 10:575261. doi: 10.3389/fonc.2020.575261
Received: 13 July 2020; Accepted: 14 October 2020;
Published: 11 November 2020.
Edited by:
Pilar López-Larrubia, Consejo Superior de Investigaciones Científicas (CSIC), SpainReviewed by:
Ugo Giovanni Falagario, University of Foggia, ItalyYao Fu, Nanjing Drum Tower Hospital, China
Copyright © 2020 Yu, Hong, Tao, Shen, Liu, Dong, Fan, Li, Zhu and Zhang. This is an open-access article distributed under the terms of the Creative Commons Attribution License (CC BY). The use, distribution or reproduction in other forums is permitted, provided the original author(s) and the copyright owner(s) are credited and that the original publication in this journal is cited, in accordance with accepted academic practice. No use, distribution or reproduction is permitted which does not comply with these terms.
*Correspondence: Xuepei Zhang, emhhbmd4dWVwZWlAMjYzLm5ldA==
†These authors have contributed equally to this work