 Gašper Grubelnik
 Emanuela Boštjančič1
 Nina Zidar
- 1Institute of Pathology, Faculty of Medicine, University of Ljubljana, Ljubljana, Slovenia
- 2Department of Otorhinolaryngology and Cervicofacial Surgery, University Medical Centre Ljubljana, Ljubljana, Slovenia
- 3Faculty of Medicine, University of Ljubljana, Ljubljana, Slovenia
- 4Department of Maxillofacial and Oral Surgery, University Medical Centre Ljubljana, Ljubljana, Slovenia
NANOG is a stem cell transcription factor that is believed to play an important role in the development of oral squamous cell carcinoma (OSCC), but there is limited data regarding the role of long non-coding RNAs (lncRNAs) and microRNAs (miRNAs) in the regulation of NANOG expression. We therefore analyzed expression of NANOG, NANOG-regulating miRNAs and lncRNAs in OSCC cancerogenesis, using oral biopsy samples from 66 patients including normal mucosa, dysplasia, and OSCC. Expression analysis of NANOG, miR-34a, miR-145, RoR, SNHG1, AB209630, and TP53 was performed using qPCR and immunohistochemistry for NANOG protein detection. NANOG protein showed no staining in normal mucosa, very weak in low-grade dysplasia, and strong staining in high-grade dysplasia and OSCC. NANOG, miR-145, RoR, and SNHG1 showed up-regulation, TP53 and miR-34a showed down-regulation, and AB209630 showed variable expression during cancerogenesis. NANOG mRNA was up-regulated early in cancerogenesis, before strong protein expression can be detected. NANOG was in correlation with miR-145 and RoR. Our results suggest that miRNAs and lncRNAs, particularly miR-145 and RoR, might be important post-transcription regulatory mechanisms of NANOG in OSCC cancerogenesis. Furthermore, NANOG protein detection has a diagnostic potential for oral high-grade dysplasia, distinguishing it from low-grade dysplasia and non-neoplastic reactive lesions.
Introduction
Oral squamous cell carcinoma (OSCC) is associated with significant morbidity and mortality despite progress in our understanding of its etiology and pathogenesis and despite the introduction of novel treatment modalities. In 2018, OSCC accounted for more than 350,000 new diagnoses and 175,000 deaths worldwide (1–3). It is therefore necessary to discover new prognostic and predictive biomarkers. Better insight into the molecular pathogenesis of OSCC might reveal new targets for early diagnosis and the development of new therapeutic approaches (4–7).
OSCC is the result of a lengthy, highly complex multistep process, including various genetic alterations that modify signaling and also result in an altered expression of transcription factors. Morphologically, it usually develops from normal epithelium via hyperplasia and dysplasia to carcinoma (4–6, 8). The molecular background of cancerogenesis based on DNA and mRNA levels has been traditionally the main focus of cancer research and is now generally accepted. However, the discovery of non-coding RNAs (ncRNAs), including microRNAs (miRNAs) and long non-coding RNAs (lncRNAs), has contributed significantly to a better understanding of various physiologic and pathologic processes, including cancer. These ncRNAs regulate gene expression by various mechanisms, even though they do not encode proteins and are usually uniquely expressed in specific cell types and tissues.
The important difference between miRNAs and lncRNAs is their size, ranging between 20 and 26 nucleotides for miRNAs and 200 or more nucleotides for lncRNAs. In contrast to mRNAs, miRNAs are never capped and polyadenylated, while lncRNAs may resemble either miRNAs or mRNAs. ncRNA-mediated gene silencing executed through translational inhibition is an important biological process for cellular homeostasis in the human body. Numerous miRNAs have been shown to be significantly expressed in various cancers, including OSCC, acting as tumor suppressors and/or oncogenes. However, there is limited information about lncRNAs in OSCC and their function as sponges for expressed miRNAs (7, 9–13).
NANOG is a stem cell transcription factor, involved in the development of various human cancers including OSCC. The majority of published studies have focused on protein expression and have shown promising results, suggesting that NANOG should be considered as a diagnostic and prognostic marker of oral precancerosis and OSCC (8, 14–16). However, there is limited information regarding NANOG regulation by lncRNAs and miRNAs in OSCC development.
We therefore analyzed the expression of NANOG in oral precancerosis and OSCC in comparison to normal oral mucosa. We also analyzed ncRNAs that presumably regulate NANOG. First, we selected 13 miRNAs that could target NANOG in different cell lines using online databases TarBase v.8 (17) and miRTarBase (18), with inclusion criteria based on validation method. Next, we used literature search for selection of lncRNAs, which are experimentally validated that either sponge selected miRNAs or directly or indirectly influence NANOG expression (19–21). Based on the expression accuracy, we chose two miRNAs for further analysis, i.e., miR-34a and miR-145, and three lncRNAs, ROR, SNGH1, and AB209630 (7, 10, 12, 13), to reveal whether their expression supports the dynamics of the observed patterns of NANOG expression in OSCC cancerogenesis.
Materials and Methods
Patients
Our study included oral biopsy samples from 66 patients with normal mucosa, dysplasia or OSCC. Among them, 36 patients underwent surgical excision due to dysplasia, 15 patients had surgical resection due to OSCC, and in 15 patients, surgical excision was performed due to non-neoplastic lesions and served as a control group consisting of normal oral mucosa.
After surgical procedure, samples were fixed in formalin and after 24 h, embedded in paraffin (FFPE). Samples were cut at 4 µm, stained with hematoxylin and eosin (HE), and analyzed according to standard procedures.
For the purpose of our study, all biopsy samples were reviewed again, and representative samples with corresponding paraffin blocks were selected for our study. In all, slides were cut for immunohistochemical analysis of NANOG expression. After that, representative areas on HE slides were chosen and marked by ink for punching with a needle. Representative areas in patients with dysplasia comprised of LG-dysplasia and HG-dysplasia. In patients with OSCC, areas of OSCC and in the adjacent mucosa, areas of the least atypical mucosa were marked for further analysis. The areas of the least atypical mucosa showed only minor abnormalities which were consistent with LG-dysplasia. In the control group, areas of mucosa with no abnormalities were marked. Biopsy samples were divided into three groups:
Group 1 included 72 tissue samples from 36 patients with dysplasia. In each patient, two samples were included for analysis—one with LG-dysplasia and one with HG-dysplasia. 22 were males and 14 females, aged 43 to 85 years (64.47 ± 9.78). Dysplasia was located in the tongue (10 patients), floor of the mouth (13 patients), buccal mucosa (three patients), alveolar ridge (three patients), pharynx (two patients), hard palate (one patient), lip (one patient), retromolar trigonum (one patient), soft palate (one patient), and uvula (one patient).
Group 2 included 30 tissue samples from 15 patients with OSCC. In each patient, two samples were included for analysis—one with OSCC and one with LG-dysplasia (LG-dysplasia adjacent to OSCC). Nine patients had no lymph node metastases (pT1 or T2N0M0) and six patients had lymph node metastases (pT3 or T4N+M0) according to the TNM classification; 14 were males and one female, aged 37 to 74 years (60.65 ± 8.86). OSCCs were located in the tongue (eight patients), floor of the mouth (six patients) and alveolar ridge (one patient).
Group 3 included 15 biopsy samples from 15 patients with histologically normal mucosa; four were males and 11 females, aged 35 to 86 years (60.67 ± 14.89). Samples were from the buccal mucosa (six patients), lip (five patients), tongue (three patients) and retromolar trigonum (one patient).
The study was performed in accordance with the ethical guidelines for human research with no publication of identifying information or images in the manuscript and approved by the National Medical Ethics Committee, Ministry of Health, Republic of Slovenia (No 0120-106/2018/6).
Immunohistochemical Detection of NANOG
Commercially available anti-NANOG antibody (Cell Signaling, cat no. 4903, dilution 1:200) (Merck, Kenilworth, New Jersey, USA) was used for immunohistochemistry. Automated antigen retrieval and staining (BenchMark ULTRA, Ventana, Tuscon, AZ, USA) were performed on unstained 4 µm thick slides cut from FFPE tissue blocks. Visualization of reaction was provided by peroxidase and 3,3′-diaminobenzidine incubation (OptiVIEW DAB Detection Kit, Roche, Basel, Switzerland) and after counterstaining with hematoxylin. Every run of the samples included a positive control (testicular seminoma) and negative controls omitting the primary antibody binding.
Using semi-quantitative approach, we evaluated the extent of staining (negative—score 0, below 25%—score 1, between 25 and 50%—score 2, between 50 and 75%—score 3 and above 75%—score 4). We also evaluated the intensity of staining (negative—score 0, weak—score 1, moderate—score 2, strong—score 3) and staining pattern (nuclear, cytoplasmic staining or both). We calculated the combined immunohistochemical score by multiplying the intensity and the extent scores.
Selection of miRNAs and lncRNAs
Using online databases TarBase v.8 (17) and miRTarBase (18), we first selected 13 miRNAs that could target NANOG in different cell lines. The inclusion criteria were based on validation method. TarBase includes low- and high-throughput methods with western blot, qPCR and reporter assay being low-throughput and microarray being high-throughput. Similarly, miRTarBase distinguishes between strong evidence methods: reporter assay, western blot and qPCR and less strong validation method as are microarray, next-generation sequencing (NGS) and pSILAC. After miRNA qPCR validation described below (sections Reverse Transcription and qPCR for miRNAs), we selected miRNAs with a specific PCR product and stable expression in our samples and with low-throughput validation method in Tarbase v.8 and strong validation method in miRTarBase.
miRNA qPCR validation started by pooling samples from the same type of samples together (normal mucosa, low-grade dysplasia, high-grade dysplasia, mucosa adjacent to OSCC and OSCC) producing five pools. Next, after performing reverse transcription (RT) of pooled samples, we tested whether there is detectable expression before cycle 35, what is the efficiency of amplification and specificity. The last was obtained using melting curve that is performed after amplification using SybrGreen resulting in melting temperature specific for each amplified miRNA. It is usually lower than that for mRNAs due to short amplicons and higher than that of primer-dimers.
Analyzing samples regarding stable expression, the values should be first close among replicates and within the groups of the same sample types. For each sample, the melting curve confirmed the amplification of specific product. The sample that did not show specific PCR product was omitted from further analysis. The same approach was used for miRNAs among analyzed pools of samples.
Thus, only miR-34a and miR-145 satisfy all the criteria. The results are summarized in Table S1.
We used literature search for selection of lncRNAs, which are experimentally validated that either sponge selected miRNAs or directly or indirectly influence NANOG expression. Certain lncRNAs have already been shown that have potential to influence stemness-associated transcription factors, including NANOG (22). Based on the literature search, we selected RoR, SNHG1 and AB209630, which were experimentally validated that either sponge miR-145 and miR-34a or directly or indirectly influence NANOG expression (19–21). Additionally, we analyzed the expression level of TP53 since it is a connection point in the regulation of selected ncRNAs (23–25).
Isolation of Total RNA
Total RNA was isolated from FFPE biopsy samples, using a 0.6-mm needle (punching) for precise tissue collection (Manual Tissue Arrayer MTA, Beecher, Estigen). Manual isolation of total RNA was performed using MagMAX FFPE DNA/RNA Ultra kit (Applied Biosystems; Thermo Fisher Scientific, Foster City, CA, USA) according to the manufacturer’s instructions with one modification. Protease digestion was performed overnight, 12 h incubation including mixing at 300 rpm for 15 s every 4 min. Reagents used were from Thermo Fisher Scientific, (Foster City, CA, USA) apart from the ethanol (Merck KGaA, Darmstadt, Germany) and the deparaffinization solution (xylene; Sigma-Aldrich; Merck KGaA, Darmstadt, Germany). The quality and concentration of isolated RNAs were assessed fluorometrically on Qubit 3.0 (Applied Biosystems; Thermo Fisher Scientific, Foster City, CA, USA). After punching, additional slide was cut and evaluated by pathologist.
Reverse Transcription
Reverse transcription (RT) of total RNA was performed in one reaction for each sample for optimal expression comparison for mRNAs, miRNAs and lncRNAs using miScript II RT (Qiagen, Hilden, Germany) according to manufacturer’s instructions. Each 14 µl RT reaction contained 7.94 ul (12 ng/ul) of extracted total RNA, 2.8 µl HiFlex buffer, 1.4 µl 10× Nucleic mix, 1.4 µl of miScript RT enzyme and 0.46 µl of RNaze Inhibitor (Qiagen, Hilden, Germany). The reaction was incubated for 60 min at 37°C and 5 min at 95°C, using SimpliAmp Thermal Cycler (Applied Biosystems; Thermo Fisher Scientific, Foster City, CA, USA).
Pre-Amplification and Quantitative Real Time PCR
All quantitative real time PCR (qPCR) reactions were performed using ViiA 7 Real-Time PCR System (Applied Biosystems; Thermo Fisher Scientific, Foster City, CA, USA) after RT. Each sample was done in duplicate. All qPCR reactions for efficiency testing were performed in triplicate.
Pre-Amplification for TaqMan Assays
Pre-amplification was performed prior to qPCR to measure the expression level of mRNAs and lncRNA, using TaqMan PreAmp mastermix (Applied Biosystems; Thermo Fisher Scientific, Foster City, CA, USA) according to the manufacturer’s instructions. Pre-amplification was performed using 6.25 µl of resulting cDNA, 12.5 µl 2× TaqMan PreAmp Mastermix (Applied Biosystems; Thermo Fisher Scientific, Foster City, CA, USA), and 6.25 µl of pooled 0.2× TaqMan Gene Expression Assays, diluted in Tris-EDTA buffer solution, pH 8.0 (Sigma-Aldrich; Merck KGaA, Darmstadt, Germany). TaqMan Gene Expression Assays used are GAPDH (Human GAPD; Cat. No. 4310884E), IPO8 (Hs00183533_m1; Cat. No. 4331182), HPRT1 (Hs99999909_m1; Cat. No. 4333768), NANOG (Hs04260366_g1; Cat. No. 4331182), TP53 (Hs01034249_m1; Cat. No. 4331182) and RoR (Hs05054521_s1; Cat. No. 4351372) (Applied Biosystems; Thermo Fisher Scientific, Foster City, CA, USA). Cycling conditions were as follows: 10 min at 95°C and 10 cycles of 15 s at 95°C and 4 min at 60°C using SimpliAmp Thermal Cycler (Applied Biosystems; Thermo Fisher Scientific, Foster City, CA, USA).
qPCR for TaqMan Assays
Efficiency of qPCR reactions were calculated using pools of isolated RNAs for each group of samples. Resulting pre-amplified cDNA was diluted 5-, 25-, 125-, 625-fold for each mRNAs and 4-, 8-, 16-, 32-, 64-, 128-fold for lncRNA efficiency analysis. Reactions were performed in triplicates.
For expression analyses of mRNAs and lncRNA, TaqMan technology was used. Pre-amplified cDNA was diluted five-fold prior to qPCR. Each qPCR reaction contained 5 µl of 2× TaqMan Gene Expression Master Mix, 4.5 µl of diluted pre-amplified cDNA and 0.5 µl 20× TaqMan Gene Expression Assay (Applied Biosystems; Thermo Fisher Scientific, Foster City, CA, USA) listed in previous section. Cycling conditions were as follows: 2 min at 50°C, 10 min at 95°C and 45 cycles of 15 s at 95°C and 1 min at 60°C. GAPDH, IPO8 and HPRT1 were used as reference genes. All reactions were performed in duplicates.
qPCR for miRNAs
qPCR based on SYBR Green technology was performed to measure the expression level of miRNAs. Prior to qPCR, efficiency was determined using RNA pools for each group of samples. cDNA was diluted 10-, 25-, 100-, 125-, 625-, 1,000- and 3,125-fold and used in qPCR reactions as described below. Reactions were performed in triplicates.
miScript SYBR Green PCR Kit (Qiagen, Hilden, Germany) was used for miRNAs expression analysis. qPCR reaction contained 5 µl of 2× miScript SYBR Green PCR Mix, 1 µl 10× miScript Universal primer, 1 µl 10× miScript primer, 0.95 µl ddH2O, 0.05 µl of ROX dye and 2 µl of cDNA diluted 100-fold. All 10× miScript primer assays used are SNORD61 (Hs_SNORD61_11; Cat. No. MS00033705), SNORD95 (Hs_SNORD95_11; Cat. No. MS00033726), miR-145 (Hs_miR-145_1; Cat. No. MS00003528), and miR-34a (Hs_miR-34a_1; Cat. No. MS00003318) (Qiagen, Hilden, Germany). Thermal conditions were as follows: 15 min at 95°C and 45 cycles of 15 s at 94°C, 30 s at 55°C, 30 s at 70°C. Afterwards melting curves were acquired on the SYBR channel using a ramping rate of 0.7°C/60 s for 60–95°C. SNORD61 and SNORD95 were used as reference genes. We tested several miRNAs that were recommended as miScript PCR Controls by the manufacturer (Qiagen). We chose SNORD61 and SNORD95 as normalizers since PCR products showed expression in early cycles, had specific melt curve after PCR, had acceptable efficiency of amplification, had Cq values close among replicates, within the groups and between the groups. Thus, only SNORD61 and SNORD95 satisfied all the criteria. All reactions were performed in duplicates.
qPCR for lncRNAs
SYBR Green technology was also used for qPCR to measure the expression level of lncRNAs. For efficiency determination, RNA pools of all groups of samples were reverse transcribed and resulting cDNA was diluted 4-, 8-, 16-, 32- and 64-fold. lncRNA efficiency analysis was performed in triplicate qPCR reaction as described below.
SYBR Select Master Mix (Applied Biosystems; Thermo Fisher Scientific, Foster City, CA, USA) was used for expression analysis of lncRNAs. qPCR reaction contained 5 µl of 2× SYBR Select Master Mix, 1 µl of forward and 1 µl of reverse primer and 3 µl of cDNA diluted 30-fold. All lncRNAs primers used (Sigma-Aldrich, Merck KGaA, Darmstadt, Germany) are SNHG1 [forward: 5′-TAACCTGCTTGGCTCAAAGGG-3′; reverse: 5′-CAGCCTGGAGTGAACACAGA-3′ (26)] and AB209630 [forward: 5′-GGGCTATTGTCCCTAAGTTGAT-3′; reverse: 5′-TGTCTTGTAGAGCATAAGGAAACC-3′ (27)]. Thermal conditions were as follows: 2 min at 50°C, 2 min at 95°C and 45 cycles of 15 s at 95°C and 1 min at 60°C. Afterwards melting curves were acquired on the SYBR channel using a ramping rate of 0.7°C/60 s for 60–95°C. GAPDH (Hs_GAPDH_vb.1_SG; Cat. No. QT02504278) and PPIA (Hs_PPIA_4_SG; Cat. No. QT01866137) were used as reference genes (Qiagen, Hilden, Germany). All reactions were performed in duplicates.
Validation of the Expression of NANOG, TP53, Selected miRNAs and lncRNAs in the Oral Squamous Cell Carcinoma From The Cancer Genome Atlas RNA Sequencing Datasets
To validate the expression of analyzed transcripts we used the RNA sequencing data of 523 head and neck squamous cancer (HNSCC) samples and 44 normal mucosa adjacent to HNSCC from The Cancer Genome Atlas. Of these, 329 correspond to OSCC and 32 to normal mucosa adjacent to OSCC. No sample of precancerous lesions was found in database. The data were obtained from cBioPortal interactive online database. In all, mRNA, lncRNA and miRNA experiments, level 3 data was used, which contains normalized gene counts and read per million mapped miRNA isoforms, respectively. The data were represented as reads per million in box plots.
Statistical Analysis
For mRNA, miRNA and lncRNA expression analysis, data were analyzed according to Latham (28). For each sample, geometric mean of Cqs of reference genes for mRNAs, miRNAs or for lncRNAs were subtracted from mRNAs, miRNAs or lncRNAs, to obtain ΔCq for statistical analysis.
Comparison of relative quantification of mRNAs, miRNAs and lncRNAs (ΔCq) between independent group of samples was performed using Mann–Whitney U test. Correlation between mRNAs, lncRNAs and miRNAs was performed using Spearman Rank correlation coefficient test. Statistical analysis of data was performed using IBM SPSS Statistics 24 software (SPSS Inc., Chicago, IL, USA). Differences were considered as significant using cut-off p <0.05 (two-tailed). ΔΔCq was used for calculating fold change using log2-ΔΔCq for graphical presentation.
Results
Immunohistochemical Expression of NANOG Protein
Thirty-six cases of high-grade dysplasia (HG-dysplasia), 31 cases of low-grade dysplasia (LG-dysplasia), 15 cases of OSCC, 15 cases of LG-dysplasia adjacent to OSCC, and 15 cases of normal oral mucosa were analyzed for NANOG protein expression.
No staining was found in normal mucosa samples. Positive reaction was found in 34 (94.44%) cases of HG-dysplasia and in all 15 (100%) cases of OSCC. HG-dysplasia cases showed moderate staining in 11 (30.56%) and strong staining in 23 (63.89%) cases. Six (40%) OSCC cases showed moderate staining and nine (60%) cases showed strong staining. Very weak staining was found in LG-dysplasia in 29 (93.55%) cases and in 13 (86.67%) cases of LG-dysplasia adjacent to OSCC. In dysplasia, positive reaction was present in all cells. In OSCC, the extent of positive reaction was 50–75% of cells in 2 OSCC samples (13.33%) and above 75% of cells in 13 OSCC samples (86.67%). The combined immunohistochemical scores are presented in Table 1. Representative examples of immunohistochemical staining are shown in Figure 1.
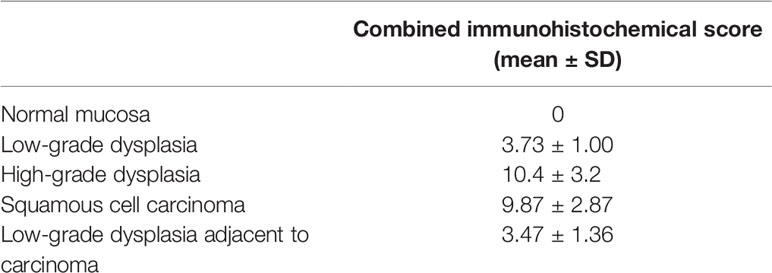
Table 1 Combined immunohistochemical score for NANOG immunostaining.
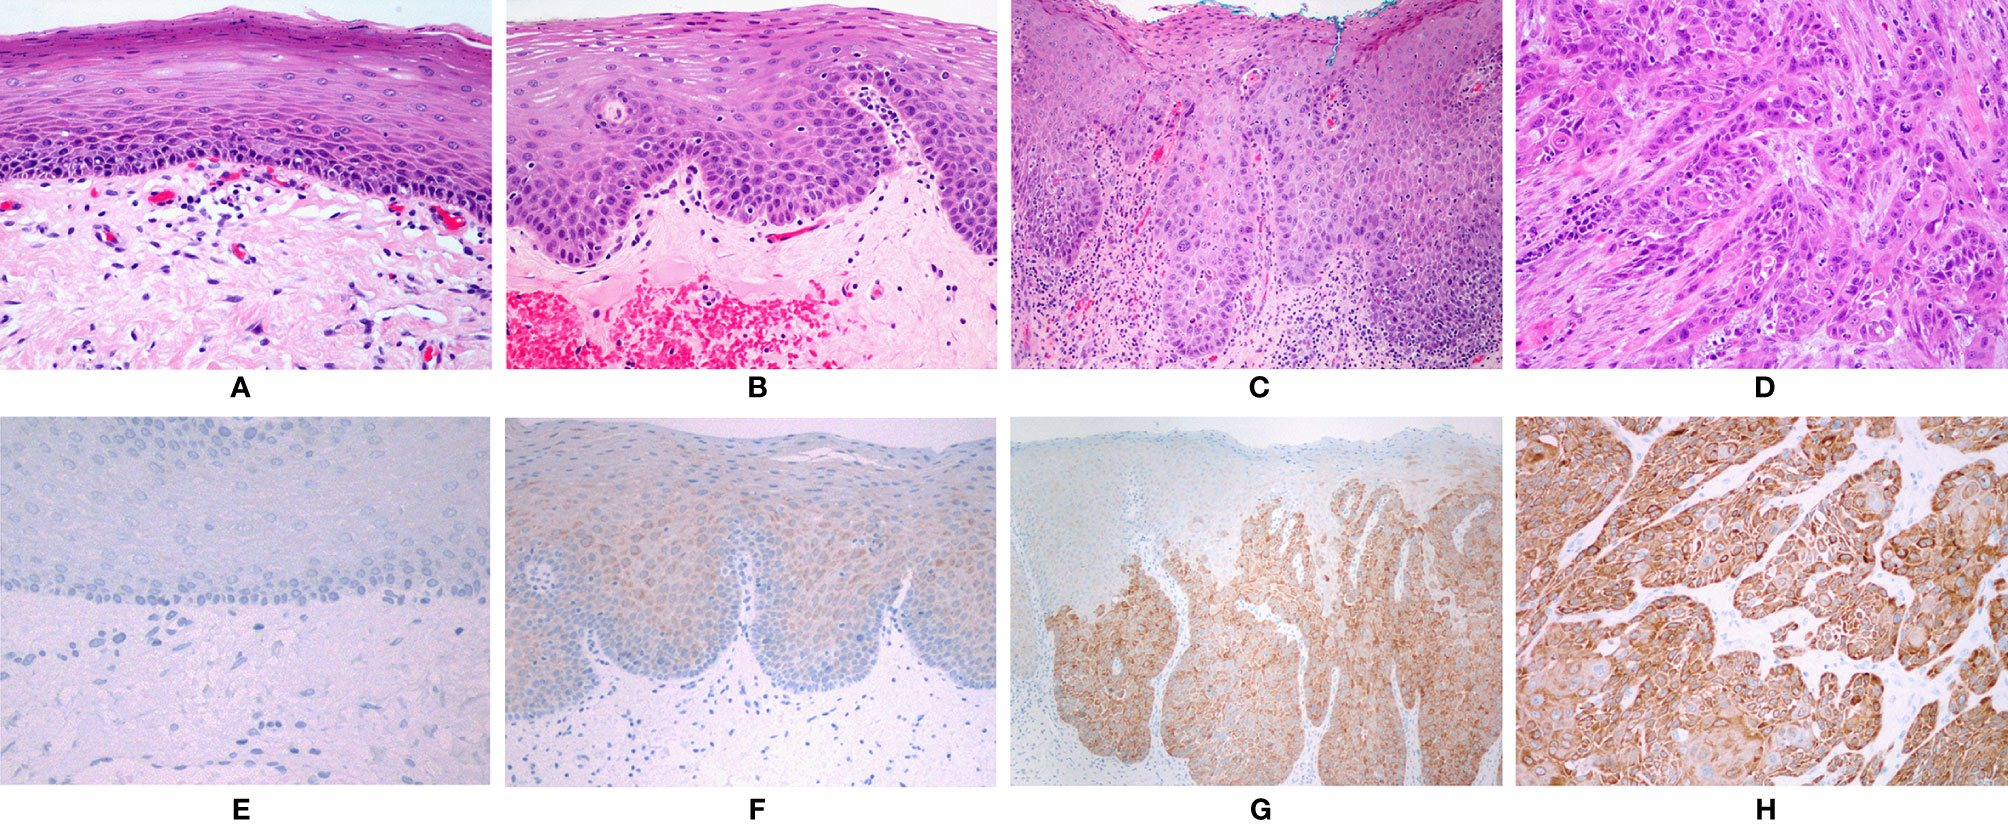
Figure 1 (A) Normal oral mucosa. (B) Low-grade dysplasia. (C) High-grade dysplasia. (D) Squamous cell carcinoma. (A–D): HE, orig. magnification, 100×. (E) No immunohistochemical expression of NANOG in normal mucosa. (F) Faint staining in low-grade dysplasia. (G) Strong staining in areas with high-grade dysplasia. (H) Strong staining in squamous cell carcinoma. (E–H): Immunohistochemistry, orig. magnification, 100×.
NANOG was detected in the cytoplasm of epithelial cells only; no nuclear staining was observed (Figure 1). Positive control (testicular seminoma) showed only nuclear staining in all tumor cells.
Expression of mRNAs, miRNAs, and lncRNAs
Expression of mRNAs, miRNAs, and lncRNAs in Low-Grade Dysplasia, Hight GadeDysplasia, and Oral Squamous Cell Carcinoma in Comparison to Normal Mucosa
NANOG, TP53, miR-34a, and miR-145 expression was detected in all of the tested samples in normal mucosa (n = 15), LG-dysplasia (n = 31), HG-dysplasia (n = 36), and in OSCC (n = 15). However, expression of lncRNAs was not detected in all samples; RoR was detected in three samples of normal mucosa, 12 LG-dysplasia, 22 HG-dysplasia samples, and in five OSCC samples. SNHG1 was detected in 13 normal mucosa samples, 20 LG-dysplasia, 20 HG-dysplasia, and in six OSCC samples. AB209630 was detected in 15 normal mucosa samples, 26 LG-dysplasia, 31 HG-dysplasia, and in six OSCC samples.
Comparison of normal mucosa with LG-dysplasia revealed up-regulation of NANOG (1.74-fold; p < 0.001), miR-145 (1.49-fold; p = 0.038), RoR (143.93-fold; p = 0.009), and SNHG1 (1.53-fold; not significant) and similar expression (slight down-regulation) of TP53 (1.12-fold; not significant), miR-34a (1.15-fold; not significant), and AB209630 (1.17-fold; not significant) in LG-dysplasia.
Comparison of normal mucosa with HG-dysplasia revealed up-regulation of NANOG (1.65-fold; p = 0.002), miR-145 (1.34-fold; not significant), RoR (219.70-fold; p = 0.006) and SNHG1 (2.42-fold; p = 0.005) and down-regulation of TP53 (1.31-fold; not significant), miR-34a (1.24-fold; not significant), and AB209630 (1.44-fold; p = 0.043) in HG-dysplasia.
Comparison of normal mucosa with OSCC revealed up-regulation of NANOG (1.29-fold; not significant), miR-145 (2.33-fold; p = 0.007), RoR (231.56-fold; p = 0.025), AB209630 (27.93-fold; p < 0.001), and SNHG1 (3.26-fold; p = 0.007) and down-regulation of TP53 (1.98-fold; p = 0.001) and miR-34a (1.98-fold; p < 0.001) in OSCC.
Results are presented as log2 of fold change in Figure 2 (for mRNAs and miRNAs) and in Figure 3 (for lncRNAs).
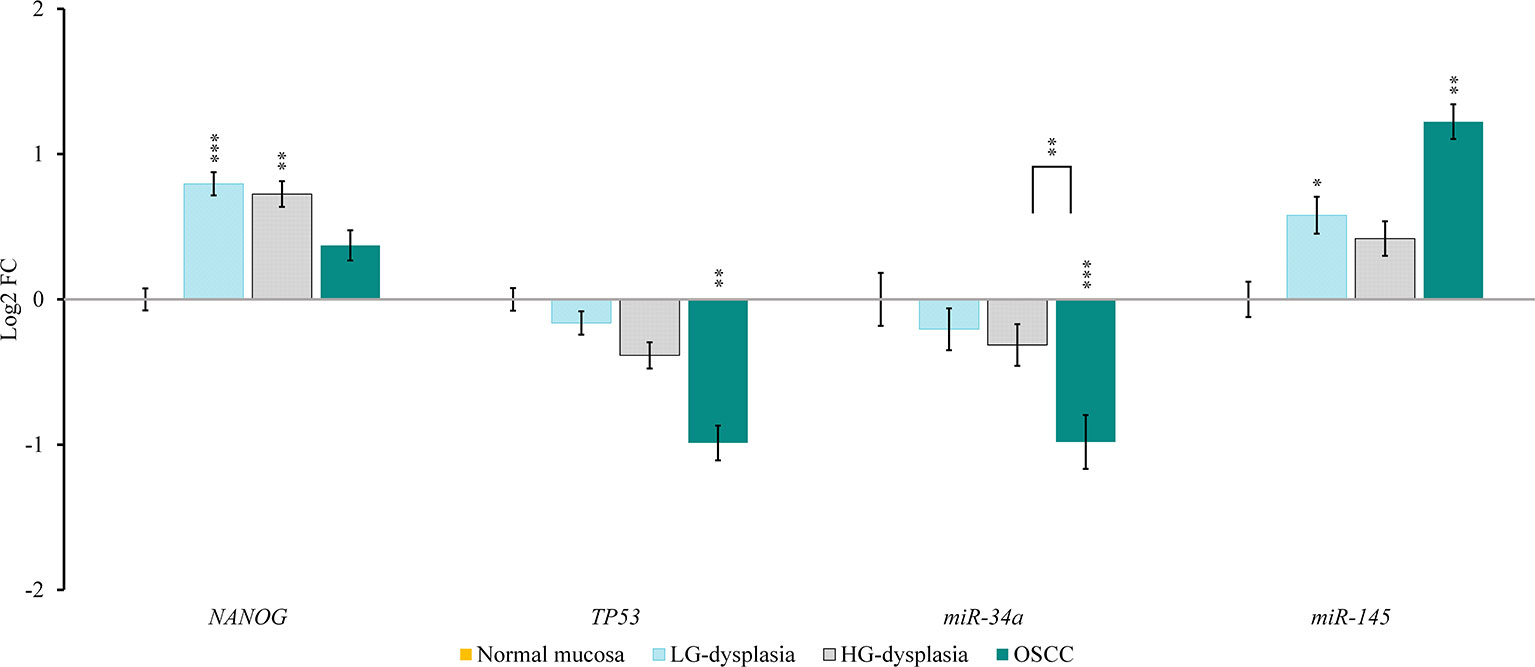
Figure 2 Relative expression levels of tested mRNAs and miRNAs in low-grade dysplasia (LG-dysplasia) (n = 31), high-grade dysplasia (HG-dysplasia) (n = 36) and in squamous cell carcinoma (OSCC) (n = 15) as compared with normal mucosa (n = 15) are shown as log2 of fold change. The bars represent the means ± standard deviation. Statistical comparison of relative expression levels in HG-dysplasia compared to OSCC is also shown as a line above the bars of HG-dysplasia and OSCC. Data were assessed with the Mann–Whitney U test, where p <0.05 was considered to be statistically significant (*p < 0.05, **p < 0.01, ***p < 0.001).
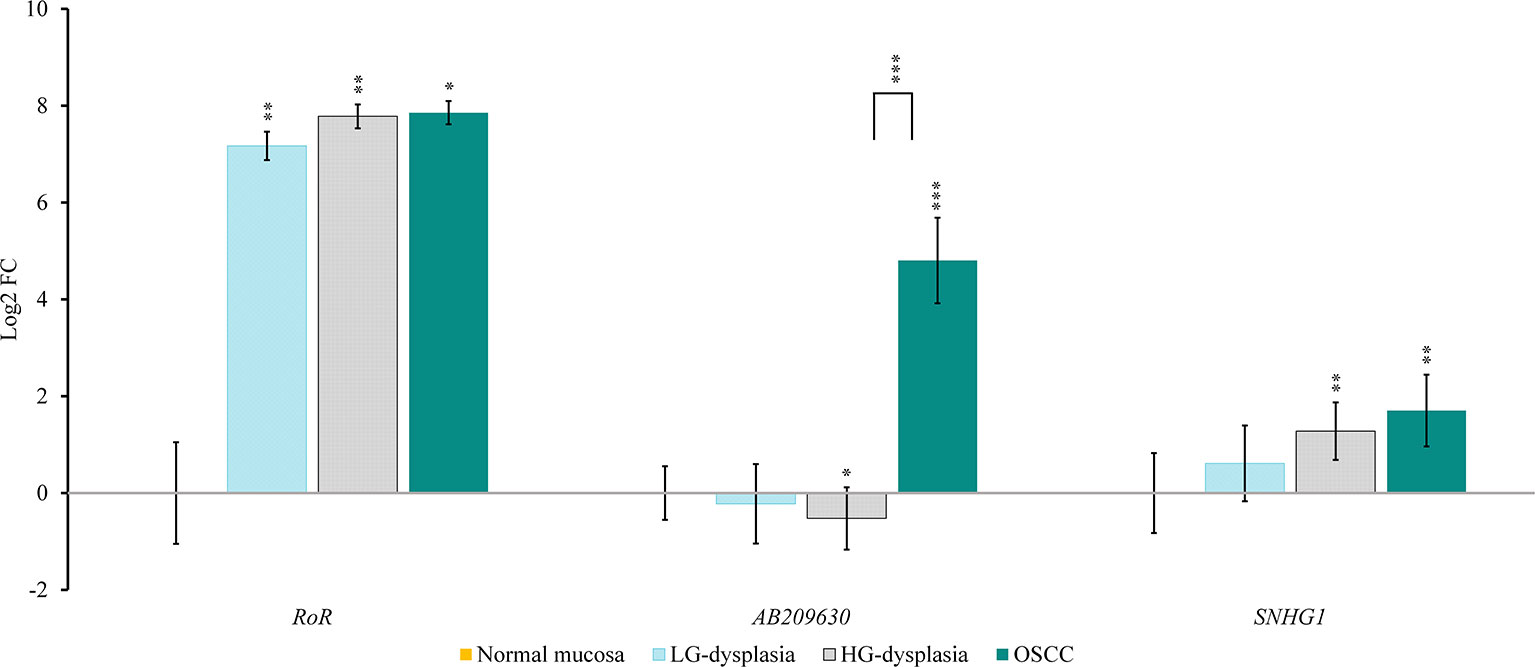
Figure 3 Relative expression levels of tested lncRNAs in low-grade dysplasia (LG-dysplasia) (n = 31), high-grade dysplasia (HG-dysplasia) (n = 36) and in squamous cell carcinoma (OSCC) (n = 15) as compared with normal mucosa (n = 15) are shown as log2 of fold change. The bars represent the means ± standard deviation. Statistical comparison of relative expression levels in HG-dysplasia compared to OSCC is also shown as a line above the bars of HG-dysplasia and OSCC. Data were assessed with the Mann–Whitney U test, where p <0.05 was considered to be statistically significant (*p < 0.05, **p < 0.01, ***p < 0.001).
Analysis of OSCC (n = 329) from TCGA dataset revealed transcripts for miR-34a, miR-145, TP53, SNHG1 in all samples, whereas NANOG and RoR were detected in 198 (60%) and 200 (61%) samples, respectively. Results are presented as reads per million in Figure 4.
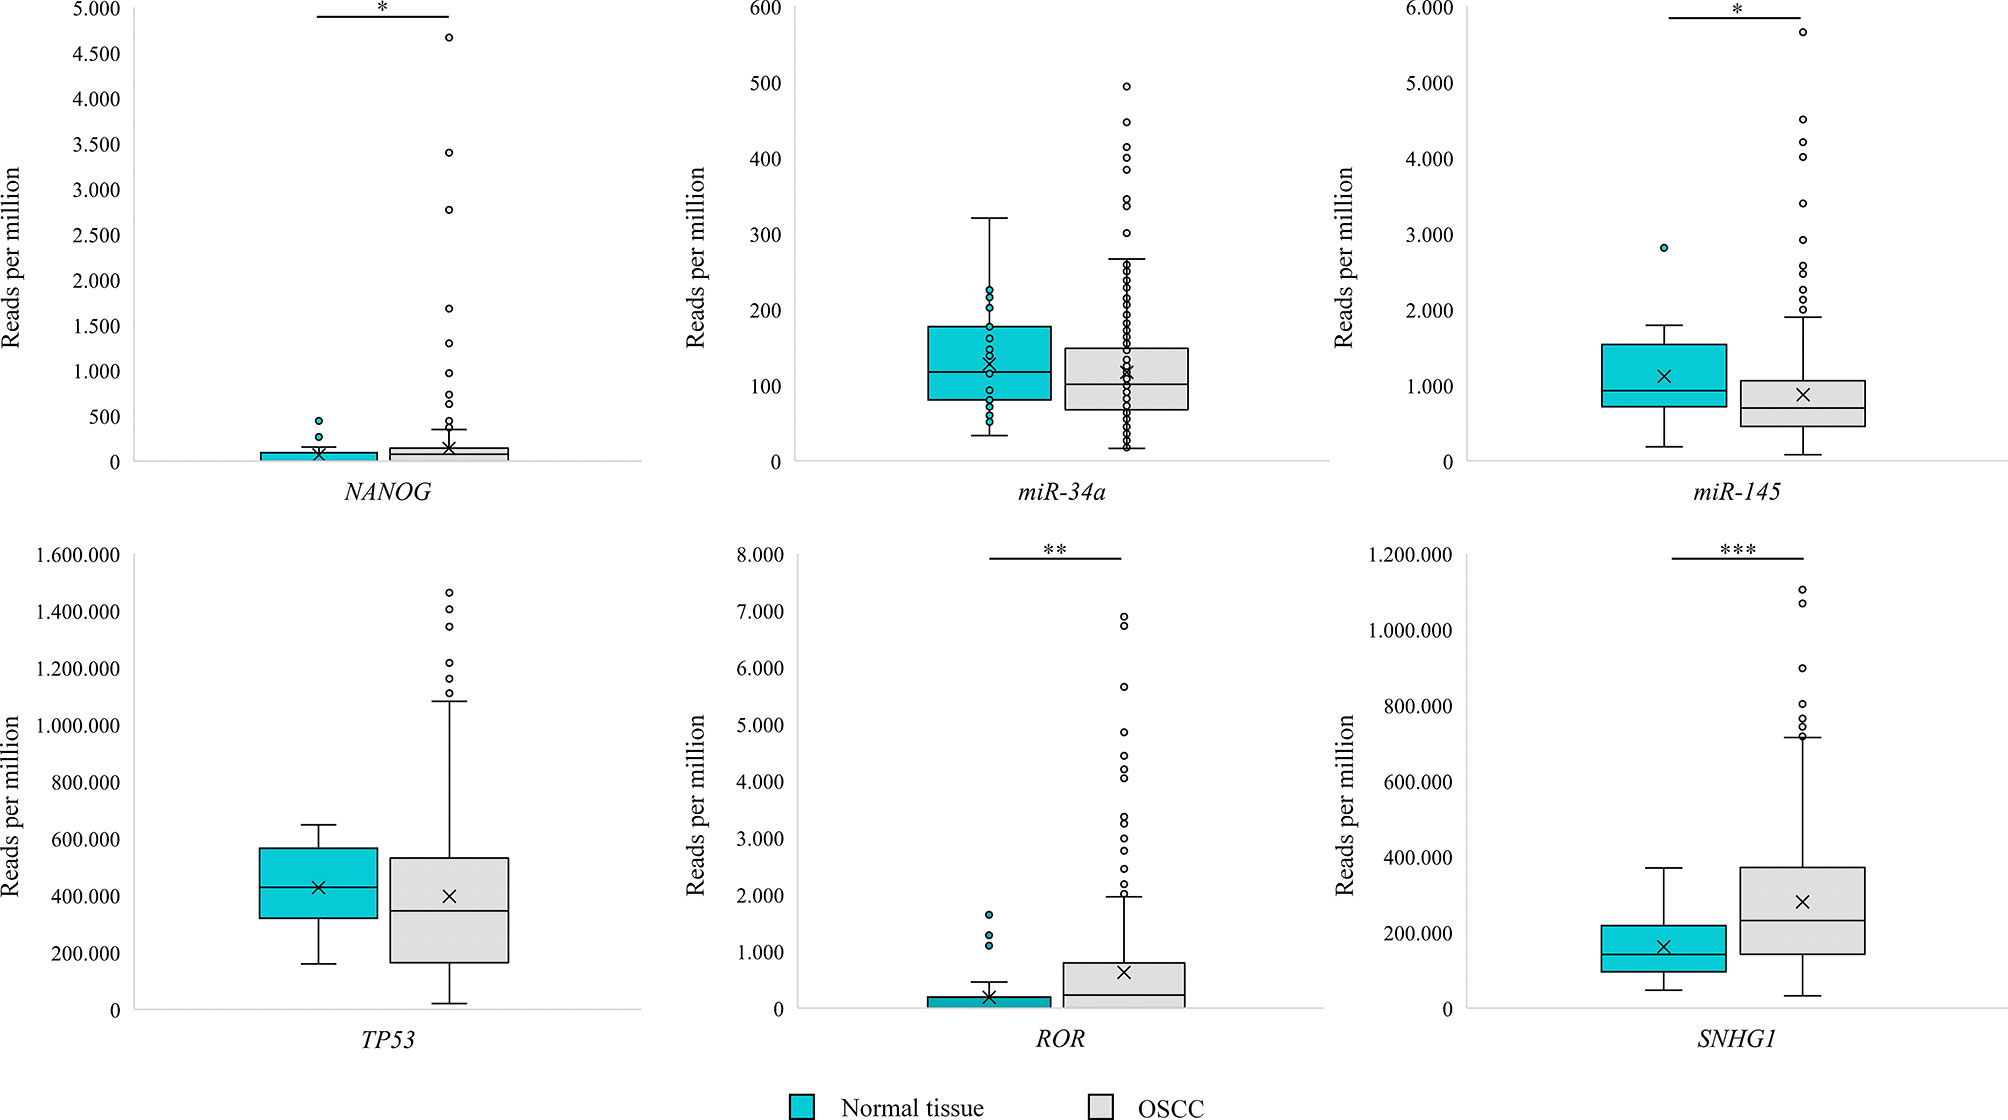
Figure 4 Box Plot representing expression of NANOG, TP53, miR-34a, miR-145, RoR and SNGH1 in oral squamous cell carcinoma (OSCC) and morphologically normal mucosa adjacent to OSCC in samples from The Cancer Genome Atlas. Data were assessed with the Mann–Whitney U test, where p <0.05 was considered to be statistically significant (* p < 0.05, ** p < 0.01, *** p < 0.001).
Expression of mRNAs, miRNAs, and lncRNAs in Normal Mucosa in Comparison to Low Grade Dysplasia Adjacent to Oral Squamous Cell Carcinoma
NANOG, TP53, miR-34a, and miR-145 expression was detected in all tested samples in LG-dysplasia adjacent to OSCC (n = 15). However, expression of lncRNAs was not detected in all samples; RoR was detected in five, SNHG1 in four, and AB209630 in eight samples of LG-dysplasia adjacent to OSCC.
Expression in LG-dysplasia adjacent to OSCC revealed up-regulation of NANOG (1.32-fold; not significant), miR-145 (1.85-fold; p = 0.004), RoR (59.99-fold; p = 0.025), SNHG1 (4.91-fold; p = 0.024), and AB209630 (24.93-fold; p < 0.001), as well down-regulation of TP53 (2.11-fold; p = 0.002) and miR-34a (1.77-fold; p < 0.001) in comparison to normal mucosa (data not shown).
Analysis of normal tissue adjacent to OSCC (n = 32) from TCGA dataset revealed transcripts for miR-34a, miR-145, TP53, SNHG1 in all samples, whereas NANOG and RoR were detected in 13 (40%) and 11 (34%) samples, respectively. Results are presented as reads per million in Figure 4. Using Mann–Whitney U test we observed a significant difference in reads per million for miR-145 (p = 0.047), SNHG1 (p < 0.001), NANOG (p = 0.043), and RoR (p = 0.001) between OSCC (n = 329) and normal tissue adjacent to OSCC.
Relative Quantification of mRNAs, miRNAs, and lncRNAs of Hight Grade Dysplasia Compared to Oral Squamous Cell Carcinoma
In OSCC in comparison to HG-dysplasia we showed up-regulation of miR-145 (1.75-fold; p = 0.060), AB209630 (40.18-fold; p < 0.001), and SNHG1 (1.45-fold; not significant). NANOG (1.28-fold; not significant), TP53 (1.45-fold; p = 0.053) and miR-34a (1.59-fold; p = 0.005) were down-regulated in OSCC. RoR showed similar expression (1.05-fold; not significant). Results are presented as log2 of fold change in Figure 2 (for mRNAs and miRNAs) and in Figure 3 (for lncRNAS).
Expression of mRNAs, miRNAs, and lncRNAs in Low Grade Dysplasia in Comparison to Low Grade Dysplasia Adjacent to Oral Squamous Cell Carcinoma
LG-dysplasia adjacent to OSCC revealed up-regulation of miR-145 (1.24-fold; not significant), SNHG1 (3.21-fold; p = 0.063) and AB209630 (29.08-fold; p < 0.001) and down-regulation for NANOG (1.31-fold; not significant), TP53 (1.89-fold; p = 0.002), miR-34a (1.54-fold; p = 0.001), and RoR (2.40-fold; not significant) in comparison to LG-dysplasia (data not shown).
Correlation between expression of mRNAs, miRNAs and lncRNAs
Spearman rank-order correlation (n = 112) revealed strong positive correlation between NANOG and miR-145 (rs = 0.315, p = 0.001) and RoR (rs = 0.684, p < 0.001). We also observed strong positive correlation between the expression of RoR and miR-145 (rs = 0.480, p = 0.001) and strong negative correlation between the expression of TP53 and AB209630 (rs = −0.392, p < 0.001) and SNHG1 (rs = −0.272, p = 0.031). There was no correlation between other tested mRNAs, miRNAs, and lncRNAs.
Discussion
Our results suggest that NANOG plays an important role in the process of OSCC cancerogenesis. Immunohistochemical analysis showed no expression of NANOG protein in normal oral mucosa, very weak staining in LG-dysplasia, and strong staining in HG-dysplasia and OSCC. The intensity of staining correlated strongly with the severity of atypia. Strong expression of the NANOG protein in both HG-dysplasia and OSCC supports the true neoplastic nature of HG-dysplasia. The marked difference in intensity between LG-dysplasia and HG-dysplasia indicates a potential use of NANOG immunohistochemistry in diagnostic work, enabling a distinction between reactive lesions and LG-dysplasia on the one hand, and HG-dysplasia as a true precancerous lesion on the other.
Similarly, previous studies have also shown negligible expression of NANOG protein in normal mucosa of the head and neck, and up-regulation in the early stages of OSCC cancerogenesis (8, 14). Moreover, NANOG expression was significantly higher in OSCC and adjacent mucosa than in normal mucosa (29). NANOG protein was detected in 60% of laryngeal dysplasias, with 27% of dysplasias showing strong NANOG immunostaining. Five years after the initial diagnosis, only 20% of patients with negative to moderate NANOG expression and 55% of patients with strong NANOG expression developed laryngeal cancer (14). Similar results have been described for oral mucosa. In oral dysplasia, NANOG protein expression was significantly correlated with higher risk of progression to invasive carcinoma and higher cancer incidence with a stronger cytoplasmic reaction (8). Other studies also showed NANOG protein expression to increase with the grade of dysplasia, and NANOG protein expression in 31–100% of OSCC samples with immunostaining of various intensity (14, 15, 29–35).
Our study also showed that, in contrast to protein expression, mRNA was detected in all samples, from normal oral mucosa to dysplasia and carcinoma, showing the lowest values in normal mucosa. The only significant difference in mRNA expression was observed between normal mucosa and dysplasia, suggesting that NANOG mRNA expression is up-regulated early in the process of oral cancerogenesis, before strong protein expression can be detected.
There are limited data regarding NANOG mRNA expression in oral precancerosis and OSCC. A previous study reported presence of NANOG mRNA in 100% of OSCC samples and in 91.7% of non-tumoral margins. However, expression was significantly higher in non-tumoral margins compared to OSCC (33). Similar results of NANOG mRNA expression in RNA later-stored OSCC samples (n = 90) showed expression in 100% of OSCC samples and in 88.9% of corresponding normal tissue samples (36). NANOG mRNA expression was significantly higher in poorly and moderately differentiated OSCC than in well-differentiated OSCC (37). In silico analysis of the NANOG mRNA expression in a cohort of head and neck SCC (n = 530) using data from The Cancer Genome Atlas (TCGA) showed a significantly increased mRNA level in primary tumors compared to normal tissue. However, in an OSCC cohort (n = 172), only 2.9% of samples revealed NANOG mRNA up-regulation compared to normal tissue (8), similarly to our results of TCGA analysis.
The finding of mRNA in all samples and strong protein expression only in HG-dysplasia and carcinoma strongly suggest that NANOG expression is regulated at the post-transcriptional level. We therefore analyzed the expression of ncRNAs that presumably regulate NANOG. We found miR-34a to be down-regulated; its expression progressively decreased similarly to NANOG expression. Expression levels were the highest in normal mucosa, and progressively decreased from LG-dysplasia to HG-dysplasia, and were the lowest in OSCC. Expression of miR-34a was significantly down-regulated in OSCC compared to HG-dysplasia. These results indicate that miR-34a is down-regulated during OSCC carcinogenesis and might thus enable NANOG up-regulation. Our results are in accordance with previous studies that have shown up-regulation of NANOG and down-regulation of miR-34a in OSCC compared to controls (38). miR-34a might also regulate NANOG through TP53 protein, which had the same expression pattern in our samples as miR-34a and can directly induce the expression of pro-apoptotic miR-34a (23, 24, 38, 39).
miR-145 expression analysis showed a different pattern; it was low in normal mucosa, and slightly up-regulated in LG-dysplasia and HG-dysplasia. A significant up-regulation of miR-145 was found in OSCC. miR-145 was up-regulated in OSCC compared to HG-dysplasia. However, these results are not in accordance with previous studies, which have shown lower expression levels of miR-145 in OSCC and OSCC cell lines compared to normal mucosa (40–42). Furthermore, we observed a strong positive correlation between the expression of miR-145 and NANOG. Consistent with our observed reverse pattern of NANOG expression compared to miR-145, a study on human embryonic stem cells and cervical cells showed that miR-145 could down-regulate NANOG (19, 43). These results suggest that miR-145 might play an important role in oral cancerogenesis.
We also analyzed lncRNAs that might regulate the investigated miRNAs. RoR expression levels were the lowest in normal mucosa and significantly up-regulated in LG-dysplasia, and even more in HG-dysplasia and OSCC. There was no difference in expression of RoR between OSCC and HG-dysplasia. We also observed a strong positive correlation between RoR, miR-145 and NANOG. RoR is a long intergenic ncRNA. It is a regulator of reprogramming, functioning as a competing endogenous RNA, thus playing an important role in cancerogenesis. Previous studies have demonstrated a significant up-regulation of RoR and down-regulation of miR-145 in undifferentiated oral tumors (44). It has been suggested that RoR could sponge miR-145, leading to NANOG up-regulation. The correlation between miR-145 and NANOG supports this suggestion. RoR transcription can be trans-activated with TP53 and, in turn, it can suppress TP53 during DNA damage by suppressing p53 translation, thus inhibiting TP53-mediated cell cycle arrest and apoptosis in OSCC (25, 44, 45). In human embryonic cell lines, it has been demonstrated that RoR can protect NANOG from miRNA-mediated degradation and regulate miR-145 and NANOG indirectly by post-transcriptional fine-tuning (19). Our results showed a similar RoR up-regulation in HG-dysplasia and in OSCC, and these patterns were similar to miR-145 up-regulation and inverse to NANOG progressively decreasing expression in OSCC cancerogenesis.
The next lncRNA we analyzed was AB209630. Its expression levels were the lowest in HG-dysplasia and LG-dysplasia compared to normal mucosa, whereas in OSCC, they were significantly increased. AB209630 was up-regulated in OSCC compared to HG-dysplasia. There are very limited data on AB209630 expression in OSCC, and it has only recently been described in hypopharyngeal SCC. It was reported to be down-regulated in tumor tissue compared to adjacent tissue, and these data suggest that increased expression might inhibit or stimulate hypopharyngeal SCC development (27). Similarly, studies on hepatocellular carcinoma and on pancreatic ductal adenocarcinoma showed AB209630 down-regulation in tumor samples compared to adjacent tissue (46, 47). Published data indicate a possible correlation between the expression of NANOG and AB209630 in human pancreatic cancer cells (21). To the best of our knowledge, this is the first study on the expression of AB209630 in OSCC carcinogenesis.
The last lncRNA we analyzed was SNHG1. Its expression levels were the lowest in normal mucosa and up-regulated in LG-dysplasia, with increased expression in HG-dysplasia and again with a small decrease in OSCC, suggesting up-regulation of SNHG1 during OSCC carcinogenesis. Expression of SNHG1 was also up-regulated when OSCC was compared to HG-dysplasia. SNHG1 is a small nucleolar RNA host gene 1, a novel lncRNA that is increased in various human cancers, but there is no data regarding OSCC. The regulatory mechanisms of SNHG1 are not yet known. SNHG1 is believed to function as a sponge for miR-145, causing its down-regulation (20). SNHG1 has been reported to be up-regulated in non-small cell lung cancer; in colorectal carcinoma and laryngeal carcinoma, it has been associated with cancer stage, the presence of metastasis, and a worse prognosis (20, 48–52).
The main weakness of our study is the lack of functional validation. However, our results indicate that miRNAs and lncRNAs, particularly miR-145 and RoR, might be among important regulatory mechanisms of NANOG in dysplasia and cancer development of oral cavity, indicating their potential role as biomarkers and therapeutic targets. Summary of our results are presented in Figure 5 on a schematic representation of the expression levels of NANOG, TP53 and ncRNAs.
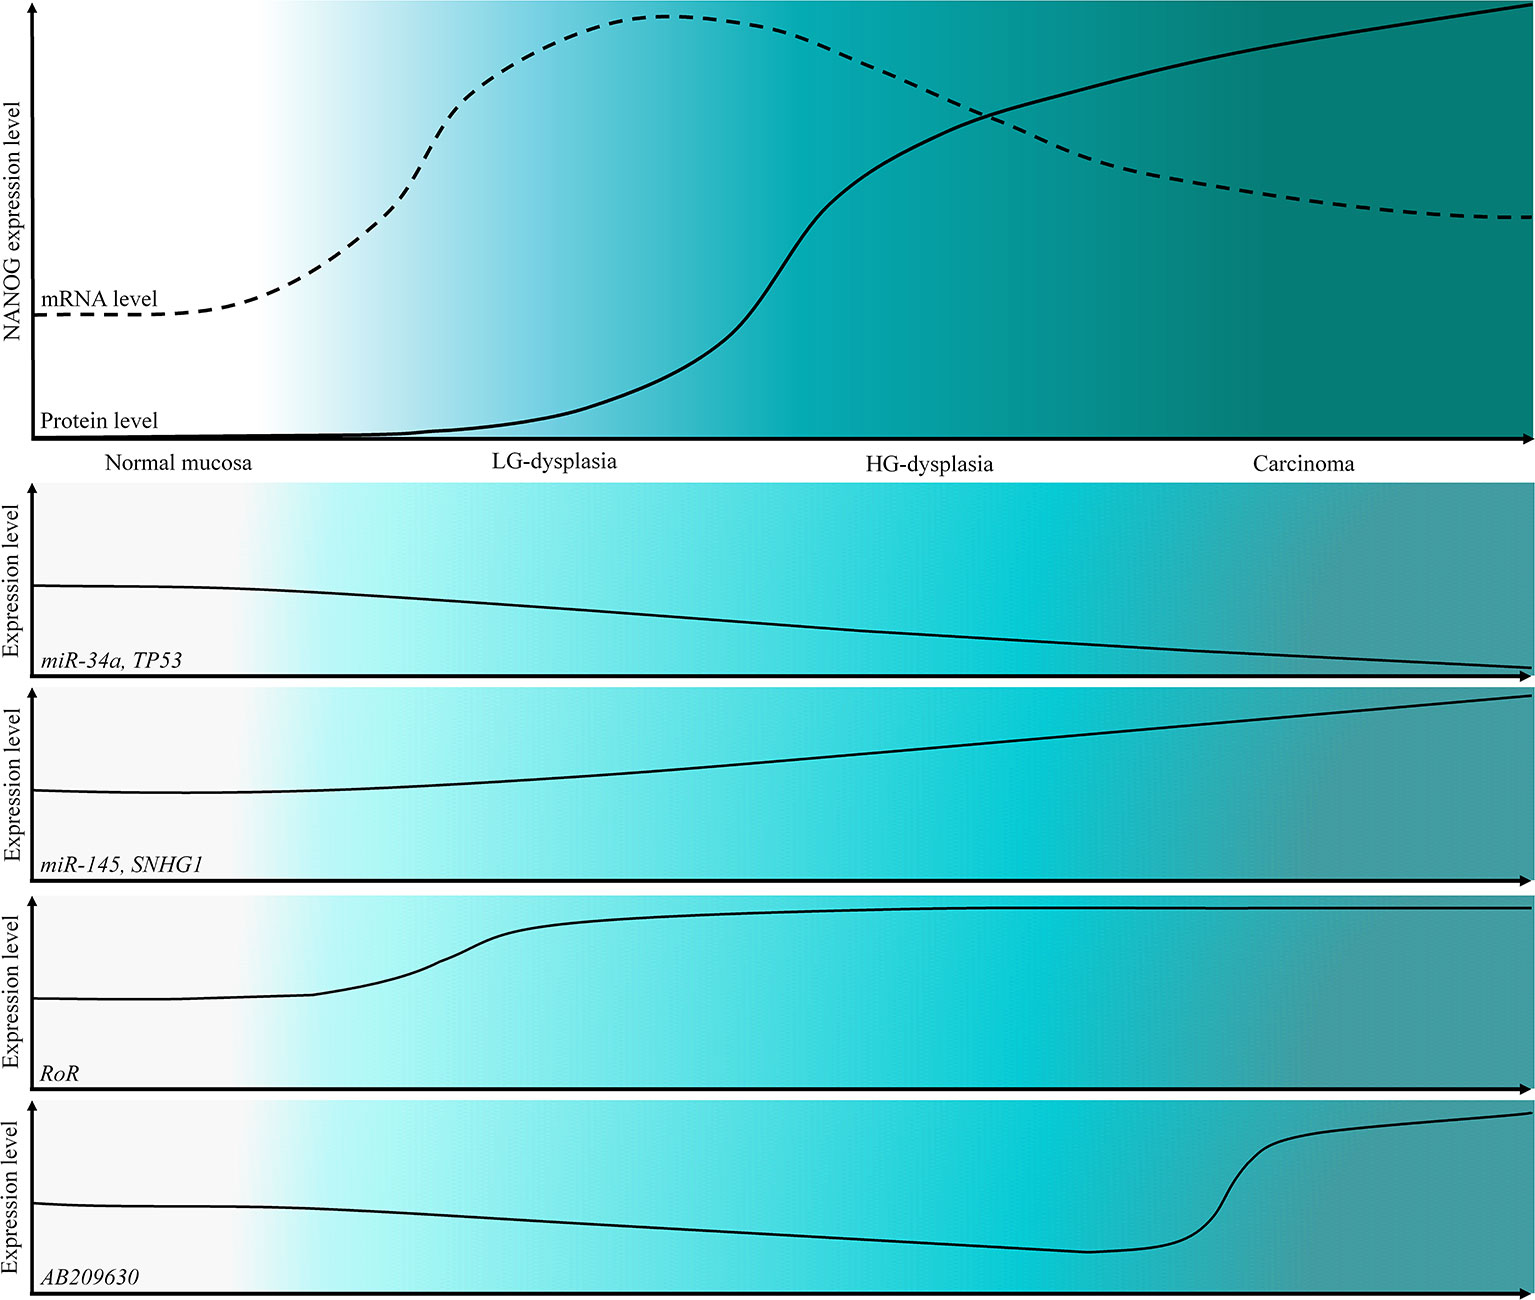
Figure 5 Schematic representation of the expression levels of NANOG protein and mRNA and a schematic representation of the expression levels of TP53 and tested ncRNAs in OSCC cancerogenesis progression.
In conclusion, our results further support the postulated role of NANOG in oral cancerogenesis. Being an embryonic stem cell transcription factor, protein expression is silenced before birth, and it is strongly re-expressed in HG-dysplasia and OSCC. The expression of mRNA in all samples, even in normal mucosa, and strong expression of the protein only in HG-dysplasia and OSCC point to a crucial role of post-transcriptional regulatory mechanisms governing NANOG expression in adults. Our results also strongly suggest that adjacent mucosa to OSCC should not be used for molecular analysis as “normal tissue”, consistent with the concept of field cancerization (53) even though it histologically seems normal. According to our results, only true independent samples of normal mucosa are appropriate for gene expression analysis.
Data Availability Statement
The datasets used and analyzed during the current study are available from the corresponding author on reasonable request.
Ethics Statement
The study involving human participants was reviewed and approved by the National Medical Ethics Committee, Ministry of Health, Republic of Slovenia (No 0120-106/2018/6). The patients/participants provided their written informed consent to participate in this study.
Author Contributions
NZ, GG, and EB conceptualized the study. GG, AA, TD, EB, and NZ developed the methodology. EB and GG were in charge of the software. GG and EB validated the study. GG, AA, TD, EB, and NZ conducted the formal analysis. GG and EB conducted the investigation. NZ provided the resources. GG, EB, and NZ conducted the data curation. GG and EB wrote and prepared the original draft. GG, EB, AA, TD, and NZ wrote, reviewed, and edited the manuscript. GG and EB conducted the visualization. EB and NZ supervised the study. All authors contributed to the article and approved the submitted version.
Funding
This research was funded by the Slovenian Research Agency (ARRS) under PhD thesis grant for young researcher GG and under research core funding No. P3-0054.
Conflict of Interest
The authors declare that the research was conducted in the absence of any commercial or financial relationships that could be construed as a potential conflict of interest.
Acknowledgement
We would like to thank Dr. Nina Hauptman for helping us with TCGA analysis.
Supplementary Material
The Supplementary Material for this article can be found online at: https://www.frontiersin.org/articles/10.3389/fonc.2020.579053/full#supplementary-material
References
1. Baillie R, Tan ST, Itinteang T. Cancer stem cells in oral cavity squamous cell carcinoma: a review. Front Oncol (2017) 7:112. doi: 10.3389/fonc.2017.00112
2. Leemans CR, Snijders PJF, Brakenhoff RH. The molecular landscape of head and neck cancer. Nat Rev Cancer (2018) 18(5):269–82. doi: 10.1038/nrc.2018.11
3. Ferlay J, Colombet M, Soerjomataram I, Mathers C, Parkin DM, Piñeros M, et al. Estimating the global cancer incidence and mortality in 2018: GLOBOCAN sources and methods. Int J Cancer (2019) 144(8):1941–53. doi: 10.1002/ijc.31937
4. Williams HK. Molecular pathogenesis of oral squamous carcinoma. Mol Pathol (2000) 53(4):165–72. doi: 10.1136/mp.53.4.165
5. Joseph BK. Oral cancer: prevention and detection. Med Princ Pract (2002) 11 Suppl 1:32–5. doi: 10.1159/000057776
6. Massano J, Regateiro FS, Januario G, Ferreira A. Oral squamous cell carcinoma: review of prognostic and predictive factors. Oral Surg Oral Med Oral Pathol Oral Radiol Endod (2006) 102(1):67–76. doi: 10.1016/j.tripleo.2005.07.038
7. Zhang L, Meng X, Zhu X-W, Yang D-C, Chen R, Jiang Y, et al. Long non-coding RNAs in oral squamous cell carcinoma: biologic function, mechanisms and clinical implications. Mol Cancer (2019) 18(1):102–2. doi: 10.1186/s12943-019-1021-3
8. de Vicente JC, Rodriguez-Santamarta T, Rodrigo JP, Allonca E, Vallina A, Singhania A, et al. The emerging role of NANOG as an early cancer risk biomarker in patients with oral potentially malignant disorders. J Clin Med (2019) 8(9):1376. doi: 10.3390/jcm8091376
9. Min A, Zhu C, Peng S, Rajthala S, Costea DE, Sapkota D. MicroRNAs as important players and biomarkers in oral carcinogenesis. BioMed Res Int (2015) 2015:186904. doi: 10.1155/2015/186904
10. Balas MM, Johnson AM. Exploring the mechanisms behind long noncoding RNAs and cancer. Noncoding RNA Res (2018) 3(3):108–17. doi: 10.1016/j.ncrna.2018.03.001
11. Ghosh RD, Pattatheyil A, Roychoudhury S. Functional landscape of dysregulated microRNAs in oral squamous cell carcinoma: clinical implications. Front Oncol (2020) 10:619. doi: 10.3389/fonc.2020.00619
12. Momen-Heravi F, Bala S. Emerging role of non-coding RNA in oral cancer. Cell Signal (2018) 42:134–43. doi: 10.1016/j.cellsig.2017.10.009
13. Fang C, Li Y. Prospective applications of microRNAs in oral cancer. Oncol Lett (2019) 18(4):3974–84. doi: 10.3892/ol.2019.10751
14. Rodrigo JP, Villaronga MA, Menendez ST, Hermida-Prado F, Quer M, Vilaseca I, et al. A novel role for Nanog as an early cancer risk marker in patients with laryngeal precancerous lesions. Sci Rep (2017) 7(1):11110. doi: 10.1038/s41598-017-11709-9
15. Zhao L, Liu J, Chen S, Fang C, Zhang X, Luo Z. Prognostic significance of NANOG expression in solid tumors: a meta-analysis. Onco Targets Ther (2018) 11:5515–26. doi: 10.2147/OTT.S169593
16. Grubelnik G, Boštjančič E, Pavlič A, Kos M, Zidar N. NANOG expression in human development and cancerogenesis. Exp Biol Med (Maywood) (2020) 245(5):456–64. doi: 10.1177/1535370220905560
17. Karagkouni D, Paraskevopoulou MD, Chatzopoulos S, Vlachos IS, Tastsoglou S, Kanellos I, et al. DIANA-TarBase v8: a decade-long collection of experimentally supported miRNA–gene interactions. Nucleic Acids Res (2017) 46(D1):D239–45. doi: 10.1093/nar/gkx1141
18. Chou CH, Shrestha S, Yang CD, Chang NW, Lin YL, Liao KW, et al. miRTarBase update 2018: a resource for experimentally validated microRNA-target interactions. Nucleic Acids Res (2017) 46(D1):D296–302. doi: 10.1093/nar/gkx1067
19. Wang Y, Xu Z, Jiang J, Xu C, Kang J, Xiao L, et al. Endogenous miRNA sponge lincRNA-RoR regulates Oct4, Nanog, and Sox2 in human embryonic stem cell self-renewal. Dev Cell (2013) 25(1):69–80. doi: 10.1016/j.devcel.2013.03.002
20. Lu Q, Shan S, Li Y, Zhu D, Jin W, Ren T. Long noncoding RNA SNHG1 promotes non-small cell lung cancer progression by up-regulating MTDH via sponging miR-145-5p. FASEB J (2018) 32(7):3957–67. doi: 10.1096/fj.201701237RR
21. Chen P, Wang M, Wang C. Qingyihuaji formula reverses gemcitabine resistant human pancreatic cancer through regulate lncRNA AB209630/miR-373/EphB2-NANOG signals. Biosci Rep (2019) 39(6):BSR20190610. doi: 10.1042/BSR20190610
22. Arunkumar G, Anand S, Raksha P, Dhamodharan S, Prasanna Srinivasa Rao H, Subbiah S, et al. LncRNA OIP5-AS1 is overexpressed in undifferentiated oral tumors and integrated analysis identifies as a downstream effector of stemness-associated transcription factors. Sci Rep (2018) 8(1):7018. doi: 10.1038/s41598-018-25451-3
23. Manikandan M, Deva Magendhra Rao AK, Arunkumar G, Rajkumar KS, Rajaraman R, Munirajan AK. Down regulation of miR-34a and miR-143 may indirectly inhibit p53 in oral squamous cell carcinoma: a pilot study. Asian Pac J Cancer Prev (2015) 16(17):7619–25. doi: 10.7314/apjcp.2015.16.17.7619
24. Avtanski DB, Nagalingam A, Tomaszewski JE, Risbood P, Difillippantonio MJ, Saxena NK, et al. Indolo-pyrido-isoquinolin based alkaloid inhibits growth, invasion and migration of breast cancer cells via activation of p53-miR34a axis. Mol Oncol (2016) 10(7):1118–32. doi: 10.1016/j.molonc.2016.04.003
25. Zhang A, Zhou N, Huang J, Liu Q, Fukuda K, Ma D, et al. The human long non-coding RNA-RoR is a p53 repressor in response to DNA damage. Cell Res (2013) 23(3):340–50. doi: 10.1038/cr.2012.164
26. Li SJ, Wang L, Sun ZX, Sun SJ, Gao J, Ma RL. LncRNA SNHG1 promotes liver cancer development through inhibiting p53 expression via binding to DNMT1. Eur Rev Med Pharmacol Sci (2019) 23(7):2768–76. doi: 10.26355/eurrev_201904_17550
27. Zhou J, Li M, Yu W, Li W, Wang J, Xiang X, et al. AB209630, a long non-coding RNA decreased expression in hypopharyngeal squamous cell carcinoma, influences proliferation, invasion, metastasis, and survival. Oncotarget (2016) 7(12):14628–38. doi: 10.18632/oncotarget.7403
28. Latham GJ. Normalization of microRNA quantitative RT-PCR data in reduced scale experimental designs. Methods Mol Biol (2010) 667:19–31. doi: 10.1007/978-1-60761-811-9_2
29. Fu TY, Hsieh IC, Cheng JT, Tsai MH, Hou YY, Lee JH, et al. Association of OCT4, SOX2, and NANOG expression with oral squamous cell carcinoma progression. J Oral Pathol Med (2016) 45(2):89–95. doi: 10.1111/jop.12335
30. Lee HJ, Kang YH, Lee JS, Byun JH, Kim UK, Jang SJ, et al. Positive expression of NANOG, mutant p53, and CD44 is directly associated with clinicopathological features and poor prognosis of oral squamous cell carcinoma. BMC Oral Health (2015) 15(1):153. doi: 10.1186/s12903-015-0120-9
31. Ravindran G, Sawant SS, Hague A, Kingsley K, Devaraj H. Association of differential beta-catenin expression with Oct-4 and Nanog in oral squamous cell carcinoma and their correlation with clinicopathological factors and prognosis. Head Neck (2015) 37(7):982–93. doi: 10.1002/hed.23699
32. Kim HM, Kang YH, Byun JH, Jang SJ, Rho GJ, Lee JS, et al. Midkine and NANOG have similar immunohistochemical expression patterns and contribute equally to an adverse prognosis of oral squamous cell carcinoma. Int J Mol Sci (2017) 18(11):2339. doi: 10.3390/ijms18112339
33. Rodrigues M, Xavier FCA, Andrade NP, Lopes C, Miguita Luiz L, Sedassari BT, et al. Prognostic implications of CD44, NANOG, OCT4, and BMI1 expression in tongue squamous cell carcinoma. Head Neck (2018) 40(8):1759–73. doi: 10.1002/hed.25158
34. Wang S, Fan H, Xu J, Zhao E. Prognostic implication of NOTCH1 in early stage oral squamous cell cancer with occult metastases. Clin Oral Invest (2018) 22(3):1131–8. doi: 10.1007/s00784-017-2197-9
35. Yu SS, Cirillo N. The molecular markers of cancer stem cells in head and neck tumors. J Cell Physiol (2020) 235(1):65–73. doi: 10.1002/jcp.28963
36. Grubelnik G, Boštjančič E, Grošelj A, Zidar N. Expression of NANOG and its regulation in oral squamous cell carcinoma. BioMed Res Int (2020) 2020:8573793. doi: 10.1155/2020/8573793
37. Takeda D, Hasegawa T, Ueha T, Iwata E, Harada R, Sakakibara A, et al. Induced pluripotent-stem-cell related genes contribute to de-differentiation in oral squamous cell carcinoma. Anticancer Res (2017) 37(3):1075–82. doi: 10.21873/anticanres.11419
38. Patel S, Rawal R. Role of miRNA dynamics and cytokine profile in governing CD44v6/Nanog/PTEN axis in oral cancer: modulating the master regulators. Tumour Biol (2016) 37(11):14565–75. doi: 10.1007/s13277-016-5289-2
39. Scapoli L, Palmieri A, Lo Muzio L, Pezzetti F, Rubini C, Girardi A, et al. MicroRNA expression profiling of oral carcinoma identifies new markers of tumor progression. Int J Immunopathol Pharmacol (2010) 23(4):1229–34. doi: 10.1177/039463201002300427
40. Gao L, Ren W, Chang S, Guo B, Huang S, Li M, et al. Downregulation of miR-145 expression in oral squamous cell carcinomas and its clinical significance. Onkologie (2013) 36(4):194–9. doi: 10.1159/000349956
41. Shao Y, Qu Y, Dang S, Yao B, Ji M. MiR-145 inhibits oral squamous cell carcinoma (OSCC) cell growth by targeting c-Myc and Cdk6. Cancer Cell Int (2013) 13(1):51. doi: 10.1186/1475-2867-13-51
42. Bufalino A, Cervigne NK, de Oliveira CE, Fonseca FP, Rodrigues PC, Macedo CC, et al. Low miR-143/miR-145 cluster levels induce activin a overexpression in oral squamous cell carcinomas, which contributes to poor prognosis. PloS One (2015) 10(8):e0136599. doi: 10.1371/journal.pone.0136599
43. Zhou X, Yue Y, Wang R, Gong B, Duan Z. MicroRNA-145 inhibits tumorigenesis and invasion of cervical cancer stem cells. Int J Oncol (2017) 50(3):853–62. doi: 10.3892/ijo.2017.3857
44. Arunkumar G, Deva Magendhra Rao AK, Manikandan M, Arun K, Vinothkumar V, Revathidevi S, et al. Expression profiling of long non-coding RNA identifies linc-RoR as a prognostic biomarker in oral cancer. Tumour Biol (2017) 39(4):1010428317698366. doi: 10.1177/1010428317698366
45. Chen S, Zhu J, Wang F, Guan Z, Ge Y, Yang X, et al. LncRNAs and their role in cancer stem cells. Oncotarget (2017) 8(66):110685–92. doi: 10.18632/oncotarget.22161
46. Li T, Liu Y, Sun Y. Long non-coding RNA AB209630 suppresses cell proliferation and metastasis in human hepatocellular carcinoma. Exp Ther Med (2017) 14(4):3419–24. doi: 10.3892/etm.2017.4927
47. Wang L, Wang F, Na L, Yu J, Huang L, Meng ZQ, et al. LncRNA AB209630 inhibits gemcitabine resistance cell proliferation by regulating PI3K/AKT signaling in pancreatic ductal adenocarcinoma. Cancer Biomark (2018) 22(1):169–74. doi: 10.3233/cbm-181182
48. Lin SX, Jiang H, Xiang GZ, Zhang WR, Weng YH, Qiu FD, et al. Up-regulation of long non-coding RNA SNHG1 contributes to proliferation and metastasis in laryngeal squamous cell carcinoma. Eur Rev Med Pharmacol Sci (2018) 22(5):1333–41. doi: 10.26355/eurrev_201803_14475
49. Tian T, Qiu R, Qiu X. SNHG1 promotes cell proliferation by acting as a sponge of miR-145 in colorectal cancer. Oncotarget (2018) 9(2):2128–39. doi: 10.18632/oncotarget.23255
50. Lan X, Liu X. LncRNA SNHG1 functions as a ceRNA to antagonize the effect of miR-145a-5p on the down-regulation of NUAK1 in nasopharyngeal carcinoma cell. J Cell Mol Med (2019) 23(4):2351–61. doi: 10.1111/jcmm.13497
51. Thin KZ, Tu JC, Raveendran S. Long non-coding SNHG1 in cancer. Clin Chim Acta (2019) 494:38–47. doi: 10.1016/j.cca.2019.03.002
52. Yu J, Yan Y, Hua C, Ming L. Upregulation of lncRNA SNHG1 is associated with metastasis and poor prognosis in cancers: A meta-analysis. Med (Baltimore) (2019) 98(16):e15196. doi: 10.1097/md.0000000000015196
Keywords: oral squamous cell carcinoma, NANOG, long non-coding RNAs, microRNAs, cancerogenesis
Citation: Grubelnik G, Boštjančič E, Aničin A, Dovšak T and Zidar N (2021) MicroRNAs and Long Non-Coding RNAs as Regulators of NANOG Expression in the Development of Oral Squamous Cell Carcinoma. Front. Oncol. 10:579053. doi: 10.3389/fonc.2020.579053
Received: 01 July 2020; Accepted: 21 December 2020;
Published: 11 February 2021.
Edited by:
Baofa Sun, Chinese Academy of Sciences, ChinaReviewed by:
Stefan Janik, Medical University of Vienna, AustriaLuca Morandi, University of Bologna, Italy
Copyright © 2021 Grubelnik, Boštjančič, Aničin, Dovšak and Zidar. This is an open-access article distributed under the terms of the Creative Commons Attribution License (CC BY). The use, distribution or reproduction in other forums is permitted, provided the original author(s) and the copyright owner(s) are credited and that the original publication in this journal is cited, in accordance with accepted academic practice. No use, distribution or reproduction is permitted which does not comply with these terms.
*Correspondence: Nina Zidar, bmluYS56aWRhckBtZi51bmktbGouc2k=