 Shanshan Hu†
 Xiao Chen†
 Xiangxiang Xu
 Chenlei Zheng
 Wenqian HuangYi Zhou
 Percy David Papa AkuettehHongbao YangKeqing ShiBicheng Chen
 Qiyu Zhang*
- Key Laboratory of Diagnosis and Treatment of Severe Hepato-Pancreatic Diseases of Zhejiang Province, The First Affiliated Hospital of Wenzhou Medical University, Wenzhou, China
Pancreatic ductal adenocarcinoma (PDAC) has a high mortality rate and poor prognosis. KRAS, TP53, CDKN2A, and SMAD4 are driver genes of PDAC and 30–75% patients have mutations in at least two of these four genes. Herein, we analyzed the relationship between these genes and prognosis of 762 patients in the absence of coexisting mutations, using data from three independent public datasets. Interestingly, we found that compared with mutations in other driver genes, TP53 mutation plays a significant role in leading to poor prognosis of PDAC. Additionally, we found that snoRNA-mediated rRNA maturation was responsible for the progression of cancer in PDAC patients with TP53 mutations. Inhibition of STRAP, which regulates the localization of SMN complexes and further affects the assembly of snoRNP, can effectively reduce maturation of rRNA and significantly suppress progression of TP53-mutant or low p53 expression pancreatic cancer cells in vitro and in vivo. Our study highlighted the actual contribution rate of driver genes to patient prognosis, enriching traditional understanding of the relationship between these genes and PDAC. We also provided a possible mechanism and a new target to combat progression of TP53-mutant PDAC patients.
Introduction
Pancreatic ductal adenocarcinoma (PDAC) is one of the deadliest human malignancies (1), with >95% mortality rate and a 5-year survival rate of less than 9% (2). It is known as the “king of cancer” due to its high degree of malignancy and currently the fourth leading cause of cancer-related deaths in the United States (2), and is expected to become the second within the next decade (3). Surgical resection is the only curative treatment for PDAC; however, this tumor is difficult to detect and quickly spreads locally or metastasizes to distant organs by the time of initial diagnosis. Therefore, less than 20% of patients have a chance of resection (4). Furthermore, most patients who undergo pancreatic resection experience local or systemic recurrences, with a median post-resection survival rate of less than 20 months (5, 6). Therefore, finding the underlying mechanisms that influence the prognosis of PDAC is an urgent need requiring the exploration of novel adjuvant therapeutic strategies to improve the survival rate of patients.
Studies have shown that the occurrence of PDAC is caused by genetic mutations (7, 8). In recent years, with the development of next-generation sequencing technology, alterations in hundreds of genes related to axon guidance, DNA damage repair, chromatin remodelers, cell cycle regulation, and focal amplifications in druggable genes have been identified by whole genome, whole exome, and targeted deep sequencing in a large number of PDAC patients (9–11). KRAS, TP53, CDKN2A, and SMAD4, referred to as “driver genes,” are the most frequently mutated genes and are well recognized as a contributing factor to pancreatic carcinogenesis (12, 13). Mutations in KRAS are present in more than 90% of patients (14) and are known to be related to the initiation of PDAC (15). Inactivating mutations of TP53, CDKN2A, and SMAD4 occurred in 15–80% of PDAC patients and 30–75% had mutations in at least two of the four genes (16–18). Several studies (19–21) explored the relationship between driver genes and prognosis and largely found that these genes were associated with disease prognosis. Further, other studies (22, 23) showed that the higher the number of mutations occurring in these driver genes, the worse the prognosis, especially in patient with mutations in more than three genes. However, these studies did not take into account the possible effects of coexistence of mutations in the driver genes.
To explore the actual contribution rate of the four-driver genes to this disease, we analyzed the influence of mutation in a single gene on the prognosis of patients based on extensive sample sequencing data derived from public databases. This study also explored the possible mechanism affecting prognosis of PDAC and then investigated potential novel adjuvant therapeutic targets in vitro and in vivo.
Materials and Methods
Patient Material Acquisition and Extraction
Data for clinical parameters, somatic mutations, and gene expression of PDAC patients were downloaded from The Cancer Genome Atlas (TCGA) Portal1 and two other independent studies whose data were stored in the International Cancer Genome Consortium (ICGC) data portal2.
Mutation Annotation and Filtering
All mutations obtained from public datasets were subjected to re-annotation by ANNOVAR (24) as described in our previous studies (25, 26), including cytoband, gene region, functional effect, and amino-acid change. Then, we screened mutations in the exon region because these mutations might affect the function of the protein.
Survival Analysis
Multivariate Cox hazard regression was used to assess the impact of some prognostic factors. Then, we used the anova() function to estimate the significance of each variable. Median survival time and cumulative survival curves were determined by the Kaplan–Meier method and differences between/among the groups were analyzed using the log-rank test. P < 0.05 was considered statistically significant.
Differential Expression Analysis of Genes
Only genes with a normalized expression value more than 0 in over 20% of the samples were considered to be expressed. Differentially expressed genes (DEGs) of different prognosis subtypes were determined with Student’s two-tailed t-test. Since genes with expression levels that were too low reduced statistical credibility, we first excluded genes with expression levels below 5 in both of the groups used for comparison. Genes with a P ≤ 0.05 and | log2FoldChange| ≥ 1 were defined as differential genes. Simultaneously, RankCompV2 (27), a rank-based algorithm, was used for differential expression analysis and utilized to calculate DEGs with default parameters. This method was not affected by the level of gene expression.
Functional Enrichment Analysis
To identify enriched pathways and gene ontologies of gene sets, we performed enrichment analysis using the R package ClusterProfiler. For the pathway analysis, we used the pathway annotations package ReactomePA provided by Reactome Pathway Database. GO gene set collections were obtained from GO.db package. We performed Fisher’s exact test and permutation test to calculate P and OR values for enrichment analysis of the family genes or cluster genes. The permutation test was based on random sampling, as in our previous study (26). Specifically, we calculated the P by comparing the number of differential genes in this family/cluster to the number of genes from the family/cluster of 1,000,000 simulated datasets. Each simulated dataset included the same number of total DEGs by random sampling.
Cell Lines
Mutant background of the pancreatic cancer cell lines was queried by Cancer Cell Line Encyclopedia (CCLE)3.
PANC-1, Patu-8988, and PANC-0327 cells were purchased from the American Type Culture Collection (Manassas, VA, United States). KP4 cell line was obtained from the Riken BioResource Center Cell Bank (Ibaraki, Japan). All the cell lines were cultured in either DMEM or RPMI-1640 media supplemented with 10% fetal bovine serum, and were free of mycoplasmas and authenticated by polymorphic short tandem repeat loci before use.
Cell lines stably overexpressing human p53 in TP53-mutant cells or p53-knockdown in TP53 non-mutant cells were generated by infecting cells with lentiviruses expressing p53 or p53 shRNA (MOI = 10; GeneChem Co. Ltd., Shanghai, China), respectively. STRAP-knockdown cells were generated by infecting cells with lentiviruses expressing two specific STRAP shRNAs (MOI = 10; GeneChem Co. Ltd.). Cells infected with lentiviruses expressing control empty vector or shRNA were used as controls. We selected successfully infected cells with puromycin (1 μg/ml) for 7 days.
Western Blot Analysis
Western blot analysis was performed as described previously (28, 29). The following commercially available antibodies were used in this study: GAPDH (Cell Signaling Technology, Shanghai, China; catalog no. 2118), p53 (ProteinTech, Wuhan, China; catalog no. 10442-1-AP) and STRAP (ProteinTech; catalog no. 18277-1-AP).
qPCR
Total RNA was isolated using TRIzol reagent (Life Technologies, Shanghai, China) and reverse-transcribed using the M-MLV reverse transcription kit (Promega, Madison, WI, United States). qPCR was carried out in an ABI 7500 Fast instrument (Life Technologies) using the SYBR Premix Ex Taq kit (TaKaRa, Dalian, China).
Ribosomal RNA Processing Analyses
We performed qPCR to evaluate rRNA processing. Gene-specific primers of 18S and 28S rRNA (Supplementary Table 1) and the calculation method for the fraction of unprocessed rRNA were determined as described previously by Cao (30). Specifically, the unprocessed rate of 18S rRNA was the averages of primer pairs 4/3 (unprocessed) over 2/1 (total) and primer pairs 6/5 (unprocessed) over 2/1 (total), and that for 28S rRNA was the averages of primer pairs d/c (unprocessed) over b/a (total) and primer pairs f/e (unprocessed) over b/a (total).
Cell Proliferation, Migration, and Invasion Assays
Lentivirus-transfected pancreatic cancer cells were plated into 96-well plates at a density of 3 × 10³ cells per well to test cell proliferation. The Cell Counting Kit-8 (CCK-8) reagent (Dojindo, Kyushu Island, Japan) was used to detect cell viability every 24 h for 3 days. The OD value (450 nm) was recorded to generate a cell proliferation curve.
Wound-healing assays were used to assess the migration ability of cells. Transfected cells were seeded into 12-well plates and then cultured for 24 h until 95% confluence. The confluent monolayer in each well was created using a 1,000 μl pipette tip and cultured for 48 h. Cells were photographed at 0, 24, and 48 h under a Nikon Eclipse TE2000-U Inverted Microscope (Nikon, Tokyo, Japan).
For the invasion assay, 2 × 10⁴ cells per well were plated into the upper chamber of a 24-well Transwell chamber (Corning, NY, United States) and coated with Matrigel and serum-free medium. Then, 500 μl complete medium with 10% FBS was added into the lower chamber. Cell migration through the Matrigel substrate was assessed after 24 h by fixing it in 4% paraformaldehyde, staining with 1% crystal violet (Sigma), and counting the migrated cells by selecting five fields at random under a light microscope.
Animal Studies
All animal studies and procedures were approved by the Institutional Animal Care and Use Committee of Wenzhou Medical University. Tumor xenografts were generated by adding 5 × 10⁶ Patu-8988 cells with p53 overexpression (LV-pP53) or control empty vector (LV-Con) and 5 × 10⁶ KP4 cells with p53-knockdown (LV-shP53) or control shRNA (LV-shCon) to 100 μl PBS, and then subcutaneously injected into each flank of 6-week-old female athymic BALB/c nude mice. When the volume of the tumors was about 100 mm3, mice were randomly assigned to two groups (5 mice/per group) and then received an intratumoral injection of shSTRAP-1 or shCon at a titer of 107 TU in 10 μl PBS every 3 days, which was repeated three times. The volume of tumors was calculated with the following formula: V = (Width2 × Length)/2. Mice were sacrificed 35 days following tumor injection. The investigator was not blinded to group allocation during the experiment but was blinded when assessing the xenograft tumor volumes following euthanasia of the mice.
Results
Data Collection
In total, we retrieved detailed clinical information from 923 PDAC patients, which included 784 somatic mutations, and 279 RNA sequences from three independent PDAC-related studies, including TCGA, and two other independent studies stored in ICGC (PACA-AU, PACA-CA) (Supplementary Table 2). There were 762 PDAC samples with both survival information and somatic mutation data. Patients of TCGA, PACA-AU, and PACA-CA were from the United States, Australia, and Canada, respectively. Data utilized from all three countries included 154, 461, and 308 follow-up survival data, 133, 391, and 260 somatic mutation information, and 142, 91, and 46 RNA sequence data, respectively.
Multivariate Analysis of the Clinical Parameters Regarding the Prognosis of Patients With PDAC
Due to the lack of detailed clinical data, we only assessed the impact of some parameters on prognosis (Supplementary Table 3). Using multivariate Cox analysis, we found no difference in survival rates among patients in the three databases (P = 0.58). Further, we analyzed the effects of gender and age on the prognosis of patients and found no difference. However, the number of mutations in driver genes had a significant effect on the prognosis of patients (P = 0.0028), which is consistent with previous reports (19–21).
Next, we analyzed the mutation frequency of the driver genes in the patients and found that it was consistent with previous results: more than 90% (90.43%) of patients had KRAS mutations. Patients carrying TP53, SMAD4, and CDKN2A mutations were 69.13, 23.21, and 20.66%, respectively. Moreover, nearly 75% (74.74%) of patients were carrying more than two mutations at the same time. Among them, 98.63% of patients had KRAS mutations (Supplementary Table 4).
Analysis of Prognosis in Patients With Mutations in Driver Genes
Since the KRAS mutation is present in almost all patients and is the initiator of the disease, we analyzed the prognosis of patients with only KRAS mutations and those without any driver gene mutations and found no difference between the two groups (Figure 1A). Therefore, when considering the contribution of mutations in the other three driver genes to prognosis, activation of KRAS was used as the basis; hence we used it as the control group.
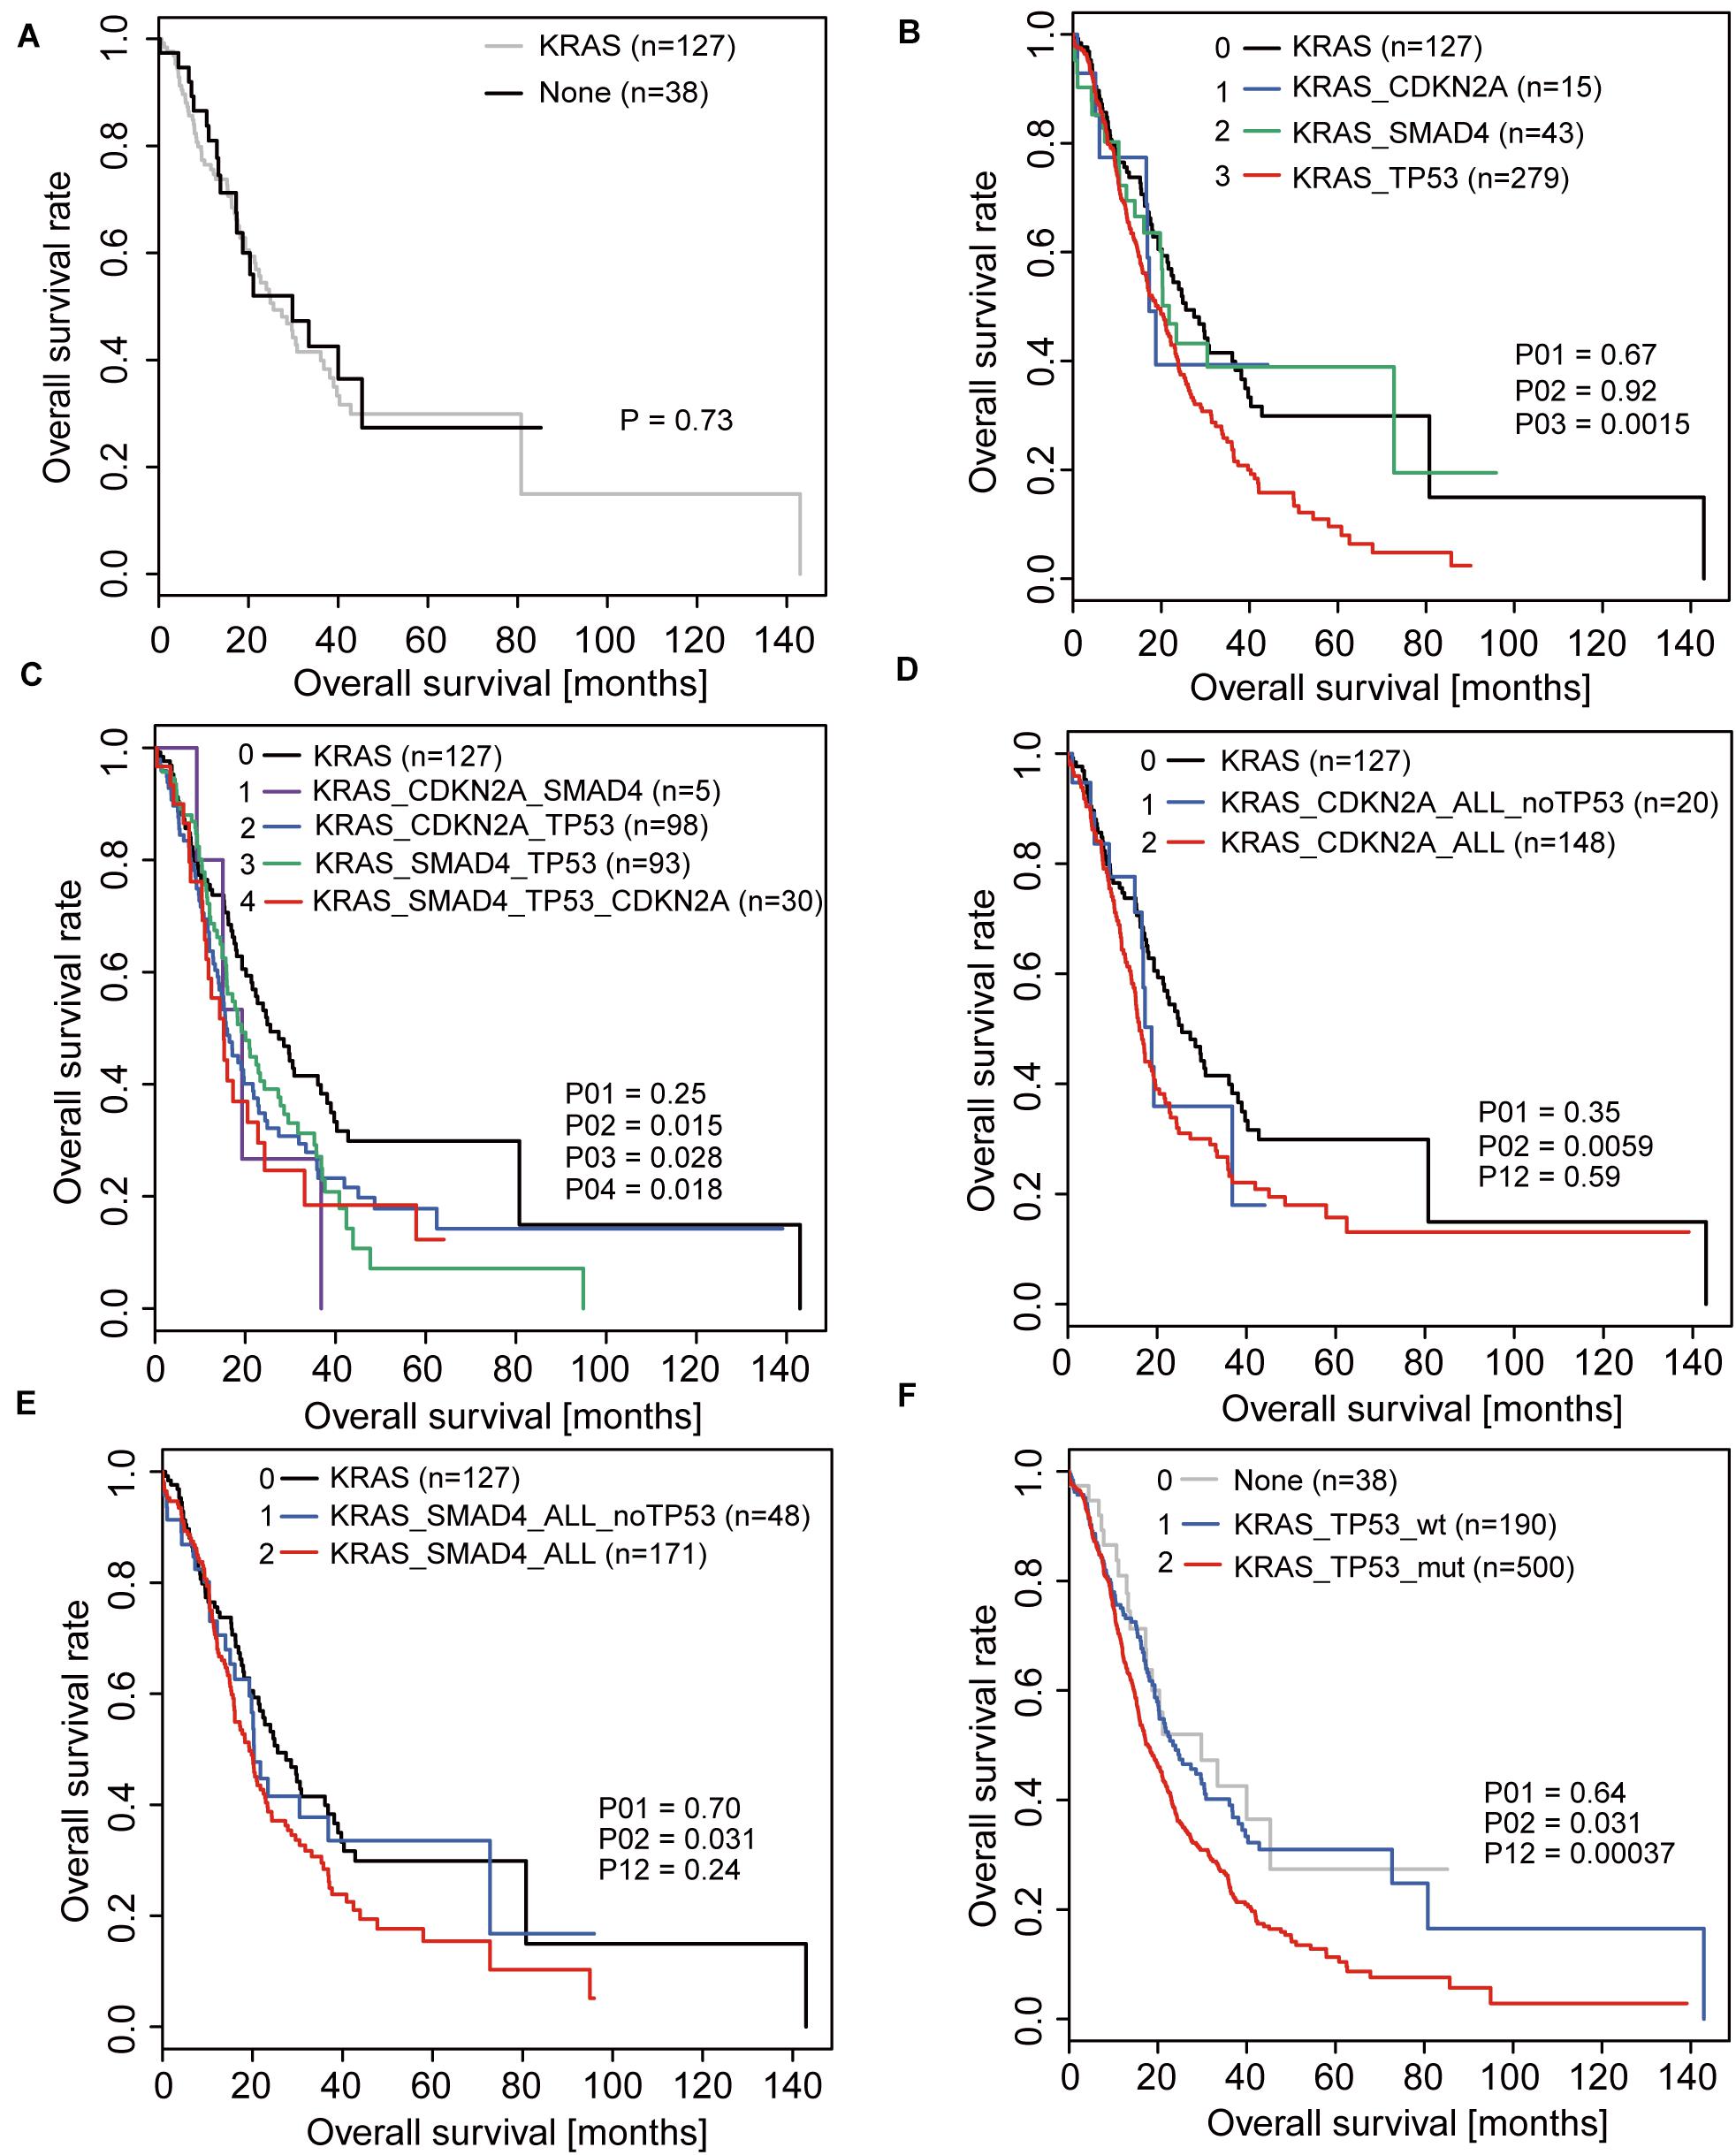
Figure 1. Overall survival (OS) analyses in PDAC patients correlated with driver gene mutations. (A) OS of patients with KRAS mutations only and without any driver gene mutations. (B) OS of patients with mutations in only one driver gene based on the activation of KRAS. (C) OS of patients with coexistence of mutations in driver genes based on the activation of KRAS. (D,E) OS of patients with CDKN2A mutations (D) or SMAD4 mutations (E) when considering and not considering TP53 mutations. (F) OS of patients with and without TP53 mutations.
When analyzing the effects of TP53, SMAD4, and CDKN2A mutations on the prognosis of patients, we first analyzed the overall survival of patients with mutations in only one of the three driver genes based on the activation of KRAS and found that only patients with TP53 mutations were significantly different from the control group (Figure 1B). Under conditions of coexistence of mutations in two or three driver genes, we also found that only patients with TP53 mutations simultaneously had a significant difference in prognosis compared to the control group (Figure 1C). This suggests that TP53 may play a significant role in affecting patient prognosis.
To further confirm whether the influence of other driver gene mutations on prognosis was due to the coexistence of TP53 mutations, we re-analyzed the relationship between CDKN2A and SMAD4 mutations in relation to prognosis. Consistent with the original conclusion, we found that the prognosis of patients with CDKN2A or SMAD4 mutations was significantly worse than that of patients without mutations when the TP53 mutation status was not considered (Figures 1D,E). However, when patients with TP53 mutations were excluded, the prognosis between the two groups of patients exhibited no significant difference (Figures 1D,E).
In summary, the above results indicated that TP53 is the real key factor leading to poor prognosis. The prognostic analysis revealed that the prognosis of patients with TP53 mutations was significantly reduced compared to that of patients without TP53 mutation after KRAS activation (Figure 1F).
TP53 Affects the Progress of Pancreatic Cancer Cell Lines in vitro and in vivo
We selected pancreatic cancer cell lines PANC1 and Patu-8988 with both KRAS and TP53 mutations and KP-4 and PANC-0327 with only KRAS mutations to verify the dependence of pancreatic cancer survival on TP53 (Supplementary Table 5). CCK8 proliferation assay results demonstrated that overexpression of TP53 (LV-pP53) in PANC1 and Patu-8988 displayed a significant decrease in cell proliferation compared with that in the control group (LV-Con) (Figures 2A,B). Wound-healing assays indicated that the migration distance of the LV-pP53 group was shorter than that of the control group (Figure 2C). In parallel, the results of the Transwell invasion assay showed that the invasion ability of LV-pP53 was lower than that of the control group (Figure 2D). Similarly, we also found that overexpressing p53 could effectively suppress xenograft tumor growth (Figure 2E). However, compared with those in the control group (LV-shCon), the proliferation, migration, invasion, and xenograft tumor growth of p53-knockdown in KP-4 and PANC-0327 (LV-shP53) were promoted (Figure 3).
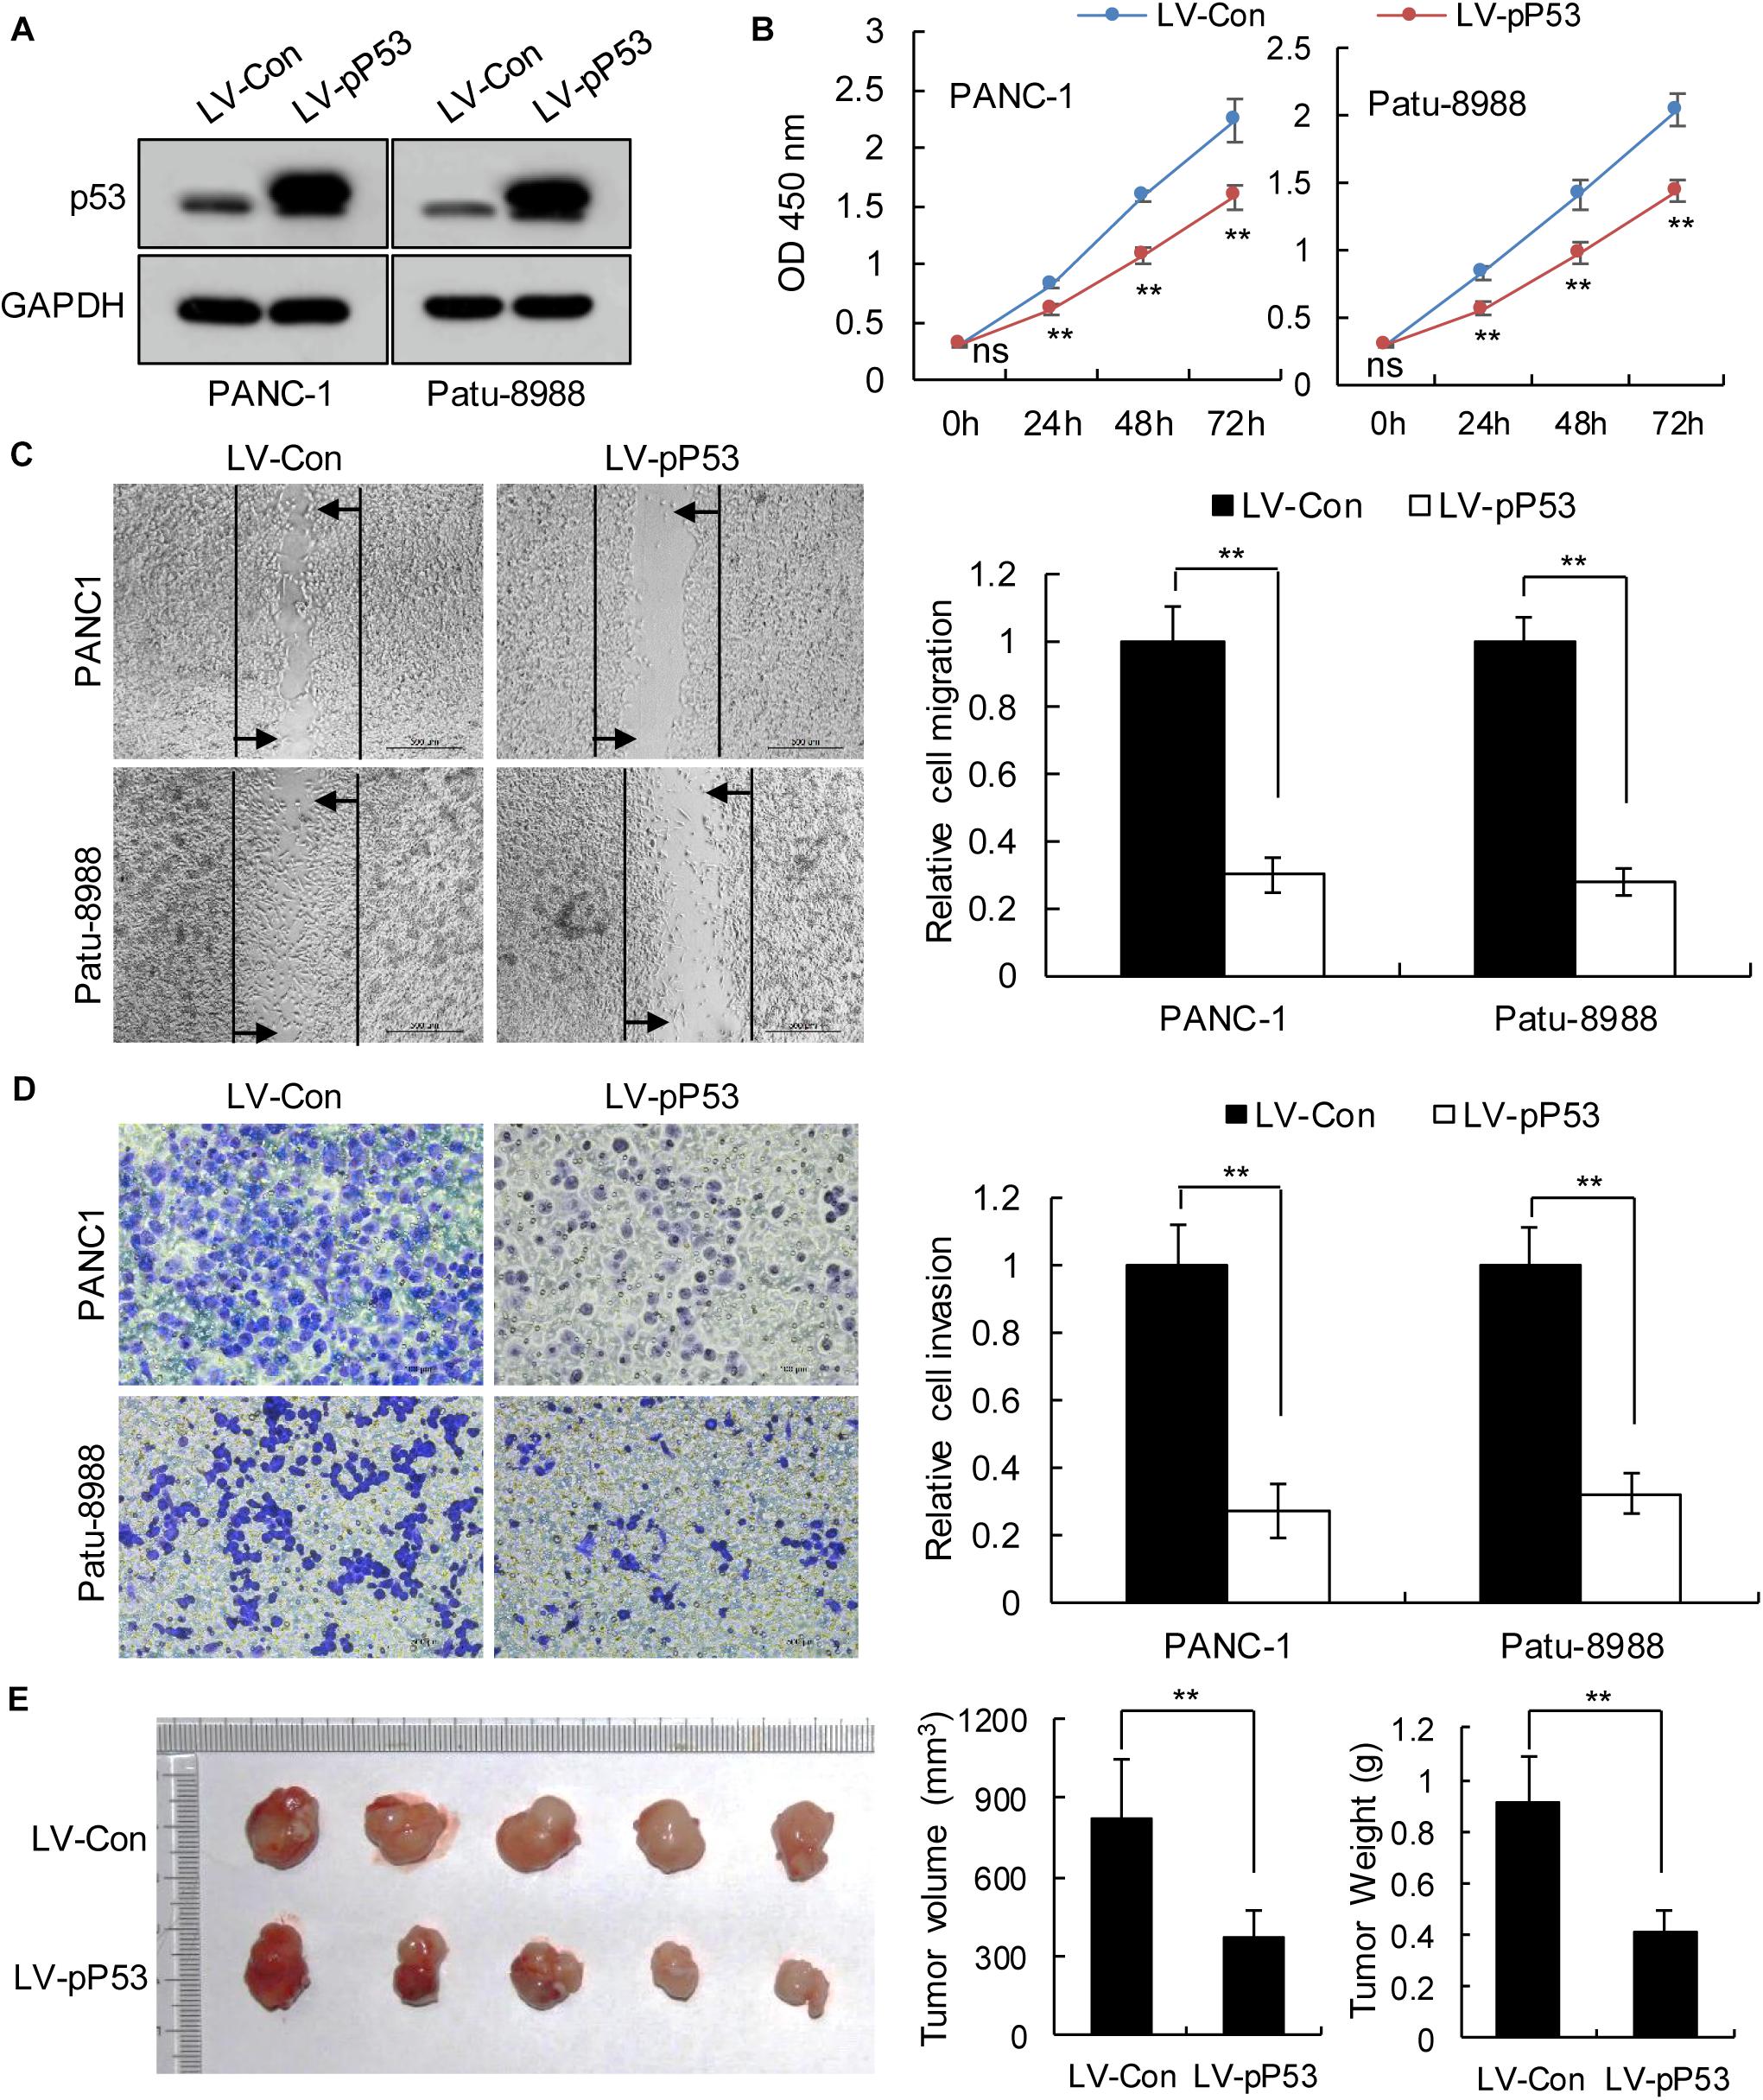
Figure 2. Overexpression of p53 in TP53-mutant pancreatic cancer cells suppressed cancer progression in vitro and in vivo. PANC-1 and Patu-8988 cells were infected with control or over-expressing TP53 lentiviruses. (A) p53 expression was analyzed by western blotting. (B) The cell proliferation assay was performed at the indicated time points. (C) Representative micrographs of cell migration assays at 48 h (left) and quantification results (right). (D) Representative micrographs of cell invasion assays (left) and quantification results (right). Data in panels (B–D) are shown as the mean ± SEM of 3 independent experiments. (E) Representative images, volumes and weights of subcutaneous xenografts of Patu-8988 cells with overexpressing p53 or control. Data represent means ± SEM for 5 mice per group. **P < 0.01.
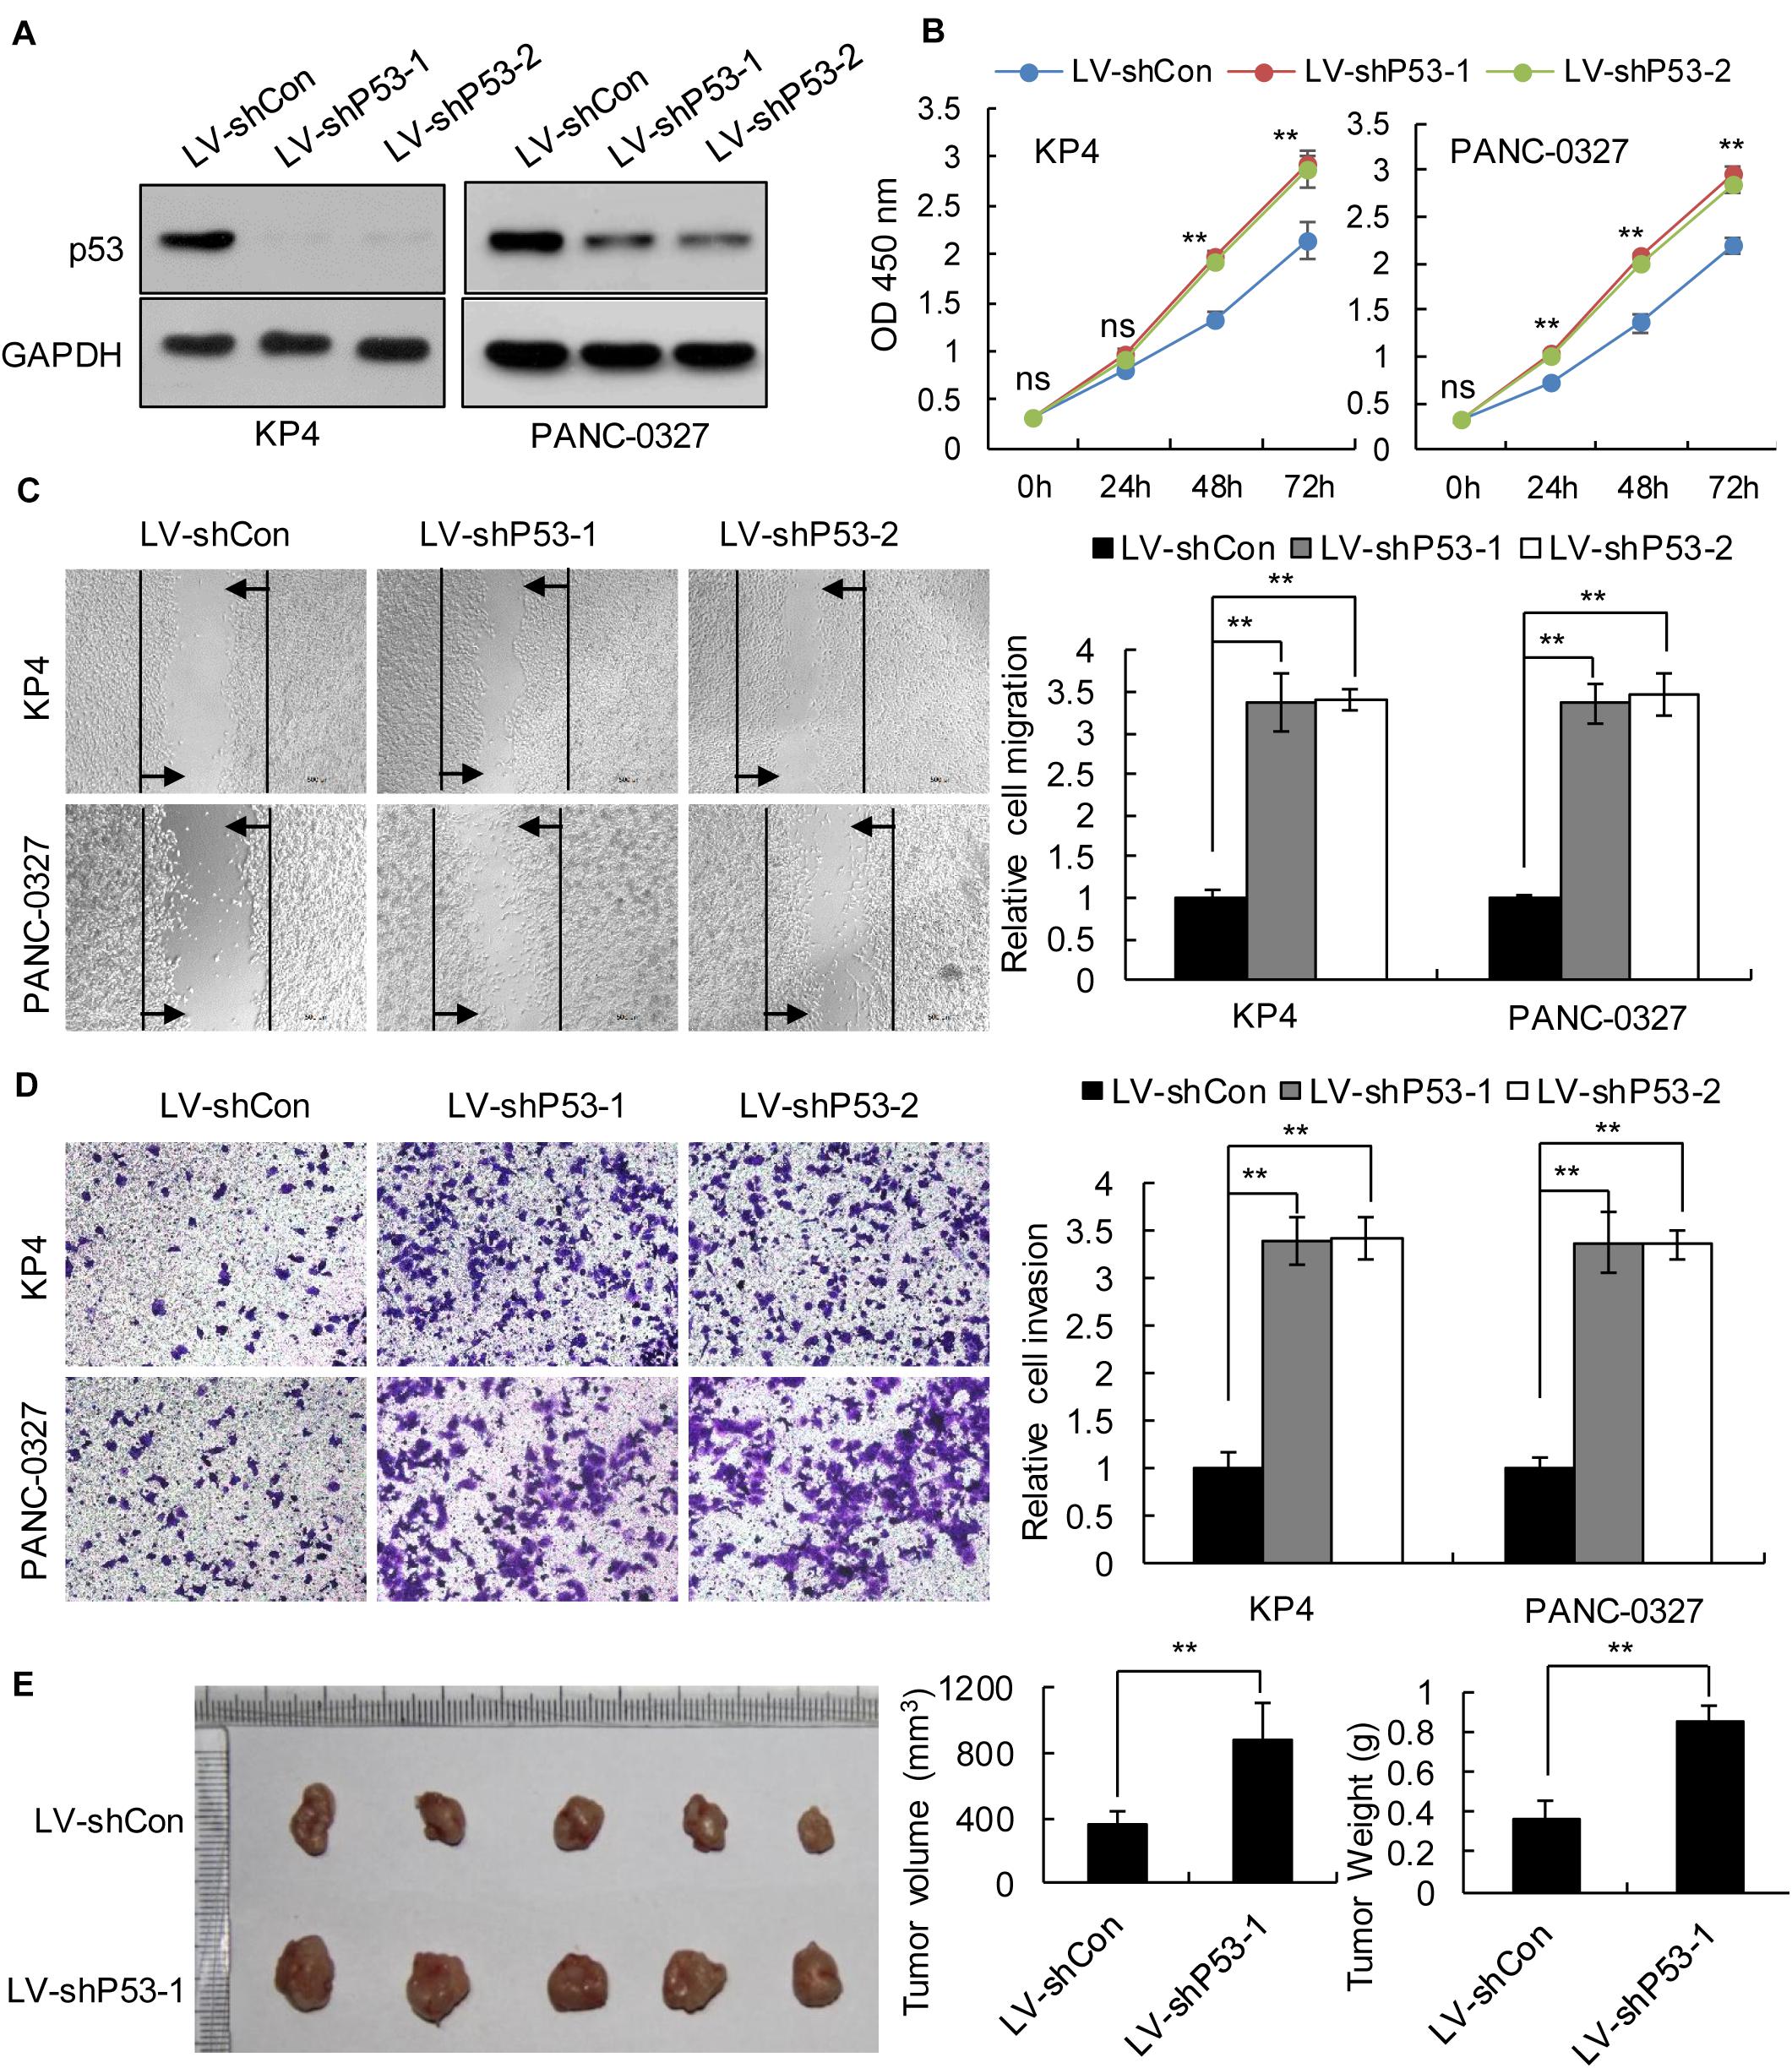
Figure 3. Knockdown of p53 in TP53 non-mutant pancreatic cancer cells promoted cancer progression in vitro and in vivo. KP4 and PANC-0327 cells were infected with control or p53-knockdown lentiviruses. (A) p53 expression was analyzed by western blotting. (B) The cell proliferation assay was performed at the indicated time points. (C) Representative micrographs of cell migration assays at 48 h (left) and quantification results (right). (D) Representative micrographs of cell invasion assays (left) and quantification results (right). Data in panels (B–D) are shown as the mean ± SEM of 3 independent experiments. (E) Representative images, volumes and weights of subcutaneous xenografts of KP4 cells with p53 knockdown or control. Data represent means ± SEM for 5 mice per group. **P < 0.01.
Analysis of Differentially Expressed Genes and Their Functional Pathways
In order to find out the mechanism by which TP53 mutation affects prognosis, we divided patients from public sources into two groups based on TP53 mutation status: TP53_mut and TP53_wt. Then, we analyzed DEGs by Student t-test and RankCompV2. A total of 90 DEGs were identified by Student’s t-test, including 73 upregulated and 17 downregulated. RankCompV2 also found 90 DEGs, with 60 upregulated and 30 downregulated (Supplementary Table 6). We performed GO and pathway enrichment analyses to further investigate functional pathways associated with the DEGs. Results showed that genes were enriched in several biological processes and pathways that are known to be associated with nucleosome assembly and the transcriptional regulation of genes, such as chromatin assembly (GO: 0031497), DNA packaging (GO: 0006323), chromatin silencing (GO: 0006342) and RNA Polymerase I Promoter Opening (R-HSA-73728), HDACs deacetylate histones (R-HSA-3214815), and DNA methylation (R-HSA-5334118) (Supplementary Figure 1 and Supplementary Tables 7, 8). More importantly, we noted that the functional pathways were involved in the regulation of rDNA (chromatin silencing at rDNA; GO: 0000183) and rRNA expression (SIRT1 negatively regulated rRNA expression; R-HSA-427359, NoRC negatively regulated rRNA expression; R-HSA-427413, B-WICH complex positively regulated rRNA expression; R-HSA-5250924) as well as the high enrichment of Cajal bodies RNAs and the snoRNA family genes (Table 1).
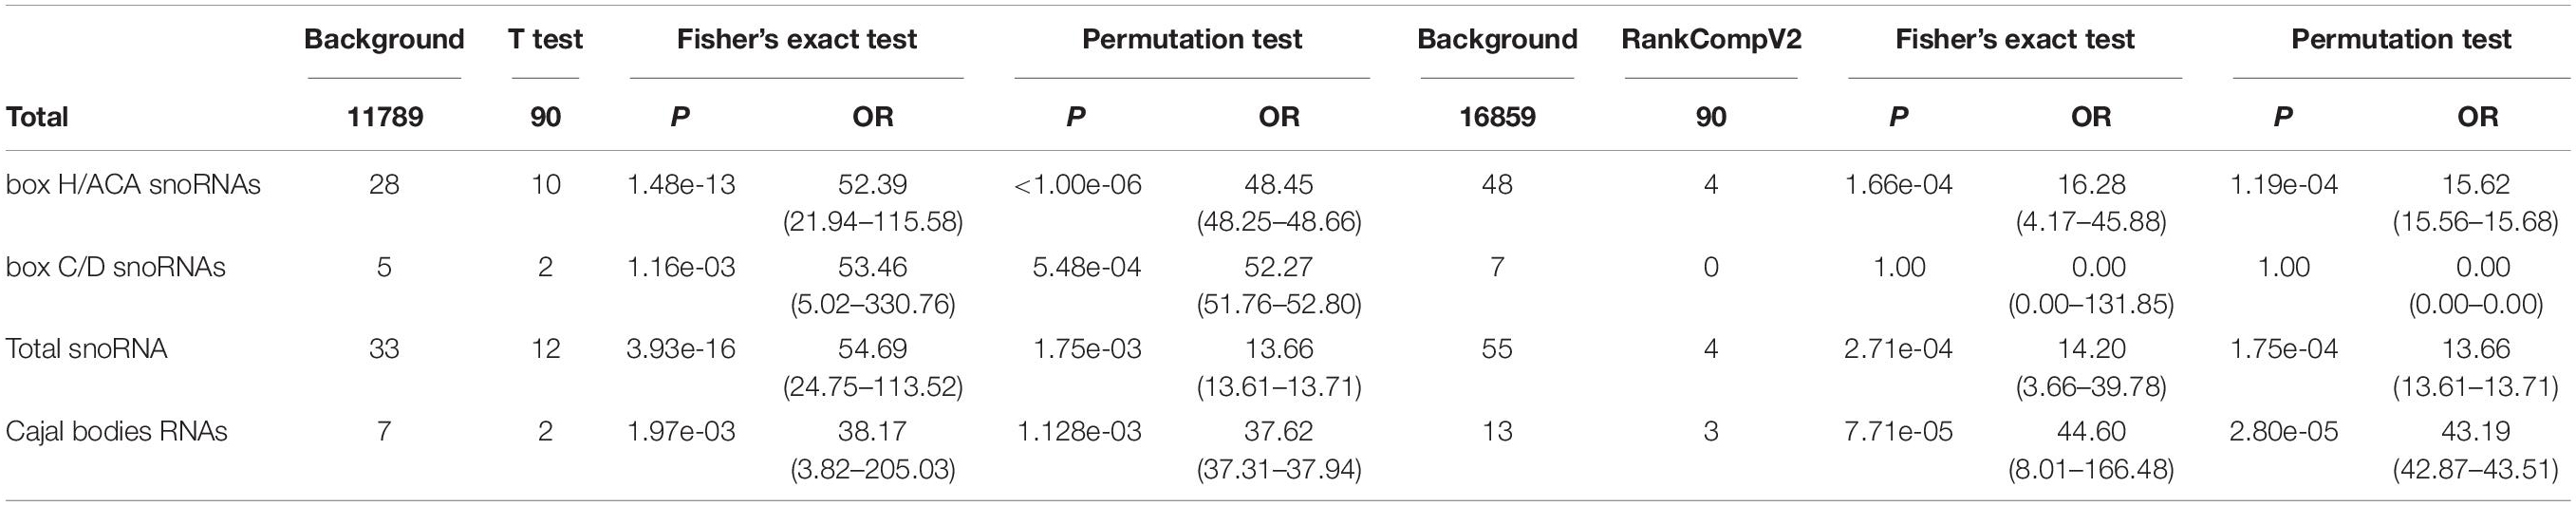
Table 1. Functional enrichment analysis of snoRNA family genes and related cluster genes.
TP53 Affects the Maturation of Ribosomal RNAs
In humans, snoRNAs are primarily responsible for the modification and maturation of ribosomal RNAs (rRNAs) (31). Global control of protein synthesis is crucial for cancer development and progression, as highly proliferating cancer cells require increased protein synthesis (32); therefore, more rRNAs may be needed to participate in protein synthesis. Thus, we hypothesized that snoRNA-mediated rRNA maturation might be a cause of cancer progression in patients with TP53 mutations. The prognostic analysis showed that upregulated snoRNA gene expression was significantly associated with poor prognosis (Figure 4A). qPCR analysis showed that the proportion of mature 18S and 28S rRNA was significantly decreased in the p53 overexpressing PANC1 and Patu-8988 in vitro and in vivo (Figures 4B,D), whereas p53 knockdown in KP-4 and PANC-0327 promoted the maturation of 18S and 28S rRNA in vitro and in vivo (Figures 4C,E).
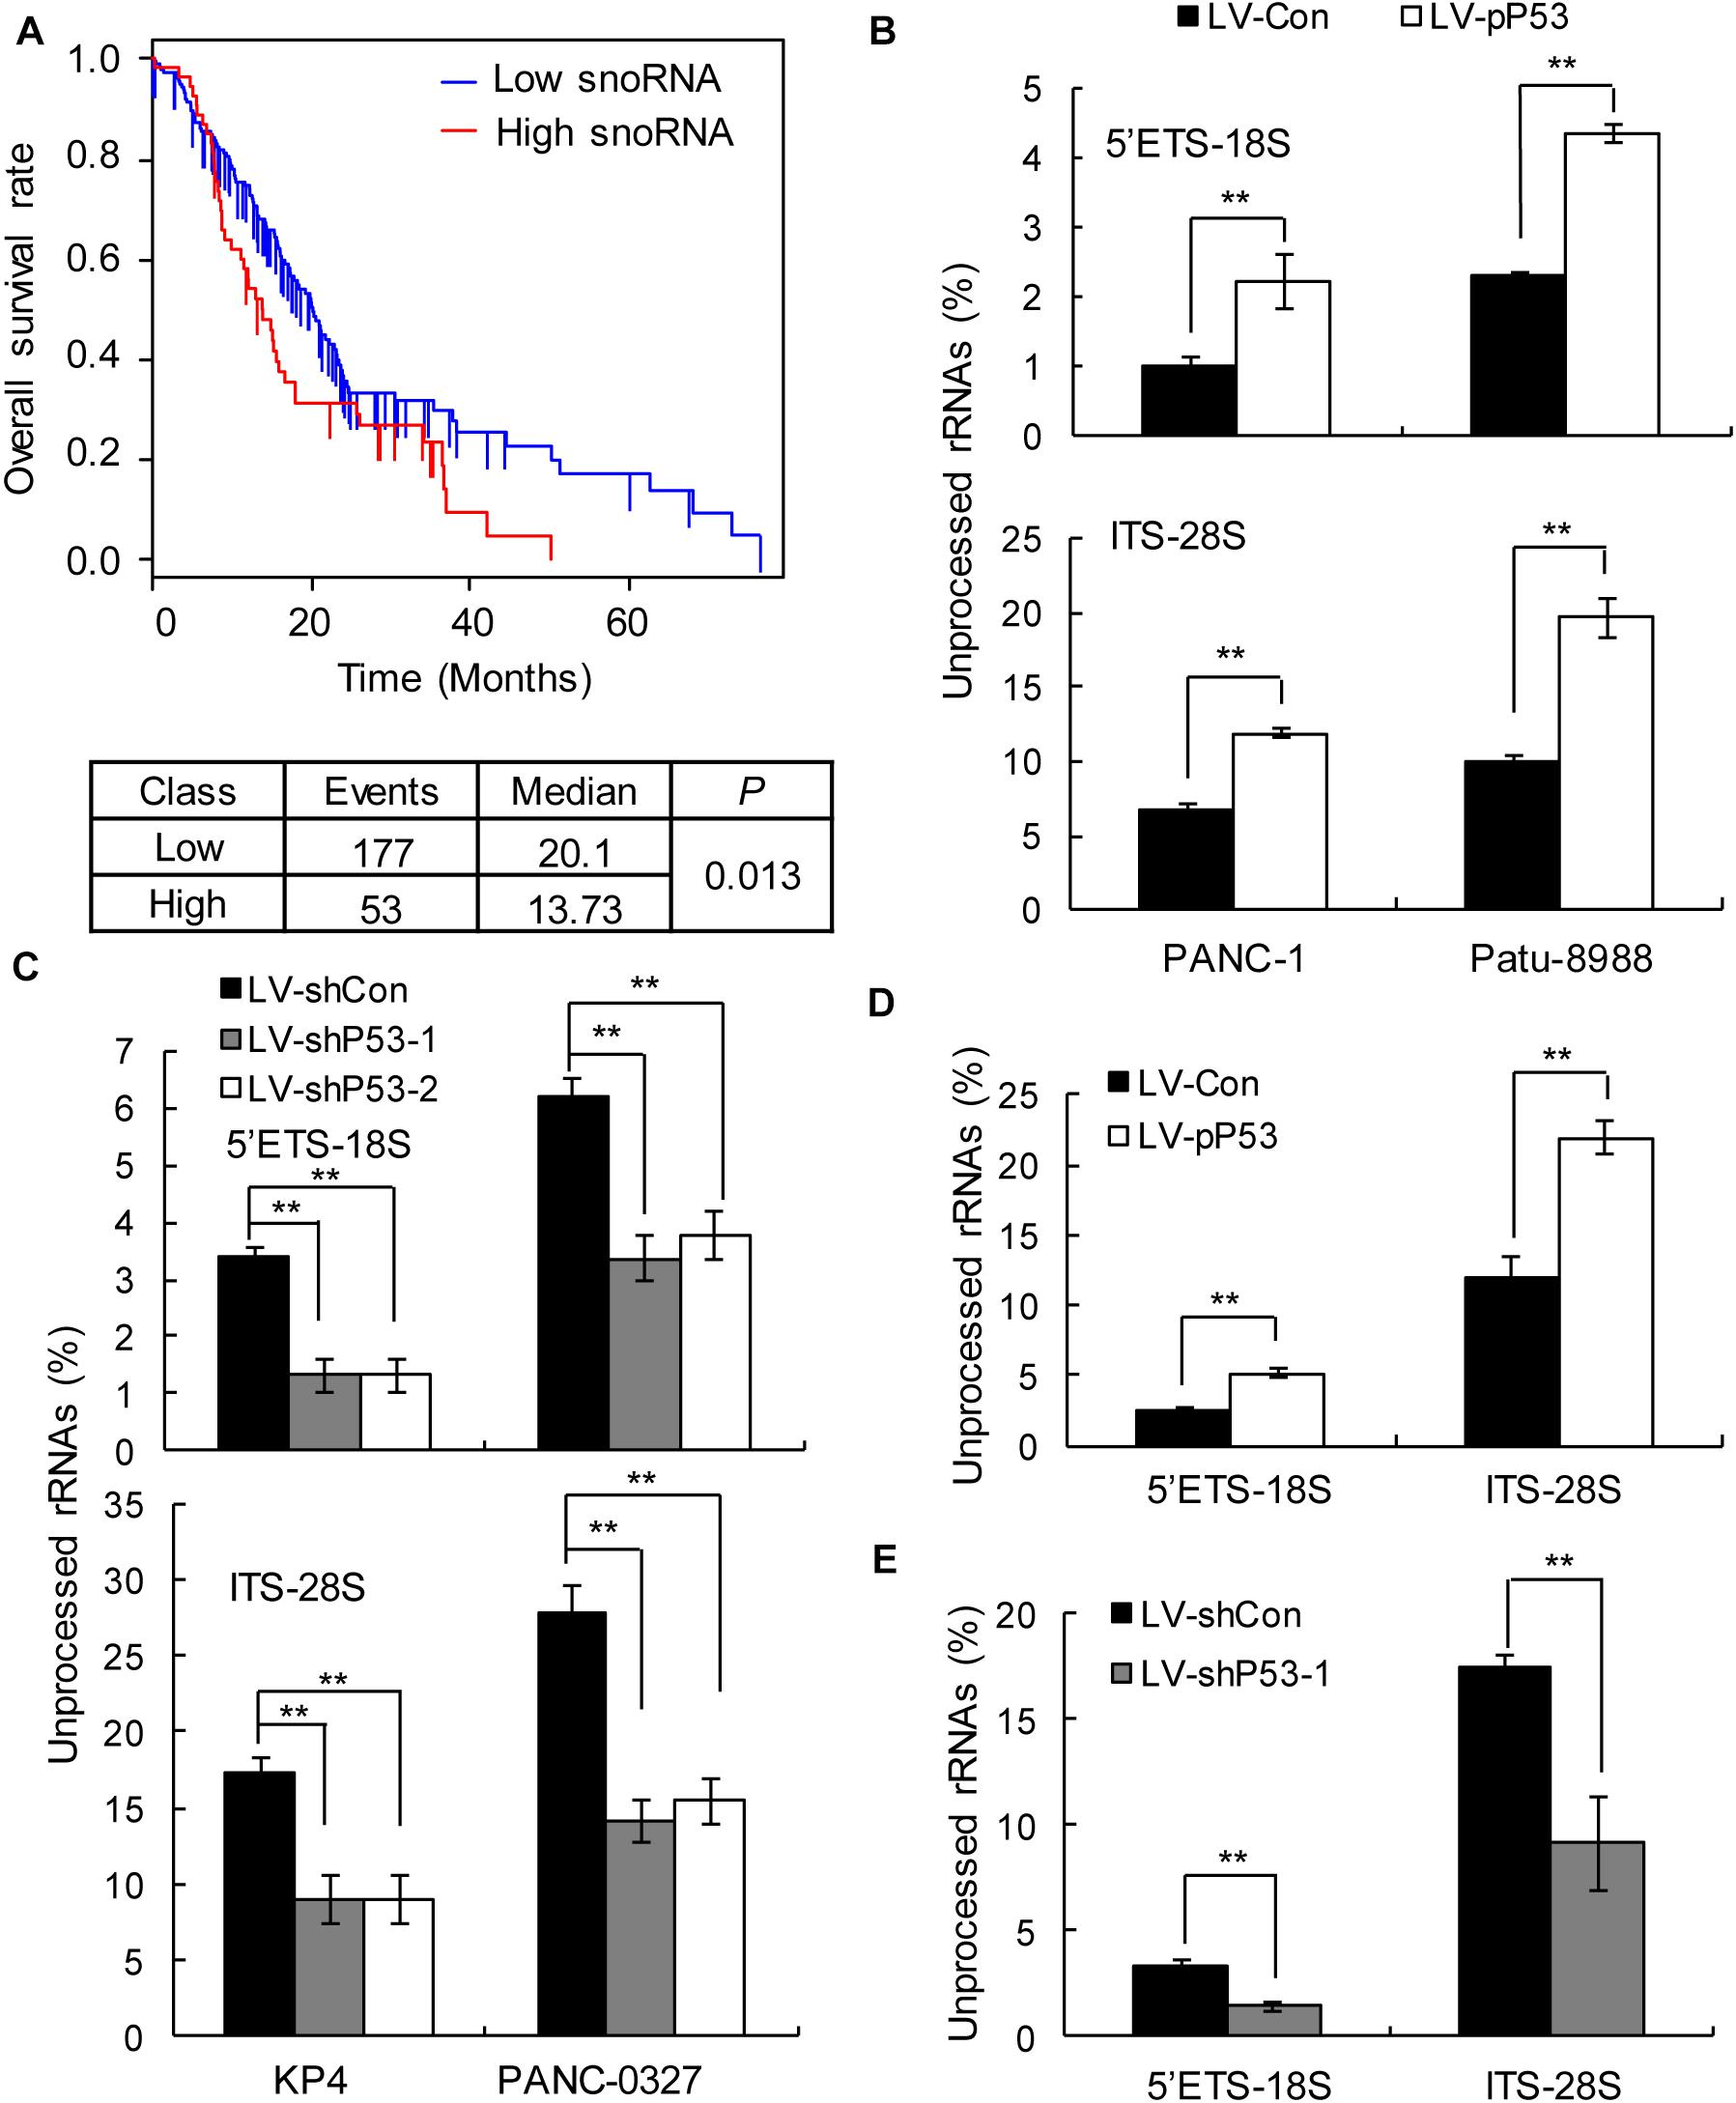
Figure 4. p53 expression is associated with snoRNA-mediated ribosome maturation. (A) Kaplan–Meier survival curves for PDAC patients according to the snoRNA family genes in tumor tissues, and significance was calculated using the log-rank test. (B,D) Overexpression of p53 in TP53-mutant cells in vitro (B) and in vivo (D) promotes rRNA processing by detecting 5’ETS-18S and ITS–28S using quantitative reverse transcriptase PCR assays in PANC-1 (left) and Patu-8988 cells (right). (C,E) Knockdown p53 in TP53 non-mutant cells in vitro (C) and in vivo (E) suppresses rRNA processing by detecting 5’ETS-18S and ITS–28S using quantitative reverse transcriptase PCR assays in KP4 (left) and PANC-0327 cells (right). The data are shown as the mean ± SEM of 3 independent experiments. **P < 0.01.
Knockdown of STRAP Effectively Blocks the Progression of Pancreatic Cancer Cells With Low p53 Expression in vitro and in vivo
STRAP, also known as UNRIP, is a serine/threonine kinase receptor-associated protein. Krastev et al. (33) found that STRAP affected the localization of SMN complex in a p53-independent manner, which in turn affected the assembly of snoRNP. Inhibition of STRAP could effectively reduce the proliferation and migration of TP53-mutant colon cancer cells without affecting the growth of TP53 non-mutated cancer cells (33). Our prognostic analysis of public data showed that downregulated STRAP significantly improved the prognosis of patients with PDAC (Supplementary Figure 2A), with the effect being better in the TP53 mutant state than in the non-mutated state (Supplementary Figures 2B,C).
To verify whether inhibition of STRAP was effective against TP53-mutant pancreatic cancer cells by inhibiting snoRNA-mediated rRNA maturation, we successfully constructed STRAP-interfering stable cell lines based on p53 overexpression (Figure 5A and Supplementary Figure 3A) or p53-knockdown (Figure 6A and Supplementary Figure 4A). Both in vitro and in vivo, knockdown of STRAP in the TP53 mutant state (Figures 5B–G and Supplementary Figures 3B–E) or p53-knockdown (Figures 6B–G and Supplementary Figures 4B–E) did indeed inhibit rRNA maturation and could effectively inhibit the development of cancer in vitro and in vivo, but there was no significant effect on the high p53 expression cell lines.
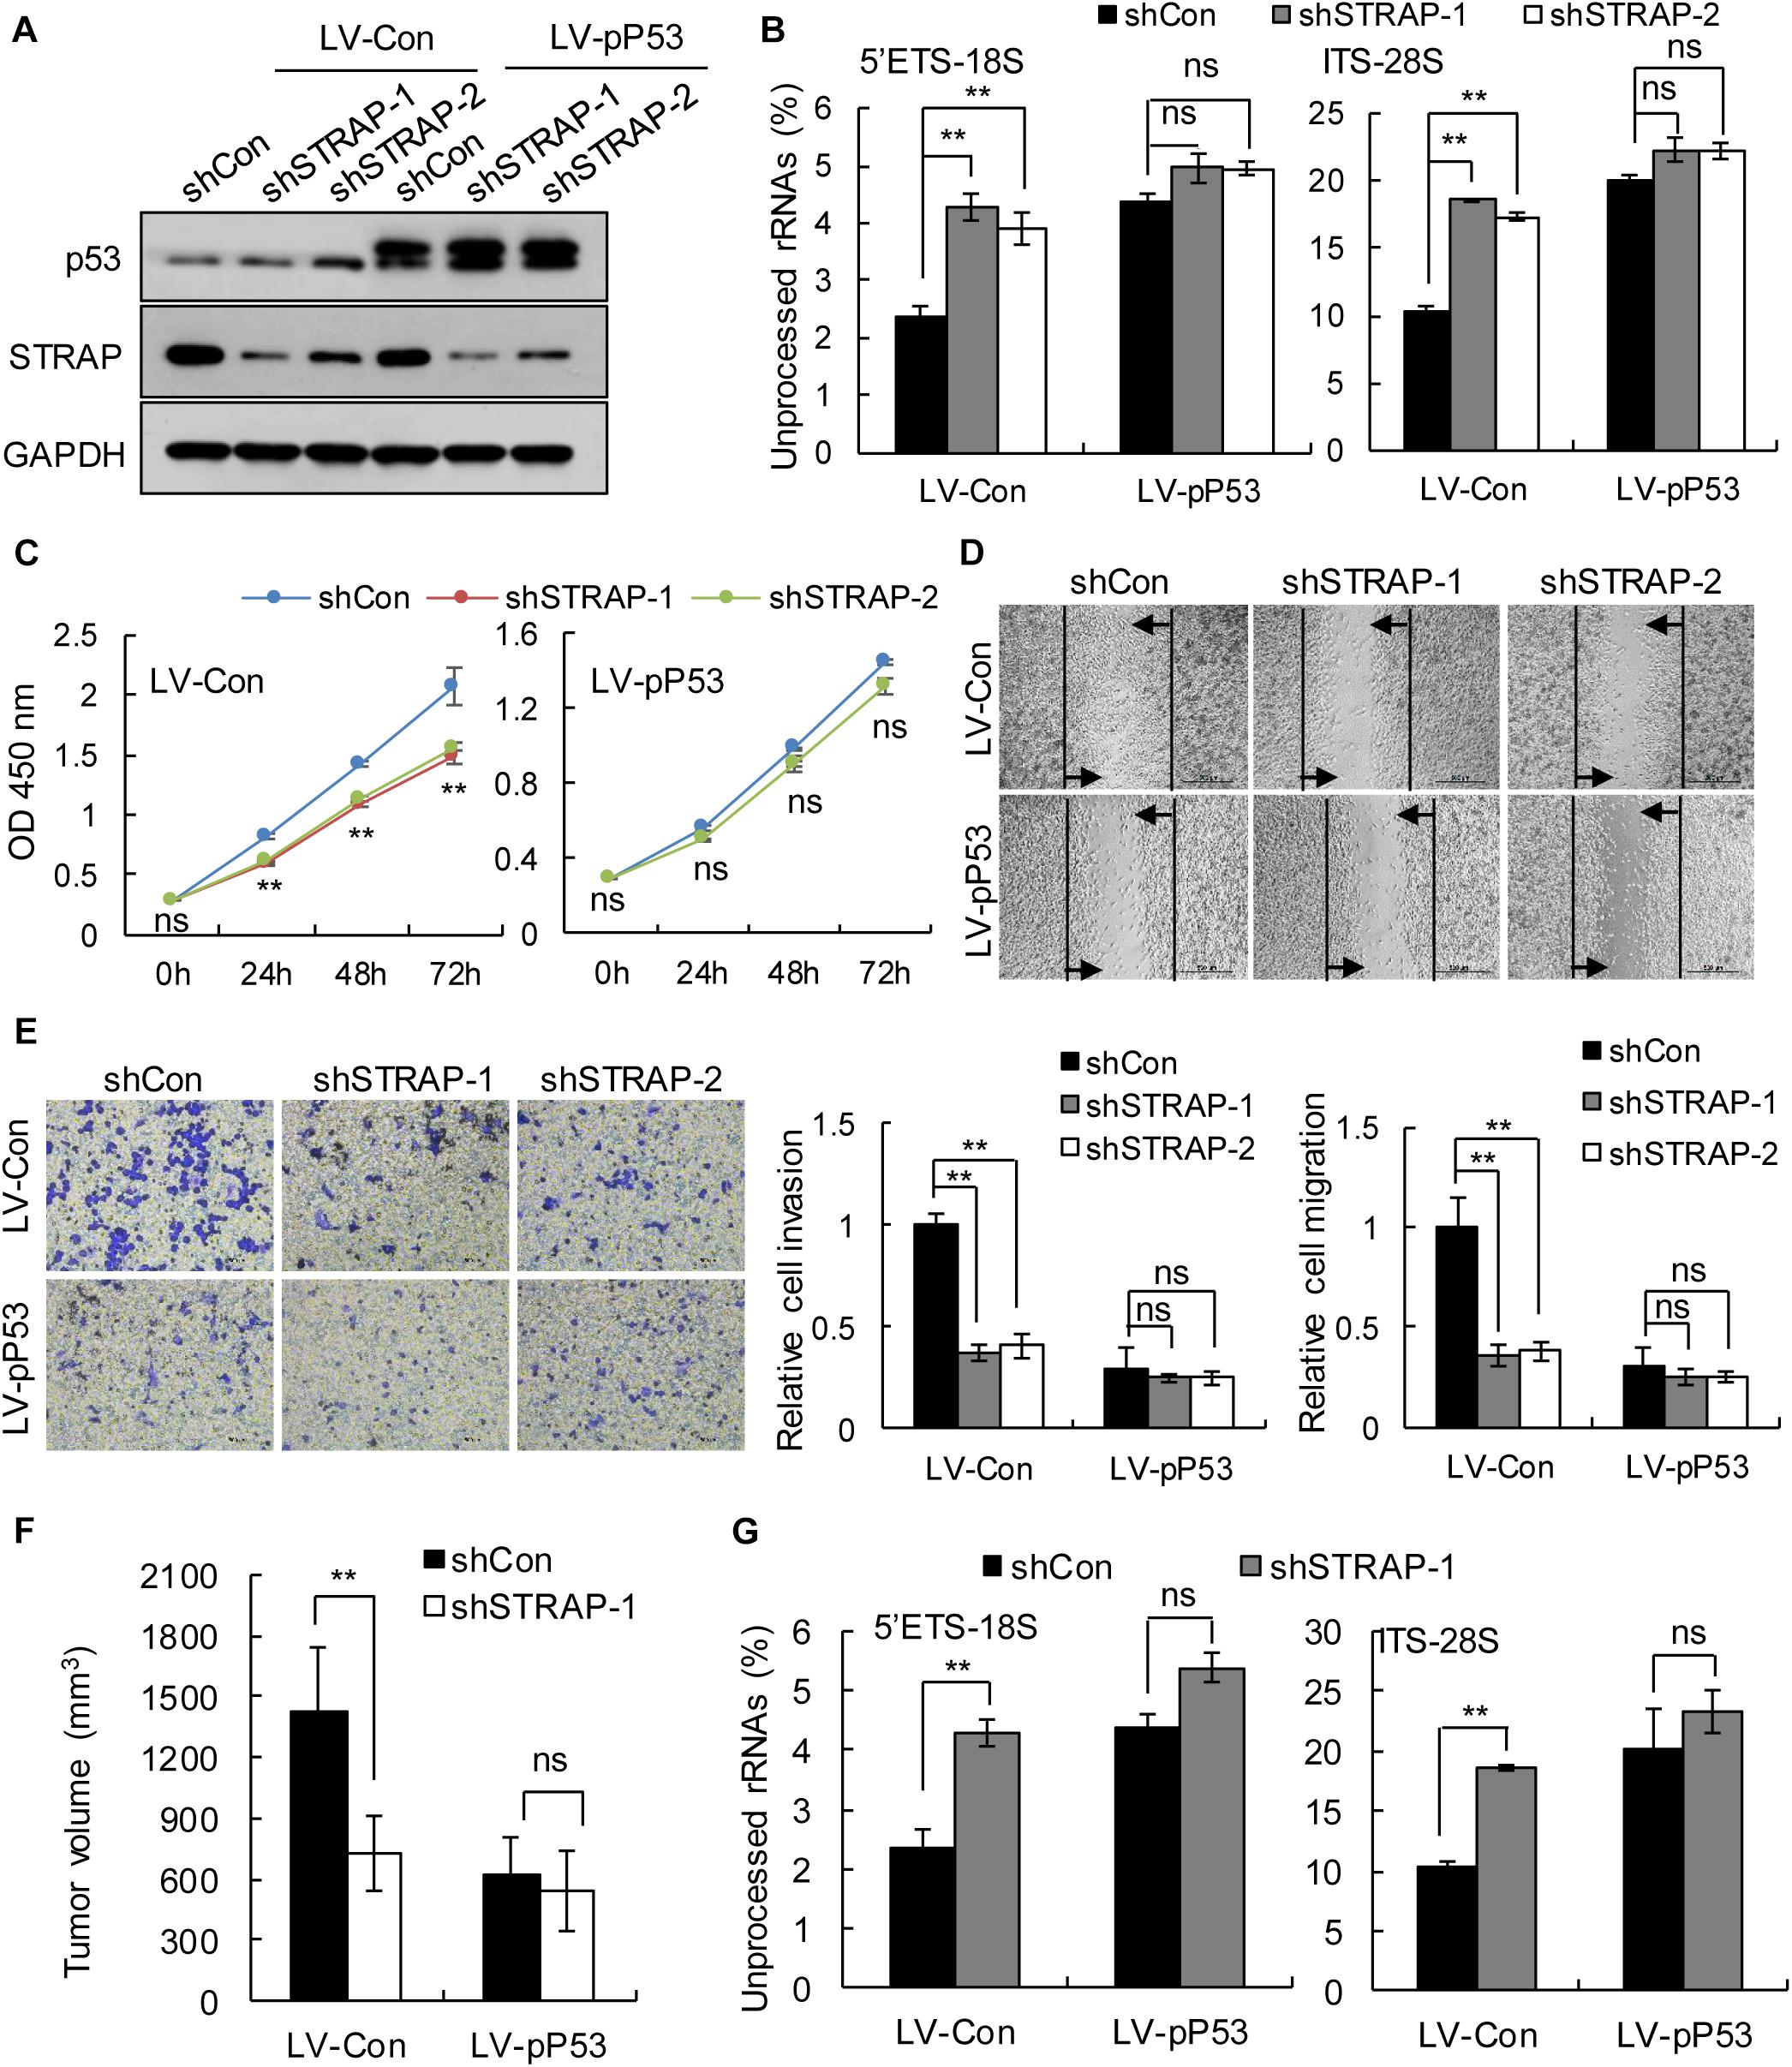
Figure 5. STRAP knockdown suppressed progression of TP53-mutant Patu-8988 cells by inhibiting snoRNA-mediated rRNA maturation. Patu-8988 cells with p53 overexpression or control vector were infected with control or STRAP-knockdown lentiviruses. (A) p53 and STRAP expression were analyzed by western blotting. (B,G) rRNA processing in vitro (B) and in vivo (G) by detecting 5’ETS-18S and ITS–28S using quantitative reverse transcriptase PCR assays. The data are shown as the mean ± SEM of 3 independent experiments. (C) The cell proliferation assay was performed at the indicated time points. (D) Representative micrographs of cell migration assays at 48 h (top) and quantification results (bottom). (E) Representative micrographs of cell invasion assays (left) and quantification results (right). Data in panels (C–E) are shown as the mean ± SEM of 3 independent experiments. (F) Representative volumes of subcutaneous xenografts of Patu-8988 cells with overexpressing p53 or control injected intratumorally with control or STRAP- knockdown lentivirus. Data represent means ± SEM for 5 mice per group. **P < 0.01.
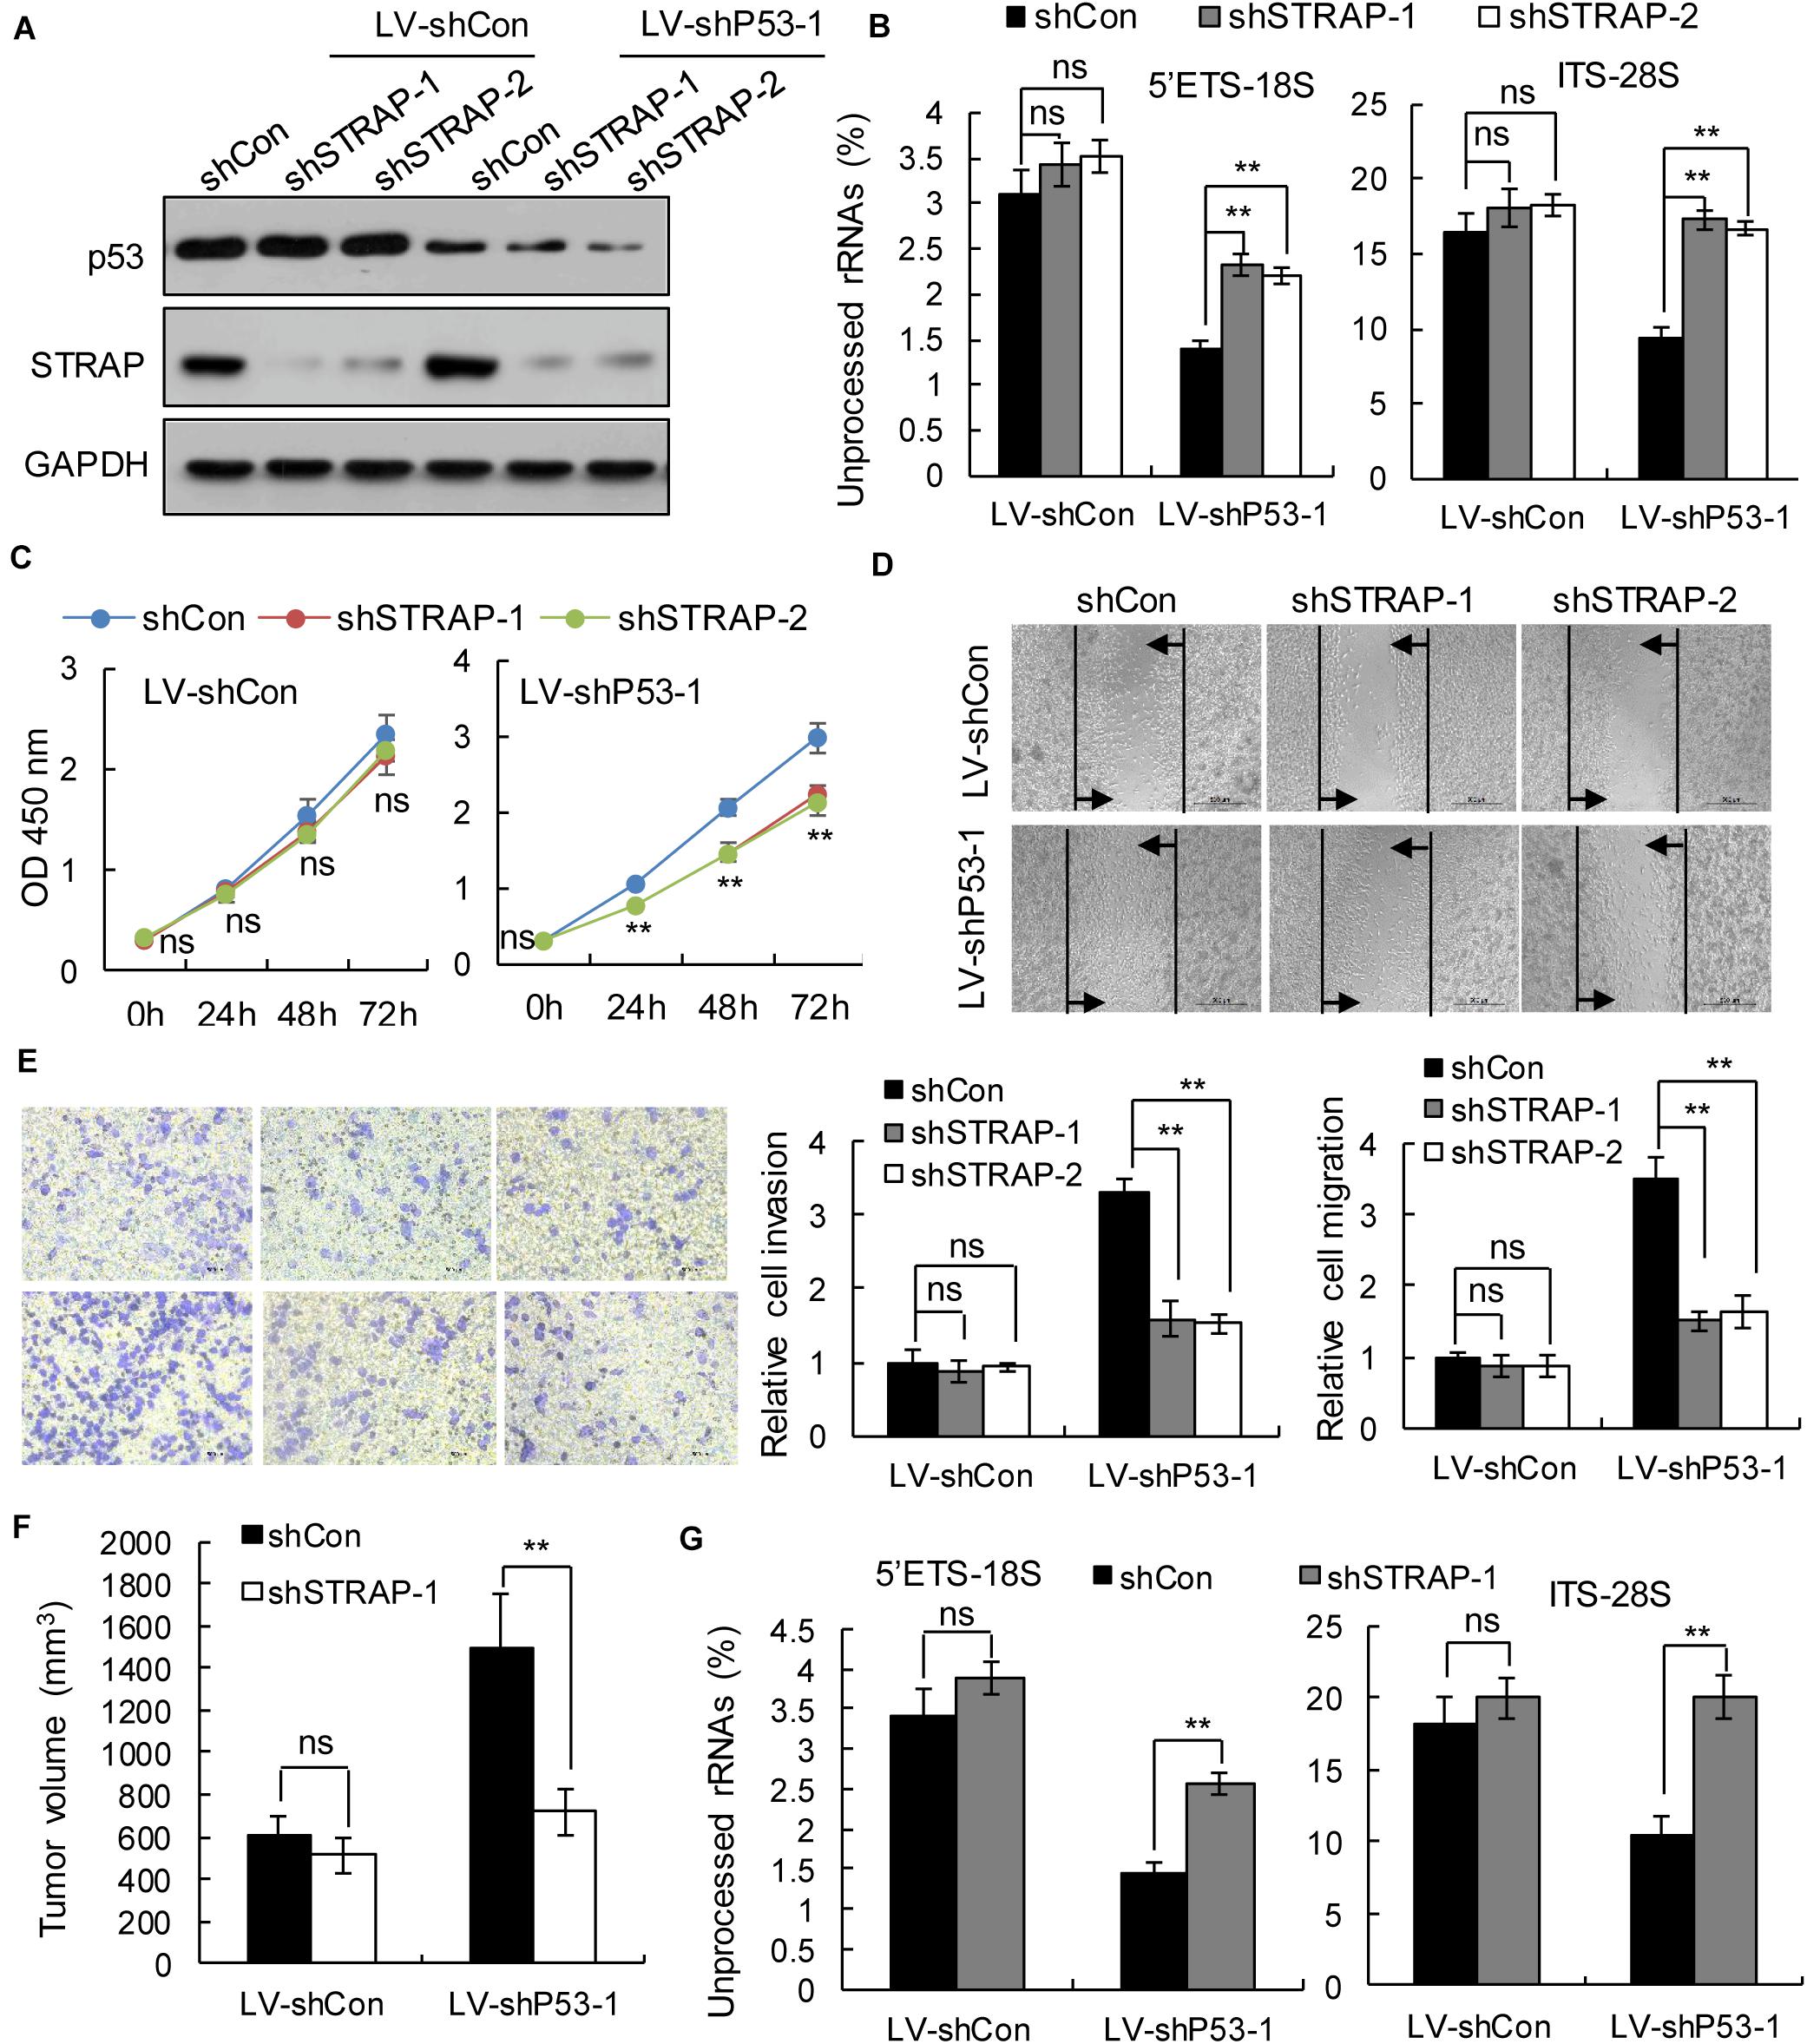
Figure 6. STRAP knockdown suppressed progression of p53-knockdown KP4 cells by inhibiting snoRNA-mediated rRNA maturation. KP4 cells with p53 knockdown or control vector were infected with control or STRAP-knockdown lentiviruses. (A) p53 and STRAP expression were analyzed by western blotting. (B,G) rRNA processing in vitro (B) and in vivo (G) by detecting 5’ETS-18S and ITS–28S using quantitative reverse transcriptase PCR assays. The data are shown as the mean ± SEM of 3 independent experiments. (C) The cell proliferation assay was performed at the indicated time points. (D) Representative micrographs of cell migration assays at 48 h (top) and quantification results (bottom). (E) Representative micrographs of cell invasion assays (left) and quantification results (right). Data in panels (C–E) are shown as the mean ± SEM of 3 independent experiments. (F) Representative volumes of subcutaneous xenografts of KP4 cells with p53 knockdown or control injected intratumorally with control or STRAP- knockdown lentivirus. Data represent means ± SEM for 5 mice per group. **P < 0.01.
Discussion
As the “king of cancer,” PDAC has a high mortality rate and poor prognosis (2). Therefore, it is of great significance to search for the key factors that affect the prognosis of PDAC patients and effective adjuvant treatment measures for clinical treatment of PDAC and increase the prognostic survival rate of patients. It is known that KRAS, TP53, CDKN2A and SMAD4 play an important role in the development of PDAC (12, 13), and are significantly associated with the prognostic survival of patients (19–23). However, mutations in at least two of these four driver genes are present in 30–75% of patients with PDAC (16–18). Is there a bias in the contribution of driver genes to patient survival? Will the relationship between a driver gene and patient prognosis be affected by mutations in other driver genes? This has not been noticed in previous research.
As the most frequent mutated genes in PDAC, KRAS, TP53, CDKN2A and SMAD4 have been well explored in many studies regarding their relationship with the prognosis of PDAC patients (19–23). Herein, we analyzed data from 762 patients with PDAC and explored the actual contribution rate of four driver genes to prognosis in the absence of coexisting mutations by combining multiple statistical and bioinformatics methods. This study differs from previous studies in that it considers the large number of coexisting mutations of the four driver genes in patients with PDAC, which may partially obscure the true contribution of each gene to patient prognostic survival rate. Interestingly, we found that compared with patients with other driver gene mutations, only patients with TP53 mutations simultaneously had a significantly lower prognosis than patients in the control group. Additionally, we found that the relationship between other driver gene mutations and prognosis will be affected by the existence of TP53 mutations. This reminds us that when studying the relationship between other driver genes and PDAC in the future, it is necessary to consider that the coexistence of TP53 mutations may have an impact on the results. Through in vitro and in vivo experiments, we also verified the necessity of p53 for the growth of pancreatic cancer. This finding highlighted the actual contribution rate and enriched the traditional understanding of the relationship between these genes and prognosis. However, the results were only based on the univariate analysis of driver gene mutation, other clinical parameters such as age and gender might also have some influence on the result. This requires in-depth research to enrich our conclusions in the future. In this study, we also explored the possible mechanism of p53 affecting patients prognosis. We found that compared with TP53 non-mutant patients, TP53-mutant patients have a high expression of snoRNA family genes, and their DEGs are significantly enriched in several biological processes and pathways related to the regulation of rDNA and rRNA. SnoRNAs are a family of conserved RNAs, concentrated in Cajal bodies or nucleoli where they either function in the modification of rRNAs or participate in the processing of rRNAs during ribosomal subunit maturation (34). Many studies have shown that snoRNA is abnormally regulated in tumors (35–47), and snoRNA or snoRNA host genes can affect the proliferation, apoptosis, invasion and migration of cancer cells (37–47). Okugawa et al. and Mei et al. found snoRA42 enhance the proliferation, migration, invasion in colorectal cancer (CRC) and Lung cancer (41, 42). Fang et al. found snoRD126 activate the PI3k-AKT pathway to facilitate hepatocellular carcinoma (HCC) and CRC cell growth (43). Cui et al. found snoRA23 promote growth and metastasis by regulates expression of SYNE2 in pancreatic ductal adenocarcinoma (PDAC) (38). Valleron et al. found snoRD112-114 affects Rb/p16 cell cycle regulation to promote cell growth in acute promyelocytic leukemia (APL) (44). Siprashvili et al. found snoRD50A and snoRD50B activate the K-Ras/B-Raf-MEK-ERK pathway to facilitate the proliferation of tumor cells (45). Wu et al. found snoRNA Sf-15 can participate in apoptosis through regulating the expression of Ca2 + -induced cell death pathway gene Cn in Sf9 cells (46). Xia et al. found SNORD44 activate the caspase-dependent apoptosis pathway to facilitate the apoptosis in glioma cells (47). However, these studies are focused on the function of a single snoRNA. In this study, we found that snoRNA family genes are dysregulated expressed in clusters, rather than the disorder of a single snoRNA gene. Therefore, we speculate that snoRNA-mediated rRNA maturation, which is the unified function of snoRNA, might be a cause of cancer progression in patients with TP53 mutations. Our prognostic analysis showed that upregulated snoRNA was significantly associated with poor prognosis in patients with PDAC. Experiments in vitro and in vivo have shown that the proportion of mature 18S rRNA and 28S rRNA is significantly reduced in p53 overexpressed PANC-1 and Patu-8988 pancreatic cancer cell lines, and knockdown of p53 in KP4 and PANC-0327 pancreatic cancer cell lines promoted the maturation of 18S rRNA and 28S rRNA. These results indicate that snoRNA-mediated rRNA maturation may be a possible mechanism for the progression of cancer in PDAC patients with TP53 mutations, but we believe that snoRNA-mediated rRNA maturation is not simply a surrogate for proliferation rate, other targets and pathways affecting the proliferation of TP53 mutant pancreatic cancer cells need further exploration, which is. a direction worthy of in-depth study in the future.
STRAP, a protein containing WD40 (48), is thought to play an important role in regulating eukaryotic cell growth and development by inhibiting transforming growth factor-beta (TGF-β) and various other signaling pathways (49–51). Recent studies have shown that overexpression and misregulation of STRAP are associated with the development of multiple cancers (52–54) and thus it could be considered a new therapeutic target for cancer. Our prognostic analysis showed that the expression of STRAP was significantly associated with the prognosis of PDAC patients. Krastev et al. (33) found that TP53 can regulate immature snoRNPs into the Cajal body by regulating the level of NOLC1, and then immature snoRNPs interact with COIL and SMN to assemble mature snoRNPs. STRAP plays an important role in regulating the cellular localization of SMN complex, which is necessary for the SMN complex to enter Cajal body (55, 56). As a downstream concomitant factor affecting snoRNP assembly by TP53, the expression of STRAP is currently known to be independent of p53 expression. Our study also found that there was no significant difference in STRAP expression between PDAC patients with TP53 mutation and patients with no TP53 mutation. Krastev et al. (33) also showed that knocking down STRAP had no effect on the growth of TP53 wild-type colon cancer cells, whereas expression of STRAP was required for efficient growth of TP53 knockout colon cancer cells. This shows that STRAP as a target for adjuvant therapy may provide a huge advantage in terms of mitigating toxic and side effects on TP53 non-mutated normal cells. Based on this, we successfully constructed STRAP-interfering pancreatic cancer cell lines with STRAP shRNA lentivirus, and verified their effects in vitro and in vivo. We found that knocking down STRAP could effectively inhibit rRNA maturation in vitro and in vivo and block the progression of pancreatic cancer cell lines with TP53 mutations or p53 knockdown, while there was no significant effect on the pancreatic cancer cell lines with high p53 expression. Our study is the first to explore the effectiveness of STRAP in pancreatic cancer, providing a new target for the treatment of patients with poor prognosis in PDAC mainly caused by TP53 mutation.
Taken together, our study identified the key contribution factor TP53 that influenced the prognosis of PDAC based on a large sample analysis of public databases. In addition, we found a possible mechanism for disease progression in TP53 mutant PDAC patients, and uncovered a new effective potential therapeutic target that can interfere with this pathway (Supplementary Figure 5). Our research provides reliable theoretical basis for precise classification and clinical adjuvant treatment of pancreatic cancer patients.
Data Availability Statement
The raw data supporting the conclusions of this article will be made available by the authors, without undue reservation.
Ethics Statement
The animal study was reviewed and approved by Institutional Animal Care and Use Committee of Wenzhou Medical University.
Author Contributions
SH, XC, and QZ contributed to conception and design of the study. SH, XC, and XX organized the database. SH, XC, XX, CZ, WH, YZ, PA, HY, KS, and BC performed the experiments and the statistical analysis. SH, XC, PA, and QZ wrote the first draft of the manuscript. XX, CZ, WH, YZ, HY, KS, and BC wrote sections of the manuscript. All authors contributed to manuscript revision, read, and approved the submitted version.
Funding
This work was supported by the National Natural Sciences Foundation of China (81570853, 81770630, and 81800567).
Conflict of Interest
The authors declare that the research was conducted in the absence of any commercial or financial relationships that could be construed as a potential conflict of interest.
Supplementary Material
The Supplementary Material for this article can be found online at: https://www.frontiersin.org/articles/10.3389/fonc.2020.594224/full#supplementary-material
Footnotes
References
1. Ilic M, Ilic I. Epidemiology of pancreatic cancer. World J Gastroenterol. (2016) 22:9694–705. doi: 10.3748/wjg.v22.i44.9694
2. Siegel RL, Miller KD, Jemal A. Cancer statistics, 2019. CA Cancer J Clin. (2019) 69:7–34. doi: 10.3322/caac.21551
3. Rahib L, Smith BD, Aizenberg R, Rosenzweig AB, Fleshman JM, Matrisian LM. Projecting cancer incidence and deaths to 2030: the unexpected burden of thyroid, liver, and pancreas cancers in the United States. Cancer Res. (2014) 74:2913–21. doi: 10.1158/0008-5472.Can-14-0155
4. Hartwig W, Hackert T, Hinz U, Gluth A, Bergmann F, Strobel O, et al. Pancreatic cancer surgery in the new millennium: better prediction of outcome. Ann Surgery. (2011) 254:311–9. doi: 10.1097/SLA.0b013e31821fd334
5. Vincent A, Herman J, Schulick R, Hruban RH, Goggins M. Pancreatic cancer. Lancet (Lond Engl). (2011) 378:607–20. doi: 10.1016/s0140-6736(10)62307-0
6. McDowell BD, Chapman CG, Smith BJ, Button AM, Chrischilles EA, Mezhir JJ. Pancreatectomy predicts improved survival for pancreatic adenocarcinoma: results of an instrumental variable analysis. Ann Surgery. (2015) 261:740–5. doi: 10.1097/sla.0000000000000796
7. Whitcomb DC, Shelton CA, Brand RE. Genetics and genetic testing in pancreatic cancer. Gastroenterology. (2015) 149:1252–64.e4. doi: 10.1053/j.gastro.2015.07.057
8. Murphy SJ, Hart SN, Lima JF, Kipp BR, Klebig M, Winters JL, et al. Genetic alterations associated with progression from pancreatic intraepithelial neoplasia to invasive pancreatic tumor. Gastroenterology. (2013) 145:1098–9.e1. doi: 10.1053/j.gastro.2013.07.049
9. Biankin AV, Waddell N, Kassahn KS, Gingras MC, Muthuswamy LB, Johns AL, et al. Pancreatic cancer genomes reveal aberrations in axon guidance pathway genes. Nature. (2012) 491:399–405. doi: 10.1038/nature11547
10. Bailey P, Chang DK, Nones K, Johns AL, Patch AM, Gingras MC, et al. Genomic analyses identify molecular subtypes of pancreatic cancer. Nature. (2016) 531:47–52. doi: 10.1038/nature16965
11. Yu J, Sadakari Y, Shindo K, Suenaga M, Brant A, Almario JAN, et al. Digital next-generation sequencing identifies low-abundance mutations in pancreatic juice samples collected from the duodenum of patients with pancreatic cancer and intraductal papillary mucinous neoplasms. Gut. (2017) 66:1677–87. doi: 10.1136/gutjnl-2015-311166
12. Iacobuzio-Donahue CA. Genetic evolution of pancreatic cancer: lessons learnt from the pancreatic cancer genome sequencing project. Gut. (2012) 61:1085–94. doi: 10.1136/gut.2010.236026
13. Iacobuzio-Donahue CA, Velculescu VE, Wolfgang CL, Hruban RH. Genetic basis of pancreas cancer development and progression: insights from whole-exome and whole-genome sequencing. Clin Cancer Res. (2012) 18:4257–65. doi: 10.1158/1078-0432.Ccr-12-0315
14. Smit VT, Boot AJ, Smits AM, Fleuren GJ, Cornelisse CJ, Bos JL. KRAS codon 12 mutations occur very frequently in pancreatic adenocarcinomas. Nucleic Acids Res. (1988) 16:7773–82. doi: 10.1093/nar/16.16.7773
15. Hingorani SR, Petricoin EF, Maitra A, Rajapakse V, King C, Jacobetz MA, et al. Preinvasive and invasive ductal pancreatic cancer and its early detection in the mouse. Cancer Cell. (2003) 4:437–50.
16. Waddell N, Pajic M, Patch AM, Chang DK, Kassahn KS, Bailey P, et al. Whole genomes redefine the mutational landscape of pancreatic cancer. Nature. (2015) 518:495–501. doi: 10.1038/nature14169
17. Dal Molin M, Zhang M, de Wilde RF, Ottenhof NA, Rezaee N, Wolfgang CL, et al. Very long-term survival following resection for pancreatic cancer is not explained by commonly mutated genes: results of whole-exome sequencing analysis. Clin Cancer Res. (2015) 21:1944–50. doi: 10.1158/1078-0432.Ccr-14-2600
18. Huang J, Lohr JM, Nilsson M, Segersvard R, Matsson H, Verbeke C, et al. Variant profiling of candidate genes in pancreatic ductal adenocarcinoma. Clin Chem. (2015) 61:1408–16. doi: 10.1373/clinchem.2015.238543
19. Kim MK, Woo SM, Park B, Yoon KA, Kim YH, Joo J, et al. Prognostic implications of multiplex detection of KRAS mutations in cell-free DNA from patients with pancreatic ductal adenocarcinoma. Clin Chem. (2018) 64:726–34. doi: 10.1373/clinchem.2017.283721
20. Masetti M, Acquaviva G, Visani M, Tallini G, Fornelli A, Ragazzi M, et al. Long-term survivors of pancreatic adenocarcinoma show low rates of genetic alterations in KRAS, TP53 and SMAD4. Cancer Biomarkers. (2018) 21:323–34. doi: 10.3233/cbm-170464
21. Blackford A, Serrano OK, Wolfgang CL, Parmigiani G, Jones S, Zhang X, et al. SMAD4 gene mutations are associated with poor prognosis in pancreatic cancer. Clin Cancer Res. (2009) 15:4674–9. doi: 10.1158/1078-0432.Ccr-09-0227
22. Qian ZR, Rubinson DA, Nowak JA, Morales-Oyarvide V, Dunne RF, Kozak MM, et al. Association of alterations in main driver genes with outcomes of patients with resected pancreatic ductal adenocarcinoma. JAMA Oncol. (2018) 4:e173420. doi: 10.1001/jamaoncol.2017.3420
23. Yachida S, White CM, Naito Y, Zhong Y, Brosnan JA, Macgregor-Das AM, et al. Clinical significance of the genetic landscape of pancreatic cancer and implications for identification of potential long-term survivors. Clin Cancer Res. (2012) 18:6339–47. doi: 10.1158/1078-0432.Ccr-12-1215
24. Wang K, Li M, Hakonarson H. ANNOVAR: functional annotation of genetic variants from high-throughput sequencing data. Nucleic Acids Res. (2010) 38:e164. doi: 10.1093/nar/gkq603
25. Li J, Wang L, Guo H, Shi L, Zhang K, Tang M, et al. Targeted sequencing and functional analysis reveal brain-size-related genes and their networks in autism spectrum disorders. Mol Psychiatry. (2017) 22:1282–90. doi: 10.1038/mp.2017.140
26. Li J, Hu S, Zhang K, Shi L, Zhang Y, Zhao T, et al. A comparative study of the genetic components of three subcategories of autism spectrum disorder. Mol Psychiatry. (2018) 24:1720–31. doi: 10.1038/s41380-018-0081-x
27. Wang H, Sun Q, Zhao W, Qi L, Gu Y, Li P, et al. Individual-level analysis of differential expression of genes and pathways for personalized medicine. Bioinformatics (Oxf Engl). (2015) 31:62–8. doi: 10.1093/bioinformatics/btu522
28. Ma D, Chen X, Zhang PY, Zhang H, Wei LJ, Hu S, et al. Upregulation of the ALDOA/DNA-PK/p53 pathway by dietary restriction suppresses tumor growth. Oncogene. (2018) 37:1041–8. doi: 10.1038/onc.2017.398
29. Zhou MT, Zhao C, Chen X, Zhang HC, Li G, Lou H, et al. MicroRNA-34a promotes MICB expression in hepatocytes. Carcinogenesis. (2018) 39:1477–87. doi: 10.1093/carcin/bgy128
30. Cao P, Yang A, Wang R, Xia X, Zhai Y, Li Y, et al. Germline duplication of SNORA18L5 increases risk for HBV-related hepatocellular carcinoma by altering localization of ribosomal proteins and decreasing levels of p53. Gastroenterology. (2018) 155:542–56. doi: 10.1053/j.gastro.2018.04.020
31. Xing YH, Chen LL. Processing and roles of snoRNA-ended long noncoding RNAs. Crit Rev Biochem Mol Biol. (2018) 53:596–606. doi: 10.1080/10409238.2018.1508411
32. Silvera D, Formenti SC, Schneider RJ. Translational control in cancer. Nat Rev Cancer. (2010) 10:254–66. doi: 10.1038/nrc2824
33. Krastev DB, Slabicki M, Paszkowski-Rogacz M, Hubner NC, Junqueira M, Shevchenko A, et al. A systematic RNAi synthetic interaction screen reveals a link between p53 and snoRNP assembly. Nat Cell Biol. (2011) 13:809–18. doi: 10.1038/ncb2264
34. Matera AG, Terns RM, Terns MP. Non-coding RNAs: lessons from the small nuclear and small nucleolar RNAs. Nat Rev Mol Cell Biol. (2007) 8:209–20. doi: 10.1038/nrm2124
35. Gong J, Li Y, Liu CJ, Xiang Y, Li C, Ye Y, et al. A pan-cancer analysis of the expression and clinical relevance of small nucleolar RNAs in human cancer. Cell Rep. (2017) 21:1968–81. doi: 10.1016/j.celrep.2017.10.070
36. Sun Y, Chen E, Li Y, Ye D, Cai Y, Wang Q, et al. H/ACA box small nucleolar RNA 7B acts as an oncogene and a potential prognostic biomarker in breast cancer. Cancer Cell Int. (2019) 19:125. doi: 10.1186/s12935-019-0830-1
37. Shuwen H, Xi Y, Quan Q, Yin J, Miao D. Can small nucleolar RNA be a novel molecular target for hepatocellular carcinoma? Gene. (2020) 733:144384. doi: 10.1016/j.gene.2020.144384
38. Cui L, Nakano K, Obchoei S, Setoguchi K, Matsumoto M, Yamamoto T, et al. Small nucleolar noncoding RNA SNORA23, up-regulated in human pancreatic ductal adenocarcinoma, regulates expression of spectrin repeat-containing nuclear envelope 2 to promote growth and metastasis of xenograft tumors in mice. Gastroenterology. (2017) 153:292–306.e2. doi: 10.1053/j.gastro.2017.03.050
39. Mourksi NE, Morin C, Fenouil T, Diaz JJ, Marcel V. snoRNAs offer novel insight and promising perspectives for lung cancer understanding and management. Cells. (2020) 9:541. doi: 10.3390/cells9030541
40. Williams GT, Farzaneh F. Are snoRNAs and snoRNA host genes new players in cancer? Nat Rev Cancer. (2012) 12:84–8. doi: 10.1038/nrc3195
41. Mei YP, Liao JP, Shen J, Yu L, Liu BL, Liu L, et al. Small nucleolar RNA 42 acts as an oncogene in lung tumorigenesis. Oncogene. (2012) 31:2794–804. doi: 10.1038/onc.2011.449
42. Okugawa Y, Toiyama Y, Toden S, Mitoma H, Nagasaka T, Tanaka K, et al. Clinical significance of SNORA42 as an oncogene and a prognostic biomarker in colorectal cancer. Gut. (2017) 66:107–17. doi: 10.1136/gutjnl-2015-309359
43. Fang X, Yang D, Luo H, Wu S, Dong W, Xiao J, et al. SNORD126 promotes HCC and CRC cell growth by activating the PI3K-AKT pathway through FGFR2. J Mol Cell Biol. (2017) 9:243–55. doi: 10.1093/jmcb/mjw048
44. Valleron W, Laprevotte E, Gautier EF, Quelen C, Demur C, Delabesse E, et al. Specific small nucleolar RNA expression profiles in acute leukemia. Leukemia. (2012) 26:2052–60. doi: 10.1038/leu.2012.111
45. Siprashvili Z, Webster DE, Johnston D, Shenoy RM, Ungewickell AJ, Bhaduri A, et al. The noncoding RNAs SNORD50A and SNORD50B bind K-Ras and are recurrently deleted in human cancer. Nat Genet. (2016) 48:53–8. doi: 10.1038/ng.3452
46. Wu B, Huang L, Qiu W, Liu X, Shen Y, Lu Y, et al. Small nucleolar RNA Sf-15 regulates proliferation and apoptosis of Spodoptera frugiperda Sf9 cells. BMC Mol Biol. (2019) 20:12. doi: 10.1186/s12867-019-0128-9
47. Xia XR, Li WC, Yu ZT, Li J, Peng CY, Jin L, et al. Effects of small nucleolar RNA SNORD44 on the proliferation, apoptosis and invasion of glioma cells. Histochem Cell Biol. (2020) 153:257–69. doi: 10.1007/s00418-020-01848-y
48. Li D, Roberts R. WD-repeat proteins: structure characteristics, biological function, and their involvement in human diseases. Cell Mol Life Sci. (2001) 58:2085–97.
49. Datta PK, Chytil A, Gorska AE, Moses HL. Identification of STRAP, a novel WD domain protein in transforming growth factor-beta signaling. J Biol Chem. (1998) 273:34671–4. doi: 10.1074/jbc.273.52.34671
50. Manoharan R, Seong HA, Ha H. Dual roles of serine-threonine kinase receptor-associated protein (STRAP) in redox-sensitive signaling pathways related to cancer development. Oxidat Med Cell Longev. (2018) 2018:5241524. doi: 10.1155/2018/5241524
51. Huh HD, Lee E, Shin J, Park B, Lee SSTRAP. positively regulates TLR3-triggered signaling pathway. Cell Immunol. (2017) 318:55–60. doi: 10.1016/j.cellimm.2017.06.005
52. Pruksakorn D, Klangjorhor J, Lirdprapamongkol K, Teeyakasem P, Sungngam P, Chaiyawat P, et al. Oncogenic roles of serine-threonine kinase receptor-associated protein (STRAP) in osteosarcoma. Cancer Chemother Pharmacol. (2018) 82:1039–47. doi: 10.1007/s00280-018-3696-3
53. Halder SK, Anumanthan G, Maddula R, Mann J, Chytil A, Gonzalez AL, et al. Oncogenic function of a novel WD-domain protein, STRAP, in human carcinogenesis. Cancer Res. (2006) 66:6156–66. doi: 10.1158/0008-5472.Can-05-3261
54. Jin L, Vu T, Yuan G, Datta PK. STRAP promotes stemness of human colorectal cancer via epigenetic regulation of the NOTCH pathway. Cancer Res. (2017) 77:5464–78. doi: 10.1158/0008-5472.Can-17-0286
55. Chari A, Golas MM, Klingenhager M, Neuenkirchen N, Sander B, Englbrecht C, et al. An assembly chaperone collaborates with the SMN complex to generate spliceosomal SnRNPs. Cell. (2008) 135:497–509. doi: 10.1016/j.cell.2008.09.020
Keywords: pancreatic ductal adenocarcinoma, TP53, prognosis, snoRNA, STRAP
Citation: Hu S, Chen X, Xu X, Zheng C, Huang W, Zhou Y, Akuetteh PDP, Yang H, Shi K, Chen B and Zhang Q (2020) STRAP as a New Therapeutic Target for Poor Prognosis of Pancreatic Ductal Adenocarcinoma Patients Mainly Caused by TP53 Mutation. Front. Oncol. 10:594224. doi: 10.3389/fonc.2020.594224
Received: 12 August 2020; Accepted: 07 September 2020;
Published: 29 September 2020.
Edited by:
Mara Cirone, Sapienza University of Rome, ItalyReviewed by:
Fuming Li, University of Pennsylvania, United StatesJoão Agostinho Machado-Neto, University of São Paulo, Brazil
Copyright © 2020 Hu, Chen, Xu, Zheng, Huang, Zhou, Akuetteh, Yang, Shi, Chen and Zhang. This is an open-access article distributed under the terms of the Creative Commons Attribution License (CC BY). The use, distribution or reproduction in other forums is permitted, provided the original author(s) and the copyright owner(s) are credited and that the original publication in this journal is cited, in accordance with accepted academic practice. No use, distribution or reproduction is permitted which does not comply with these terms.
*Correspondence: Qiyu Zhang, cWl5dXpAMTI2LmNvbQ==
†These authors have contributed equally to this work