 Li-na He1,2,3†
 Xuanye Zhang1,2,3†
 Haifeng Li1,2,3†Tao Chen1,2,4†
 Chen Chen1,2,5Yixin Zhou1,2,6Zuan Lin1,2,7Wei Du1,2,3
 Wenfeng Fang1,2,3
 Yunpeng Yang1,2,3Yan Huang1,2,3Hongyun Zhao1,2,7
 Shaodong Hong1,2,3*†Li Zhang1,2,3*†
- 1State Key Laboratory of Oncology in South China, Guangzhou, China
- 2Collaborative Innovation Center for Cancer Medicine, Guangzhou, China
- 3Department of Medical Oncology, Sun Yat-sen University Cancer Center, Guangzhou, China
- 4Department of Nuclear Medicine, Sun Yat-sen University Cancer Center, Guangzhou, China
- 5Department of Radiation Oncology, Sun Yat-sen University Cancer Center, Guangzhou, China
- 6Department of VIP Region, Sun Yat-sen University Cancer Center, Guangzhou, China
- 7Department of Clinical Research, Sun Yat-sen University Cancer Center, Guangzhou, China
Tumor growth rate (TGR; percent size change per month [%/m]) is postulated as an early radio-graphic predictor of response to anti-cancer treatment to overcome limitations of RECIST. We aimed to evaluate the predictive value of pre-treatment TGR (TGR0) for outcomes of advanced non-small cell lung cancer (aNSCLC) patients treated with anti-PD-1/PD-L1 monotherapy. We retrospectively screened all aNSCLC patients who received PD-1 axis inhibitors in Sun Yat-Sen University Cancer Center between August 2016 and June 2018. TGR0 was calculated as the percentage change in tumor size per month (%/m) derived from two computed tomography (CT) scans during a “wash-out” period before the initiation of PD-1 axis inhibition. Final follow-up date was August 28, 2019. The X-tile program was used to identify the cut-off value of TGR0 based on maximum progression-free survival (PFS) stratification. Patients were divided into two groups per the selected TGR0 cut-off. The primary outcome was the difference of PFS between the two groups. The Kaplan-Meier methods and Cox regression models were performed for survival analysis. A total of 80 eligible patients were included (54 [67.5%] male; median [range] age, 55 [30-74] years). Median (range) TGR0 was 21.1 (-33.7-246.0)%/m. The optimal cut-off value of TGR0 was 25.3%/m. Patients with high TGR0 had shorter median PFS (1.8 months; 95% CI, 1.6 - 2.1 months) than those with low TGR0 (2.7 months; 95% CI, 0.5 - 4.9 months) (P = 0.005). Multivariate Cox regression analysis revealed that higher TGR0 independently predicted inferior PFS (hazard ratio [HR] 1.97; 95% CI, 1.08-3.60; P = 0.026). Higher TGR0 was also significantly associated with less durable clinical benefit rate (34.8% vs. 8.8%, P = 0.007). High pre-treatment TGR was a reliable predictor of inferior PFS and clinical benefit in aNSCLC patients undergoing anti-PD-1/PD-L1 monotherapy. The findings highlight the role of TGR0 as an early biomarker to predict benefit from immunotherapy and could allow tailoring patient’s follow-up.
Introduction
In recent years, immune checkpoint inhibitors (ICIs), including anti-programmed cell death 1 (PD-1) or anti-programmed cell death ligand 1 (PD-L1) therapies, have revolutionized the treatment modalities of advanced non-small cell lung cancer (aNSCLC) (1–5). However, only a small subset of patients have durable response to anti-PD-1/PD-L1 monotherapy and its clinical application was challenged by its atypical response patterns such as hyperprogressive disease (HPD), delayed response, mixed response and pseudoprogressive disease (6, 7). Numerous studies have been conducted to explore early biomarkers to predict response and survival outcomes in patients undergoing ICI treatment (8).
The Response Evaluation Criteria in Solid Tumors (RECIST) criteria provide an objective and standardized response evaluation benchmark for anticancer therapies (9). However, RECIST-based treatment response evaluation does not take into account the tumor growth kinetics (10). Therefore, the RECIST criteria can only be reliably used to compare progression-free survival (PFS) in patients with relatively uniform tumor growth rate when the radiographic evaluation intervals are fixed. Furthermore, RECIST-defined objective response does not always conform the clinical benefit from anticancer treatment (11–15). Also, the RECIST criteria do not provide pre-treatment parameters for earlier prediction of clinical benefit. Thus, it is of clinical relevance to identify other early and inexpensive predictors of benefit from ICI treatment to overcome the limitations of RECIST criteria.
Uncontrolled growth is one of the hallmarks of malignant cells. Fast-growing tumors are associated with the aggressiveness of the tumor, larger tumor bulk, relatively higher sensitivity to cytotoxic agents, significant aberrant neoangiogenesis and altered immune microenvironment (16). Tumor growth rate (TGR) provides quantitative assessment of change in tumor volume over time according to RECIST-defined sum of the longest diameters of the target lesions (SLD) from two computed tomography (CT) scans and time interval between them (17). Previous studies have showed that TGR was correlated with treatment response or clinical outcomes in patients with neuroendocrine carcinoma, renal cell carcinoma, or hepatocellular carcinoma treated with angiogenesis inhibitors or transarterial chemoembolization (18–23). These findings suggested that TGR could serve as an early radiological biomarker to predict patient’s survival outcomes and to tailor radiological follow-up strategies and patients’ management.
To our knowledge, no previous studies had illustrated the association of pre-treatment TGR with clinical outcomes of aNSCLC patients treated with ICI. Considering that the natural tumor growth kinetics might significantly impact the tumor microenvironment, we hypothesized that pre-treatment TGR could predict PFS of aNSCLC patients undergoing anti-PD-1/PD-L1 immunotherapy.
Methods
Data Source
We conducted a retrospective review of electronic medical records from all aNSCLC patients undergoing ICI therapy (N = 172) at Sun Yat-Sen University Cancer Center (SYSUCC) between August 2016 and June 2018. Eligible patients should have two consecutive computed tomography (CT) scans before the initiation of ICI treatment (termed “wash-out period”) and receiving no anti-cancer treatment between the two scans (Figure 1). Exclusion criteria were as follows: lacking available pre-treatment CT scan; time interval between pre-treatment (defined as the time prior to baseline) and baseline (defined as the time of ICI initiation) CT scans shorter than 2 weeks or longer than 3 months (tumor growth kinetics should be assessed during a proper period) (24); lacking measurable lesions by RECIST version 1.1 (RECIST 1.1) at baseline CT scans; having received local anti-cancer therapy such as radiotherapy and radiofrequency ablation during ICI treatment or follow-up. The study was approved by the Institutional Review Board of SYSUCC and written informed consent was waived due to the retrospective nature of the study. Our study followed the Strengthening the Reporting of Observational Studies in Epidemiology (STROBE) reporting guideline (25).
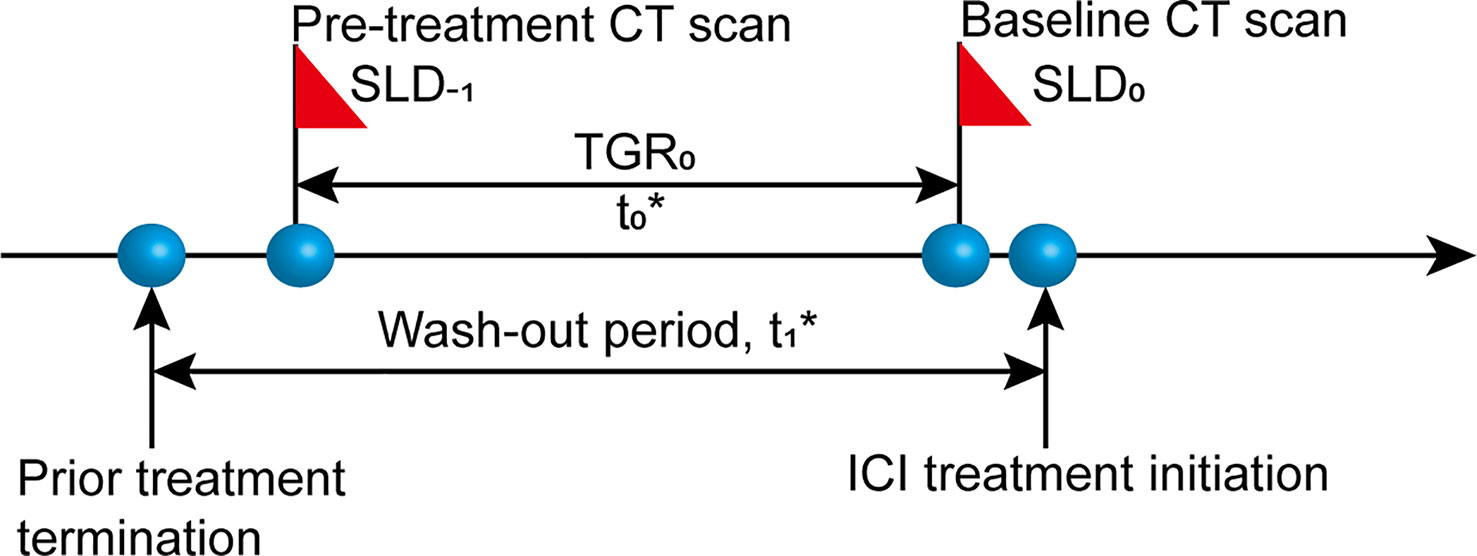
Figure 1 Diagram of computed tomography (CT) scan timepoints. SLD-1, sum of the longest diameters of the target lesions at pre-treatment CT scan; SLD0, sum of the longest diameters of the target lesions at baseline CT scan; t0, time interval between pre-treatment and baseline CT scans, 2 weeks≤ t0 ≤ 3 months; t1, wash-out period before the initiation of ICI treatment without any anti-cancer treatment.
TGR is expressed as the percentage change in tumor size per month (%/m) and calculated based on a published formula (17, 21): TGR = 100 * [exp (TG) – 1]; TG= (3 * log(D2/D1))/t, where t = (date2 – date1 + 1)/30.44, indicating the time interval in months between two CT imaging evaluations, and TG is the growth rate. Tumor size (D) derives from the sum of the longest diameters (SLD) of the target lesions according to RECIST 1.1. D1 = tumor size at date1; D2 = tumor size at date2. We simplified the formula into this form: TGR = 100 * ((D2/D1)1.303/t – 1).
For all patients, we collected data including demographic characteristics, clinical and radiological information: sex, age; previous lines of systemic therapies, smoking status, histology, clinical stage, Eastern Cooperative Oncology Group (ECOG) performance status (PS), alterations in driver genes including epidermal growth factor receptor (EGFR) and anaplastic lymphoma kinase (ALK); date of CT scans, SLD, status of non-measurable lesions and new lesions. The same assessment method and same technique (CT) were used at each imaging assessment point. For patients had disease progression with new lesions, tumor size was determined by target lesions only, while the occurrence of new lesions was recorded. In case of multiple alternative pre-baseline images, we selected the latest one to baseline for analysis. Missing data were recorded as not available.
Response and Endpoint Evaluation
All response and outcome evaluation were determined as per RECIST 1.1 by two senior radiologists blinded to patients’ information. Discrepancy was solved by consensus. Follow-up CT scans were performed according to the physicians’ discretion without predetermined intervals. Patients underwent tumor assessment until immunotherapy termination due to any reasons. The primary endpoint was PFS, defined as time from ICI initiation to radiologically-defined progression or death from any causes. The secondary endpoints were durable clinical benefit (DCB) rate, overall response rate (ORR) and overall survival (OS). DCB was defined as achieving any one of complete response (CR), partial response (PR) or stable disease (SD) that lasted for at least 6 months from baseline. The data cut-off date was August 28, 2019.
Statistical Analysis
We used the X-tile program (Yale University School of Medicine, New Haven, CT, USA) to determine the optimal cut-off values of TGR0 and baseline SLD (SLD0) to maximize PFS differentiation (26). According to the TGR0 cut-off point, patients were divided into two groups, and baseline characteristics between the two groups were compared. Continuous variables were expressed as median (range) and analyzed using Mann-Whitney U-test or independent t-test depending on the normality of distribution; categorical variables were expressed as number (%) and analyzed using Fisher’s exact test or Chi-square test as appropriate. PFS and OS survival curves were generated using Kaplan-Meier method and the differences were compared using the log-rank test. Investigation of the effect of TGR0 and other baseline parameters on treatment outcomes was performed using univariate and multivariate Cox regression analyses. Two-sided P-value of less than 0.05 was considered statistically significant. All statistical analyses were performed using the R software version 3.6.1 (https://www.r-project.org/).
Results
Patient Characteristics
Of the 172 patients screened, 80 met the eligible criteria (Figure 2). The median follow-up time was 23.6 months (95% confidence interval [CI], 13.5 - 33.7 months). Baseline characteristics of all patients were depicted in Table 1. The median (range) age was 55 (30 - 74) years. 54 (67.5%) were male, 48 (60.0%) were non-smokers, 31 (38.7%) had squamous histology, 19 (23.8%) had previously received radiotherapy and 36 (45.0%) had three or more metastatic sites. 31 patients (38.7%) had an ECOG PS of 0, with 4 (5.0%) patients scoring at 2 or 3. The median (range) duration between pre-treatment and baseline CT scans was 1.0 (0.5 - 3.0) months. The median (range) SLD0 was 74 (17 - 231) mm, and the median (range) TGR0 was 21.1(-33.7 - 246.0) %/m. At data cut-off, 42 out of 80 (53.5%) patients died.
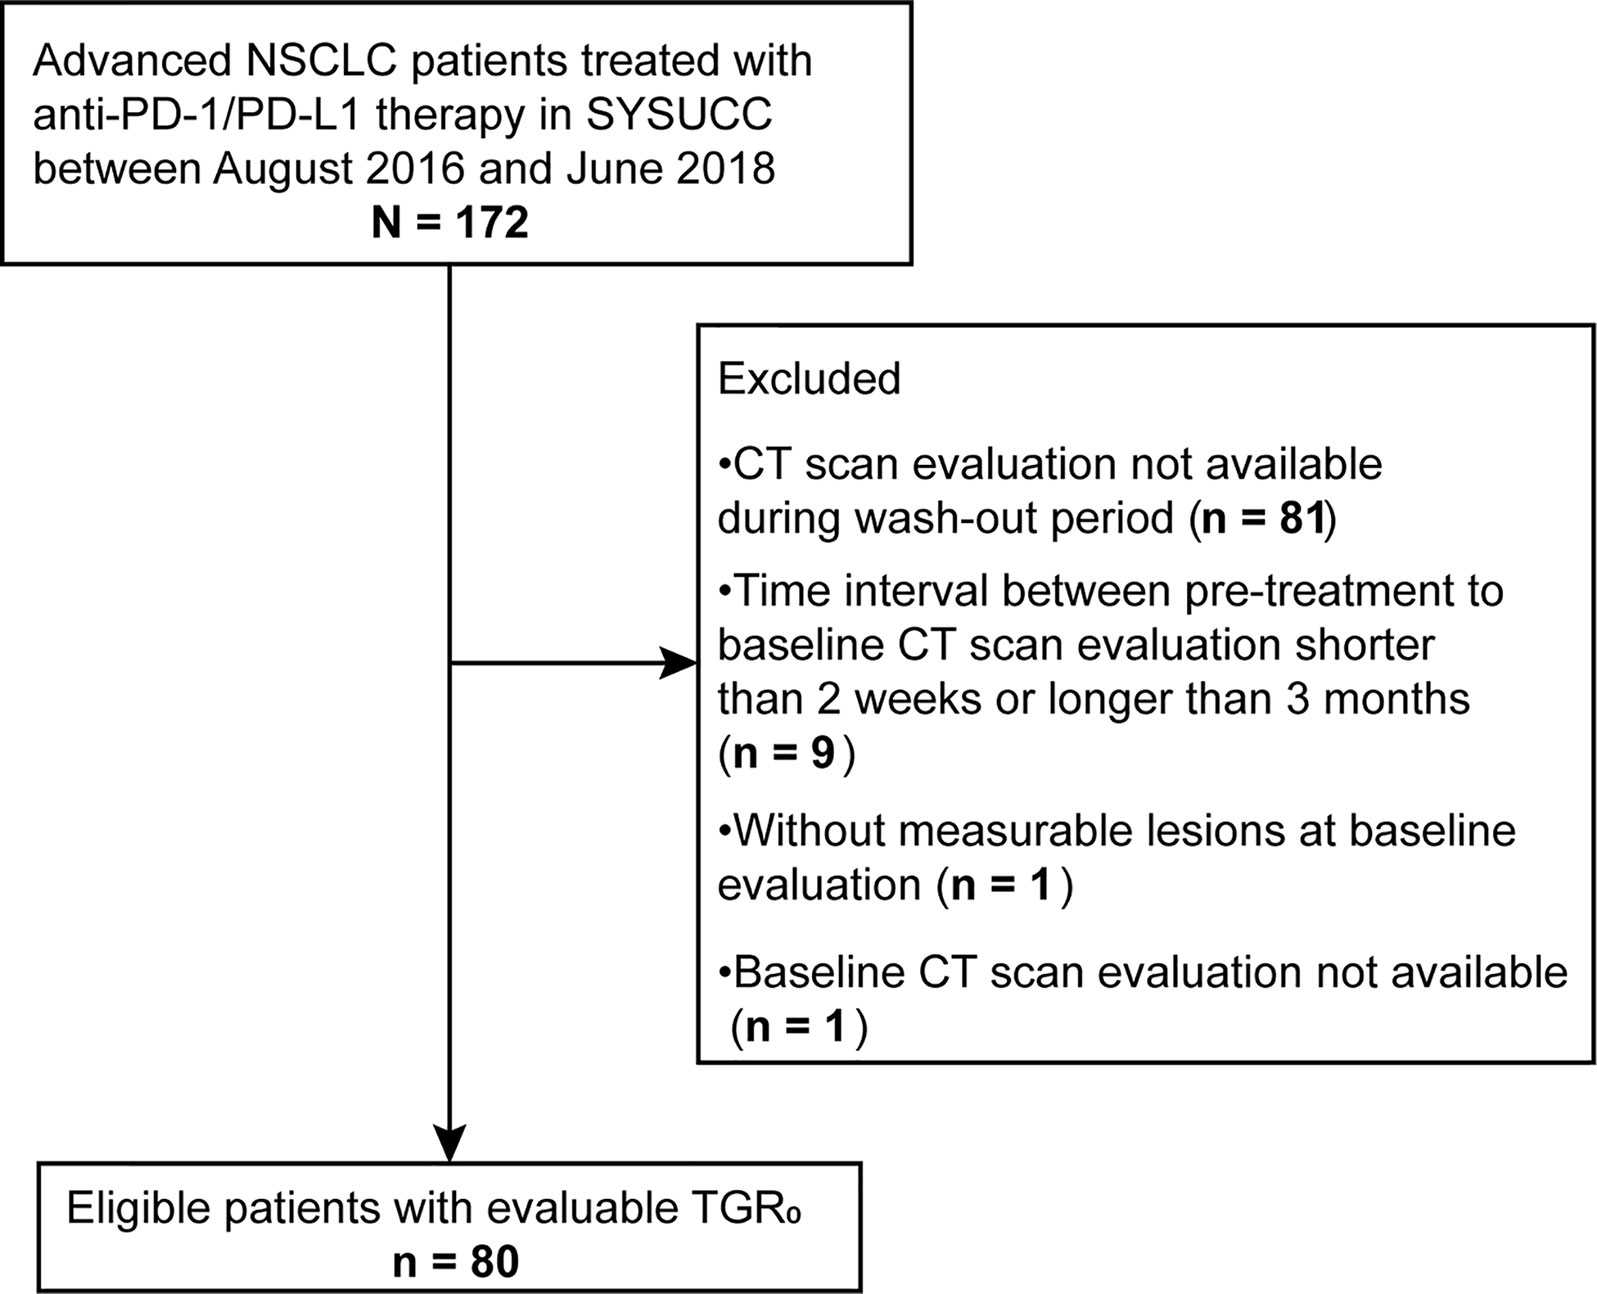
Figure 2 Flowchart of patient screening process.
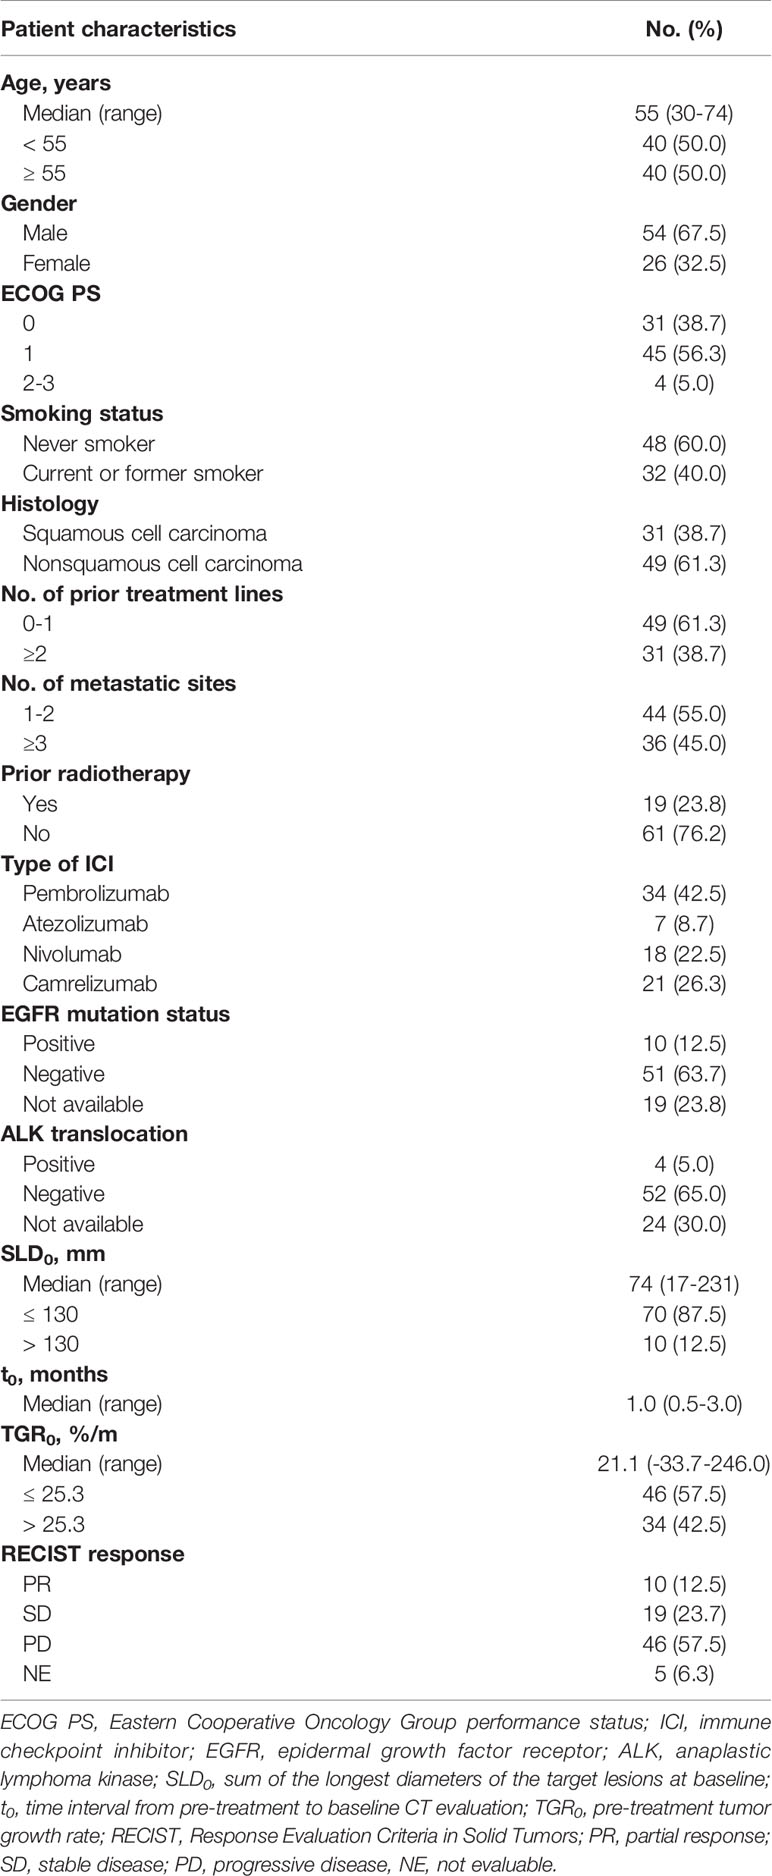
Table 1 Patient characteristics at baseline (n = 80).
As per RECIST 1.1, 10 (12.5%) patients achieved PR as best overall response, 19 (23.7%) achieved SD, 46 (57.5%) had PD and 5 (6.3%) had non-evaluable response. Overall response rate (ORR) was 12.5%, and DCB rate was 23.8%. The median PFS and OS were 2.1 months (95% CI, 1.8 - 3.1 months) and 23.6 months (95% CI, 14.8 - not reached months), respectively.
Cut-Off Points by X-Tile Program
The optimal cut-off points of SLD0 and TGR0 based on PFS separation were 130 mm (χ2 = 22.995, P < 0.001) and 25.3%/m (χ2 = 7.546, P = 0.112), respectively (Figure 3). Both cut-off points showed the maximum prognostic effects in predicting PFS. According to the TGR0 cut-off point, we divided patients into two groups: low group, TGR0 ≤ 25.3%/m (n = 46); high group, TGR0 > 25.3%/m (n = 34). The clinicopathological characteristics of TGR0 strata were shown in Table 2. Low TGR0 was significantly associated with positive smoking history (P = 0.034) and RECIST-defined best response (P = 0.028). There was no significant association between TGR0 and other factors including age, gender, ECOG PS, histology, number of prior therapy lines, number of metastatic sites, history of prior radiotherapy, EGFR and ALK status (all with P > 0.05).
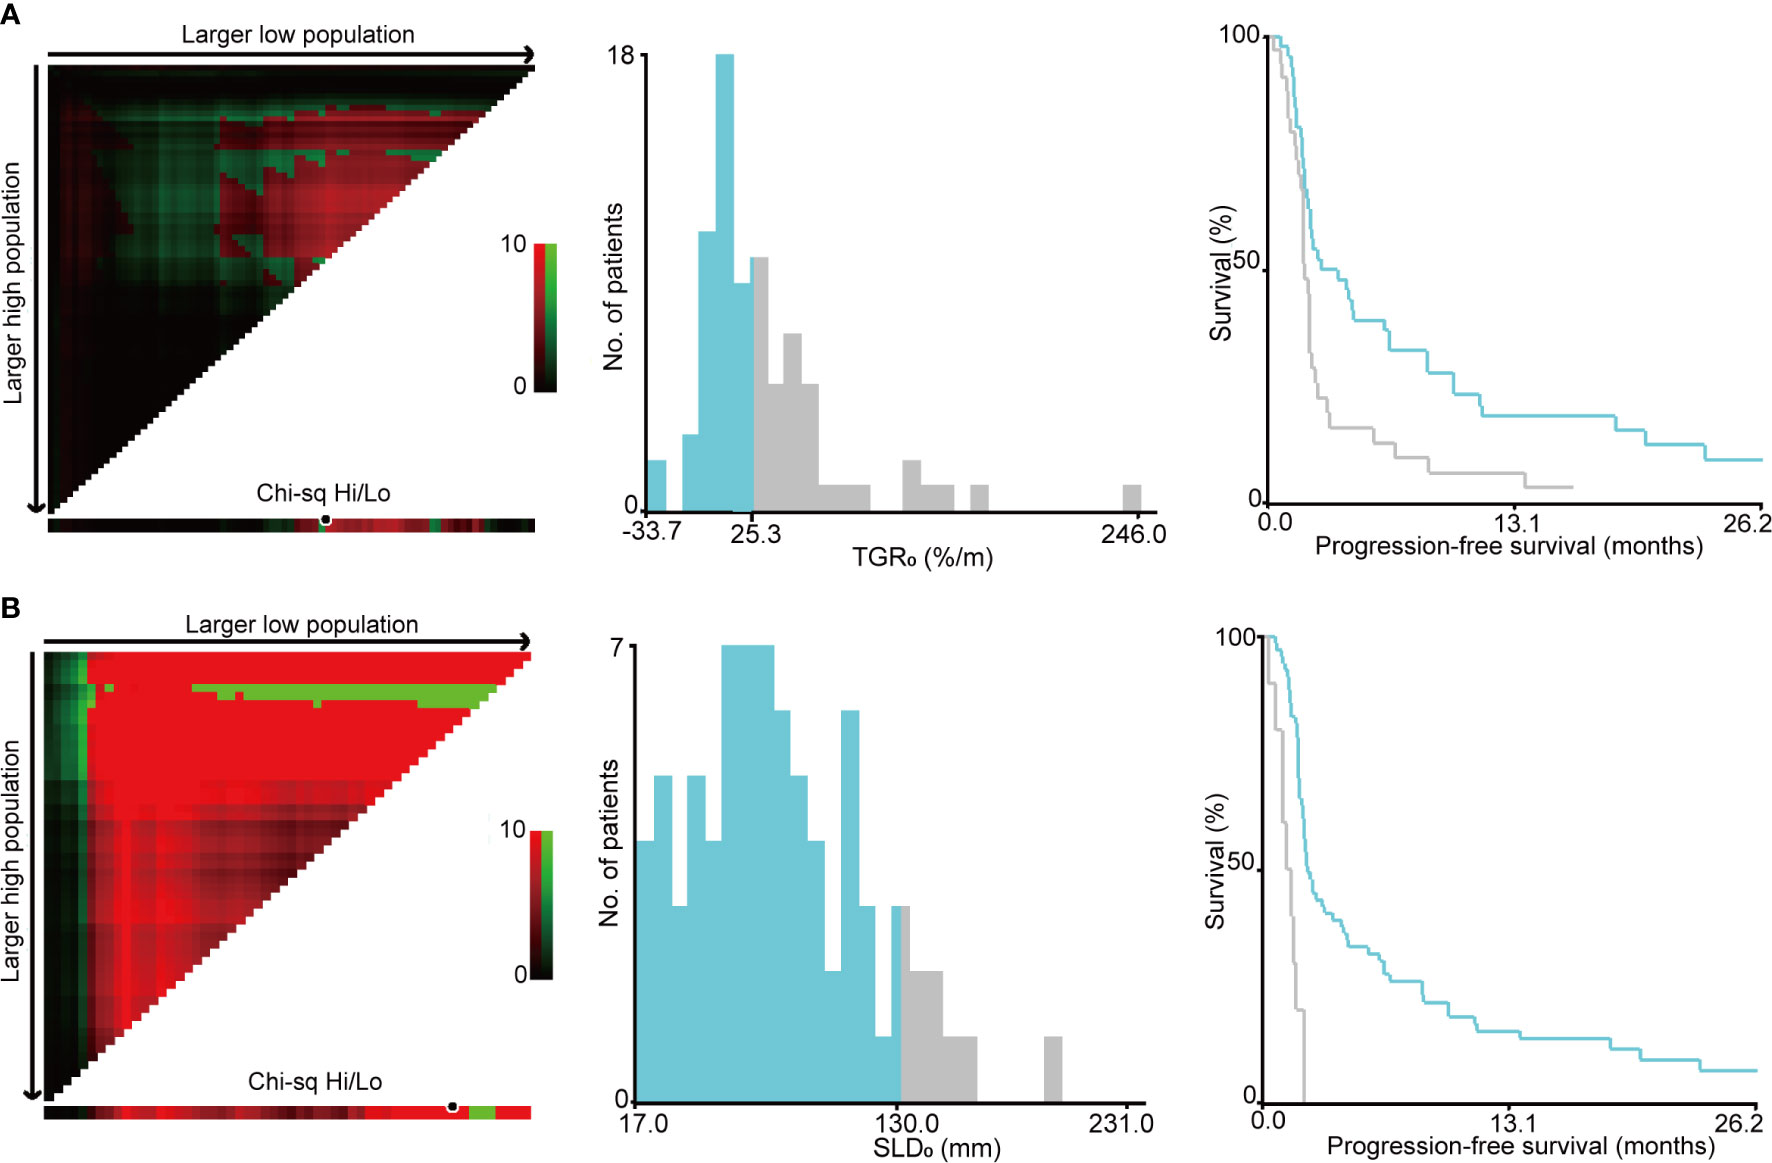
Figure 3 Identification of cut-off values based on progression-free survival by X-tile analysis. (A) The optimal cut-off value for sum of the longest diameters of target lesions at baseline (SLD0) was 130 mm (χ2 = 22.995, P < 0.001). (B) The optimal cut-off value for pre-treatment tumor growth rate (TGR0) based on PFS was 25.3%/m (χ2 = 7.546, P = 0.112).
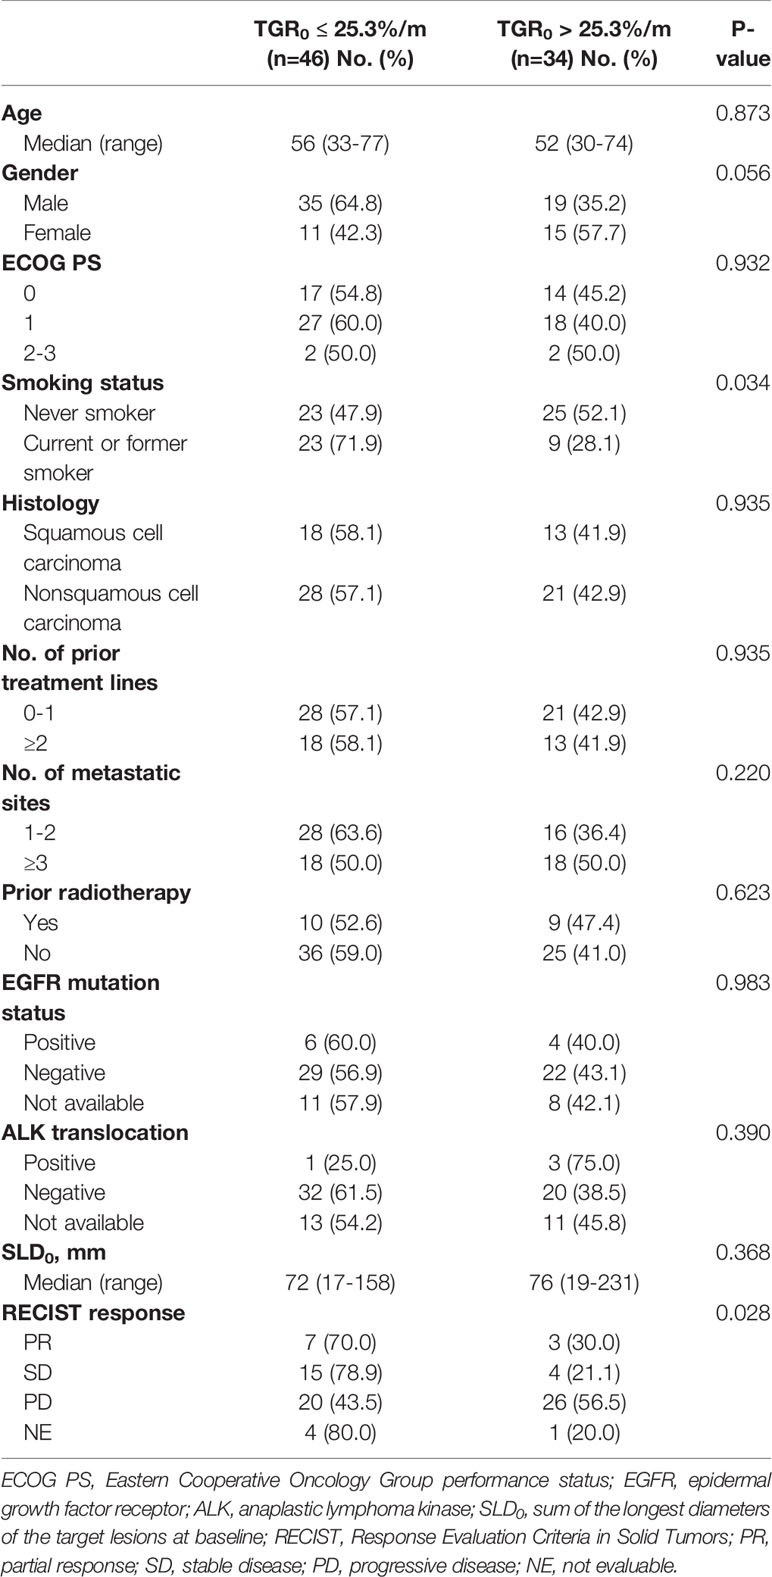
Table 2 Association of TGR0 with other parameters (n = 80).
Association of TGR0 With Clinical Outcomes
Kaplan-Meier survival analyses revealed that patients with high TGR0 experienced inferior median PFS (1.8 months; 95% CI, 1.6 - 2.1 months) compared with those with low TGR0 (2.7 months; 95% CI, 0.5 - 4.9 months) (log-rank P = 0.005) (Figure 4A). The 12-month PFS rate was 5.9% vs. 17.4% in patients with high vs. low TGR0. Univariate analyses revealed that the following factors were significantly associated with inferior PFS: higher TGR0 (hazard ratio [HR] 1.97; 95% CI, 1.21 - 3.21; P = 0.006), larger SLD0 (HR 5.79, 95% CI, 2.64 - 12.73; P < 0.001), two or more lines of prior therapy for advanced disease (HR 2.98; 95% CI, 1.76 - 5.02; P < 0.001), three or more metastatic sites (HR 2.52; 95% CI, 1.55 - 4.10; P < 0.001), ECOG PS of 2 to 3 (HR 3.35; 95% CI, 1.14 - 9.80; P = 0.027) and ALK rearrangement (HR 4.69; 95% CI, 1.61 - 13.70; P = 0.005) (Figures 4A–D, Table 3). Patients with EGFR mutant tumor also exhibited shorter PFS, with borderline significance (HR 2.00; 95% CI, 0.98 - 4.06; P = 0.056). In multivariate Cox model included all analyzed factors in univariate analyses, we found that higher TGR0 (HR 1.97; 95% CI, 1.08 - 3.60; P = 0.026), larger SLD0 (HR 10.70; 95% CI, 4.20 - 27.23; P < 0.001) and two or more lines of prior therapy (HR 3.36; 95% CI, 1.58 - 7.15; P = 0.002) remained significantly associated with shorter PFS (Table 3). Negative history of prior radiotherapy (HR 1.92; 95% CI, 0.96 - 3.83; P = 0.066) and three or more metastatic sites (HR 1.97; 95% CI, 1.00 - 3.88; P = 0.051) also tended to predict inferior PFS (Table 3).
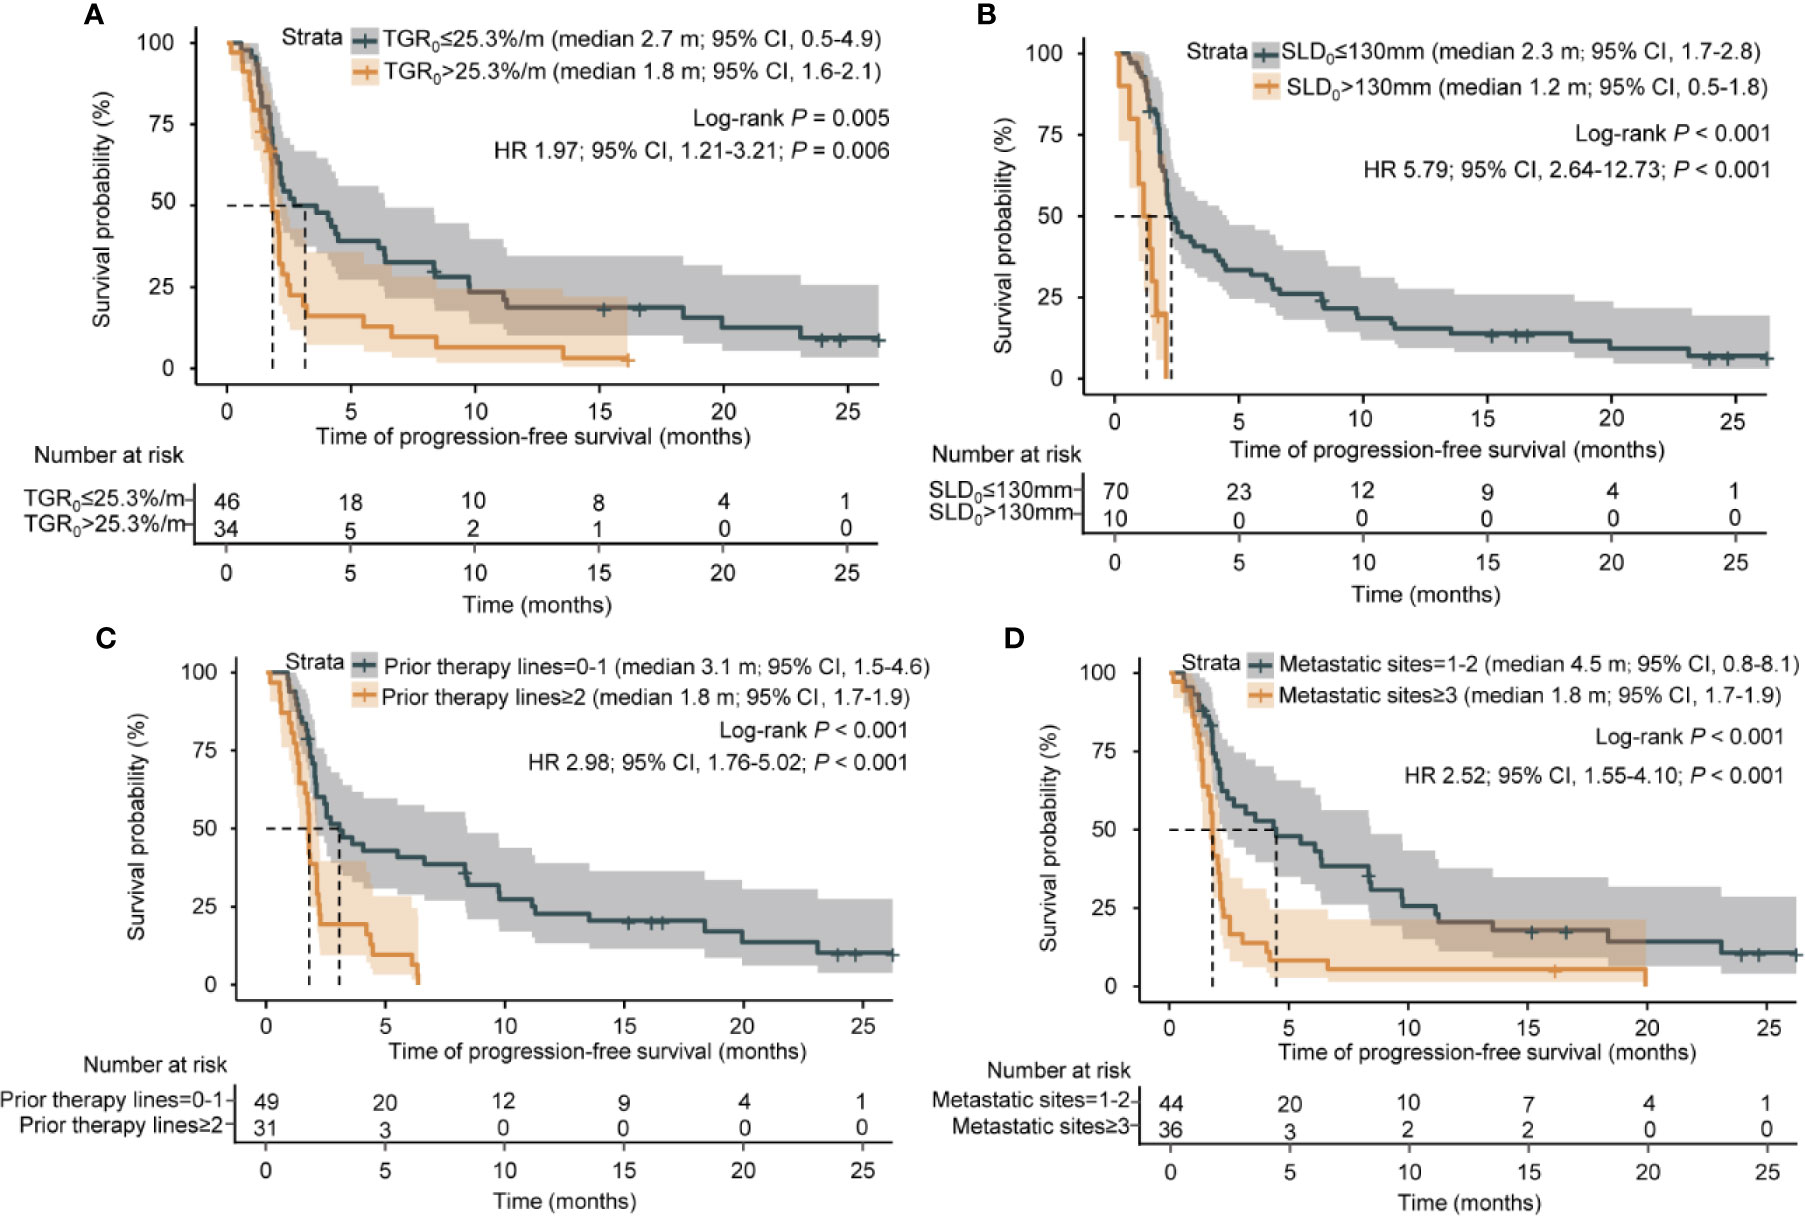
Figure 4 Kaplan-Meier analysis of progression-free survival. (A) Progression-free survival by pre-treatment tumor growth rate. (B) Progression-free survival by sum of the longest diameters of the target lesions at baseline. (C) Progression-free survival by number of prior therapy lines. (D) Progression-free survival by number of metastatic sites.
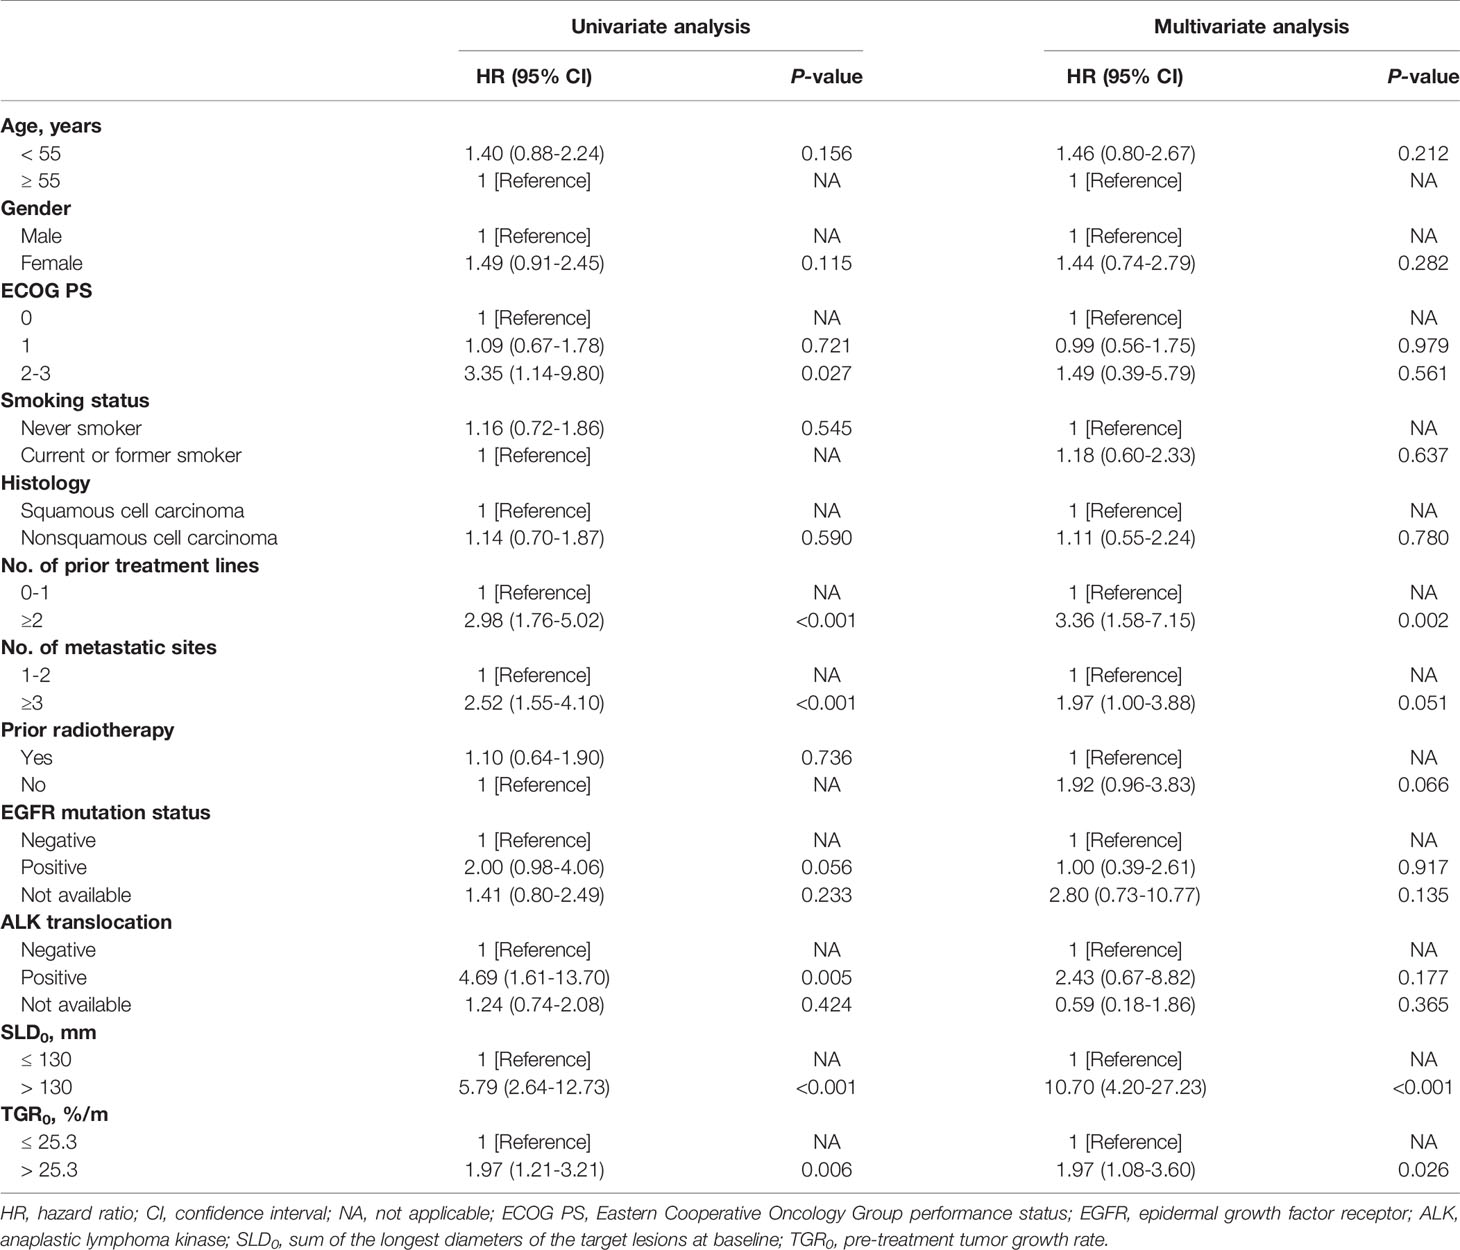
Table 3 Univariate and multivariate analyses of progression-free survival.
To further validate the effect of TGR0 on PFS, we performed subgroup analysis based on specific baseline parameters. TGR0 predicted efficacy of ICI in NSCLC patients across almost all the subgroups including age, ECOG PS of 0 or 1, male, never smoker, histology, prior treatment lines, 1 or 2 metastatic sites, negative history of prior radiotherapy and small SLD0 (Figure 5). In the histology subgroup, 43 were histologically conformed lung adenocarcinomas. Among them, 25 had low TGR0 level, with 18 grouped into high TGR0 strata. High TGR0 also tended to predicted shorter PFS (HR 1.75; 95% CI, 0.91 - 3.37), though not statistically significant (P = 0.097). However, in patients with metastatic sites of ≥ 3, ECOG PS of 2 to 3, positive history of prior radiotherapy and those with large SLD0, TGR0 did not have impact on PFS.
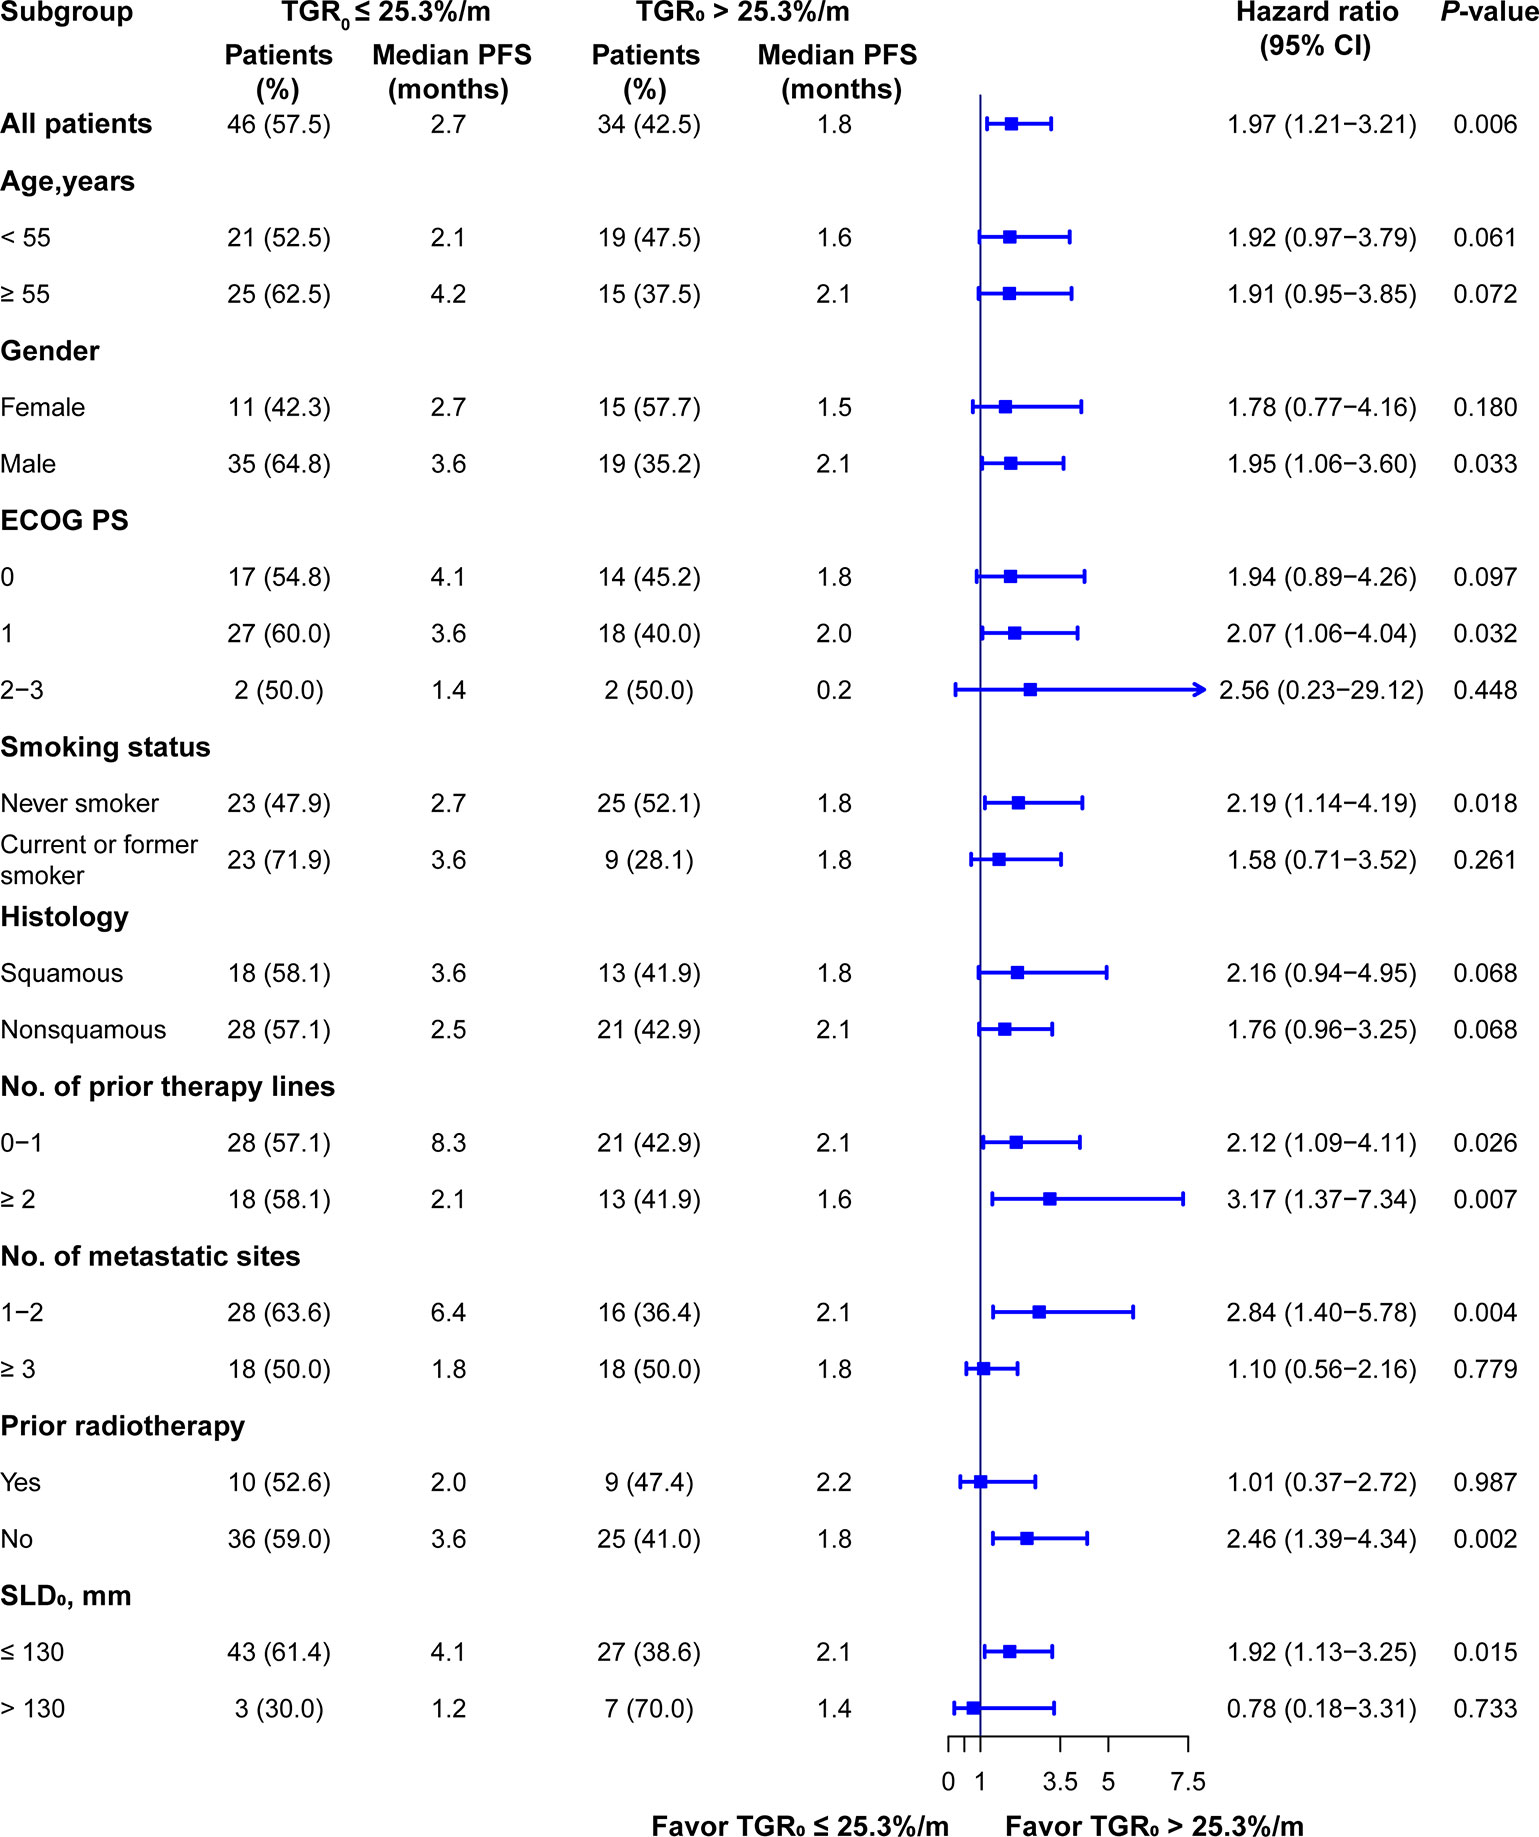
Figure 5 Subgroup analysis of PFS according to TGR0 stratification. Findings were examined by Cox proportional hazard regression analysis.
TGR0 did not have impact on OS (HR 1.24; 95% CI, 0.64-2.39; log-rank P = 0.519) (Figure S1). In multivariate Cox regression analysis, ECOG PS of 1 (HR 2.65; 95% CI 1.14 - 6.19; P = 0.024), ECOG PS of 2 to 3 (HR 30.62; 95% CI 3.61 - 260.01; P = 0.002), two or more prior treatment lines (HR 2.65; 95% CI 1.14 - 6.16; P = 0.024), without EGFR mutation (HR 7.12; 95% CI 1.32 - 38.53; P = 0.023), larger SLD0 (HR 8.24; 95% CI 2.84 - 23.85; P < 0.001) were significantly associated with poorer OS (Table S1). Patients with low TGR0 achieved significantly higher DCB rate compared with those with high TGR0 (16 of 46 [34.8%] vs. 3 of 34 [8.8%], P = 0.007). However, there was only a trend towards increased ORR in patients with low TGR0 (7 of 46 [15.2%] vs. 3 of 34 [8.8%]; P = 0.505).
Discussion
Early prediction of response to anti-cancer therapy is important for selecting patients that are more likely to benefit from such treatment and optimizing radiological follow-up strategies. The results from our study suggested that higher pre-treatment tumor growth rate (TGR0) played a role in predicting inferior PFS for aNSCLC patients treated with anti-PD-1/PD-L1 monotherapy. Patients with higher TGR0 was also significantly associated with less durable clinical benefit.
Our findings resonated with some previous studies. A post hoc analysis from a phase II study revealed that higher pre-treatment TGR tended to be associated with shorter PFS in grade 1 or 2 gastroenteropancreatic neuroendocrine tumors (GEP-NETs) receiving lanreotide (27), and the CLARINET study further validated this finding (18). A TGR0 < 4%/m predicted inferior PFS in G1 or G2 NET patients regardless of treatment modalities (21). Similarly, patients with higher pre-treatment tumor growth rate——measured as specific growth rate (SGR) experienced worse PFS in locally advanced NSCLC undergoing definitive chemoradiation therapy (CRT) (28). It was postulated that tumor growth rate may be more biologically and clinically relevant for predicting patient’s clinical outcomes than the RECIST did. The GREPONET study found that TGR3m provide more useful information in predicting patients’ outcomes and had less variability than RECIST3m (21). Another study enrolling 58 aNSCLC patients showed that the deceleration in TGR at first follow-up after the start of ICI therapy was significantly associated with superior OS (29). It is worthy of note that the median (range) of TGR0 from these 58 aNSCLC patients and our cohort was comparable (28.0 [−48.6 to 293.7]%/m vs. 21.1 [-33.7-246.0]%/m), indicating the repeatability of the calculation of TGR. Taken together, these results imply that translation of TGR into clinical practice may allow earlier and more precise prediction of clinical outcomes in oncotherapy. Our study further and for the first time showed that the natural tumor growth kinetics, estimated as TGR0, could predict the efficacy of ICI in NSCLC. This association was consistent across different subgroups and was maintained in multivariate regression analysis.
The TGR0 could therefore have a potential in tailoring on-treatment imaging schemes and early prediction of risk of disease progression. Based on our findings, patients with high TGR0 should undergo more frequent follow-up imaging because of their shorter PFS, namely higher risk of experiencing early disease progression; while patients with low TGR0 are more likely to have durable clinical benefit and could receive follow-up imaging assessment of longer interval to cut down the radiation exposure and examination cost. TGR also played a role in examining anti-tumor drug activity and guiding “go/no go” decision making in the early drug development. Although the rationale behind the negative impact of TGR0 on the efficacy of ICI is unclear, it could be hypothesized that the immune microenviroment of fast-growing tumor is unfavorable for the action of PD-1 axis inhibitors. Another possible explanation is that the time for the adaptive immune response and tumor killing after PD-1 axis inhibition is too long compare with the tumor growth rate. These results implied that fast-growing tumors should avoid being treated with single agent ICI. This could be viewed from the case of small cell lung cancer, which is a typical type of fast-growing tumor and have poor responsiveness to single agent ICI but demonstrates improved survival with chemoimmunotherapy combinations (30). Also, our results highlight the need for future exploration of combining TGR and RECIST criteria to refine the follow-up schemes as well as the role of ICI plus chemotherapy in tumors with high TGR0.
Our study failed to observe significant difference in OS between TGR0 strata, which might be due to the divergent sensitivity of subsequent treatment (chemotherapy as the mainstream one) in these two groups, the imbalance of subsequent treatment, and the relatively small sample size. Nevertheless, we also found that high TGR0 was correlated with low DCB rate and a tendency towards lower ORR. Similar to our observation, Yvonne Purcell et al. elucidated that the mean pre-treatment TGR was not significant different between the objective response (OR) and non-OR group in hepatocellular carcinoma treated with transarterial chemoembolization (19). This is clinically relevant because it has been showed that ORR was poorly correlated with long-term survival for immunotherapy (12, 31), indicating the inadequacy of RECIST criteria which only capture tumor volume change but miss out temporal information. Taken together, these results indicate that TGR0 is a predictive rather than a prognostic factor for aNSCLC patients undergoing ICI therapy. It is therefore more reliable to guide patients’ management in clinical practice.
Our study has several limitations. First, the study was retrospectively conducted at a single institute with a moderate sample size. Statistical power was limited and could explain why the ORR and the OS between high and low TGR0 groups did not reach statistical significance. Prospective or external validation of our work is required in another cohort with larger sample size. However, we think our finding is relatively reliable and reproducible since the predictive value of TGR is confirmed in various cancers undergoing different treatment therapies. Second, the strict inclusion criteria, especially the requirements of two consecutive imaging during wash-out period, may cause potential selection bias. Third, target lesions selected for calculation of TGR might not represent the whole tumor burden as new lesions and non-target lesions were not taken into account. Dissociated or mixed response phenomenon may confound the accurate tumor kinetics assessment after treatment initiation (32). Fourth, Limited to the retrospective nature of our work, we were unable to estimate predictive value of PD-L1 status and TMB level for only 3 patients had detected these two items. The main reason was that PD-L1 and TMB testing were not mandatory for using immunotherapy regimens since most patients in our study received ICIs in two or more lines of treatment. When we sought to re-evaluate PD-L1 and TMB status, the tissues were insufficient because all were from small biopsies. Last, the clinical application of TGR0 may be limited by the economic and ethical consideration of additional imaging evaluation required during wash-out period. However, considering the risk of early disease progression and cost of ICI treatments, we think such procedure might still have clinical relevance. Despite these limitations, our findings suggested that TGR0 has potential value for clinical utility by predicting risk of progression and providing complementary information to RECIST criteria.
Conclusions
Higher pre-treatment TGR was significantly associated with inferior PFS and less durable clinical benefit in aNSCLC patients undergoing anti-PD-1/PD-L1 monotherapy. TGR0 could provide additional information for predicting the efficacy of immune checkpoint inhibition and facilitate tailoring patient’s management. The potential role of TGR0 in the treatment decision requires further validation in another cohort and future prospective studies.
Data Availability Statement
All the data supporting the findings of this study are available from the corresponding authors upon reasonable request.
Ethics Statement
The studies involving human participants were reviewed and approved by the Institutional Review Board of Sun Yat-sen University Cancer Center. Written informed consent for participation was not required for this study in accordance with the national legislation and the institutional requirements.
Author Contributions
SH and LZ put forward the study concept and design of the work. All authors contributed to the acquisition, analysis, or interpretation of data. L-NH, XZ, and HL drafted the manuscript. SH and LZ helped with funding acquisition. SH and YH edited the manuscript. LZ contributed to the study supervision. All authors contributed to the article and approved the submitted version.
Funding
This study was funded by grants 81972898 and 81872499 from the National Natural Science Funds of China; 2019A1515011090 from the Natural Science Funds of Guangdong Province; the 16zxyc04 from the Outstanding Young Talents Program of Sun Yat-sen University Cancer Center; The funding sources had no role in the design and conduct of the study; collection, management, analysis, and interpretation of the data; preparation, review, or approval of the manuscript; and decision to submit the manuscript for publication.
Conflict of Interest
The authors declare that the research was conducted in the absence of any commercial or financial relationships that could be construed as a potential conflict of interest.
Acknowledgments
We sincerely appreciate all the patients and their family who were included in this retrospective study.
Supplementary Material
The Supplementary Material for this article can be found online at: https://www.frontiersin.org/articles/10.3389/fonc.2020.621329/full#supplementary-material
Supplementary Figure 1 | Kaplan-Meier analysis of overall survival by pre-treatment tumor growth rate.
References
1. Borghaei H, Paz-Ares L, Horn L, Spigel DR, Steins M, Ready NE, et al. Nivolumab versus Docetaxel in Advanced Nonsquamous Non-Small-Cell Lung Cancer. N Engl J Med (2015) 373:1627–39. doi: 10.1056/NEJMoa1507643
2. Brahmer J, Reckamp KL, Baas P, Crino L, Eberhardt WE, Poddubskaya E, et al. Nivolumab versus Docetaxel in Advanced Squamous-Cell Non-Small-Cell Lung Cancer. N Engl J Med (2015) 373:123–35. doi: 10.1056/NEJMoa1504627
3. Fehrenbacher L, Spira A, Ballinger M, Kowanetz M, Vansteenkiste J, Mazieres J, et al. Atezolizumab versus docetaxel for patients with previously treated non-small-cell lung cancer (POPLAR): a multicentre, open-label, phase 2 randomised controlled trial. Lancet (2016) 387:1837–46. doi: 10.1016/s0140-6736(16)00587-0
4. Gettinger S, Horn L, Jackman D, Spigel D, Antonia S, Hellmann M, et al. Five-Year Follow-Up of Nivolumab in Previously Treated Advanced Non-Small-Cell Lung Cancer: Results From the CA209-003 Study. J Clin Oncol Off J Am Soc Clin Oncol (2018) 36:1675–84. doi: 10.1200/jco.2017.77.0412
5. Mok TSK, Wu Y-L, Kudaba I, Kowalski DM, Cho BC, Turna HZ, et al. Pembrolizumab versus chemotherapy for previously untreated, PD-L1-expressing, locally advanced or metastatic non-small-cell lung cancer (KEYNOTE-042): a randomised, open-label, controlled, phase 3 trial. Lancet (2019) 393:1819–30. doi: 10.1016/s0140-6736(18)32409-7
6. Kim JY, Lee KH, Kang J, Borcoman E, Saada-Bouzid E, Kronbichler A, et al. Hyperprogressive Disease during Anti-PD-1 (PDCD1) / PD-L1 (CD274) Therapy: A Systematic Review and Meta-Analysis. Cancers (Basel) (2019) 11(11):1699. doi: 10.3390/cancers11111699
7. Mushti SL, Mulkey F, Tang S, Singh H, Lemery SJ, Goldberg KB, et al. Immune Response Evaluation and Treatment with Immune Checkpoint Inhibitors Beyond Clinical Progression: Response Assessments for Cancer Immunotherapy. Curr Oncol Rep (2020) 22:116. doi: 10.1007/s11912-020-00974-z
8. Bodor JN, Boumber Y, Borghaei H. Biomarkers for immune checkpoint inhibition in non-small cell lung cancer (NSCLC). Cancer (2020) 126:260–70. doi: 10.1002/cncr.32468
9. Eisenhauer EA, Therasse P, Bogaerts J, Schwartz LH, Sargent D, Ford R, et al. New response evaluation criteria in solid tumours: revised RECIST guideline (version 1.1). Eur J Cancer (2009) 45:228–47. doi: 10.1016/j.ejca.2008.10.026
10. Maitland ML, Schwartz LH, Ratain MJ. Time to tumor growth: a model end point and new metric system for oncology clinical trials. J Clin Oncol Off J Am Soc Clin Oncol (2013) 31:2070–2. doi: 10.1200/jco.2013.49.3635
11. Nishino M, Dahlberg SE, Adeni AE, Lydon CA, Hatabu H, Janne PA, et al. Tumor Response Dynamics of Advanced Non-small Cell Lung Cancer Patients Treated with PD-1 Inhibitors: Imaging Markers for Treatment Outcome. Clin Cancer Res (2017) 23:5737–44. doi: 10.1158/1078-0432.CCR-17-1434
12. Ritchie G, Gasper H, Man J, Lord S, Marschner I, Friedlander M, et al. Defining the Most Appropriate Primary End Point in Phase 2 Trials of Immune Checkpoint Inhibitors for Advanced Solid Cancers: A Systematic Review and Meta-analysis. JAMA Oncol (2018) 4:522–8. doi: 10.1001/jamaoncol.2017.5236
13. Shukuya T, Mori K, Amann JM, Bertino EM, Otterson GA, Shields PG, et al. Relationship between Overall Survival and Response or Progression-Free Survival in Advanced Non-Small Cell Lung Cancer Patients Treated with Anti-PD-1/PD-L1 Antibodies. J Thorac Oncol (2016) 11:1927–39. doi: 10.1016/j.jtho.2016.07.017
14. Zhang J, Huang Y, Li X, Guo Y, Zhao Y, Xue C, et al. The impact of tumor size change after target therapy on survival: analysis of patients enrolled onto three clinical trials of advanced NSCLC from one institution. Onco Targets Ther (2012) 5:349–55. doi: 10.2147/OTT.S38441
15. Zhou T, Zheng L, Hu Z, Zhang Y, Fang W, Zhao Y, et al. The effectiveness of RECIST on survival in patients with NSCLC receiving chemotherapy with or without target agents as first-line treatment. Sci Rep (2015) 5:7683. doi: 10.1038/srep07683
16. Evan GI, Vousden KH. Proliferation, cell cycle and apoptosis in cancer. Nature (2001) 411:342–8. doi: 10.1038/35077213
17. Ferte C, Fernandez M, Hollebecque A, Koscielny S, Levy A, Massard C, et al. Tumor growth rate is an early indicator of antitumor drug activity in phase I clinical trials. Clin Cancer Res (2014) 20:246–52. doi: 10.1158/1078-0432.CCR-13-2098
18. Dromain C, Pavel ME, Ruszniewski P, Langley A, Massien C, Baudin E, et al. Tumor growth rate as a metric of progression, response, and prognosis in pancreatic and intestinal neuroendocrine tumors. BMC Cancer (2019) 19:66. doi: 10.1186/s12885-018-5257-x
19. Purcell Y, Sartoris R, Paradis V, Vilgrain V, Ronot M. Influence of pretreatment tumor growth rate on objective response of hepatocellular carcinoma treated with transarterial chemoembolization. J Gastroenterol Hepatol (2020) 35:305–13. doi: 10.1111/jgh.14816
20. Stein WD, Wilkerson J, Kim ST, Huang X, Motzer RJ, Fojo AT, et al. Analyzing the pivotal trial that compared sunitinib and IFN-alpha in renal cell carcinoma, using a method that assesses tumor regression and growth. Clin Cancer Res (2012) 18:2374–81. doi: 10.1158/1078-0432.CCR-11-2275
21. Lamarca A, Crona J, Ronot M, Opalinska M, Lopez Lopez C, Pezzutti D, et al. Value of Tumor Growth Rate (TGR) as an Early Biomarker Predictor of Patients’ Outcome in Neuroendocrine Tumors (NET)-The GREPONET Study. Oncologist (2019) 24:e1082–e90. doi: 10.1634/theoncologist.2018-0672
22. Grande E, Martinez-Saez O, Gajate-Borau P, Alonso-Gordoa T. Translating new data to the daily practice in second line treatment of renal cell carcinoma: The role of tumor growth rate. World J Clin Oncol (2017) 8:100–5. doi: 10.5306/wjco.v8.i2.100
23. Ferte C, Koscielny S, Albiges L, Rocher L, Soria JC, Iacovelli R, et al. Tumor growth rate provides useful information to evaluate sorafenib and everolimus treatment in metastatic renal cell carcinoma patients: an integrated analysis of the TARGET and RECORD phase 3 trial data. Eur Urol (2014) 65:713–20. doi: 10.1016/j.eururo.2013.08.010
24. Champiat S, Dercle L, Ammari S, Massard C, Hollebecque A, Postel-Vinay S, et al. Hyperprogressive Disease Is a New Pattern of Progression in Cancer Patients Treated by Anti-PD-1/PD-L1. Clin Cancer Res (2017) 23:1920–8. doi: 10.1158/1078-0432.CCR-16-1741
25. von Elm E, Altman DG, Egger M, Pocock SJ, Gøtzsche PC, Vandenbroucke JP. The Strengthening the Reporting of Observational Studies in Epidemiology (STROBE) statement: guidelines for reporting observational studies. Lancet (London England) (2007) 370:1453–7. doi: 10.1016/s0140-6736(07)61602-x
26. Camp RL, Dolled-Filhart M, Rimm DL. X-tile: a new bio-informatics tool for biomarker assessment and outcome-based cut-point optimization. Clin Cancer Res (2004) 10:7252–9. doi: 10.1158/1078-0432.Ccr-04-0713
27. Ito T, Honma Y, Hijioka S, Kudo A, Fukutomi A, Nozaki A, et al. Phase II study of lanreotide autogel in Japanese patients with unresectable or metastatic well-differentiated neuroendocrine tumors. Invest New Drugs (2017) 35:499–508. doi: 10.1007/s10637-017-0466-8
28. Osorio B, Yegya-Raman N, Kim S, Simone CB 2nd, Theodorou Ross C, Deek MP, et al. Clinical significance of pretreatment tumor growth rate for locally advanced non-small cell lung cancer. Ann Transl Med (2019) 7:95. doi: 10.21037/atm.2019.02.14
29. Ten Berge D, Hurkmans DP, den Besten I, Kloover JS, Mathijssen RHJ, Debets R, et al. Tumour growth rate as a tool for response evaluation during PD-1 treatment for non-small cell lung cancer: a retrospective analysis. ERJ Open Res (2019) 5(4):00179–2019. doi: 10.1183/23120541.00179-2019
30. Tay RY, Heigener D, Reck M, Califano R. Immune checkpoint blockade in small cell lung cancer. Lung Cancer (Amsterdam Netherlands) (2019) 137:31–7. doi: 10.1016/j.lungcan.2019.08.024
31. Zhang J, Liang W, Liang H, Wang X, He J. Endpoint surrogacy in oncological randomized controlled trials with immunotherapies: a systematic review of trial-level and arm-level meta-analyses. Ann Transl Med (2019) 7:244. doi: 10.21037/atm.2019.04.72
32. Tozuka T, Kitazono S, Sakamoto H, Yoshida H, Amino Y, Uematsu S, et al. Dissociated responses at initial computed tomography evaluation is a good prognostic factor in non-small cell lung cancer patients treated with anti-programmed cell death-1/ligand 1 inhibitors. BMC Cancer (2020) 20:207. doi: 10.1186/s12885-020-6704-z
Keywords: progression-free survival, non-small cell lung cancer, NSCLC, anti-PD-1/PD-L1 therapy, immunotherapy, tumor growth rate
Citation: He L-n, Zhang X, Li H, Chen T, Chen C, Zhou Y, Lin Z, Du W, Fang W, Yang Y, Huang Y, Zhao H, Hong S and Zhang L (2021) Pre-Treatment Tumor Growth Rate Predicts Clinical Outcomes of Patients With Advanced Non-Small Cell Lung Cancer Undergoing Anti-PD-1/PD-L1 Therapy. Front. Oncol. 10:621329. doi: 10.3389/fonc.2020.621329
Received: 26 October 2020; Accepted: 27 November 2020;
Published: 19 January 2021.
Edited by:
Weimin Mao, Zhejiang Cancer Hospital, ChinaReviewed by:
Xuan Wu, Peking University Shenzhen Hospital, ChinaXiaomin Niu, Shanghai Jiaotong University, China
Jin Sheng, Zhejiang University, China
Copyright © 2021 He, Zhang, Li, Chen, Chen, Zhou, Lin, Du, Fang, Yang, Huang, Zhao, Hong and Zhang. This is an open-access article distributed under the terms of the Creative Commons Attribution License (CC BY). The use, distribution or reproduction in other forums is permitted, provided the original author(s) and the copyright owner(s) are credited and that the original publication in this journal is cited, in accordance with accepted academic practice. No use, distribution or reproduction is permitted which does not comply with these terms.
*Correspondence: Shaodong Hong, aG9uZ3NoZEBzeXN1Y2Mub3JnLmNu; Li Zhang, emhhbmdsaTZAbWFpbC5zeXN1LmVkdS5jbg==
†These authors have contributed equally to this work