 Dan Zou1Zhi Li2Fei Lv1Yi Yang3Chunjiao Yang1Jincheng Song1,4Yang Chen5Zi Jin6Jinpeng Zhou7
 Yang Jiang7,8Yanju Ma9
 Zhitao Jing7Yu Tang9
 Ye Zhang1*
- 1The First Laboratory of Cancer Institute, The First Hospital of China Medical University, Shenyang, China
- 2Department of Medical Oncology, The First Hospital of China Medical University, Shenyang, China
- 3Laboratory Animal Center, China Medical University, Shenyang, China
- 4Lymphoma and Myeloma Diagnosis and Treatment Center, The Second Affiliated Hospital of Dalian Medical University, Dalian, China
- 5Department of Respiratory and Infectious Disease of Geriatrics, The First Hospital of China Medical University, Shenyang, China
- 6The First Department of Oncology, Shenyang Fifth People's Hospital, Shenyang, China
- 7Department of Neurosurgery, The First Hospital of China Medical University, Shenyang, China
- 8Department of Neurosurgery, Shanghai General Hospital, Shanghai Jiao Tong University School of Medicine, Shanghai, China
- 9Department of Medical Oncology, Cancer Hospital of China Medical University, Liaoning Cancer Hospital & Insititute, Shenyang, China
Background: NOS3 (endothelial NOS, eNOS) is a member of the nitric oxide synthase (NOS) enzyme family, mainly participating in nitric oxide (NO) generation. NOS3 has been reported to inhibit apoptosis and promote angiogenesis, proliferation, and invasiveness. However, the expression pattern of NOS3 and its diagnostic and prognostic potential has not been investigated in a pan-cancer perspective.
Methods: Data from the Genotype-Tissue Expression (GTEx), the Cancer Genome Atlas (TCGA), the Cancer Cell Line Encyclopedia (CCLE), and the Cancer Therapeutics Response Portal (CTRP) were employed and NOS3 expression was comprehensively analyzed in normal tissues, cancer tissues, and cell lines. Immunohistochemical staining of tissue sections were used to validate the prognostic role of NOS3 in gastric cancer patients. GSVA and GSEA analyses were performed to investigate signaling pathways related to NOS3 expression.
Results: In normal tissues, NOS3 was expressed highest in the spleen and lowest in the blood. NOS3 expression was increased in stomach adenocarcinoma (STAD) and significantly associated with poor prognosis of patients. Immunohistochemical staining validated that NOS3 was an independent prognostic factor of gastric cancer. Several canonical cancer-related pathways were found to be correlated with NOS3 expression in STAD. The expression of NOS3 was related to the response to QS-11 and brivinib in STAD.
Conclusions: NOS3 was an independent prognostic factor for patients with STAD. Increased expression of NOS3 influenced occurrence and development of STAD through several canonical cancer-related pathways. Drug response analysis reported drugs to suppress NOS3. NOS3 might be a novel target for gastric cancer treatment.
Introduction
NOS3 (endothelial NOS, eNOS) is a member of the nitric oxide synthase (NOS) enzyme family, which is a cluster of catalytic enzymes that mainly participate in nitric oxide (NO) generation (1). The NOS3 protein is encoded by the NOS3 gene, located on chromosome 7q36.1. Usually, NOS3 protein is constitutively expressed in cells in an inactive state. Following the increase in calcium (Ca2+) concentration in cells, it can be activated by combining with the CaM protein. In addition, the direct combination of NOS3 with caveolin-1 (CAV-1) and heat shock protein 90 (HSP90) and the phosphorylation (Ser-1177) of NOS3 by PI3K/Akt signaling can modulate the activity of NOS3 protein (2–4).
NOS3 protein was initially found to participate in NO generation, mainly in endothelial cells, and is associated with cardiovascular diseases such as hypertension, atherosclerosis, and diabetes mellitus (5). In recent years, NOS3 has been found to play various roles in malignant tumors, such as inhibiting apoptosis and promoting angiogenesis, proliferation, invasiveness, and immunosuppression (6–8). Circulating NOS3 levels were inversely correlated with progression-free survival and overall survival (OS) of metastatic colorectal cancer patients (9). Another research in mesenchymal colorectal cancer patients reported that NOS3 upregulation occurs after Apc loss, which was associated with poor prognosis (10). In breast cancer, the increasing expression of NOS3 was reported to be a pro-angiogenic factor (11). It was found to promote angiogenesis via PI3K/Akt/mTOR pathway, and enhance the migration and invasion via NOS3-NO-sGC-cGMP signaling in breast cancer cells (12, 13). In pancreatic cancer, NOS3 promoted tumor maintenance through the PI3K-Akt-NOS3-RAS (wild type) pathway (14). NOS3 inhibition by the inhibitor N(G)-nitro-L-arginine methyl ester (L-NAME) could suppress pancreatic ductal adenocarcinoma cancer (PDAC) tumor growth (15). NOS3 activation was reported to promote the antiandrogen-resistant growth through NO-mediated AR suppression in prostate cancer (PCa) (16). And NOS3 was found to participate in promoting aggressive phenotype of PCa, resulting in poor prognosis in PCa patients (17). In addition, Trachootham et al. found that non-tumorigenic epithelial cells from oral and ovarian tissue could be induced to become invasive in stroma containing p53-deficient fibroblasts, through NOS3/RNS/ICAM1 signaling (18). NOS3 was also found to participate in oncogenic inflammation and immunosuppression of tumors through NOTCH1-PI3K/AKT-NOS3 axis (19). NOS3 expression inhibition was involved in cervical cancer cell sensitivity to radiotherapy (20). Additionally, many studies have reported that NOS3 gene polymorphisms are associated with risk for cancer progression, cancer susceptibility and drug response (21–23). However, research by Smeda et al. reported that NOS3 activity and phosphorylation reduction was an early event in the lung metastasis of breast cancer, preceding the onset of the mesenchymal phenotype (EndMT) (24). NOS3 participated in the enhancement of Taxol chemosensitivity with astragaloside IV treatment in breast cancer as a downstream target of caveolin-1 (25). These studies suggest that NOS3 may perform multiple functions depending on different tumor types, and genetic background. Studies on NOS3 expression in tumors are still scarce, and the functions of NOS3 in tumor pathogenesis, especially in gastric cancer, are not comprehensively understood.
By applying data from the Genotype-Tissue Expression (GTEx; https://www.gtexportal.org/home/), the Cancer Genome Atlas (TCGA; https://portal.gdc.cancer.gov/) and the Cancer Cell Line Encyclopedia (CCLE; https://portals.broadinstitute.org/ccle/), the expression level of NOS3 in 30 different normal human tissues and 33 different tumors types, as well as the corresponding normal tissues and 1,457 cancer cell lines was systematically analyzed. We investigated the relationship between NOS3 expression and the clinical phenotypes of patients for all cancers and then separately for each cancer type. Subsequently, GSVA and GSEA analyses were performed to investigate signaling pathways related to NOS3 expression. Subsequently, NOS3 protein level was individually assessed in gastric cancer tissues. Ultimately, the correlation between NOS3 expression level in 664 cancer cells and cell response to 544 drugs was analyzed to explore the potential of NOS3 as a therapeutic target.
Materials and Methods
Download of TCGA and GTEx Datasets
TOIL GTEx and TCGA (primary tumor and normal tissues) gene expression RNA-seq data (IlluminaHiSeq: log2-normalized_count+ 1) and TCGA phenotype data, containing 9359 TCGA tumor tissues, 727 TCGA normal tissues and 7792 GTEx normal tissues, were obtained from UCSC Xena (https://xena.ucsc.edu/). TOIL reprocesses raw GTEx and TCGA RNA-seq data to correct for batch effects and to allow for the merging of samples across GTEx and TCGA datasets for pan-analyses (26).
Analyses of NOS3 Differential Expression in Tumor and Normal Tissues
To analyze the differential expression of NOS3 between TCGA tumors and normal tissues, t-test was applied for tumor types with at least two normal tissues. The median gene expression level was employed to calculate the fold change. Then, the log2-fold change (cancer vs. normal) was employed as the x-axis and -log10 p-value was employed as the y-axis to produce a Volcano plot for each tumor type. The expression profiles NOS3 mRNA within and between tumor types were graphed using GraphPad Prism (version 7) (San Diego, CA, USA).
Analyses of NOS3 Expression and Clinical Phenotypes
NOS3 expression levels among different tumor stages (TNM stage) were assessed by t-test (for two groups) and ANOVA analyses (for three and more groups). To assess the relationship of NOS3 expression to overall survival (diagnosis to death), the median of NOS3 expression in each tumor was used as cutoff value to divide patients into two groups, and Cox proportional hazards models were employed. OS time was defined as the time from the day at diagnosis to the date of death (dead patients) or the date of the last follow-up. Cox proportional hazards model was used to generate hazard ratio (HR) and 95% confidence interval (CI) for each cancer types. Kaplan-Meier survival analysis and the log-rank test was applied to calculate p-value. A forest plot was constructed to visually display the hazard ratio (HR) and 95% CI for each tumor type. p < 0.05 was considered a significant correlation. The survival curve and forest plot were generated by GraphPad Prism.
GSEA and GSVA Analyses
Gene Set Enrichment Analyses (GSEA) was performed by GSEA v4.1.0 (www.broadinstitute.org/gsea) to detect discrepantly enriched signaling pathways between NOS3 higher and lower group. The gene set “c2.cp.kegg.v7.1.symbols.gmt” from MSigDB gene set was selected as reference gene set. Signaling pathways with normalized p < 0.05, normalized enrichment score (NES) >1.5 and false discovery rate (FDR) q < 0.25 was considered as statistically significant.
We utilized the R package “GSVA” to perform Gene Set Variation Analysis (GSVA) analyses of NOS3 expression to find the pathways most associated with NOS3 expression. P < 0.05 was regarded as statistically significant. The gene set “c2.cp.kegg.v7.1.symbols.gmt,” was selected as the reference gene set. Signaling pathways commonly enriched by GSEA and GSVA analysis were considered to be potential pathways related to NOS3 expression.
Cell Lines NOS3 Expression
NOS3 mRNA expression, promoter DNA methylation, and copy number data were downloaded from the Cancer Cell Line Encyclopedia (CCLE, https://portals.broadinstitute.org/ccle/), which contained RNA-seq data, DNA methylation data from the matching reduced representation bisulfite sequencing (RRBS) and copy number data of 1,457 human cancer cell lines. NOS3 expression levels among different cell lines of different cancer types were investigated. Box plots and scatter plots were downloaded from the CCLE website. The relation of NOS3 mRNA to promoter DNA methylation and copy number was evaluated by Spearman correlation analysis.
Drug Responses
The drug response data were obtained from the Cancer Therapeutics Response Portal (CTRP, https://portals.broadinstitute.org/ctrp.v2.1/), which contained the responses of 664 cell lines to 482 drugs. Spearman correlation analyses was also performed to evaluate the association of NOS3 expression with drug responses (area under the curve, AUC) first for all cell lines together and then individually in STAD. Then, correlation r-value was employed as the x-axis and -log10 p-value was employed as the y-axis to produce a Volcano plot. NOS3 mRNA was used as x-axis and AUC was used as y-axis to generate a scatter plot. The volcano and scatter plots were plotted using GraphPad Prism.
Immunohistochemical Staining and Result Analysis of Patients
In total, 90 clinical samples from gastric cancer patients were collected from the First Affiliated Hospital of China Medical University (Shenyang, China) from January 2013 to December 2014. Demographic and clinical characteristics such as age at initial diagnosis, gender, initial diagnosis date, and tumor stage were also collected. All the patients provided informed consent. And this study was approved by the ethics committee of the First Affiliated Hospital of China Medical University.
Formalin-fixed tissues were embedded in paraffin and cut into 5-μm thick sections for H&E staining and immunohistochemical staining. The expression level of NOS3 was detected by streptavidin-peroxidase method. Antigen of de-waxed sections were exposed to 3% H2O2 for 10 min at room temperature to quench the endogenous peroxidase activity. Then the tissues were blocked with goat serum for 30 min at room temperature. After incubation with NOS3 primary antibody (Abcam, 1:100) overnight at 4°C, tissues were incubated with the secondary antibody (10 min) and biotin-labeled horseradish peroxidase (10 min). Next, 3,30-diaminobenzidine tetrahydrochloride (DAB) kit (Maixin, China) was used to visualize the antibody binding. Eventually, immunohistochemical staining was observed under an inverted phase contrast microscope.
Immunoreactivity was dependently evaluated using semi-quantitatively method by two investigators. Five representative regions were randomly selected from the 400-fold field of view of the microscope. The immunoreactive score was determined by the proportion of positive cells and the staining intensity. The proportion of positive cells was scored as follows: <9%, 0; 10–25%, 1; 26–50%, 2; 51–75%, 3; 76–100%, 4. The staining intensity was scored as follows: 0 for no staining, 1 for light yellow, 2 for yellow, and 3 for brown. The final immunoreactive score was the product of the two scores.
Statistical Analyses
For all statistical analyses, a p < 0.05 was considered statistically significant. All statistical analyses and visualization were accomplished by using GraphPad Prism 7 and R software (R version 3.6.0).
Results
NOS3 mRNA Expression in Various Normal Tissues and Tumors
To comprehensively analyze NOS3 expression and distribution in human normal tissues and tumor tissues, we first analyzed NOS3 mRNA expression level in 30 different normal tissues from GTEx and 33 different tumor tissues from Xena (https://xenabrowser.net/). The expression of NOS3 was highly variable across different normal tissues and tumor tissues (Figure 1, Supplementary Figure 1). In normal tissues, the median NOS3 expression levels varied from 5.624 (blood) to 12.8 (spleen). Tissues with the highest NOS3 expression were spleen (12.8 ± 1.391), heart (10.64 ± 1.099), testis (10.59 ± 0.532). Tissues with the lowest NOS3 expression were blood (5.624 ± 1.325), skin (7.904 ± 1.753), pancreas (8.363 ± 1.159).
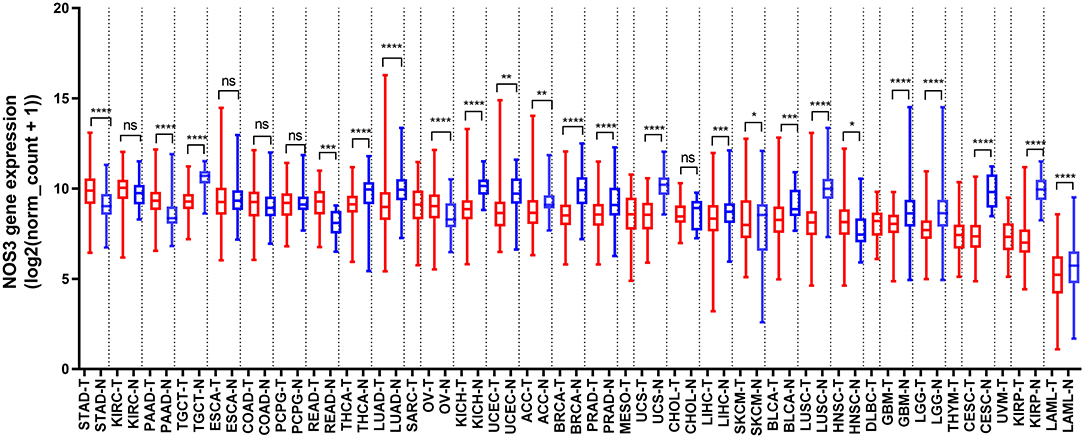
Figure 1. NOS3 mRNA expression in various normal tissues and tumors. NOS3 is differentially expressed between tumor and normal tissues in some cancers from TCGA and GTEx databases. Each boxplot represents NOS3 expression [RNA-seq RSEM, log2(normalized count +1)] across different cancers. Red is for tumors and blue is for normal tissues. The bar represents median expression of tumors or normal tissues and lower and upper box ends represent the 25th and 75th percentile expression. ns, without statistical significance, *p < 0.05, **p < 0.01, ***p < 0.001, ****p < 0.0001, based on Student's t-test.
In tumor tissues, NOS3 expression levels varied from 9.85 (stomach adenocarcinoma, STAD) to 5.071 (acute myeloid leukemia, LAML). Tumor tissues with the highest NOS3 expression were STAD (9.85 ± 1.018), kidney renal clear cell carcinoma (KIRC, 9.848 ± 0.9791), pancreatic adenocarcinoma (PAAD, 9.297 ± 0.8167). Tumor tissues with the lowest NOS3 expression were LAML (5.071 ± 1.591), kidney renal papillary cell carcinoma (KIRP, 7.173 ± 1.14), uveal melanoma (UVM, 7.278 ± 0.9764).
NOS3 mRNA Expression in Tumor Cell Lines
Considering that tissue-based RNA expression detection might be complicated by the non-tumor tissues that are adjacent to tumor cells, we analyzed NOS3 mRNA expression in 1457 cell lines derived from 26 tumor types in the CCLE database. Initially, NOS3 expression in different cell lines was checked and the results showed that cell lines from STAD and COAD were the top two cell lines expressing the highest levels of NOS3 mRNA, and cell lines from nerve system tissues (e.g., GBM and neuroblastoma) and bone tissues (e.g., chondrosarcoma and osteosarcoma) expressed relatively lower NOS3 mRNA (Figure 2A). Interestingly, NOS3 in STAD was expressed at the highest level both in stomach tissues from TCGA and in stomach cell lines from CCLE. Further analysis of the association between NOS3 mRNA and promoter DNA methylation level showed a weak correlation (Spearman correlation coefficient = 0.1282, p = 0.0002, Figure 2B). Spearman correlation analysis between NOS3 mRNA and copy number did not show statistical significance (p = 0.1193, Figure 2C). These results indicated that promoter DNA methylation and copy number variants of the NOS3 gene might not be the main determinant of NOS3 mRNA levels. Tumor necrosis factor (TNF)-α was reported to decrease functional activity of NOS3 mRNA 3′-untranslated region (3′-UTR), regulating the translation process (27). In this research, we further determined the correlation between TNF-α mRNA and NOS3 mRNA to verity if TNF-α affect transcription process of NOS3. However, there was only a weak correlation between them (spearman r = 0.1119, p = 0.003), suggesting that TNF-α might affect expression to a certain extent, but not a decisive factor (Supplementary Figure 2).

Figure 2. NOS3 mRNA expression in tumor cell lines. (A) NOS3 mRNA expression across different cell lines from CCLE. (B) A scatter plot of promoter DNA methylation and mRNA levels of NOS3 across different cell lines is shown. (C) A scatter plot of copy number variation and mRNA level of NOS3 across different cell lines. The correlation between two variables is analyzed by Spearman analysis.
NOS3 Is Differentially Expressed in Various Tumors and Their Corresponding Normal Tissues
We analyzed NOS3 mRNA expression levels across tumors and their corresponding normal tissues in 28 tumor types that had three or more normal tissues data based on TCGA and GTEx database (Figure 1). NOS3 mRNA expression in 6 of 28 tumor types, rectum adenocarcinoma (READ), STAD, PAAD, ovarian serous cystadenocarcinoma (OV), skin cutaneous melanoma (SKCM), head and neck squamous cell carcinoma (HNSC), was much higher than that in corresponding normal tissues, with statistical significance. Furthermore, we analyzed fold change (FC) of NOS3 mRNA between tumor and corresponding normal tissues (Figures 3A,B). The FC in READ, STAD, PAAD, OV, SKCM, and HNSC ranged from 1.276 to 2.180. In cancer tissues and cancer cell lines, NOS3 mRNA expressed highest in STAD. The differential analysis results showed that expression of NOS3 in cancer tissues is 1.765-fold higher than that of corresponding normal tissues (p < 0.0001).
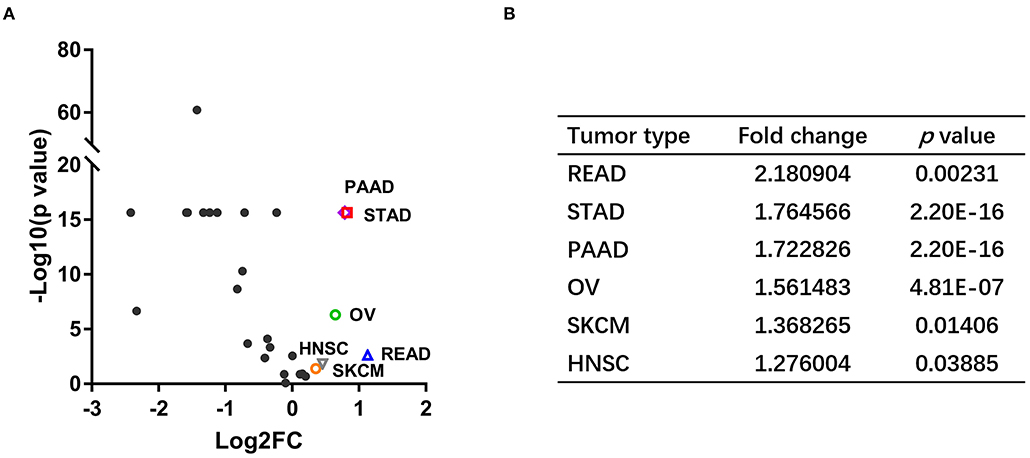
Figure 3. NOS3 is differentially expressed in various tumors and their corresponding normal tissues. (A) Scatter plot of log2 FC and minus log10(p-value) across different cancers. The horizontal line on the Y-axis represents a p-value of 0.05. Points above the horizontal line have statistical significance. The vertical line on the X-axis represents log2 FC was−1 or 1, respectively. (B) The log2 FC and p-value in the six tumor types, which expressed higher NOS3 mRNA level.
Association Between NOS3 mRNA Expression and Clinical Phenotypes
We analyzed the association between NOS3 expression and tumor stage in 6 tumor types that had stage information in TCGA. Stages I and II were combined as early stage, and stages III and IV were combined as advanced stage. The result of t-test showed that in SKCM, patients with advanced tumor stage expressed higher NOS3 mRNA levels, indicating that NOS3 mRNA might positively related to later tumor stage (Figure 4A). However, NOS3 expression in STAD patients did not show difference in early and advanced tumor stage (early stage: mean of NOS3 expression = 9.888 ± 0.9934; advanced stage: mean = 9.872 ± 1.025, p = 0.6653) (Supplementary Figure 3). NOS3 mRNA in READ, PAAD, OV, and HNSC also showed no correlation with tumor stage.
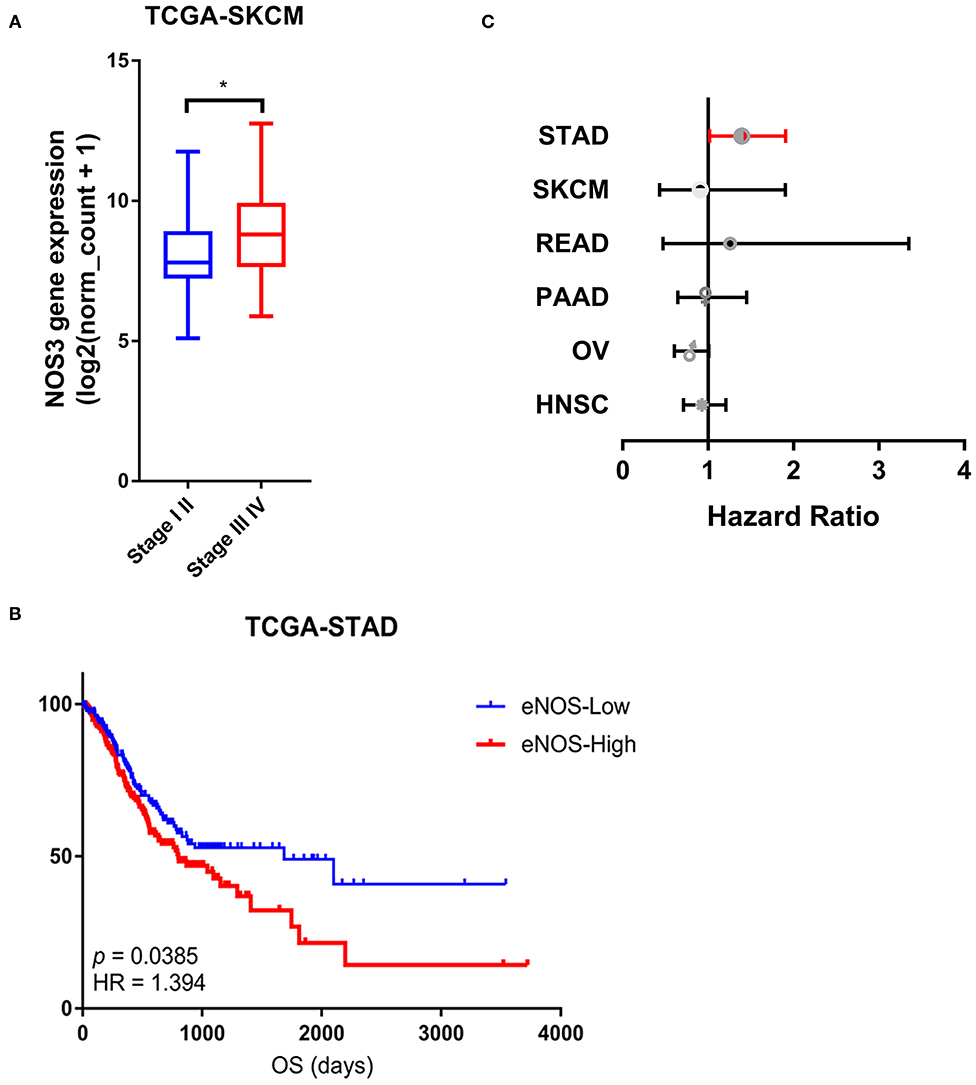
Figure 4. Association between NOS3 mRNA expression and clinical phenotypes. (A) NOS3 expression between the early and advanced stages in SKCM. T-test was applied to analyses in the early stage and advanced stage. *p < 0.05. (B) The NOS3 expression level is related to overall survival in STAD. In the survival curves, the red line represents high NOS3 expression levels and the blue line represents low NOS3 expression levels. (C) A forest plot for survival association of each cancer is shown. The X-axis is the HR, the small points are the estimate of HR for each tumor and the bar represents the 95% confidence interval. Cox proportional hazards models were used to evaluate the association of NOS3 expression levels on overall survival.
To analyze the relationship between NOS3 expression and overall survival of tumor patients, log-rank test was performed in six tumor types. We found that among the six tumor types expressed higher NOS3 level, NOS3 mRNA was related to a worse prognosis in patients with STAD (median survival: 1,686 vs. 801, p = 0.0133385, HR = 1.394) (Figure 4B). However, NOS3 mRNA did not show correlation with OS in READ, PAAD, OV, SKCM, HNSC (Figure 4C).
Increased Expression Level of NOS3 Was Related to Poor Prognoses of Gastric Cancer Patients
Through the above pan-cancer analysis, we found that NOS3 has a higher expression level in gastric cancer tissues, and it is significantly related to the poor prognosis of gastric cancer patients. Furthermore, the expression pattern of NOS3 protein was explored in clinical tissue samples to validate the role of NOS3 in gastric cancer. Based on NOS3 protein expression levels, gastric cancer patients (N = 90) were divided into NOS3 positive (N = 45) and NOS3 negative (N = 45) group. The relationship of demographic and clinicopathological parameters with NOS3 expression was analyzed using Chi square analysis. The results showed that NOS3 expression was related to survival state (p = 0.049), but other parameters (gender, age, tumor stage, and grade) showed no correlation with NOS3 expression (Table 1). Kaplan-Meier curves and log-rank test analyses confirmed that patients with positive NOS3 expression had significantly shorter overall survival (OS) than patients with negative NOS3 expression (p = 0.0278, Figures 5A,B). Furthermore, cox proportional-hazards model was used to validate the potential of NOS3 as a prognostic factor in gastric cancer. Univariate cox regression suggested that NOS3 expression (HR = 2.166, 95% CI: 1.065–4.405, p = 0.033) and tumor stage (HR = 4.775, 95% CI: 2.213–10.302, p < 0.001), were related to OS. Multivariate cox regression indicated that NOS3 expression (HR = 2.416, 95% CI: 1.181–4.941, p = 0.016) and tumor stage (HR = 5.101, 95% CI: 2.353–11.058, p < 0.001) were independent prognostic factors for OS (Figure 5C). In summary, NOS3 was an independent prognostic factor for patients with gastric cancer.
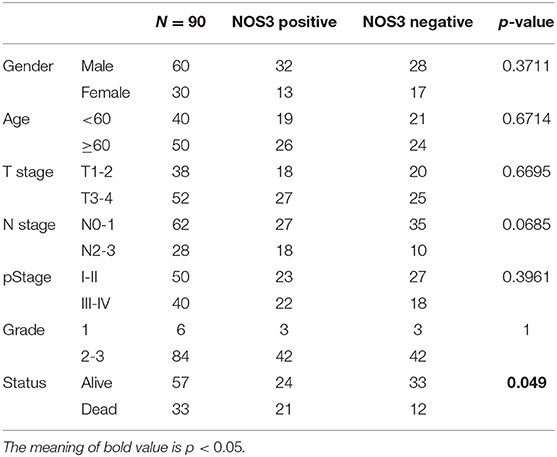
Table 1. Demographic and clinicopathological parameters of patients with gastric cancer.
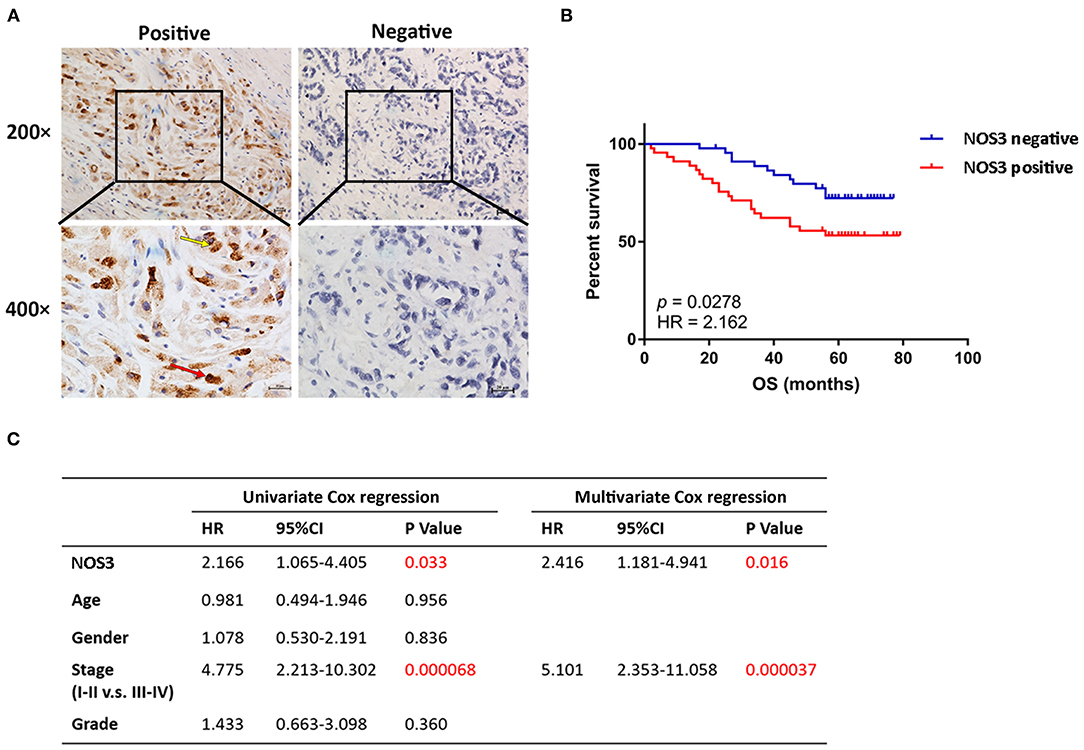
Figure 5. NOS3 was independent prognostic factor of patients with gastric cancer. (A) Representative images of positive and negative NOS3 protein expression in gastric cancer tissues. NOS3 was expressed in cytoplasm (yellow arrow) and nucleus (red arrow) of tumor cells. There were 45 patients stained positive and 45 patients stained negative. The scales bars indicate 20 μm. (B) Kaplan-Meier analysis of NOS3 protein in gastric cancer patients. Patients with higher NOS3 expression had shorter OS compared with patients with lower NOS3 expression (p = 0.0278, HR = 2.162). (C) Univariate and multivariate cox regression showed that higher NOS3 protein expression and advanced pathological stage were independent prognostic factor in gastric cancer patients.
Mechanism of NOS3 Influencing the Clinical Outcome in STAD
In order to explore the mechanism underlying NOS3 affecting clinical outcome of patients with STAD, GSEA and GSVA analyses were performed. Under the conditions of p < 0.05, FDR q < 0.25 and NES more than 1.5, GSVA and GSEA analyses commonly enriched 27 KEGG signaling pathways (Figures 6A–H, Table 2). Several canonical signaling pathways generally acknowledged to promote pathological behavior of malignant tumors were involved, such as “KEGG_ABC_TRANSPORTERS,” “KEGG_CALCIUM_SIGNALING_PATHWAY,” “KEGG_ECM_ RECEPTOR_INTERACTION,” “KEGG_CYTOKINE_ CYTOKINE_RECEPTOR_INTERACTION,” “KEGG_ CHEMOKINE_SIGNALING_PATHWAY” and “KEGG_MAPK_ SIGNALING_PATHWAY.” These results indicated that NOS3 might participate in multiple canonical cancer-related signaling pathways to facilitate STAD.

Figure 6. GSEA and GSVA analyses in STAD. (A) Top 15 differentially enriched KEGG signaling pathways in higher and lower NOS3 expression groups analyzed by GSVA in STAD. (B) Seven signaling pathways commonly enriched by GSEA and GSVA in STAD. (C–H) Signaling pathways enriched by GSEA analyses in STAD.
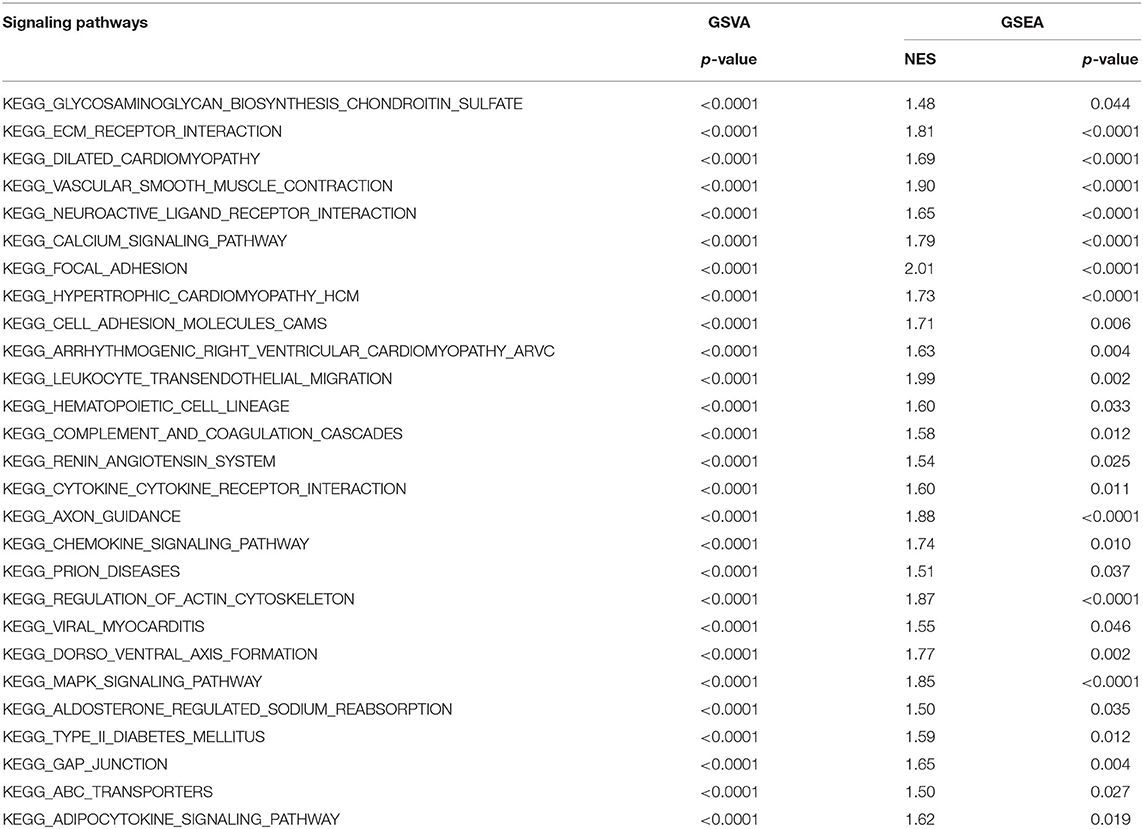
Table 2. GSVA and GSEA analyses revealed mechanism of NOS3 participant in occurrence and development of STAD.
Association Between NOS3 Expression and Drug Sensitivity
To investigate the correlation between NOS3 mRNA expression and drug sensitivity, NOS3 expression in 664 cell lines and drug response to 482 drugs were analyzed. Spearman correlation analysis revealed that, “SR8278” was considered to moderately correlate with NOS3 mRNA expression, with a correlation coefficient >0.3 (Figure 7A). A negative correlation indicated that a better response (smaller response AUC value) was correlated with increased expression of NOS3. “SR8278” is an antagonist of the transcription factor REV-ERBα, affecting its circadian and metabolic functions. Two other drugs, “GSK.J4” and “CIL55A” had a correlation coefficient >0.2 and were also negatively correlated. Subsequently, Spearman analysis were performed to investigate the correlation of NOS3 expression with drug response individually in STAD. The results showed that response of cells to QS-11 (correlation coefficient r = −0.8986, p = 0.0278) and brivanib (correlation coefficient r = −0.7182, p = 0.0162) was significantly correlated with NOS3 mRNA level (Figures 7B,C).
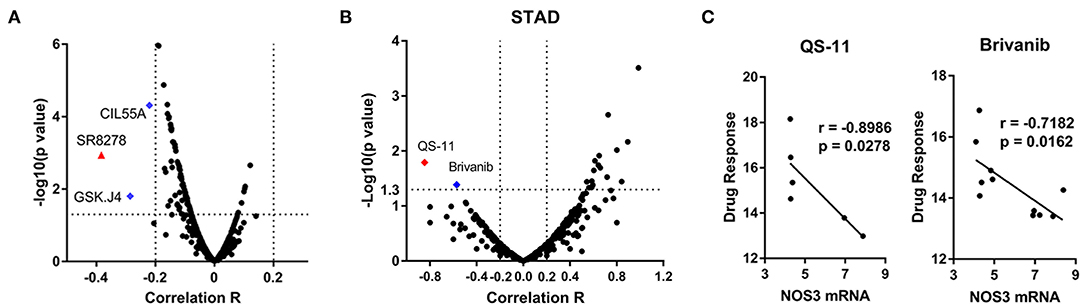
Figure 7. Association between NOS3 expression and drug sensitivity. (A) Volcano plot of the correlation coefficient and minus log10(p-value) between NOS3 expression in all cell lines and 482 drugs. Most of correlations are not significant and in negative direction. The correlation coefficient of “SR8278” is >0.3 (negative, higher expression is correlated with better response represented by smaller AUC). Blue dots are the drugs with correlation coefficients >0.2. (B,C) Spearman analysis performed individually in STAD. Volcano plot of the correlation coefficient and minus log10(p-value) between NOS3 expression in STAD cell lines was shown in B (including 23132-87, NCI-N87, MKN-45, MKN-1, HS746T, NUGC-3, MKN-7, IM-95, HGC-27, OCUM-1, FU-97, and AGS cells). The response of cells to QS-11 (correlation coefficient r = −0.8986, p = 0.0278) and brivanib (correlation coefficient r = −0.7182, p = 0.0162) was significantly correlated with NOS3 mRNA level. The scatter plots of QS-11 and brivanib were shown in (C).
Discussion
NOS3 has been found to inhibit apoptosis and promote angiogenesis, proliferation, invasiveness, and immunosuppression of malignant tumors. However, because of the limited number of studies on NOS3 expression in malignant tumors, NOS3 functions in tumor pathogenesis and development are still not fully understood. And the expression pattern of NOS3 and its diagnostic and prognostic potential has not been investigated in a pan-cancer perspective. In this study, the expression level of NOS3 (mainly mRNA) in 30 different normal human tissues, 33 different tumors types as well as their corresponding normal tissues, and 1,457 cancer cell lines was systematically analyzed, to determine the expression level of NOS3 in tumor and normal tissues and its role in malignant tumors. We also explored its potential association with clinical characteristics (pathological stage, OS and drug response).
Pan-cancer analysis focused on whole genome can reveal genes that are associated with the occurrence and development of cancer, providing insights into cancer diagnosis, monitoring and treatment (28–30). By analyzing NOS3 mRNA levels in normal tissues from GTEx, we found that NOS3 was expressed at the highest level in the spleen and was expressed at the lowest level in the blood. According to the Human Protein Atlas (www.proteinatlas.org) database, the NOS3 protein level in the spleen was also the highest, which was consisted with our results. And research has reported that NOS3 is mainly upregulated in endothelial progenitor cells (EPCs) of the spleen, exerting beneficial functions on atherosclerosis, angiogenesis, and vascular repair (31, 32). And in 33 tumor types involved in this study, NOS3 mRNA was expressed highest in STAD. Analyses in cancer cell lines showed that NOS3 was expressed at quite high levels in COAD and STAD cell lines. Previous research showed that NOS3 promoter DNA methylation could reduce NOS3 mRNA level (33). Copy number variations (CNVs) could also modify gene mRNA expression (34). However, further analyses about promoter DNA methylation and CNVs of NOS3 gene suggested that neither of the two factors showed a strong statistical correlation with NOS3 mRNA, indicating that promoter DNA methylation and CNVs of the NOS3 gene might not be the main determinant of NOS3 mRNA levels in tumors.
Analyses of TCGA data showed that NOS3 expression increased in six tumor tissues compared with their corresponding normal tissues. Among the six tumor types, NOS3 related to advanced tumor stage in SKCM. Previous research reported by Panich et al. suggested that NOS3 inhibition could effectively protect against UVA-dependent melanogenesis (35). In addition, patients with higher NOS3 levels were diagnosed with a later tumor stage in COAD (Supplementary Figure 4A). This was consistent with the observation that L-NIO (a NOS3 inhibitor) inhibited cell growth and angiogenesis in colorectal cancer (36, 37). In BRCA, we also found that the higher expression of NOS3 mRNA was related to advanced tumor stage (Supplementary Figure 4B). These results were consistent with previous researches, which reported that NOS3 promoted angiogenesis and enhance the migration and invasion in breast cancer cells (11–13).
There are few researches have reported NOS3 in STAD. Doi et al. reported in 1999 that the quantity of NOS3 in gastric cancer tissues was negatively correlated with serosal invasion (38). And NOS3 has been reported to promote the angiogenic phenotype and predict poor prognosis in STAD (39). In our research, expression level of NOS3 was significantly increased in STAD tumor tissues, and its expression level was the highest among the tumor types and cancer cell lines involved in this study. Analyses of clinical parameters also showed that NOS3 predicted poor prognosis, consistent with previous research. These results confirmed the important role of NOS3 in the development of STAD. Furthermore, experiments and analyses in our gastric cancer tissues also indicated that higher NOS3 protein level was closely related to shorter OS of gastric cancer patients. NOS3 was an independent prognostic factor for patients with gastric cancer. However, NOS3 showed no correlation with tumor stage in mRNA and protein level. It may be due to the limitation of sample size. The sample size needs to be increased for further verification in future research. At present, the mechanism of NOS3 promoting STAD progression was not clear. Therefore, we further analyzed the potential signaling pathways participating in NOS3 promoting gastric cancer. The results of GSEA and GSVA analyses suggested that in STAD, several canonical cancer-related pathways were enriched in higher NOS3 expression group. As key members of “KEGG_ABC_TRANSPORTERS,” ATP binding cassette (ABC) transporters were identified to mediate multidrug-resistance (MDR) in acute myeloid leukemia (AML), OV, BRCA, and lung cancer (40, 41). And researches also reported that ATP-binding cassette transporter G1 (ABCG1), a member of ABC transporter family, could modulate the interaction of Cav-1 and NOS3 protein in endothelial cells (ECs), and increase cell migration through Lyn/Akt/NOS3 in endothelial progenitor cells (EPCs). “KEGG_CALCIUM_SIGNALING_PATHWAY” contributes to many crucial tumor pathology processes, including proliferation, invasion, cell death, and autophagy in many tumors (42–45). As described above, the increased concentration of Ca2+ could induce the combination of CaM protein and NOS3 protein, and subsequently stimulate the activity of NOS3 protein (2, 46). We also enriched “KEGG_ECM_RECEPTOR_INTERACTION.” Specific interactions between the extracellular matrix (ECM) and cells are mediated by transmembrane molecules, including integrins, proteoglycans, and other cell-surface-associated components. These interactions can lead to malignant biological behavior of tumor cells, such as adhesion, migration, proliferation, and apoptosis (47, 48). A study by Njah et al. found that Agrin interacted with Lrp4-Integrin β1-FAK axis in ECs. This interaction could sustain the VEGFR2 pathway as well as stimulate NOS3 signaling, and ultimately promote angiogenesis in tumor (49). In addition, “KEGG_CYTOKINE_CYTOKINE_RECEPTOR_INTERACTION,” “KEGG_CHEMOKINE_SIGNALING_PATHWAY,” and “KEGG_MAPK_SIGNALING_PATHWAY” were also generally recognized as cancer-related signaling pathway. These pathways were widely involved in tumor occurrence and development. The mechanism of these signaling pathways involved in NOS3 regulation of gastric cancer needs further study.
Currently, research on NOS3-targeted medicine is mainly concentrating on cardiovascular and cerebrovascular disease. Many inhibitors and agonists have been found to have satisfactory therapeutic effects. For example, ursolic acid, which has an anti-tumor effect, has been proven to promote NOS3 phosphorylation and inhibit NOS3 uncoupling, thereby preventing doxorubicin-induced cardiac toxicity (50). However, the research on and application of NOS3-targeted medicine in malignant tumors are still extremely limited. The NOS3 inhibitor L-NIO was reported to inhibit COAD cell growth and angiogenesis. Another NOS3 inhibitor, N(G)-nitro-L-arginine methyl ester (L-NAME) was also reported to inhibit PAAD tumor growth (15). In addition, L-NIO could promote the anti-tumor effect of lenvatinib (36, 37). The NOS3 level was significantly correlated with outcomes of bevacizumab-based chemotherapy in COAD (9, 51). Unfortunately, bevacizumab, L-NIO, and L-NAME were not included in the CTRP database. Our research showed that “SR8278,” an antagonist of Rev-ErbAα was negatively correlated with NOS3 expression, indicating that NOS3 was the potential target of “SR8278.” “SR8278” targeted NR1D1, a nuclear hormone receptor (52), reiterating the potential relationship between NOS3 and NR1D1. Further analyses in STAD showed that response of STAD cancer cells to QS-11 and brivanib were strongly correlated with NOS3 expression. QS-11 is an inhibitor of GTPase activating protein of ARF (ARFGAP), increasing ARF1-GTP and ARF6-GTP levels (53). Currently, studies on QS-11 in malignant tumor are very few. Only one research by Zhang et al. reported that the combination of QS-11 and ARFGAP1 protein could stimulate Wnt/β-catenin signaling pathway, resulting in the regulation of cell differentiation, proliferation, and apoptosis (54). Our research suggested that QS-11 may play an important role in STAD by inhibiting NOS3, which requires further research in the future. Brivanib is a dual tyrosine kinase inhibitor used to treat solid tumor in advanced stages. It can selectively target vascular endothelial growth factor receptor (VEGFR) and fibroblast growth factor receptor (FGFR) (55, 56). However, the response of NOS3 expressed cell to brivanib has not been reported. NOS3 was a downstream molecular of VEGFR signaling pathway. Thus, we guessed that brivanib might regulate NOS3 through VEGFR signaling pathway. These results about drug response warrant further investigation.
In conclusion, this research showed that the expression level and clinical significance of NOS3 was highly cancer-dependent. Analyses in public data sets gastric cancer tissues demonstrated that higher NOS3 expression was related to poor prognosis of patients with STAD. NOS3 was an independent prognostic factor for patients with STAD. Increased expression of NOS3 might influence occurrence and development of STAD through several canonical cancer-related pathways. In addition, NOS3 expression was related to some therapeutic drugs, such as “SR8278” and “brivanib,” which warrant further investigation. These results reported that NOS3 might participate in occurrence and development of gastric cancer by canonical signaling pathways, suggesting that NOS3 might a novel target for gastric cancer treatment.
Data Availability Statement
Publicly available datasets were analyzed in this study. This data can be found at: UCSC Xena (https://xena.ucsc.edu/), CCLE (CCLE; https://portals.broadinstitute.org/ccle/), and CTRP (https://portals.broadinstitute.org/ctrp.v2.1/).
Ethics Statement
The studies involving human participants were reviewed and approved by the ethics committee of the First Affiliated Hospital of China Medical University. The patients/participants provided their written informed consent to participate in this study.
Author Contributions
YZ, YT, and ZJ: project administration. ZL, FL, and JZ: software. DZ, YC, YM, and ZJ: statistical analysis. JS, CY, and YJ: visualization. DZ and YY: manuscript writing. All authors: contributed to the article and approved the submitted version.
Funding
This work was supported by National Natural Science Foundation of China (No. 82073244, 81270036, 30901736), the Plan to Focus on Research and Development from Science and Technology project of Liaoning Province (No. 2017225029), Shenyang Youth Science and Technology Innovation Talent Project (RC200267).
Conflict of Interest
The authors declare that the research was conducted in the absence of any commercial or financial relationships that could be construed as a potential conflict of interest.
Acknowledgments
The authors thank the colleges in the First Laboratory of Cancer Institute for data collation and statistical analysis. This manuscript has been released as a pre-print at Research Square (57).
Supplementary Material
The Supplementary Material for this article can be found online at: https://www.frontiersin.org/articles/10.3389/fonc.2021.592761/full#supplementary-material
Supplementary Figure 1. NOS3 mRNA expression level in normal tissues from GTEx database.
Supplementary Figure 2. A scatter plot of NOS3 mRNA and TNF-α mRNA. The correlation between two variables is analyzed by Spearman analysis.
Supplementary Figure 3. Association between NOS3 mRNA expression and tumor stage in STAD. ANOVA analysis showed that tumor stages (stage I-IV) were not related to NOS3 expression, with p-value more than 0.05 (mean ± SD: I, 9.63 ± 1.139; II, 10.01 ± 0.8962; III, 9.845 ± 1.014; IV,9.983 ± 1.075) (A). T-test also suggested that tumor stages (stage I-II and stage III-IV) showed no connection with NOS3 expression, with p-value more than 0.05 (mean ± SD: I-II, 9.888 ± 0.9934; III-IV, 9.872 ± 1.025) (B).
Supplementary Figure 4. Association between NOS3 mRNA expression and tumor stage in COAD (A) and BRCA (B) (*p < 0.05, **p < 0.01).
Supplementary Table 1. Case number of all the tumor types.
References
1. Xu W, Liu LZ, Loizidou M, Ahmed M, Charles IG. The role of nitric oxide in cancer. Cell Res. (2002) 12:311–20. doi: 10.1038/sj.cr.7290133
2. Fischmann TO, Hruza A, Niu XD, Fossetta JD, Lunn CA, Dolphin E, et al. Structural characterization of nitric oxide synthase isoforms reveals striking active-site conservation. Nat Struct Biol. (1999) 6:233–42. doi: 10.1038/6675
3. Trane AE, Pavlov D, Sharma A, Saqib U, Lau K, van Petegem F, et al. Deciphering the binding of caveolin-1 to client protein endothelial nitric-oxide synthase (eNOS): scaffolding subdomain identification, interaction modeling, and biological significance. J Biol Chem. (2014) 289:13273–83. doi: 10.1074/jbc.M113.528695
4. Pritchard KA, Ackerman AW, Ou J, Curtis M, Smalley DM, Fontana JT, et al. Native low-density lipoprotein induces endothelial nitric oxide synthase dysfunction: role of heat shock protein 90 and caveolin-1. Free Radical Biol Med. (2002) 33:52–62. doi: 10.1016/S0891-5849(02)00851-1
5. Xia N, Daiber A, Habermeier A, Closs EI, Thum T, Spanier G, et al. Resveratrol reverses endothelial nitric-oxide synthase uncoupling in apolipoprotein E knockout mice. J Pharmacol Exp Therap. (2010) 335:149–54. doi: 10.1124/jpet.110.168724
6. Ying L, Hofseth LJ. An emerging role for endothelial nitric oxide synthase in chronic inflammation and cancer. Cancer Res. (2007) 67:1407–10. doi: 10.1158/0008-5472.CAN-06-2149
7. Song Y, Zhao XP, Song K, Shang ZJ. Ephrin-A1 is up-regulated by hypoxia in cancer cells and promotes angiogenesis of HUVECs through a coordinated cross-talk with eNOS. PLoS ONE. (2013) 8:e74464. doi: 10.1371/journal.pone.0074464
8. Zhang L, Zeng M, Fu BM. Inhibition of endothelial nitric oxide synthase decreases breast cancer cell MDA-MB-231 adhesion to intact microvessels under physiological flows. Am J Physiol Heart Circul Physiol. (2016) 310:H1735–47. doi: 10.1152/ajpheart.00109.2016
9. Marisi G, Scarpi E, Passardi A, Nanni O, Ragazzini A, Valgiusti M, et al. Circulating VEGF and eNOS variations as predictors of outcome in metastatic colorectal cancer patients receiving bevacizumab. Sci Rep. (2017) 7:1293. doi: 10.1038/s41598-017-01420-0
10. Penarando J, Lopez-Sanchez LM, Mena R, Guil-Luna S, Conde F, Hernandez V, et al. A role for endothelial nitric oxide synthase in intestinal stem cell proliferation and mesenchymal colorectal cancer. BMC Biol. (2018) 16:3. doi: 10.1186/s12915-017-0472-5
11. Maniyar R, Chakraborty S, Suriano R. Ethanol enhances estrogen mediated angiogenesis in breast cancer. J Cancer. (2018) 9:3874–85. doi: 10.7150/jca.25581
12. Sharma S, Guru SK, Manda S, Kumar A, Mintoo MJ, Prasad VD, et al. A marine sponge alkaloid derivative 4-chloro fascaplysin inhibits tumor growth and VEGF mediated angiogenesis by disrupting PI3K/Akt/mTOR signaling cascade. Chem Biol Interact. (2017) 275:47–60. doi: 10.1016/j.cbi.2017.07.017
13. Gajalakshmi P, Priya MK, Pradeep T, Behera J, Muthumani K, Madhuwanti S, et al. Breast cancer drugs dampen vascular functions by interfering with nitric oxide signaling in endothelium. Toxicol Appl Pharmacol. (2013) 269:121–31. doi: 10.1016/j.taap.2013.03.011
14. Lim KH, Ancrile BB, Kashatus DF, Counter CM. Tumour maintenance is mediated by eNOS. Nature. (2008) 452:646–9. doi: 10.1038/nature06778
15. Lampson BL, Kendall SD, Ancrile BB, Morrison MM, Shealy MJ, Barrientos KS, et al. Targeting eNOS in pancreatic cancer. Cancer Res. (2012) 72:4472–82. doi: 10.1158/0008-5472.CAN-12-0057
16. Yu S, Jia L, Zhang Y, Wu D, Xu Z, Ng CF, et al. Increased expression of activated endothelial nitric oxide synthase contributes to antiandrogen resistance in prostate cancer cells by suppressing androgen receptor transactivation. Cancer Lett. (2013) 328:83–94. doi: 10.1016/j.canlet.2012.09.006
17. Nanni S, Aiello A, Re A, Guffanti A, Benvenuti V, Colussi C, et al. Estrogen-dependent dynamic profile of eNOS-DNA associations in prostate cancer. PLoS ONE. (2013) 8:e62522. doi: 10.1371/journal.pone.0062522
18. Trachootham D, Chen G, Zhang W, Lu W, Zhang H, Liu J, et al. Loss of p53 in stromal fibroblasts promotes epithelial cell invasion through redox-mediated ICAM1 signal. Free Radical Biol Med. (2013) 58:1–13. doi: 10.1016/j.freeradbiomed.2013.01.011
19. Villegas SN, Gombos R, Garcia-Lopez L, Gutierrez-Perez I, Garcia-Castillo J, Vallejo DM, et al. PI3K/Akt cooperates with oncogenic notch by inducing nitric oxide-dependent inflammation. Cell Rep. (2018) 22:2541–9. doi: 10.1016/j.celrep.2018.02.049
20. Li Q, Wei X, Zhou ZW, Wang SN, Jin H, Chen KJ, et al. GADD45alpha sensitizes cervical cancer cells to radiotherapy via increasing cytoplasmic APE1 level. Cell Death Dis. (2018) 9:524. doi: 10.1038/s41419-018-0452-x
21. Su CW, Chien MH, Lin CW, Chen MK, Chow JM, Chuang CY, et al. Associations of genetic variations of the endothelial nitric oxide synthase gene and environmental carcinogens with oral cancer susceptibility and development. Nitric Oxide. (2018) 79:1–7. doi: 10.1016/j.niox.2018.06.005
22. Zhu Y, Jiang H, Chen Z, Lu B, Li J, Peng Y, et al. The genetic association between iNOS and eNOS polymorphisms and gastric cancer risk: a meta-analysis. Onco Targets Therap. (2018) 11:2497–507. doi: 10.2147/OTT.S161925
23. Di Salvatore M, Lo Giudice L, Rossi E, Santonocito C, Nazzicone G, Rodriquenz MG, et al. Association of IL-8 and eNOS polymorphisms with clinical outcomes in bevacizumab-treated breast cancer patients: an exploratory analysis. Clin Trans Oncol. (2016) 18:40–6. doi: 10.1007/s12094-015-1334-7
24. Smeda M, Kieronska A, Adamski MG, Proniewski B, Sternak M, Mohaissen T, et al. Nitric oxide deficiency and endothelial-mesenchymal transition of pulmonary endothelium in the progression of 4T1 metastatic breast cancer in mice. Breast Cancer Res. (2018) 20:86. doi: 10.1186/s13058-018-1013-z
25. Zheng Y, Dai Y, Liu W, Wang N, Cai Y, Wang S, et al. Astragaloside IV enhances taxol chemosensitivity of breast cancer via caveolin-1-targeting oxidant damage. J Cell Physiol. (2019) 234:4277–90. doi: 10.1002/jcp.27196
26. Vivian J, Rao AA, Nothaft FA, Ketchum C, Armstrong J, Novak A, et al. Toil enables reproducible, open source, big biomedical data analyses. Nat Biotechnol. (2017) 35:314–6. doi: 10.1038/nbt.3772
27. Choi S, Kim J, Kim JH, Lee DK, Park W, Park M, et al. Carbon monoxide prevents TNF-α-induced eNOS downregulation by inhibiting NF-κB-responsive miR-155-5p biogenesis. Exp Mol Med. (2017) 49:e403. doi: 10.1038/emm.2017.193
28. Ju Q, Li X, Zhang H, Yan S, Li Y, Zhao Y. NFE2L2 is a potential prognostic biomarker and is correlated with immune infiltration in brain lower grade glioma: a pan-cancer analysis. Oxid Med Cell Longev. (2020) 2020:3580719. doi: 10.1155/2020/3580719
29. ICGC/TCGA Pan-Cancer Analysis of Whole Genomes Consortium. Pan-cancer analysis of whole genomes. Nature. (2020) 578:82–93. doi: 10.1038/s41586-020-1969-6
30. PCAWG Transcriptome Core Group, Calabrese C, Davidson NR, Demircioglu D, Fonseca NA, He Y, et al. Genomic basis for RNA alterations in cancer. Nature. (2020) 578:129–36. doi: 10.1038/s41586-020-1970-0
31. Laufs U, Werner N, Link A, Endres M, Wassmann S, Jurgens K, et al. Physical training increases endothelial progenitor cells, inhibits neointima formation, and enhances angiogenesis. Circulation. (2004) 109:220–6. doi: 10.1161/01.CIR.0000109141.48980.37
32. Gertz K, Priller J, Kronenberg G, Fink KB, Winter B, Schrock H, et al. Physical activity improves long-term stroke outcome via endothelial nitric oxide synthase-dependent augmentation of neovascularization and cerebral blood flow. Circul Res. (2006) 99:1132–40. doi: 10.1161/01.RES.0000250175.14861.77
33. Krause BJ, Peñaloza E, Candia A, Cañas D, Hernández C, Arenas GA, et al. Adult vascular dysfunction in foetal growth-restricted guinea-pigs is associated with a neonate-adult switching in Nos3 DNA methylation. Acta Physiol. (2019) 227:e13328. doi: 10.1111/apha.13328
34. Zarrei M, MacDonald JR, Merico D, Scherer SW. A copy number variation map of the human genome. Nat Rev Genet. (2015) 16:172–83. doi: 10.1038/nrg3871
35. Panich U, Tangsupa-a-nan V, Onkoksoong T, Kongtaphan K, Kasetsinsombat K, Akarasereenont P, et al. Inhibition of UVA-mediated melanogenesis by ascorbic acid through modulation of antioxidant defense and nitric oxide system. Arch Pharm Res. (2011) 34:811–20. doi: 10.1007/s12272-011-0515-3
36. Altun A, Temiz TK, Balci E, Polat ZA, Turan M. Effects of tyrosine kinase inhibitor E7080 and eNOS inhibitor L-NIO on colorectal cancer alone and in combination. Chinese J Cancer Res. (2013) 25:572–84. doi: 10.3978/j.issn.1000-9604.2013.10.10
37. Gao Y, Zhou S, Xu Y, Sheng S, Qian SY, Huo X. Nitric oxide synthase inhibitors 1400W and L-NIO inhibit angiogenesis pathway of colorectal cancer. Nitric Oxide. (2019) 83:33–9. doi: 10.1016/j.niox.2018.12.008
38. Doi C, Noguchi Y, Marat D, Saito A, Fukuzawa K, Yoshikawa T, et al. Expression of nitric oxide synthase in gastric cancer. Cancer Lett. (1999) 144:161–7. doi: 10.1016/S0304-3835(99)00222-0
39. Wang L, Shi GG, Yao JC, Gong W, Wei D, Wu TT, et al. Expression of endothelial nitric oxide synthase correlates with the angiogenic phenotype of and predicts poor prognosis in human gastric cancer. Gastric Cancer. (2005) 8:18–28. doi: 10.1007/s10120-004-0310-7
40. Robey RW, Pluchino KM, Hall MD, Fojo AT, Bates SE, Gottesman MM. Revisiting the role of ABC transporters in multidrug-resistant cancer. Nat Rev Cancer. (2018) 18:452–64. doi: 10.1038/s41568-018-0005-8
41. Fletcher JI, Williams RT, Henderson MJ, Norris MD, Haber M. ABC transporters as mediators of drug resistance and contributors to cancer cell biology. Drug Resist Updates. (2016) 26:1–9. doi: 10.1016/j.drup.2016.03.001
42. Monteith GR, Prevarskaya N, Roberts-Thomson SJ. The calcium-cancer signalling nexus. Nat Rev Cancer. (2017) 17:367–80. doi: 10.1038/nrc.2017.18
43. Berridge MJ. The inositol trisphosphate/calcium signaling pathway in health and disease. Physiol Rev. (2016) 96:1261–96. doi: 10.1152/physrev.00006.2016
44. Huang Q, Cao H, Zhan L, Sun X, Wang G, Li J, et al. Mitochondrial fission forms a positive feedback loop with cytosolic calcium signaling pathway to promote autophagy in hepatocellular carcinoma cells. Cancer Lett. (2017) 403:108–18. doi: 10.1016/j.canlet.2017.05.034
45. Gregório C, Soares-Lima SC, Alemar B, Recamonde-Mendoza M, Camuzi D, de Souza-Santos PT, et al. Calcium signaling alterations caused by epigenetic mechanisms in pancreatic cancer: from early markers to prognostic impact. Cancers. (2020) 12:1735. doi: 10.3390/cancers12071735
46. Jin SW, Choi CY, Hwang YP, Kim HG, Kim SJ, Chung YC, et al. Betulinic acid increases eNOS phosphorylation and NO synthesis via the calcium-signaling pathway. J Agric Food Chem. (2016) 64:785–91. doi: 10.1021/acs.jafc.5b05416
47. Najafi M, Farhood B, Mortezaee K. Extracellular matrix (ECM) stiffness and degradation as cancer drivers. J Cell Biochem. (2019) 120:2782–90. doi: 10.1002/jcb.27681
48. Marsico G, Russo L, Quondamatteo F, Pandit A. glycosylation and integrin regulation in cancer. Trends Cancer. (2018) 4:537–52. doi: 10.1016/j.trecan.2018.05.009
49. Njah K, Chakraborty S, Qiu B, Arumugam S, Raju A, Pobbati AV, et al. A role of agrin in maintaining the stability of vascular endothelial growth factor receptor-2 during tumor angiogenesis. Cell Rep. (2019) 28:949–65.e7. doi: 10.1016/j.celrep.2019.06.036
50. Mu H, Liu H, Zhang J, Huang J, Zhu C, Lu Y, et al. Ursolic acid prevents doxorubicin-induced cardiac toxicity in mice through eNOS activation and inhibition of eNOS uncoupling. J Cell Mol Med. (2019) 23:2174–83. doi: 10.1111/jcmm.14130
51. Ulivi P, Scarpi E, Passardi A, Marisi G, Calistri D, Zoli W, et al. eNOS polymorphisms as predictors of efficacy of bevacizumab-based chemotherapy in metastatic colorectal cancer: data from a randomized clinical trial. J Trans Med. (2015) 13:258. doi: 10.1186/s12967-015-0619-5
52. Ferder IC, Fung L, Ohguchi Y, Zhang X, Lassen KG, Capen D, et al. Meiotic gatekeeper STRA8 suppresses autophagy by repressing Nr1d1 expression during spermatogenesis in mice. PLoS Genet. (2019) 15:e1008084. doi: 10.1371/journal.pgen.1008084
53. Kanamarlapudi V, Thompson A, Kelly E, López Bernal A. ARF6 activated by the LHCG receptor through the cytohesin family of guanine nucleotide exchange factors mediates the receptor internalization and signaling. J Biol Chem. (2012) 287:20443–55. doi: 10.1074/jbc.M112.362087
54. Singh MK, Gao H, Sun W, Song Z, Schmalzigaug R, Premont RT, et al. Structure-activity relationship studies of QS11, a small molecule Wnt synergistic agonist. Bioorganic Med Chem Lett. (2015) 25:4838–42. doi: 10.1016/j.bmcl.2015.06.062
55. Hofman J, Sorf A, Vagiannis D, Sucha S, Kammerer S, Küpper JH, et al. Brivanib Exhibits Potential for Pharmacokinetic Drug-Drug Interactions and the Modulation of Multidrug Resistance through the Inhibition of Human ABCG2 Drug Efflux Transporter and CYP450 Biotransformation Enzymes. Molecular pharmaceutics. (2019) 16:4436–50. doi: 10.1021/acs.molpharmaceut.9b00361
56. Diaz-Padilla I, Siu LL. Brivanib alaninate for cancer. Expert Opinion Investigat Drugs. (2011) 20:577–86. doi: 10.1517/13543784.2011.565329
Keywords: NOS3, pan-cancer, gene expression, gastric cancer, eNOS
Citation: Zou D, Li Z, Lv F, Yang Y, Yang C, Song J, Chen Y, Jin Z, Zhou J, Jiang Y, Ma Y, Jing Z, Tang Y and Zhang Y (2021) Pan-Cancer Analysis of NOS3 Identifies Its Expression and Clinical Relevance in Gastric Cancer. Front. Oncol. 11:592761. doi: 10.3389/fonc.2021.592761
Received: 10 December 2020; Accepted: 08 February 2021;
Published: 04 March 2021.
Edited by:
Ruowen Zhang, Stony Brook University, United StatesReviewed by:
Hui-Ju Hsieh, City of Hope National Medical Center, United StatesErica Salvati, Italian National Research Council, Italy
Copyright © 2021 Zou, Li, Lv, Yang, Yang, Song, Chen, Jin, Zhou, Jiang, Ma, Jing, Tang and Zhang. This is an open-access article distributed under the terms of the Creative Commons Attribution License (CC BY). The use, distribution or reproduction in other forums is permitted, provided the original author(s) and the copyright owner(s) are credited and that the original publication in this journal is cited, in accordance with accepted academic practice. No use, distribution or reproduction is permitted which does not comply with these terms.
*Correspondence: Ye Zhang, emhhbmd5ZWNtdUAxNjMuY29t