 Tengfei Qi1†Xiangqi Meng1†Zhenyu Wang1Xinyu Wang1Nan Sun1Jianguang Ming1Lejia Ren1
 Chuanlu Jiang1*
 Jinquan Cai1,2*
- 1Department of Neurosurgery, The Second Affiliated Hospital of Harbin Medical University, Harbin, China
- 2Department of Microbiology, Tumor and Cell Biology (MTC), Biomedicum, Karolinska Institutet, Stockholm, Sweden
Introduction: Proneural and mesenchymal subtypes are the most distinct demarcated categories in classification scheme, and there is often a shift from proneural type to mesenchymal subtype in the progression of glioblastoma (GBM). The molecular characters are determined by specific genomic methods, however, the application of radiography in clinical practice remains to be further studied. Here, we studied the topography features of GBM in proneural subtype, and further demonstrated the survival characteristics and proneural-mesenchymal transition (PMT) progression of samples by combining with the imaging variables.
Methods: Data were acquired from The Cancer Imaging Archive (TCIA, http://cancerimagingarchive.net). The radiography image, clinical variables and transcriptome subtype from 223 samples were used in this study. Proneural and mesenchymal subtype on GBM topography based on overlay and Voxel-based lesion-symptom mapping (VLSM) analysis were revealed. Besides, we carried out the comparison of survival analysis and PMT progression in and outside the VLSM-determined area.
Results: The overlay of total GBM and separated image of proneural and mesenchymal subtype revealed a correlation of the two subtypes. By VLSM analysis, proneural subtype was confirmed to be related to left inferior temporal medulla, and no significant voxel was found for mesenchymal subtype. The subsequent comparison between samples in and outside the VLSM-determined area showed difference in overall survival (OS) time, tumor purity, epithelial-mesenchymal transition (EMT) score and clinical variables.
Conclusions: PMT progression was determined by radiography approach. GBM samples in the VLSM-determined area tended to harbor the signature of proneural subtype. This study provides a valuable VLSM-determined area related to the predilection site, prognosis and PMT progression by the association between GBM topography and molecular characters.
Introduction
Glioblastoma (GBM), mainly diagnosed by magnetic resonance imaging (MRI) and accurate pathological examination, is the most aggressive brain tumor and indicates a poor prognosis (1). The current standard of care refers to maximal surgical resection followed by local radiotherapy and chemotherapy. However, the tumor evolves rapidly in the progression, which is linked to resistance to adjuvant treatment (2, 3).
As a non-invasive checking method, MRI is capable of conducting qualitative and quantitative analysis with specific phenotypic imaging features, to associate with potential prognosis and characteristics (4). The genomic characteristics of heterogeneous MRI features in GBM are investigated and determined by scholars in a growing number of studies, which provide chances for grouping, prognostication and innovation of targeted therapies (5, 6). As a newly developed terminology, Visually Accessible Rembrandt Images (VASARI) feature set (https://wiki.nci.nih.gov/display/CIP/VASARI) incorporates various visible subjective imaging features, which is designed to normalize grading of the distinct features of gliomas on MRI, containing different grades criteria corresponding to diverse score to depict severity (7).
GBM with specific anatomical region shows similarity in genomic alterations and gene expression patterns (8). Voxel-based lesion-symptom mapping (VLSM) approach is one of the most common method to explore the relationship between GBM topography in MRI and lesion-behavior based on voxel-by-voxel method (9). In consideration of tumorigenesis and progression characteristics of GBM, VLSM is widely used to investigate tumor location involved in occupation and other affected secondary diseases (10). VLSM analysis is reported to identify the genomic alterations and the object-action dissociation in studies (11, 12).
Both MRI features and transcriptome analysis reveal distinct subtypes of GBM with different clinical and molecular characteristics (13). The Cancer Genome Atlas (TCGA, https://portal.gdc.cancer.gov/) has described a robust gene expression-based molecular classification of GBM including proneural, mesenchymal, neural, and classical subtypes (14). Notably, there is a consensus that proneural and mesenchymal subtypes are the most distinct demarcated categories among different subtypes (15–17). Proneural subtype is generally regarded as a common precursor of several molecular subtypes, while mesenchymal subtype indicates worst prognosis and lowest tumor purity (18–20). It is worth noting that there is plasticity for proneural subtype, and it has been proved to be with a tendency toward proneural-mesenchymal transition (PMT) progression during glioma progression (21, 22). Halliday found that a marked shift away from a proneural expression pattern toward a mesenchymal one in GBM (23). PMT progression may represent for GBM the equivalent of epithelial–mesenchymal transition (EMT) process associated with other aggressive cancers (24). The EMT process refers to transdifferentiation of epithelial cells into motile mesenchymal cells in tumor progression and metastasis, which is mediated by plenty of key transcription factors (25). To date, GBM topography in proneural or mesenchymal subtypes is not elaborately analyzed in previous studies.
In our study, we screened 223 samples in TCIA (The Cancer Imaging Archive, TCIA, http://cancerimagingarchive.net) database and elucidated the radiogenomic signatures in GBM via common MRI alignment. As for GBM topography for subtypes is not clear to date, we used VLSM method to evaluate the predilection sites of proneural and mesenchymal subtypes. The combination of VLSM method and VASARI features was applied to analyze overall survival (OS) and other significant information based on the VLSM-determined area, contributing to understand the genomics pathogenesis potentially.
Results
Demographic Characteristics
The distribution of 223 samples enrolled into the study were illustrated in Figure 1 (Supplementary Table 1). In the age distribution of patients, there were 65 patients (29% of 223) were between 50 and 60 years old. In the gender distribution of patients, there were 90 females (40% of 223) and 133 males (60% of 223). As high as 81 an d84% of the patients had received pharmaceutical and radiation treatment, respectively, while only 5 and 2% lack relevant information, respectively. Karnofsky performance status (KPS) value of 80 was in 49% of the patients. The OS time was in a range of 4–1,730 days. The survival of 100–300 days (34%) harbored the highest proportion. The patients who had received tumor resection procedure were 91%, and 19% of the patients only experienced excisional biopsy to acquire pathologic information. In the molecular subtypes distribution, mesenchymal subtype had a proportion of 33%, whereas proneural, neural and classical subtypes were 23, 18, and 26% of total, respectively.
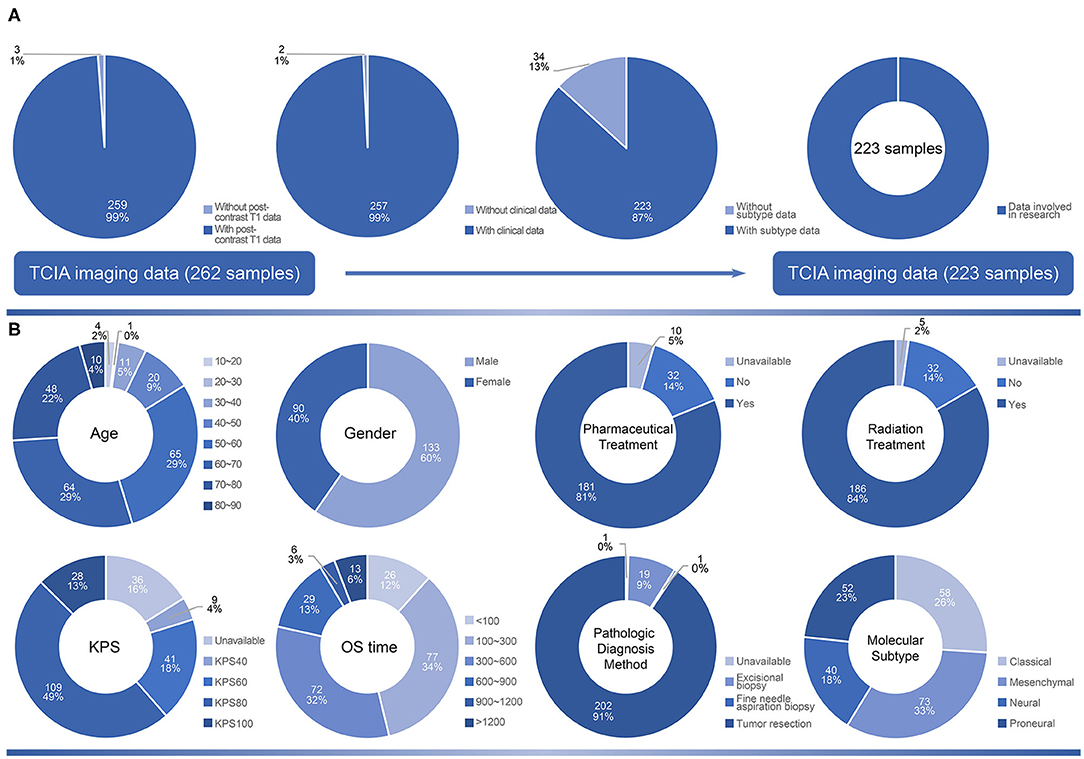
Figure 1. The selection criteria of the study and demographic characteristics of samples. (A) The original 262 samples collected from TCIA. According to the availability of post-contrast T1 image, clinical data and subtype data, 223 samples were included in the study. (B) The distribution of clinical variables including age, gender, pharmaceutical treatment, radiation treatment, KPS, OS time, pathologic diagnosis method and molecular subtype in 223 samples.
GBM topography at lobe level was summarized in Table 1. The predilection site of samples involved with temporal lobe (75.34% of total, 80.77% of proneural subtype, 68.50% of mesenchymal subtype, 82.50% of neural subtype, 74.13% of classical subtype). The proportion of single temporal lobe (21.92%) involved in mesenchymal subtype was a little higher than other subtypes. Samples with mesenchymal subtype had the highest percentage outside temporal lobes (31.51%). There were 103 samples with tumor located in the right hemisphere and 104 samples with tumor located in the left. All the subtypes indicated no obvious inclination in tumor side.
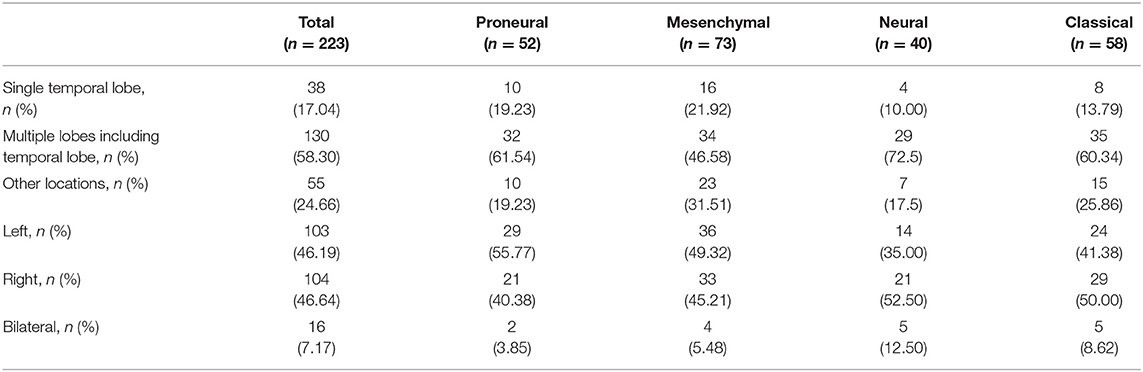
Table 1. The distribution of different subtypes based on tumor locations.
To further explore characteristics of GBM topography, the Volume of interests (VOIs) of the whole patient cohort were overlapped on the standard template (Figure 2). GBM topography was evenly distributed in periventricular zone and adjacent to the subventricular zone. In addition, there was no significant discrepancy between tumors in the left and those in the right side.
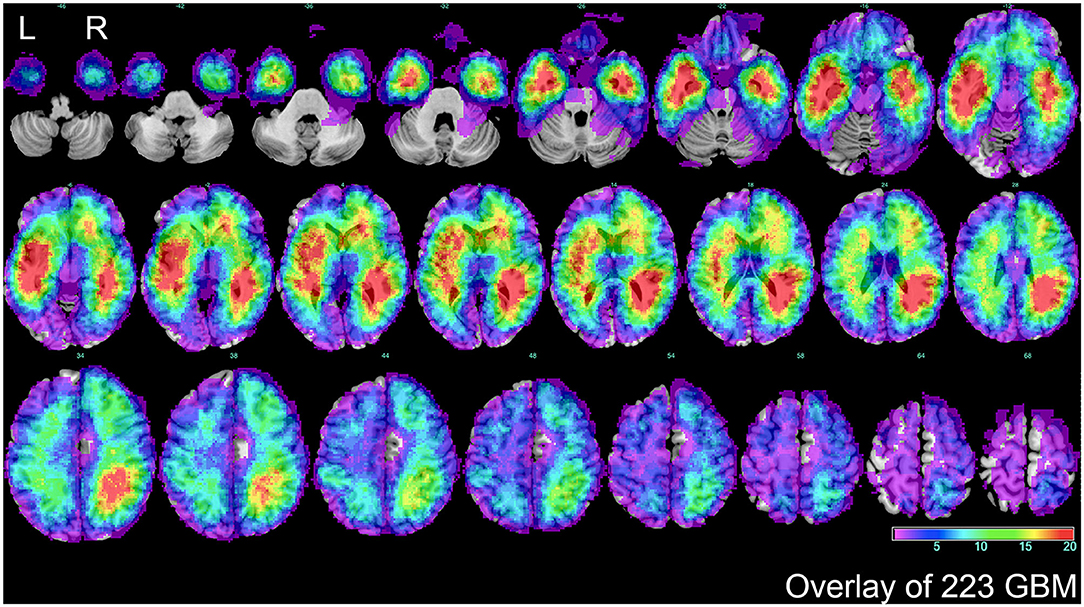
Figure 2. The overlap of total GBM lesions. VOIs of 223 GBM samples included in the study were overlaid on standard template. The color scale indicated the amount of the VOIs overlap from violet (1 case) to red (more than 20 cases). The distribution showed that a majority of GBM located in periventricular or subventricular region. L represented left side, and R represented right side.
VLSM-Determined Area
Firstly, separated tumor overlays were performed to detect GBM topography of proneural and mesenchymal subtypes, and we finally found that compared with integral overlay displayed in Figure 2, the overlays of two subtypes had diversities (Figures 3A,B). On one hand, overlay on the right side of the two subtypes resembled each other and showed a favorable agreement to integral overlay. On the other hand, two groups indicated different distribution on the left side. High frequency of tumor occurrence of the mesenchymal subtype located forward and close to frontal lobe, while hotspot of the proneural subtype located backwards in cerebral hemisphere and near occipital lobe. These results suggested that the two subtypes had a different tumorigenesis in topography but an intimate relation in progression.
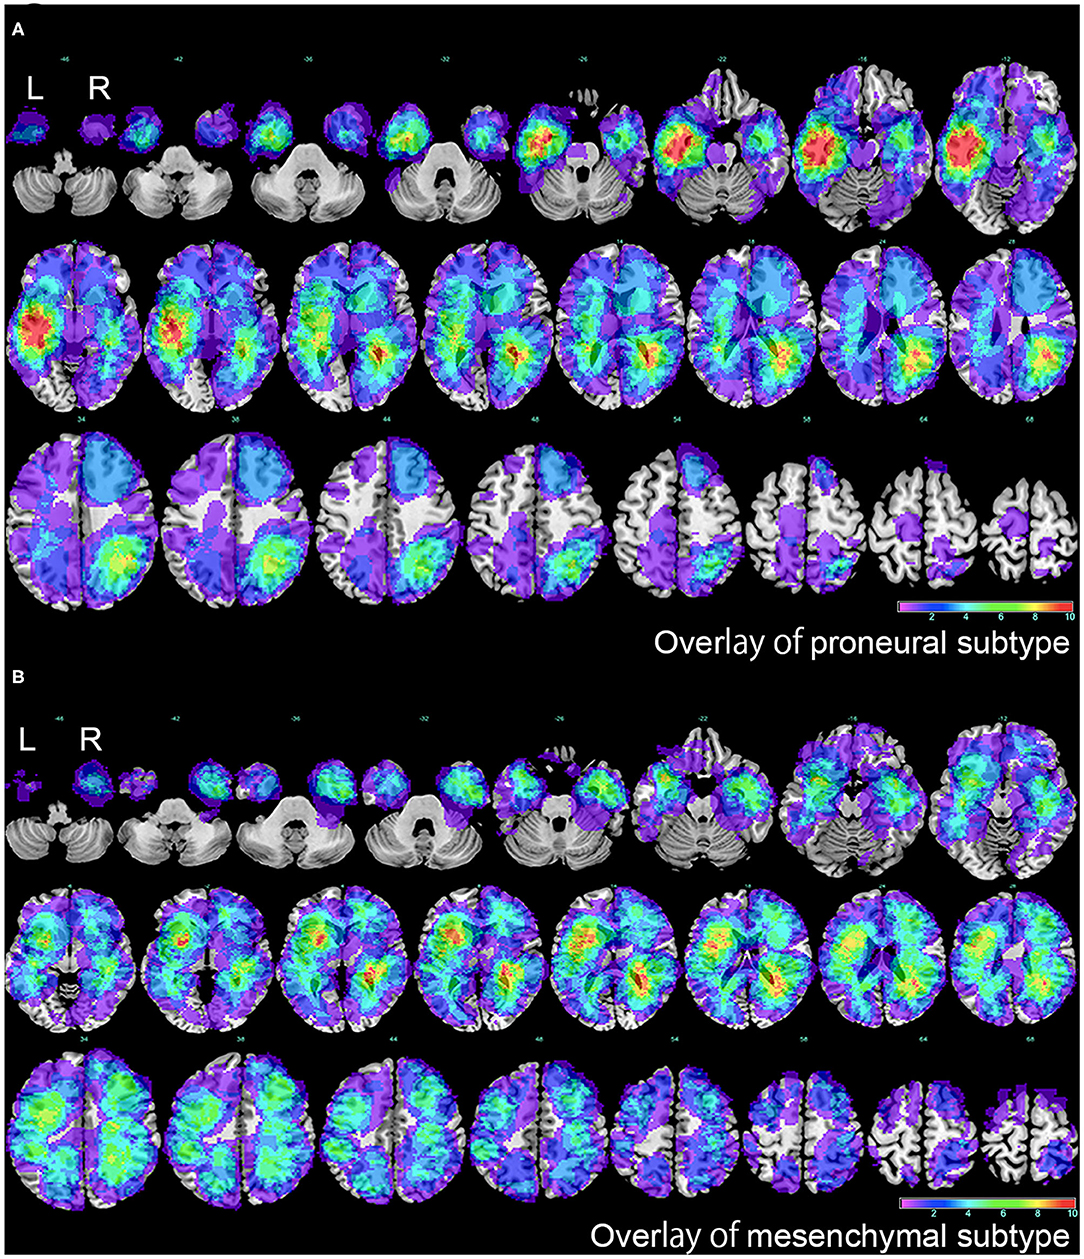
Figure 3. The overlap of proneural and mesenchymal subtypes of GBM. (A) The overlap of proneural subtype of GBM. The color scale indicated the amount of the VOIs overlap, from violet (1 case) to red (more than 10 cases). (B) The overlap of mesenchymal subtype of GBM. The color scale indicated the amount of the VOIs overlap, from violet (1 case) to red (more than 10 cases). L represented left side, and R represented right side.
To further explore PMT progression, we selected 125 samples comprised of 52 proneural and 73 mesenchymal subtypes to conduct VLSM analysis. The normalized lesion maps in proneural and mesenchymal subtypes were calculated independently. VLSM specifically associated proneural subtype with lesions to a cluster of the left inferior temporal medulla, while no significant voxel was found for mesenchymal subtype (Figure 4). The results of significant clusters of proneural subtype accorded with previous overlay map of the proneural subtype. According to whether the tumors were in or outside the VLSM-determined area of proneural subgroup, the samples were classified into two groups. Of the 125 samples, there were 33 samples in the VLSM-determined area, and 22 samples (67% of 33) were proneural subtype while 11 samples (33% of 33) were mesenchymal subtype. Among 92 samples that were outside the VLSM-determined area, 30 samples (33% of 92) were proneural subtype, whereas 62 samples (67% of 92) were mesenchymal subtype. We also observed that among 52 proneural samples, 22 samples (42% of 52) were in the VLSM-determined area while 30 samples (58% of 52) were outside the VLSM-determined area. Among 73 mesenchymal samples, 11 samples (15% of 73) were in the VLSM-determined area and 62 samples (85% of 73) were outside the VLSM-determined area (Table 2).
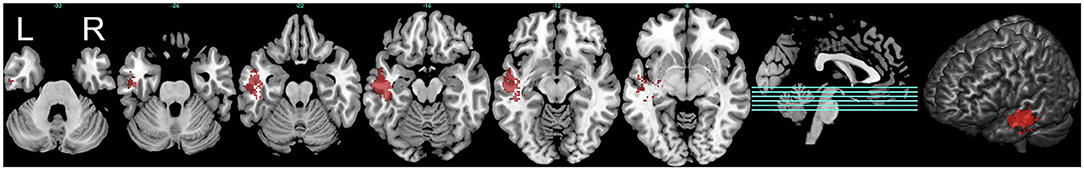
Figure 4. The predilection region of proneural subtype defined by VLSM analysis. The VLSM analysis determined the predilection regions of proneural subtype in the left inferior temporal medulla (marked in red). Three-dimensional render of the VLSM-determined area was also illustrated. L represented left side, and R represented right side. This figure only showed the result below an FDR-adjusted threshold (P < 0.05).
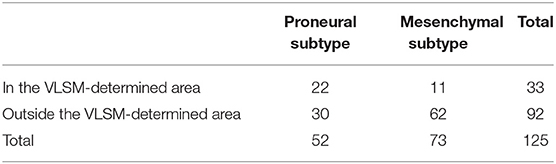
Table 2. The distribution of proneural and mesenchymal subtypes in and outside the VLSM-determined area.
Survival Analysis
Survival analysis was carried out to find whether the VLSM-determined area could serve as a prognostic role. Initially, to exclude some recognized factors that influence survival outcome obviously, we included samples with standard tumor resection, radiotherapy and pharmaceutical treatment to make the survival result more persuasive. Since contrast enhancement of MRI was associated with survival (26), we selected variable F5 of VASARI feature set to remove the bias of contrast enhancement on survival. In this study, 95% proportion of enhancing area is defined as the cut-off value of striking enhancement. Another variable F1 was also chosen as a reference, and GBM samples involved with temporal lobe were selected (Figure 5A). Kappa consistency test was executed before survival analysis. The results of inter-rater analysis for VASARI features indicated excellent agreement, and kappa values of F1 and F5 were 0.923 and 0.842, respectively (Table 3). Log-rank survival analysis showed that GBM samples in the VLSM-determined area had longer OS time compared with those outside the VLSM-determined area (P = 1.20E-2, Figure 5B). Then the data based on proneural or mesenchymal subtype were subdivided to find the significant difference of survival outcome. Proneural subtype in the VLSM-determined area predicted a longer OS time (P = 3.00E-03, Figure 5C), while in mesenchymal subtype, there was no significant difference between GBM samples in and outside the VLSM-determined area in survival analysis (P = 1.28E-01, Figure 5D).
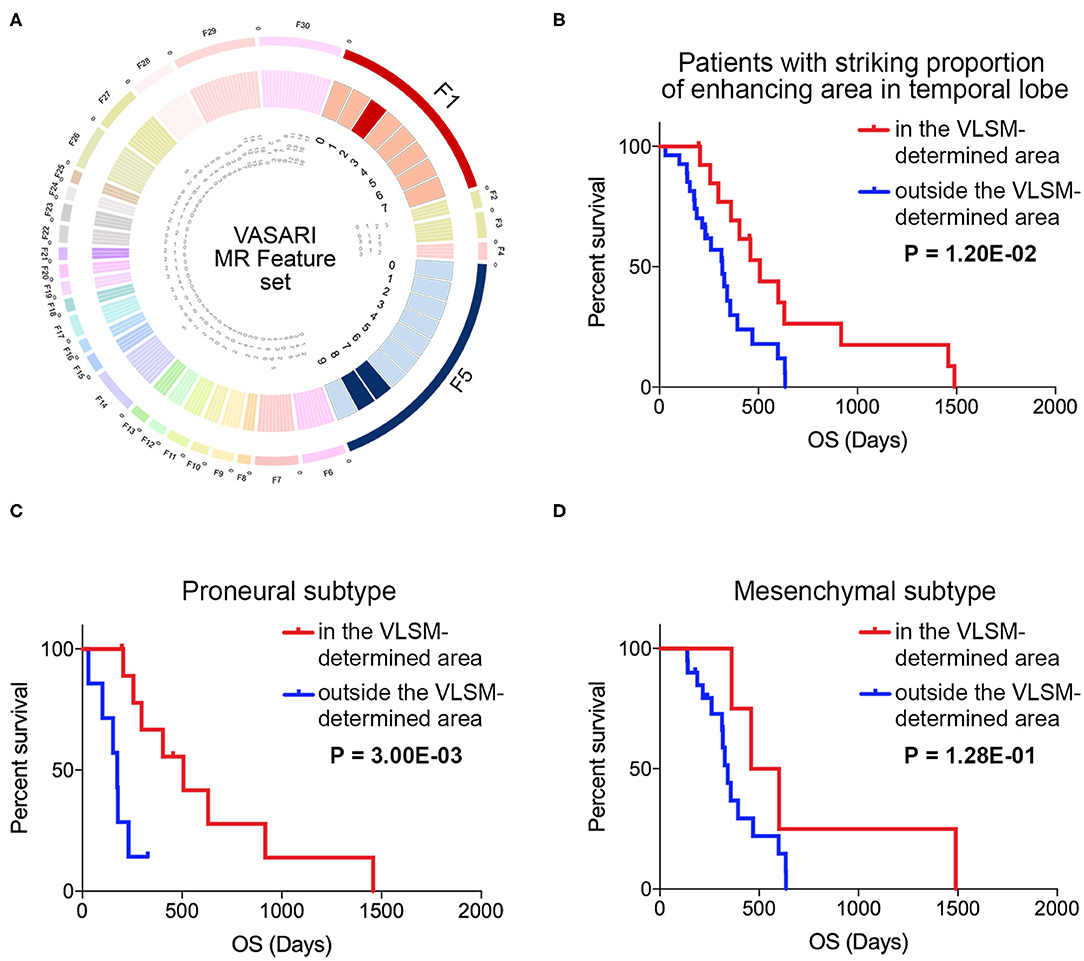
Figure 5. The VASARI feature set used for screening samples and survival analysis in and outside the VLSM-determined area. (A) The F1 and F5 in VASARI feature sets were applied. Patients with GBM involved temporal lobe with over 95% proportion of enhancing area were carried out for survival analysis. (B) Survival analysis illustrated the significantly different prognosis of patients with GBM in and outside the VLSM-determined area (P = 1.20E-02). (C) Survival analysis illustrated the significantly different prognosis of patients with proneural subtype of GBM in and outside the VLSM-determined area (P = 3.00E-03). (D) Survival analysis illustrated the prognosis of patients with mesenchymal subtype of GBM in and outside the VLSM-determined area (P = 1.28E-01). P-value was determined by log-rank test.
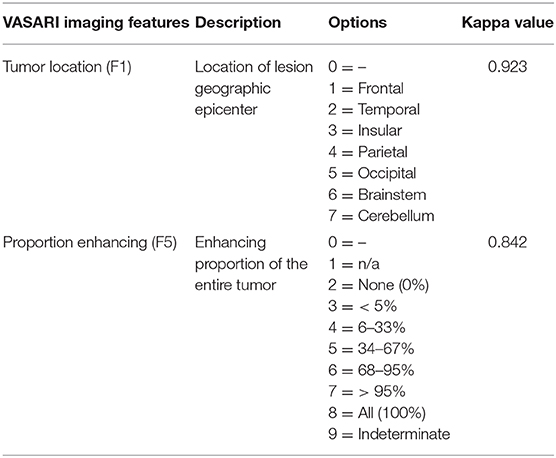
Table 3. Inter-observer analysis for VASARI imaging features used in the study.
Clinical Variables, EMT Process, and Tumor Purity
Apart from clinical variables, the expression profiling data in TCGA was used to calculate the corresponding signal pathway score by single-sample Gene Set Enrichment Analysis (ssGSEA) to evaluate EMT process and tumor purity of samples (Figure 6). For clinicopathological characteristics, age, subtype, EMT score and tumor purity were of significant association in and outside the region (Figure 6A). VOI, KPS, MGMT and gender showed no significant difference (Supplementary Table 2). VLSM/VOI was illustrated as histogram in descending order. Age distribution showed that patients with GBM outside the VLSM-determined area were older than those in the VLSM-determined area. The proportion of proneural subtype was higher in the VLSM-determined area, while samples in mesenchymal subtype had preference locating outside the VLSM-determined area. Compared with samples in the VLSM-determined area, samples outside the VLSM-determined area had a higher EMT score, which indicated a tendency to mesenchymal phenotype. As for tumor purity, we calculated immune signature and stromal signature together. The top 10 genes with significant differential expression were presented in the image (Figure 6B, Supplementary Table 3). In EMT gene set, KLHL12, HDAC2, STRAP, and FUZ were over-expressed in VLSM-determined area, and other genes such as CTNNB1, HIF1A, and IL6 were over-expressed outside the VLSM-determined area. These results demonstrated that there were significant differences of EMT process and tumor purity between GBM in and outside the VLSM-determined area, indicating the potential PMT progression. We also analyzed the immune cells infiltration between GBM in and outside the VLSM-determined area to further discuss the changes of microenvironment in PMT progression. The infiltrations of T cells CD8 and T cells follicular helper were significantly down-regulated in GBM outside the VLSM-determined area compared with those in GBM in the VLSM-determined area (T cells CD8, P = 1.00E-02; T cells follicular helper, P = 1.00E-02; Student's t-test, Supplementary Table 4).
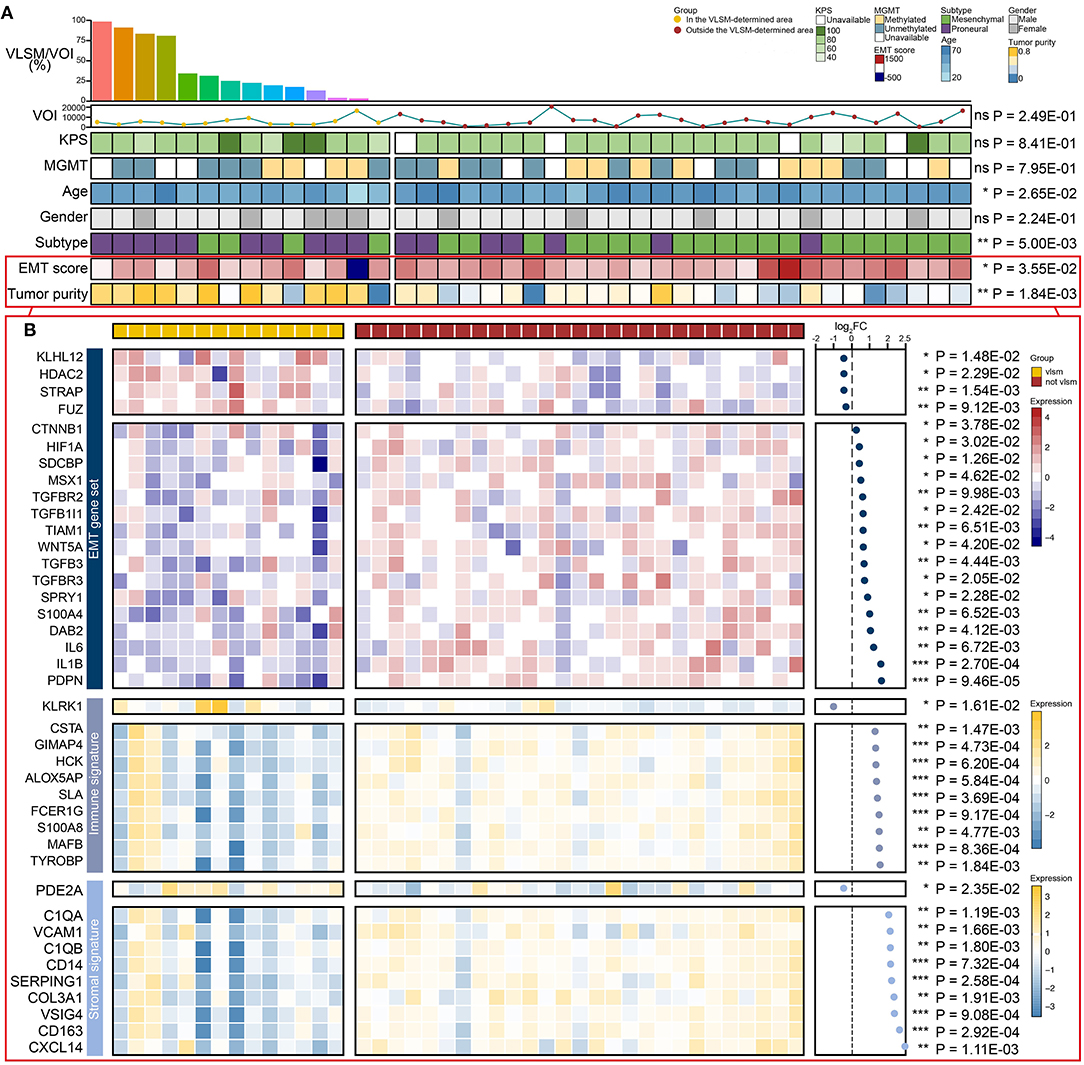
Figure 6. The comparison of EMT score, tumor purity, clinical variables and differential expressed genes between GBM in and outside the VLSM-determined area. (A) The EMT score, tumor purity and the clinical variables including VLSM/VOI, VOI, KPS, MGMT, age, gender, subtype were used. The histogram presented VLSM/VOI in descending order. The line chart presented the VOIs. The heatmaps presented differences between GBM in and outside the VLSM-determined area. (B) The heatmaps showed the differential expressed genes of EMT gene set, immune signature and stromal signature of GBM in and outside the VLSM-determined area. The scatter plot presented the fold change of differential expressed genes in logarithmic form. P-value was determined by Student's t-test. Significant results were presented as ns non-significant, *P < 0.05, **P < 0.01, or ***P < 0.001.
Discussion
GBM is categorized into four subtypes (proneural subtype, mesenchymal subtype, classical subtype and neural subtype) based on molecular and phenotypic differences. For instance, mesenchymal subtype has higher rates of proliferation in vitro and is markedly resistant to radiotherapy compared with proneural subtype (27). PMT progression widely exists in the process of GBM progression due to the invasive mechanism and activation potential of mesenchymal feature of proneural subtype (19). In this study, we found potential relevance between proneural subtype and mesenchymal subtype on GBM topography based on overlay and VLSM analysis, and survival analysis revealed that patients with GBM in the VLSM-determined area survived longer than patients with GBM outside the VLSM-determined area. Furthermore, the results of EMT score and tumor purity suggested a potential PMT progression between GBM in and outside the VLSM-determined area further. Samples with GBM in and outside the VLSM-determined area harbored the signature of proneural subtype and mesenchymal subtype in PMT progression, respectively. In previous study, the PMT progression is determined by specific genomic methods generally, while this study discussed the subject in radiography approach and presented ideas related to different subtypes (28, 29).
The non-invasive method of MRI materials provides effective mean to explore different molecular genetic signatures (4). Tumor location can be associated with the genetic profile of tumor precursor cells (14). In our study, 223 samples with definite subtypes were selected to conduct tumor overlay maps. The original GBM overlay result indicated the overlays with higher proportion were around periventricular or subventricular zone, which suggested the result was associated with the origin of brain tumors (30). Proneural subtype and mesenchymal subtype are the most distinct subtypes, which suggests a biological significance in tumor biology and overall survival (31–33). According to overlay of the VOIs in proneural and mesenchymal subtypes gathered with diverse predilection site, we explored the anatomical characteristics of the two subtypes. The predilection area of proneural glioma was involved with left middle and left inferior temporal gyrus. The brain temporal lobe plays a role in recognition of specific objects and processing with visual stimuli (34), and is one of the most predilection sites for GBM in adults (35). Proneural subtype has classical events in the robust classification scheme including TP53 mutation, and can be a driver of initial oncogenic events and influenced by a variety of genomic factors in tumor initialization and progression (14, 18). The predilection area of mesenchymal glioma located forward and close to brain frontal lobe. Gliomas located in the frontal lobe have symptoms including dementia, personality change, gait disturbance, expressive aphasia and others (36). The mesenchymal gliomas expressed properties such as reduced cell polarity, increased pseudopodia formation, cell motility and invasion, upregulation of EMT markers (19). The overlays of the VOIs in proneural and mesenchymal subtypes gathered with diverse predilection site. Therefore, we employed VLSM analysis to explore the anatomical characteristics of the two subtypes. The overlays of the VOIs in proneural subtype and mesenchymal subtype gathered with diverse predilection site. Therefore, we employed VLSM analysis to explore the anatomical characteristics of the two subtypes.
VLSM is a different method from overlay, which can provide statistical significance for the observed difference based on voxel level and bring forward to evaluate the relationship between lesions and clinical symptoms (37). In present study, proneural subtype was confirmed to be related to left inferior temporal medulla. We morphologically defined a VLSM-determined area as inclination tumorigenesis of proneural subtype. However, no significant voxel was detected in mesenchymal subtype. The overlay images provided evidence that mesenchymal subtype GBM had a relative diffused distribution. This characteristic might be explained by the absence of diffused growing patterns of mesenchymal subtype (38).
In the analysis of MRI radiography, tumor contrast enhancement is applied to predict GBM prognosis and malignancy, which can be easily distinguished, resulting to the narrowing of subjective error of visual inspection and facilitating feasibility or availability (39, 40). In this study, we employed VASARI feature set to formulate proportion of enhancing area for ensuring the normalized visual feature. GBM involved temporal lobe with over 95% proportion of enhancing area, as well as other potential factors involved in patient's prognosis such as tumor resection, radiation treatment and pharmaceutical adjuvant, were used for sample filtration to further analysis of VLSM-determined area. GBM samples in the VLSM-determined area had longer OS time compared with those outside the VLSM-determined area. For proneural subtype, samples in the VLSM-determined area had longer survival time than those outside the VLSM-determined area. However, there was no significant difference for mesenchymal subtype, which could be explained by the limited amount of data.
Different metastasis and immune related genes manifest differential expression patterns among GBM subtypes (41, 42). Mesenchymal subtype is characterized by an increased immune cell presence compared to proneural subtype (43). The existence of PMT progression can influence survival time, the sensitivity to radiotherapy and chemotherapy, potential target in gene therapy and tumor immunity (44). Quiescent GBM cells gain malignant potency by engaging a mesenchymal shift that resembles EMT process and increases invasive behaviors (45). Tumor purity refers to the proportion of cancer cells in a tumor sample and is negatively correlated with EMT process and immune activity (46). Cases with low tumor purity are more likely to be related to malignant entities and have reduced survival time, which resembles PMT progression, indicating a worsening process and enabling the tumor incline to obtain characters of mesenchymal subtype (24). Besides, PMT progression indicates a worsening process and enables the tumor incline to obtain characters of mesenchymal subtype (24, 47). Compared with proneural subtypes, mesenchymal subtype had the lower purity score, indicating a lower tumor purity with the infiltration of non-neoplastic cells into this subtype (19, 48). In order to assess the PMT progression of GBM, we compared EMT process and tumor purity by expression profiling data of samples in and outside the VLSM-determined area via ssGSEA. Samples outside the VLSM-determined area had higher EMT scores than those in the VLSM-determined area, representing that the EMT process were upregulated in GBM outside the VLSM-determined area. Low tumor purity, indicating poor prognosis and an intense immune phenotype (49), was detected in samples outside the VLSM-determined area. The diverse pattern of the presence of stromal and immune cells across tumor types more broadly illustrates the impact of the tumor microenvironment on tumorigenesis and homeostasis (46). In our study, the samples outside the VLSM-determined area had lower tumor purity, higher stromal and immune signature gene expression than samples in the VLSM-determined area, indicating a higher infiltration of stromal and immune cells in glioma tissues (50). Immune signature genes, such as S100A8, had been shown to be pro-tumorigenic by inducing infiltration of myeloid derived suppressor cells (MDSCs) (51) or suppressing T cell function at the tumor site (52). High expression of stromal signature genes, such as COL3A1, is correlated with poor prognosis in glioblastoma (53). These results demonstrated that the different microenvironment could regulate the malignant progression between GBM in and outside the VLSM-determined. In addition, the microenvironment plays a key role in PMT progression. GBM subtypes shift from one to another one upon changes in the microenvironment. The average percentage of the different ratio in 22 types immune cells between GBM in and outside the VLSM-determined area were calculated and displayed. According to the result, GBM outside the VLSM-determined area had lower infiltrations of T cells CD8 and T cells follicular helper compared with GBM in the VLSM-determined area. The immune response of patients with glioma are characterized by defects in poor tumor antigen-specific CD8+ T cell responses, and elevated programmed death 1 (PD-1) in CD8+ T cells contributing to the poor prognosis of these patients (54, 55). Low tumor-infiltrating CD8+ T cells were associate with poor progression-free survival (56). T follicular helper cell could activate B cells to facilitate the anti-tumor response (57). These results demonstrated that the different immune cells infiltration between GBM in and outside the VLSM-determined area could regulate the malignant progression of glioma.
In present study, the difference of gene expression patterns between GBM in and outside the VLSM-determined area provided reference to molecular targeting treatment according to different topography (58). Among 141 genes of EMT gene set, 16 genes including CTNNB1, HIF1A, and IL6 were upregulated. CTNNB1, the downstream effector of the canonical WNT signaling pathway, is a key feature of EMT process, which has been identified as a therapeutic target for GBM (59). Multiple HIF1A-responsive EMT regulators in cancers is sufficient to induce all stages of cancer spread, including invasion, intravasation, and distant extravasation (60). Cytokines such as IL6 are capable of inducing EMT process by downregulation of E-cadherin and upregulation of Vimentin (61–63). The top 10 genes of differential expressed genes in stromal signature and immune signature were also of vital significance in PMT progression of GBM. Single cell analysis of immune cells in GBM showed that S100A8/9 (macrophages markers) was highly expressed in immune cells in the tumor core, indicating that the infiltration of immune cells within the mesenchymal subtype (19). CXCL14 enhances the sphere-forming ability of GBM cells, overexpresses in mesenchymal tumors and is responsible for tumor onset, growth and recurrence (64).
We realized the limitations of our techniques. Firstly, the VLSM method regarded each voxel as being independent and separated from other adjacent voxels, which may influence the calculation of involved regions. In addition, although the general MR imaging sequences ensure the reliability or reproducibility of the study, senior scans (such as DWI, DTI, MRS) are beneficial for further study of intratumoural transcriptional heterogeneity with novel algorithm.
Our study demonstrated a valuable VLSM-determined area related to the predilection site, prognosis and PMT progression by radiography approach. GBM involved in VLSM-determined area exhibited the characters of proneural subtype. The results also revealed the differences of EMT process and tumor purity among GBM in and outside the VLSM-determined area.
Materials and Methods
Data Collection
Original data used in this research were provided by TCGA, an open resource containing comprehensive genomics information on various cancers. TCGA data collection founded by the cooperation between National Cancer Institute (NCI) and several institutions, publicly available in TCIA database, was selected to explore the connection between GBM phenotypes and radiographs, for data were matched to store in TCGA and TCIA (65). All information was available in an open manner, and no institutional review board or Act approval was essential. Imaging data comprised various general sequences such as T1-weighted, T2-weighted images, and other advanced MRI scans. Among different original pre-operative multimodal MRI scans, post-contrast T1-weighted and other available sequences such as T2-weighted images were employed in present study. Clinical data and molecular genetic data included gender, OS time, age, KPS, and other information (66).
MRI data of total 262 GBM samples including multiple sequences were acquired initially. The exclusion criteria referred to sample lacks post-contrast T1-weighted, subtype classification, and clinical features. After summarizing the entire data together, we identified 223 samples who had relevant variables available finally. A flowchart of the number of samples included or excluded for each analysis was shown in Supplementary Figure 1.
Imaging Processing
Prior to imaging processing, the original imaging dataset was evaluated by VASARI feature set, which served as a semi-quantitative imaging analysis for describing visual features on MRI (67). In this study, two variables describing topography of brain lobes of lesion and proportion of enhancing area were used, which were visually estimated by observers and divided into separate categories. For each sample, the images were evaluated by a neurosurgeon and a neuroradiologist independently and they knew nothing about other data. The third experienced neurosurgeon made the final decision judged by multiple MRI sequences when there was a discrepancy. All the observers learned the visual examples of scoring consensus in advance to ensure agreement. Kappa consistency test was used to check inter-observer variation.
After radiography materials were downloaded, format transformation was carried out to acquire NIfTI format profiles. The neurosurgeon and neuroradiologist manually draw the lesion map on post-contrast T1-weighted image in each axial slice by the usage of MRIcron (http://www.sph.sc.edu/comd/rorden/mricron) to delineate the boundary of the tumor. If there was an evident discrepancy (the ratio of VOI between two observers > 0.05), the VOIs of the samples would be rechecked by another neurosurgeon to make the final decision. Then VOIs of all samples were collected. The sequences were normalized into the stereotactic Montreal Neurological Institute (MNI) standard space. With Statistical Parametric Mapping 8 (SPM 8, http://www.fil.ion.ucl.ac.uk/spm/software/spm8) implemented in MATrix LABoratory (MATLAB, Mathworks, Natick, MA), images and generated VOIs were registered to brain atlas and normalized at the MNI space using the standard normalization algorithm followed by examination of visual inspection (68). To explore the distribution of GBM and correlations among different subtypes, all normalized VOIs were summed up together to get the overlay maps on ch2bet template.
VLSM Method
VLSM method was applied to relate lesion map to manifestation of proneural and mesenchymal subtype in MRIcron software by Non-parametric Mapping Statistics (NPM, http://www.mccauslandcenter.sc.edu/mricro/mricron/) (69). Subsequently, a spreadsheet was generated to link the lesion to subtype of each sample. Non-parametric Liebermeister test was used to perform statistical comparisons on voxel-wise base, which were performed at each voxel using specific subtypes as dependent variable (binary measure). Z-value corresponding to significant P level indicated the minimum threshold of significant topography, and a higher statistical output meant stronger association between predilection site of GBM and specific subtypes. Analysis was only computed on voxels damaged > 5%. NPM false discovery rate (FDR) correction for multiple comparisons was applied. VLSM maps were displayed on ch2bet template with a statistical significance (P < 0.05).
Estimation of EMT Process and Tumor Purity
Expression profiling data from TCGA was used to evaluate EMT enrichment and tumor purity (70). SsGSEA was applied to get the enrichment scores of EMT gene set and tumor purity associated gene sets for each sample (71). A single sample's genes expression profiling data from the space of single genes were projected onto the space of every gene set by ssGSEA, and each enrichment score was on behalf of the degree to which the genes in every gene set were coordinately up-regulated or down-regulated within a sample (72).
Statistics
Statistical analysis (VLSM analysis excluded) was carried out by IBM SPSS statistics and GraphPad Prism. All results were shown as mean ± standard deviation or number of observations and percentages. Kappa consistency test was applied to evaluate consistency in the diagnosis of VASARI scores between different observers (73), and the kappa values > 0.8, in the range of 0.6–0.8, and <0.6 indicated excellent, good and poor agreement, respectively. χ2-test was used to detect the distribution of several attributes on categorical variables, while Student's t-test checked the differences between two groups on continuous variables. R packages, such as pheatmap, limma and affy, were used to produce figures and calculate differential expressed genes. Regarding to survival analysis, Kaplan-Meier curve and log-rank test were applied to describe OS time. P < 0.05 was considered statistically significant.
Data Availability Statement
Publicly available datasets were analyzed in this study. This data can be found at: http://cancerimagingarchive.net, TCIA.
Ethics Statement
Ethical review and approval was not required for the study on human participants in accordance with the local legislation and institutional requirements. Written informed consent for participation was not required for this study in accordance with the national legislation and the institutional requirements.
Author Contributions
CJ and JC designed the experiments. TQ and XM performed the experiments. TQ, XM, and JC analyzed the data and wrote the manuscript. ZW, XW, NS, JM, and LR contributed to materials and analysis tools. All authors revised the manuscript.
Funding
This study was supported by the National Natural Science Foundation of China (Nos: 81874204, 81772666, 81972817, 82073298, and 82003022); Excellent Young Talents Project of Central Government Supporting Local University Reform and Development Fund (No: 0202-300011190006); Karolinska Institutet Research Foundation Grants 2020-2021 (No. FS-2020:0007); the China Postdoctoral Science Foundation (Nos. 2019M660074 and 2020T130157); the Heilongjiang Postdoctoral Science Foundation (LBH-Z19029); and the Research Project of the Health and Family Planning Commission of Heilongjiang Province (2019-102).
Conflict of Interest
The authors declare that the research was conducted in the absence of any commercial or financial relationships that could be construed as a potential conflict of interest.
Supplementary Material
The Supplementary Material for this article can be found online at: https://www.frontiersin.org/articles/10.3389/fonc.2021.595259/full#supplementary-material
References
1. Li WB, Tang K, Chen Q, Li S, Qiu XG, Li SW, et al. MRI manifestions correlate with survival of glioblastoma multiforme patients. Cancer Biol Med. (2012) 9:120–3. doi: 10.3969/j.issn.2095-3941.2012.02.007
2. Wu P, Cai J, Chen Q, Han B, Meng X, Li Y, et al. Lnc-TALC promotes O(6)-methylguanine-DNA methyltransferase expression via regulating the c-Met pathway by competitively binding with miR-20b-3p. Nat Commun. (2019) 10:2045. doi: 10.1038/s41467-019-10025-2
3. Meng X, Zhao Y, Han B, Zha C, Zhang Y, Li Z, et al. Dual functionalized brain-targeting nanoinhibitors restrain temozolomide-resistant glioma via attenuating EGFR and MET signaling pathways. Nat Commun. (2020) 11:594. doi: 10.1038/s41467-019-14036-x
4. Gutman DA, Cooper LA, Hwang SN, Holder CA, Gao J, Aurora TD, et al. MR imaging predictors of molecular profile and survival: multi-institutional study of the TCGA glioblastoma data set. Radiology. (2013) 267:560–9. doi: 10.1148/radiol.13120118
5. Itakura H, Achrol AS, Mitchell LA, Loya JJ, Liu T, Westbroek EM, et al. Magnetic resonance image features identify glioblastoma phenotypic subtypes with distinct molecular pathway activities. Sci Transl Med. (2015) 7:303ra138. doi: 10.1126/scitranslmed.aaa7582
6. Bakas S, Akbari H, Sotiras A, Bilello M, Rozycki M, Kirby JS, et al. Advancing the cancer genome atlas glioma MRI collections with expert segmentation labels and radiomic features. Sci Data. (2017) 4:170117. doi: 10.1038/sdata.2017.117
7. Lee M, Han K, Ahn SS, Bae S, Choi YS, Hong JB, et al. The added prognostic value of radiological phenotype combined with clinical features and molecular subtype in anaplastic gliomas. J Neuro-Oncol. (2019) 142:129–38. doi: 10.1007/s11060-018-03072-0
8. Puchalski RB, Shah N, Miller J, Dalley R, Nomura SR, Yoon JG, et al. An anatomic transcriptional atlas of human glioblastoma. Science. (2018) 360:660–3. doi: 10.1126/science.aaf2666
9. Kimberg DY, Coslett HB, Schwartz MF. Power in voxel-based lesion-symptom mapping. J Cognit Neurosci. (2007) 19:1067–80. doi: 10.1162/jocn.2007.19.7.1067
10. Sagnier S, Sibon I. The new insights into human brain imaging after stroke. J Neurosci Res. (2019) doi: 10.1002/jnr.24525
11. Darlix A, Deverdun J, Menjot de Champfleur N, Castan F, Zouaoui S, Rigau V, et al. IDH mutation and 1p19q codeletion distinguish two radiological patterns of diffuse low-grade gliomas. J Neuro-Oncol. (2017) 133:37–45. doi: 10.1007/s11060-017-2421-0
12. Pisoni A, Mattavelli G, Casarotti A, Comi A, Riva M, Bello L, et al. Object-action dissociation: a voxel-based lesion-symptom mapping study on 102 patients after glioma removal. NeuroImage Clin. (2018) 18:986–95. doi: 10.1016/j.nicl.2018.03.022
13. Rathore S, Akbari H, Rozycki M, Abdullah KG, Nasrallah MP, Binder ZA, et al. Radiomic MRI signature reveals three distinct subtypes of glioblastoma with different clinical and molecular characteristics, offering prognostic value beyond IDH1. Sci Rep. (2018) 8:5087. doi: 10.1038/s41598-018-22739-2
14. Verhaak RG, Hoadley KA, Purdom E, Wang V, Qi Y, Wilkerson MD, et al. Integrated genomic analysis identifies clinically relevant subtypes of glioblastoma characterized by abnormalities in PDGFRA, IDH1, EGFR, and NF1. Cancer cell. (2010) 17:98–110. doi: 10.1016/j.ccr.2009.12.020
15. Jakovlevs A, Vanags A, Gardovskis J, Strumfa I. Molecular classification of diffuse gliomas. Polish J Pathol. (2019) 70:246–58. doi: 10.5114/pjp.2019.93126
16. Pan YB, Wang S, Yang B, Jiang Z, Lenahan C, Wang J, et al. Transcriptome analyses reveal molecular mechanisms underlying phenotypic differences among transcriptional subtypes of glioblastoma. J Cell Mol Med. (2020) 24:3901–16. doi: 10.1111/jcmm.14976
17. Sharma A, Bendre A, Mondal A, Muzumdar D, Goel N, Shiras A. Angiogenic gene signature derived from subtype specific cell models segregate proneural and mesenchymal glioblastoma. Front Oncology. (2017) 7:146. doi: 10.3389/fonc.2017.00146
18. Ozawa T, Riester M, Cheng YK, Huse JT, Squatrito M, Helmy K, et al. Most human non-GCIMP glioblastoma subtypes evolve from a common proneural-like precursor glioma. Cancer Cell. (2014) 26:288–300. doi: 10.1016/j.ccr.2014.06.005
19. Behnan J, Finocchiaro G, Hanna G. The landscape of the mesenchymal signature in brain tumours. Brain. (2019) 142:847–66. doi: 10.1093/brain/awz044
20. Cai J, Zhang J, Wu P, Yang W, Ye Q, Chen Q, et al. Blocking LINC00152 suppresses glioblastoma malignancy by impairing mesenchymal phenotype through the miR-612/AKT2/NF-kappaB pathway. J Neuro-Oncol. (2018) 140:225–36. doi: 10.1007/s11060-018-2951-0
21. Waker CA, Lober RM. Brain tumors of glial origin. Adv Experi Med Biol. (2019) 1190:281–97. doi: 10.1007/978-981-32-9636-7_18
22. Murata H, Yoshimoto K, Hatae R, Akagi Y, Mizoguchi M, Hata N, et al. Detection of proneural/mesenchymal marker expression in glioblastoma: temporospatial dynamics and association with chromatin-modifying gene expression. J Neuro-Oncol. (2015) 125:33–41. doi: 10.1007/s11060-015-1886-y
23. Halliday J, Helmy K, Pattwell SS, Pitter KL, LaPlant Q, Ozawa T, et al. In vivo radiation response of proneural glioma characterized by protective p53 transcriptional program and proneural-mesenchymal shift. Proc Natl Acad Sci USA. (2014) 111:5248–53. doi: 10.1073/pnas.1321014111
24. Fedele M, Cerchia L, Pegoraro S, Sgarra R, Manfioletti G. Proneural-mesenchymal transition: phenotypic plasticity to acquire multitherapy resistance in glioblastoma. Int J Mol Sci. (2019) 20:2746. doi: 10.3390/ijms20112746
25. Yang J, Weinberg RA. Epithelial-mesenchymal transition: at the crossroads of development and tumor metastasis. Dev Cell. (2008) 14:818–29. doi: 10.1016/j.devcel.2008.05.009
26. Nicolasjilwan M, Hu Y, Yan C, Meerzaman D, Holder CA, Gutman D, et al. Addition of MR imaging features and genetic biomarkers strengthens glioblastoma survival prediction in TCGA patients. J Neuroradiol. (2015) 42:212–21. doi: 10.1016/j.neurad.2014.02.006
27. Mao P, Joshi K, Li J, Kim SH, Li P, Santana-Santos L, et al. Mesenchymal glioma stem cells are maintained by activated glycolytic metabolism involving aldehyde dehydrogenase 1A3. Proc Natl Acad Sci USA. (2013) 110:8644–9. doi: 10.1073/pnas.1221478110
28. Bhat KPL, Balasubramaniyan V, Vaillant B, Ezhilarasan R, Hummelink K, Hollingsworth F, et al. Mesenchymal differentiation mediated by NF-kappaB promotes radiation resistance in glioblastoma. Cancer Cell. (2013) 24:331–46. doi: 10.1016/j.ccr.2013.08.001
29. Tan MSY, Sandanaraj E, Chong YK, Lim SW, Koh LWH, Ng WH, et al. A STAT3-based gene signature stratifies glioma patients for targeted therapy. Nat Commun. (2019) 10:3601. doi: 10.1038/s41467-019-11614-x
30. Sanai N, Alvarez-Buylla A, Berger MS. Neural stem cells and the origin of gliomas. N Engl J Med. (2005) 353:811–22. doi: 10.1056/NEJMra043666
31. Huse JT, Phillips HS, Brennan CW. Molecular subclassification of diffuse gliomas: seeing order in the chaos. Glia. (2011) 59:1190–9. doi: 10.1002/glia.21165
32. Nakano I. Stem cell signature in glioblastoma: therapeutic development for a moving target. J Neurosurg. (2015) 122:324–30. doi: 10.3171/2014.9.Jns132253
33. Lin N, Yan W, Gao K, Wang Y, Zhang J, You Y. Prevalence and clinicopathologic characteristics of the molecular subtypes in malignant glioma: a multi-institutional analysis of 941 cases. PLoS ONE. (2014) 9:e94871. doi: 10.1371/journal.pone.0094871
34. Chillemi G, Calamuneri A, Morgante F, Terranova C, Rizzo V, Girlanda P, et al. Spatial and temporal high processing of visual and auditory stimuli in cervical dystonia. Front Neurol. (2017) 8:66. doi: 10.3389/fneur.2017.00066
35. Nizamutdinov D, Stock E, Dandashi J, Vasquez E, Mao Y, Dayawansa S, et al. Prognostication of survival outcomes in patients diagnosed with glioblastoma. World Neurosurg. (2018) 109:e67–74. doi: 10.1016/j.wneu.2017.09.104
36. Chandana SR, Movva S, Arora M, Singh T. Primary brain tumors in adults. Am Fam Phys. (2008) 77:1423–30. doi: 10.1016/S0140-6736(03)12328-8
37. Bates E, Wilson SM, Saygin AP, Dick F, Sereno MI, Knight RT, et al. Voxel-based lesion-symptom mapping. Nat Neurosci. (2003) 6:448–50. doi: 10.1038/nn1050
38. Steed TC, Treiber JM, Patel K, Ramakrishnan V, Merk A, Smith AR, et al. Differential localization of glioblastoma subtype: implications on glioblastoma pathogenesis. Oncotarget. (2016) 7:24899–907. doi: 10.18632/oncotarget.8551
39. Moulding HD, Friedman DP, Curtis M, Kenyon L, Flanders AE, Paek SH, et al. Revisiting anaplastic astrocytomas I: an expansive growth pattern is associated with a better prognosis. J Magnet Reson Imaging: JMRI. (2008) 28:1311–21. doi: 10.1002/jmri.21593
40. Chaichana KL, Kosztowski T, Niranjan A, Olivi A, Weingart JD, Laterra J, et al. Prognostic significance of contrast-enhancing anaplastic astrocytomas in adults. J Neurosurg. (2010) 113:286–92. doi: 10.3171/2010.2.Jns091010
41. Cai J, Zhang W, Yang P, Wang Y, Li M, Zhang C, et al. Identification of a 6-cytokine prognostic signature in patients with primary glioblastoma harboring M2 microglia/macrophage phenotype relevance. PLoS ONE. (2015) 10:e0126022. doi: 10.1371/journal.pone.0126022
42. Zha C, Meng X, Li L, Mi S, Qian D, Li Z, et al. Neutrophil extracellular traps mediate the crosstalk between glioma progression and the tumor microenvironment via the HMGB1/RAGE/IL-8 axis. Cancer Biol Med. (2020) 17:154–68. doi: 10.20892/j.issn.2095-3941.2019.0353
43. Kaffes I, Szulzewsky F, Chen Z, Herting CJ, Gabanic B, Velazquez Vega JE, et al. Human mesenchymal glioblastomas are characterized by an increased immune cell presence compared to proneural and classical tumors. Oncoimmunology. (2019) 8:e1655360. doi: 10.1080/2162402X.2019.1655360
44. Tejero R, Huang Y, Katsyv I, Kluge M, Lin JY, Tome-Garcia J, et al. Gene signatures of quiescent glioblastoma cells reveal mesenchymal shift and interactions with niche microenvironment. EBioMedicine. (2019) 42:252–69. doi: 10.1016/j.ebiom.2019.03.064
45. Phillips HS, Kharbanda S, Chen R, Forrest WF, Soriano RH, Wu TD, et al. Molecular subclasses of high-grade glioma predict prognosis, delineate a pattern of disease progression, and resemble stages in neurogenesis. Cancer Cell. (2006) 9:157–73. doi: 10.1016/j.ccr.2006.02.019
46. Yoshihara K, Shahmoradgoli M, Martínez E, Vegesna R, Kim H, Torres-Garcia W, et al. Inferring tumour purity and stromal and immune cell admixture from expression data. Nat Commun. (2013) 4:2612. doi: 10.1038/ncomms3612
47. Peng Y, Yu B, Qin H, Xue L, Liang Y, Quan ZJP. EMT-related gene expression is positively correlated with immunity and may be derived from stromal cells in osteosarcoma. PeerJ. (2020) 8:e8489. doi: 10.7717/peerj.8489
48. Wang Q, Hu B, Hu X, Kim H, Squatrito M, Scarpace L, et al. Tumor evolution of glioma-intrinsic gene expression subtypes associates with immunological changes in the microenvironment. Cancer Cell. (2018) 33:152. doi: 10.1016/j.ccell.2017.12.012
49. Zhang C, Cheng W, Ren X, Wang Z, Liu X, Li G, et al. Tumor purity as an underlying key factor in glioma. Clin Cancer Res. (2017) 23:6279–91. doi: 10.1158/1078-0432.Ccr-16-2598
50. Ye L, Zhang T, Kang Z, Guo G, Sun Y, Lin K, et al. Tumor-infiltrating immune cells act as a marker for prognosis in colorectal cancer. Front Immunol. (2019) 10:2368. doi: 10.3389/fimmu.2019.02368
51. Lim SY, Yuzhalin AE, Gordon-Weeks AN, Muschel RJ. Tumor-infiltrating monocytes/macrophages promote tumor invasion and migration by upregulating S100A8 and S100A9 expression in cancer cells. Oncogene. (2016) 35:5735–45. doi: 10.1038/onc.2016.107
52. Gielen PR, Schulte BM, Kers-Rebel ED, Verrijp K, Bossman SA, Ter Laan M, et al. Elevated levels of polymorphonuclear myeloid-derived suppressor cells in patients with glioblastoma highly express S100A8/9 and arginase and suppress T cell function. Neuro Oncol. (2016) 18:1253–64. doi: 10.1093/neuonc/now034
53. Henke E, Nandigama R, Ergun S. Extracellular matrix in the tumor microenvironment and its impact on cancer therapy. Front Mol Biosci. (2019) 6:160. doi: 10.3389/fmolb.2019.00160
54. Prasad S, Gaedicke S, Machein M, Mittler G, Braun F, Hettich M, et al. Effective eradication of glioblastoma stem cells by local application of an AC133/CD133-specific T-cell-engaging antibody and CD8 T cells. Cancer Res. (2015) 75:2166–76. doi: 10.1158/0008-5472.CAN-14-2415
55. Chen PY, Wu CY, Fang JH, Chen HC, Feng LY, Huang CY, et al. Functional change of effector tumor-infiltrating CCR5(+)CD38(+)HLA-DR(+)CD8(+) T cells in glioma microenvironment. Front Immunol. (2019) 10:2395. doi: 10.3389/fimmu.2019.02395
56. Han S, Zhang C, Li Q, Dong J, Liu Y, Huang Y, et al. Tumour-infiltrating CD4(+) and CD8(+) lymphocytes as predictors of clinical outcome in glioma. Br J Cancer. (2014) 110:2560–8. doi: 10.1038/bjc.2014.162
57. Lu J, Li H, Chen Z, Fan L, Feng S, Cai X, et al. Identification of 3 subpopulations of tumor-infiltrating immune cells for malignant transformation of low-grade glioma. Cancer Cell Int. (2019) 19:265. doi: 10.1186/s12935-019-0972-1
58. Peng X. Advances in biomarkers of cerebral small vessel disease. J Neurorestoratol. (2019) 7:171–83. doi: 10.26599/jnr.2019.9040021
59. Chen Q, Cai J, Wang Q, Wang Y, Liu M, Yang J, et al. Long noncoding RNA NEAT1, regulated by the EGFR pathway, contributes to glioblastoma progression through the WNT/β-catenin pathway by scaffolding EZH2. Clin Cancer Res. (2018) 24:684–95. doi: 10.1158/1078-0432.Ccr-17-0605
60. Majmundar AJ, Wong WJ, Simon MC. Hypoxia-inducible factors and the response to hypoxic stress. Mol Cell. (2010) 40:294–309. doi: 10.1016/j.molcel.2010.09.022
61. Sullivan NJ, Sasser AK, Axel AE, Vesuna F, Raman V, Ramirez N, et al. Interleukin-6 induces an epithelial-mesenchymal transition phenotype in human breast cancer cells. Oncogene. (2009) 28:2940–7. doi: 10.1038/onc.2009.180
62. Jung HY, Fattet L, Yang J. Molecular pathways: linking tumor microenvironment to epithelial-mesenchymal transition in metastasis. Clin Cancer Res. (2015) 21:962–8. doi: 10.1158/1078-0432.CCR-13-3173
63. Lin L, Wang G, Ming J, Meng X, Han B, Sun B, et al. Analysis of expression and prognostic significance of vimentin and the response to temozolomide in glioma patients. Tumour Biol. (2016) 37:15333–9. doi: 10.1007/s13277-016-5462-7
64. Fazi B, Proserpio C, Galardi S, Annesi F, Cola M, Mangiola A, et al. The expression of the chemokine CXCL14 correlates with several aggressive aspects of glioblastoma and promotes key properties of glioblastoma cells. Int J Mol Sci. (2019) 20:2496. doi: 10.3390/ijms20102496
65. Clark K, Vendt B, Smith K, Freymann J, Kirby J, Koppel P, et al. The Cancer Imaging Archive (TCIA): maintaining and operating a public information repository. J Digital Imag. (2013) 26:1045–57. doi: 10.1007/s10278-013-9622-7
66. Deng Z, Yu H, Wang N, Alafate W, Wang J, Wang T, et al. Impact of preoperative Karnofsky Performance Scale (KPS) and American Society of Anesthesiologists (ASA) scores on perioperative complications in patients with recurrent glioma undergoing repeated operation. J Neurorestoratol. (2019) 7:143–52. doi: 10.26599/jnr.2019.9040015
67. Rios Velazquez E, Meier R, Dunn WD, Jr., Alexander B, Wiest R, et al. Fully automatic GBM segmentation in the TCGA-GBM dataset: prognosis and correlation with VASARI features. Sci Rep. (2015) 5:16822. doi: 10.1038/srep16822
68. Ashburner J, Friston KJ. Nonlinear spatial normalization using basis functions. Human Brain Mapp. (1999) 7:254–66.
69. Winder K, Linker RA, Seifert F, Wang R, Lee DH, Engelhorn T, et al. Cerebral lesion correlates of sympathetic cardiovascular activation in multiple sclerosis. Human Brain Mapp. (2019) 40:5083–93. doi: 10.1002/hbm.24759
70. Timmerman LA, Grego-Bessa J, Raya A, Bertrán E, Pérez-Pomares JM, Díez J, et al. Notch promotes epithelial-mesenchymal transition during cardiac development and oncogenic transformation. Genes Dev. (2004) 18:99–115. doi: 10.1101/gad.276304
71. Cai J, Chen Q, Cui Y, Dong J, Chen M, Wu P, et al. Immune heterogeneity and clinicopathologic characterization of IGFBP2 in 2447 glioma samples. Oncoimmunology. (2018) 7:e1426516. doi: 10.1080/2162402x.2018.1426516
72. Subramanian A, Tamayo P, Mootha VK, Mukherjee S, Ebert BL, Gillette MA, et al. Gene set enrichment analysis: a knowledge-based approach for interpreting genome-wide expression profiles. Proc Natl Acad Sci USA. (2005) 102:15545–50. doi: 10.1073/pnas.0506580102
Keywords: voxel-based lesion-symptom mapping, proneural subtype, mesenchymal subtype, magnetic resonance imaging, glioblastoma
Citation: Qi T, Meng X, Wang Z, Wang X, Sun N, Ming J, Ren L, Jiang C and Cai J (2021) A Voxel-Based Radiographic Analysis Reveals the Biological Character of Proneural-Mesenchymal Transition in Glioblastoma. Front. Oncol. 11:595259. doi: 10.3389/fonc.2021.595259
Received: 15 August 2020; Accepted: 16 February 2021;
Published: 17 March 2021.
Edited by:
Xuejun Li, Central South University, ChinaReviewed by:
Liang Wang, Fourth Military Medical University, ChinaGuihua Wang, Huazhong University of Science and Technology, China
Copyright © 2021 Qi, Meng, Wang, Wang, Sun, Ming, Ren, Jiang and Cai. This is an open-access article distributed under the terms of the Creative Commons Attribution License (CC BY). The use, distribution or reproduction in other forums is permitted, provided the original author(s) and the copyright owner(s) are credited and that the original publication in this journal is cited, in accordance with accepted academic practice. No use, distribution or reproduction is permitted which does not comply with these terms.
*Correspondence: Chuanlu Jiang, amNsNjY4OEAxNjMuY29t; Jinquan Cai, amlucXVhbi5jYWlAa2kuc2U=; Y2FpamlucXVhbkBocmJtdS5lZHUuY24=
†These authors share first authorship