 Sze Ting Lee1,2,3,4,5*
 Niall Tebbutt3,4,6
 Hui Kong Gan2,3,6Zhanqi Liu2John Sachinidis1Kunthi Pathmaraj1
 Andrew Mark Scott1,2,3,5
- 1Department of Molecular Imaging and Therapy, Austin Health, Melbourne, VIC, Australia
- 2Tumor Targeting Laboratory, Olivia Newton-John Cancer Research Institute, Austin Health, Melbourne, VIC, Australia
- 3School of Cancer Medicine, La Trobe University, Melbourne, VIC, Australia
- 4Department of Surgery, The University of Melbourne, Austin Health, Melbourne, VIC, Australia
- 5Department of Medicine, The University of Melbourne, Austin Health, Melbourne, VIC, Australia
- 6Department of Medical Oncology, Olivia Newton-John Cancer Research Institute, Melbourne, VIC, Australia
Introduction: Tumor hypoxia and angiogenesis are implicated in tumor growth and metastases, and anti-angiogenic therapies have an important role in treating patients with metastatic colorectal cancer. However, the prevalence of hypoxia has not been fully evaluated in colorectal liver metastases, and hypoxic response to anti-angiogenic therapy has not been clearly established. The aims of the study were to evaluate the changes seen on 18F-FMISO and 18F-FDG PET scans in patients treated with anti-angiogenic therapy, and to correlate these measures of hypoxia and metabolism with clinical outcomes, and blood biomarkers of angiogenesis.
Methods: Patients with metastatic colorectal carcinoma planned for treatment with bevacizumab and chemotherapy received routine staging investigations prior to any treatment, including a FDG PET scan. A FMISO PET scan was performed within 4 weeks of staging tests, with blood specimens collected at that time for serum VEGF and osteopontin measurement. Follow-up FDG and FMISO scans were performed after 1 cycle of treatment. Results were compared to response (RECIST), progression free survival (PFS), and overall survival (OS).
Results: A total of 15 patients were recruited into this prospective trial, of which 13 patients were evaluable for assessment of treatment follow-up. Baseline FDG uptake was higher than FMISO uptake, and there was a significant decrease in FDG uptake (SUVmax and TGV) but not FMISO uptake (SUVmax and TNR) after treatment. There was a positive correlation between FDG and FMISO SUVmax on both baseline and post-treatment PET scans. Blood biomarkers of serum VEGF and osteopontin were significantly correlated with the FDG and FMISO PET parameters.
Conclusions: This study shows that hypoxia in metastatic colorectal cancer, assessed by FMISO PET, shows minor changes following initial treatment with anti-angiogenic therapy, but is associated with therapeutic response. FDG PET uptake changes (SUVmax, TLG) are also associated with response to anti-angiogenic therapy. These findings demonstrate the interplay between tumor metabolism and hypoxic regulation following anti-angiogenic treatment of metastatic colorectal cancer.
Introduction
Colorectal cancer (CRC) is the fourth most common cancer type and the second leading cause of cancer-related death according to the WHO GLOBOCAN (1). More than 50% of patients develop metastatic disease, with the most common visceral metastasis found in the liver (2) with 20% of patients presenting initially presenting with synchronous liver metastasis (3). The last few decades has seen improvement in the early detection of colorectal cancer and therapeutic options for metastatic disease, especially with the use of antibody directed therapies according to the mutation status of the tumor (4), and anti-angiogenic treatments, since colorectal cancers is one of the best studied angiogenesis-dependent solid tumors (5).
Tumor angiogenesis has been shown to be a prerequisite for tumor growth beyond 1–2 mm3 (6, 7). Most tumors remain restricted in size until the tumor mass expands and overtakes the rate of internal apoptosis by developing blood vessels. This change is the result of a shift in the net balance of stimulators and inhibitors of angiogenesis within the tumor microenvironment (8). In many cancers, the degree of vascularization is inversely correlated with patient survival, and can predict the development of metastases, and tumor growth.
In metastatic colorectal carcinoma, tumor angiogenesis is a key process in tumor growth and metastasis, and is inextricably linked with tumor hypoxia (9). There are many factors involved in the “angiogenic switch”, which is thought to be triggered when hypoxia around a tumor leads to expression of hypoxia response genes (9). Vascular Endothelial Growth Factor (VEGF) messenger RNA (mRNA) levels are dramatically increased within a few hours of exposing different cell cultures to hypoxia, and return to background levels when normal oxygen supply is resumed (10).
Hypoxia-mediated aggressive tumor behavior and resistance to therapy is mediated by several molecular events which allow the adaptation of tumor cells to hypoxia. Positron Emission Tomography (PET) is a non-invasive imaging modality which can be employed to assess hypoxia. The most validated radiotracer for detection of hypoxia is 18F-Fluoromisonidazole (18F-FMISO) as it is the only radiotracer that has been validated by multiple studies comparing uptake thresholds to direct pO2 measurement with the Eppendorf pO2 hypoximeter (11–13). Tumor hypoxia has been implicated in the mechanisms of resistance to chemoradiotherapy in several malignancies, therefore may be the key to the resistance mechanisms of chemoradiotherapy in rectal adenocarcinoma (14).
The presence and impact of hypoxia on patients with metastatic colorectal cancer is not well understood, and imaging and biochemical markers correlating hypoxia and therapy response may have a significant role in the management of colorectal cancer patients, particularly as a predictor of tumor response to chemotherapy with angiogenic inhibitors.
VEGF has also been reported to be relatively higher in colorectal metastases compared to the primary lesions, but may also vary with the location of metastatic disease (15, 16). One study has shown a correlation between the VEGF mRNA of liver metastasis and primary colon tumor tissue (15), and VEGF binding stimulates endothelial cell proliferation, migration and survival (16). The key role angiogenesis plays in cancer growth and metastasis makes it a very attractive target for developing anticancer therapies. Bevacizumab was the first anti-VEGF therapy that was approved for patients with metastatic colorectal carcinoma, with combination treatments of bevacizumab and chemotherapy resulting in prolonged overall survival (17). However, there is a lack of data available on the impact of bevacizumab on hypoxia regulation in metastatic colorectal cancer, especially in the setting of imaging with hypoxic PET tracers. Osteopontin is a secreted multifunctional glycophosphoprotein which is also involved in angiogenesis, and a large meta-analysis of patients with colorectal carcinoma showed that high osteopontin expression was significantly associated with high tumor grades, metastatic disease, with prognostic implications (18).
18F-fluorodeoxyglucose (FDG) is widely used to stage and monitor treatment response in metastatic colorectal cancer. FDG uptake depends on the expression of GLUT1, which is over-expressed on tumor cells, but the FDG uptake is dependent on tumor vascularity and might be influenced by tumor hypoxia (19).
The primary aim of this study was to assess changes in hypoxia and glucose metabolism in metastatic colorectal cancer following anti-angiogenic therapy by 18F-FMISO and 18F-FDG PET scans, and to correlate these findings with patient outcomes. The secondary aim was to assess the correlation between blood biomarkers of angiogenesis (VEGF and osteopontin) and PET-derived parameters of hypoxia and metabolism.
Methods
Patients with metastatic colorectal carcinoma considered appropriate for treatment with chemotherapy and anti-VEGF inhibitor (bevacizumab) were recruited to this study. All patients had pre-treatment routine staging investigations as deemed appropriate by the treating clinician, in the form of diagnostic CT chest, abdomen, pelvis and 18F-FDG PET scan. A subsequent 18F-FMISO PET scan was performed within 4 weeks of the FDG PET scan prior to commencement of treatment with pre-treatment bloods collected. The patients were treated with bevacizumab as part of a combined therapy regimen, which was started within 4 weeks of the FMISO PET scan. The dose of bevacizumab was 7.5 mg/kg per dose, given every 3 weeks. Follow-up FDG and FMISO PET scans were performed within 2–3 weeks after the 1st cycle of treatment which included bevacizumab and standard chemotherapy. Routine post-treatment restaging CT scans were performed at regular intervals, and the patients were followed-up clinically for up to 5 years. All patients signed an informed consent form to participate in this institutional ethics approved trial.
The PET scans were performed on a Philips Gemini PET scanner (Philips Medical Systems, Cleveland, OH, USA) which included a low dose 30 mA/slice 2-slice CT for purposes of attenuation correction and anatomical localization. The PET emission scan duration was for 3 min per bed position, and the patients were scanned from skull base to mid-thigh with arms raised above their heads for the FDG PET scan. The FMISO scan was performed of the abdomen and pelvis in most patients, extending to include the lungs in patients with known metastatic lung disease. For the FDG PET scans, the patients were fasted for a minimum of 6 h prior to injection of approximately 5 MBq/kg of 18F-FDG after a 60 min uptake time. Patients did not fast for the FMISO PET scans, where they were injected with approximately 370MBq of 18F-FMISO intravenously and imaged after a 2 h uptake time.
Both FDG PET and FMISO PET scans were analyed using MedView® (MedImage Inc. Ann Arbor, MI, USA) software platform to assess the SUVmax of tumor and normal liver, with a ratio of tumor to normal liver SUVmax subsequently calculated. A visual uptake score of the tumor was also performed, rating tumor uptake from a scale of 1–5. A score of 1 had uptake less than normal liver; a score of 2 had uptake similar to normal liver; as score of 3 had mildly increased uptake compared to normal liver; a score of 4 had moderately increased uptake compared to normal liver; and a score of 5 had markedly increased uptake compared to normal liver. Semi-quantitative analysis of the PET scans was performed to assess for the maximum standardised uptake (SUVmax) in the region of interest on both FDG and FMISO PET scans. The total glycolytic volume (TGV) on the FDG PET scan and tumor to normal ratios (TNR) for the FDG and FMISO PET scan were also obtained. These values were subsequently correlated with the blood biomarkers of VEGF and osteopontin.
Blood Biomarkers
Correlative blood specimens were also obtained at the time of the FMISO PET scan, and archived in the Victorian Cancer Biobank for further analysis. The blood samples were analyzed for plasma VEGF and osteopontin, biomarkers of angiogenesis and hypoxia, using commercially available ELISA kits (R&D Systems; catalogue numbers QVE00B and DOST00 respectively). The experiments were performed according to the manufacturer’s instructions.
Statistical Analysis
Statistical analysis was performed using Prism 8 for MacOS® version 8.4.1 (GraphPad Software LLC) statistical software package, with paired t-test, ANOVA, and progression-free survival and overall survival analysis performed as suitable. For the comparison of means, Student t-test was employed where only two groups were being considered. For survival analysis, median values were used to assess the discriminative performance of FDG PET parameters of SUVmax, TGV or TNR, and FMISO SUVmax, but the well-established FMISO TNR value of 1.2 was used (11). A p-value of <0.05 was considered statistically significant.
Results
Patient Demographics
There were 15 patients (9M:6F) recruited into this study, mean age 56.8 years (range 23 to 77 years). Thirteen patients had evaluable baseline and follow-up PET scans performed. One patient died after one cycle and another patient withdrew from the study after the baseline scans, therefore follow-up scans could not be performed. The patient demographics are summarized in Table 1. Most metastatic lesions were in the liver, with the remainder of metastases within intra-abdominal nodes. The average size of the largest metastatic lesions per patient measured at 43mm on pre-treatment CT scan.
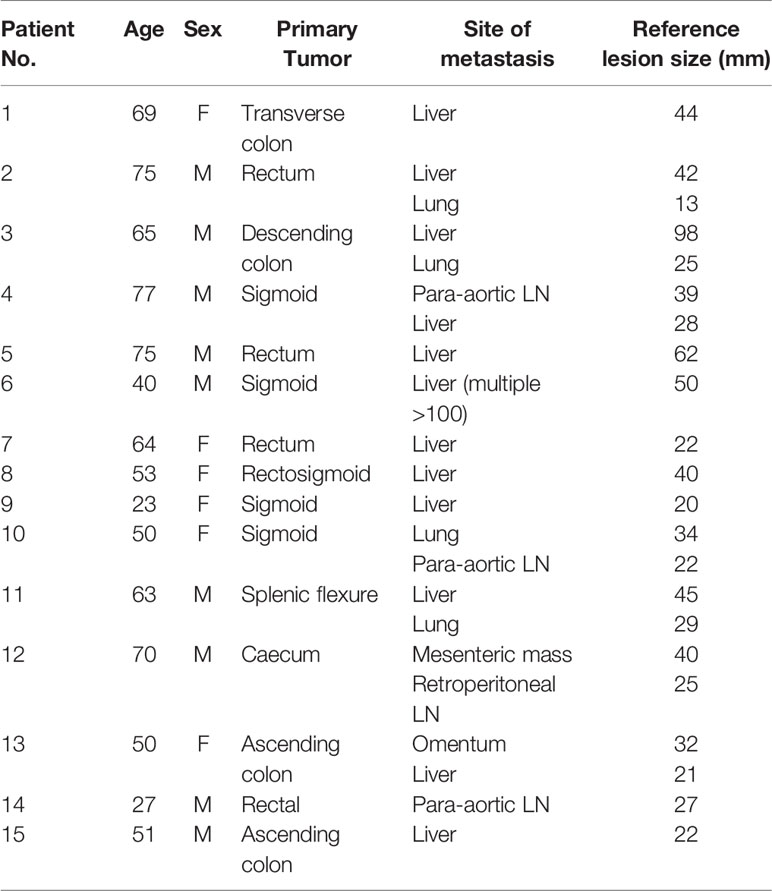
Table 1 Therapy response cohort patient demographics.
Positron Emission Tomography Scan Assessment
On visual assessment of baseline PET scans, all patients had a more intense FDG uptake in the reference lesion(s) compared to FMISO uptake, as summarized in Table 2. On the follow-up PET scans, the FDG PET did visually decrease by at least 1 point, but on FMISO scans, the visual scores either remained the same or only decreased by 1 point in all patients, apart from one patient who initially scored a 4 and this decreased to 1 on their follow-up. Figures 1A, B show FDG and FMISO changes in liver metastases and extrahepatic metastases respectively.
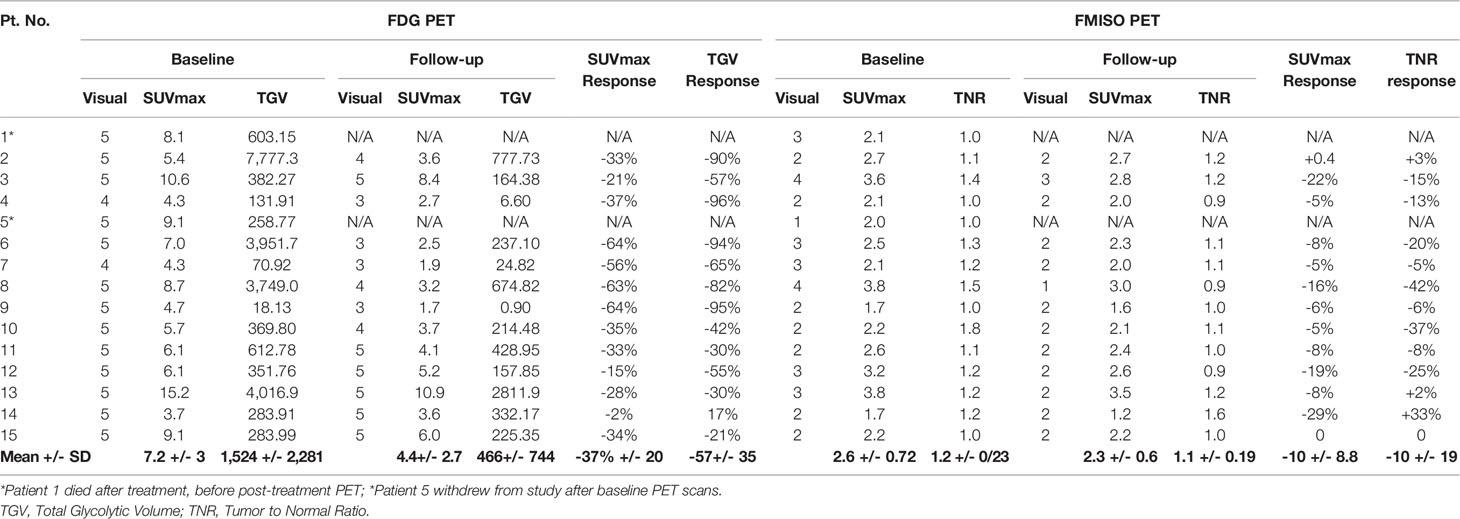
Table 2 PET scan findings and therapy response.
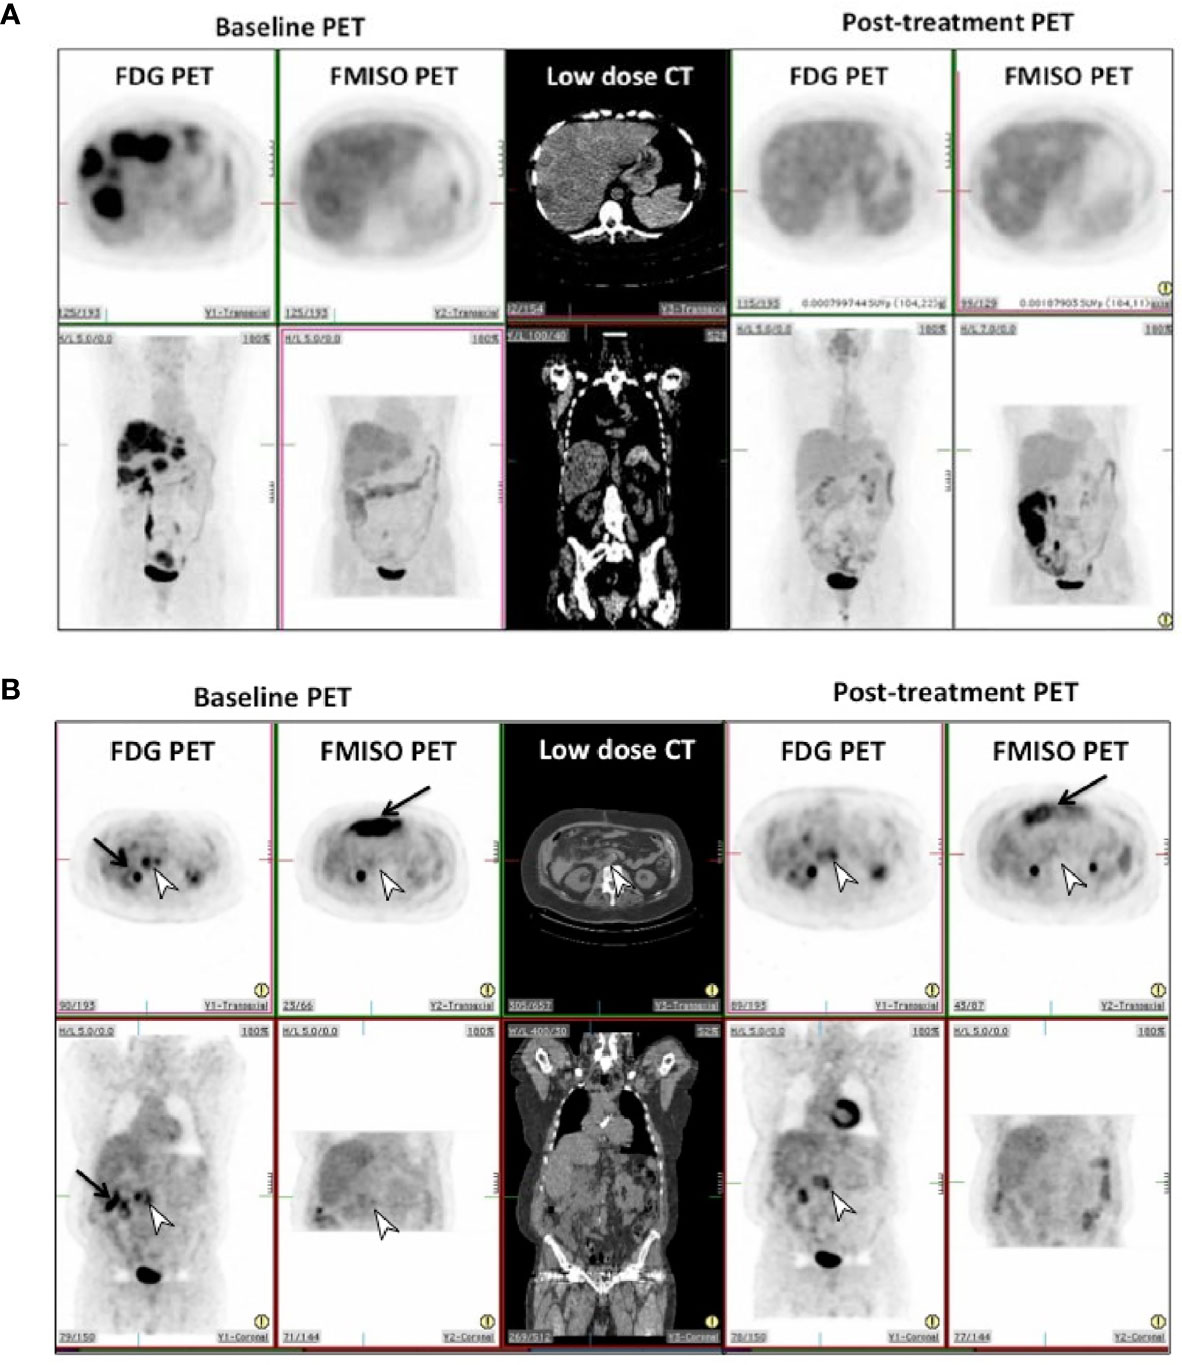
Figure 1 (A) Pre and post-treatment FDG and FMISO PET scans in patient 8 in transverse (top row) and coronal (bottom row) projections. This shows complete metabolic and hypoxic response in the liver metastases to treatment, with photopenic defects in the liver on post-treatment scans. (B) Pre and post-treatment FDG and FMISO PET scans in patient 12 in transverse (top row) and coronal (bottom row) projections. This shows incomplete metabolic and hypoxic response to treatment on FDG & FMISO PET in retroperitoneal lymph nodes seen on CT (white arrowhead). Intense bowel activity on FMISO scans is noted anteriorly (black arrows).
The SUVmax for baseline FDG uptake in tumor was higher compared to SUVmax for FMISO (Table 2). There was a statistically significant association of all baseline PET parameters (FDG SUVmax, FMISO SUVmax, FDG TGV and FMISO TNR) using ANOVA analysis, with a p-value of 0.02. Following anti-angiogenesis therapy, the average decrease of mean SUVmax on FDG PET was 4.58 (range 1.7-10.9) on the follow-up scans available (n=13). The mean difference in follow-up FDG SUVmax was a reduction of 2.79 +/- 1.11 (p-value 0.02). For the FMISO PET scans, the baseline FMISO SUVmax was 2.55 (range 1.7–3.8), with a decrease in the mean SUVmax to 2.36 (range 1.2–3.5) on the follow-up scans available. The mean decrease in follow-up FMISO SUVmax was 0.28 +/- 0.3, with a non-significant p-value of 0.36.
The tumor to normal ratio (TNR) on baseline FDG PET had a mean of 3.4 +/- 0.42 (range 1.6–6.2), with an average decrease in mean TNR to 2.4 +/- 0.5 on the follow-up scans (Table 2). The mean difference in FDG TNR was a reduction of 1.01 +/- 0.59 (p-value 0.11). The FMISO TNR had a mean of 1.2 +/- 0.08 on baseline (range 0.9–2.1), with a decrease in the mean TNR to 1.12 +/- 0.06 (range 0.9–1.6) on follow-up scans. The mean decrease in FMISO TNR was 0.09 +/- 0.1, with a non-significant p-value of 0.39.
The total glycolytic volume (TGV) on baseline FDG PET scans was 1693 +/- 669.9 (range 18.3–7,777 SUV*ml), whilst the mean TGV on follow-up FDG PET scans was 465.9 +/- 206.4 (range 0.9–2,812 SUV*ml). The mean decrease in TGV was -1227 +/- 590 SUV*ml, with a significant p-value of 0.012.
There was a positive correlation between FDG and FMISO uptake as measured by SUVmax on both baseline and follow-up PET scans. On the baseline PET scans, there was a statistically significant correlation between the SUVmax on the FDG and FMISO PET, with a Pearson’s r-value of 0.67 (p-value 0.007), but not the baseline tumor to normal ratio (TNR), which had a Pearson’s r-value of 0.49 (p-value 0.06), these are shown in Figures 2A, B. On the follow-up scans, there was a statistically significant correlation between the SUVmax of the FDG and FMISO PET scans with a Pearson’s r-value of 0.61 (p-value 0.027), as well as the FDG and FMISO TNR, with a Pearson’s r-value of 0.79 (p-value 0.0014) as shown in Figures 2C, D.
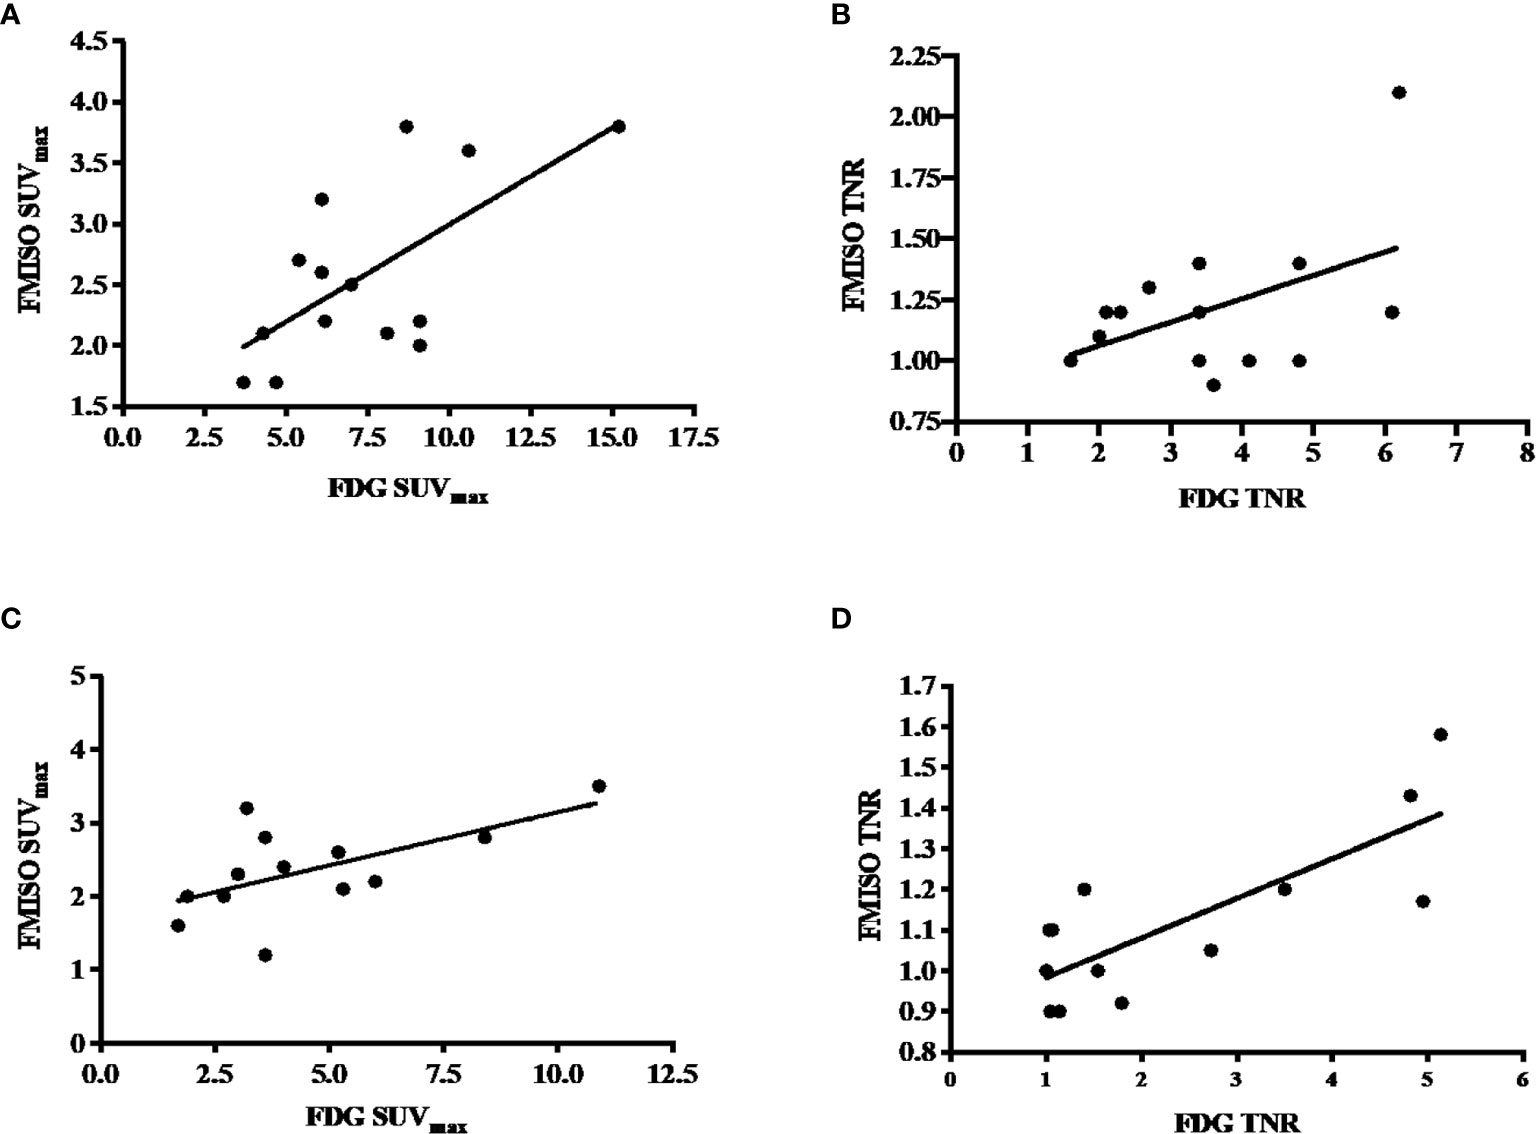
Figure 2 (A) Correlation between baseline FDG and FMISO SUVmax, with a Pearson’s correlation of 0.67 and p-value of 0.007. (B) Correlation between baseline FDG and FMISO TNR, with a Pearson’s correlation of 0.49 with a non-statistically significant p-value of 0.06. (C) Correlation between post-treatment FDG and FMISO SUVmax, with a Pearson’s correlation of 0.61 and p-value of 0.06. (D) Correlation between post-treatment FDG and FMISO TNR, with a Pearson’s correlation of 0.79 and p-value of 0.0014.
Treatment Response Assessment
There were 13 patients with evaluable treatment response, as two patients (Patient 1 and 5) did not have follow-up scans performed. These results are illustrated in the waterfall plot compared to anatomic assessment of response by with CT scan (RECIST), as seen in Figure 3.
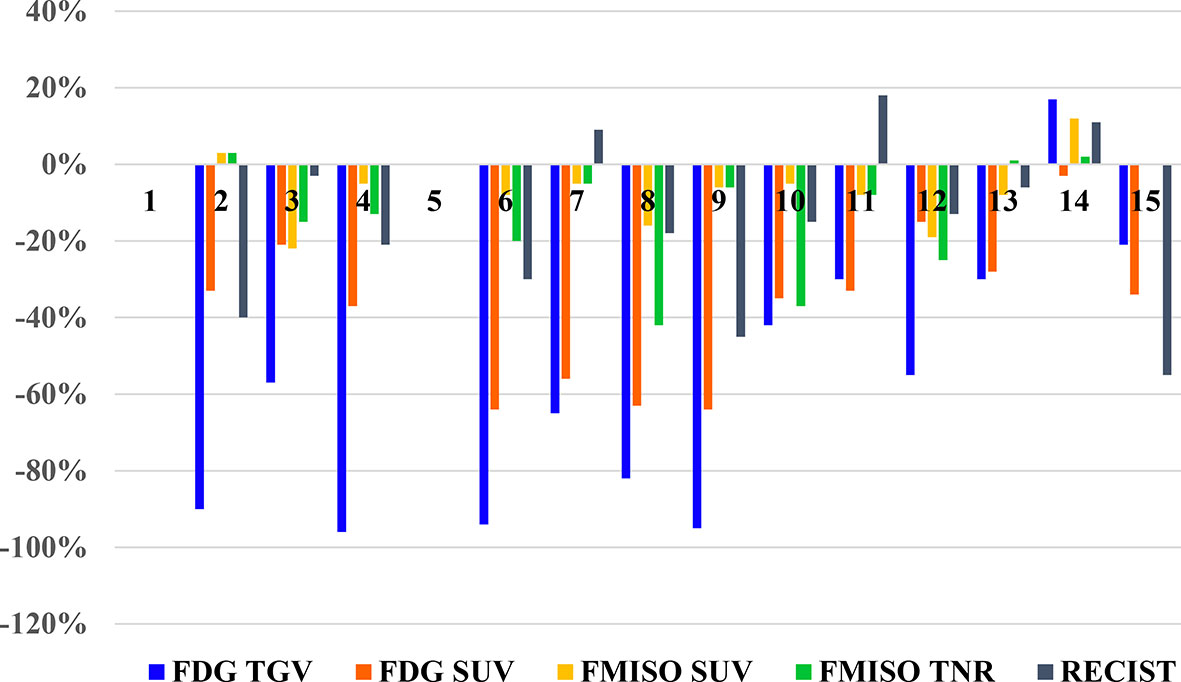
Figure 3 Waterfall plot of the changes seen of PET parameters on FDG and FMISO PET scans, and RECIST measurements on diagnostic CT for each patient.
According to the RECIST 1.1 criteria for evaluation of treatment response on CT scan, there were four patients with partial response with a decrease in tumor lesion size of at least 30% from the reference, and nine patients had stable disease, with insufficient shrinkage to qualify for partial response and insufficient increase to qualify for progressive disease (Table 3).
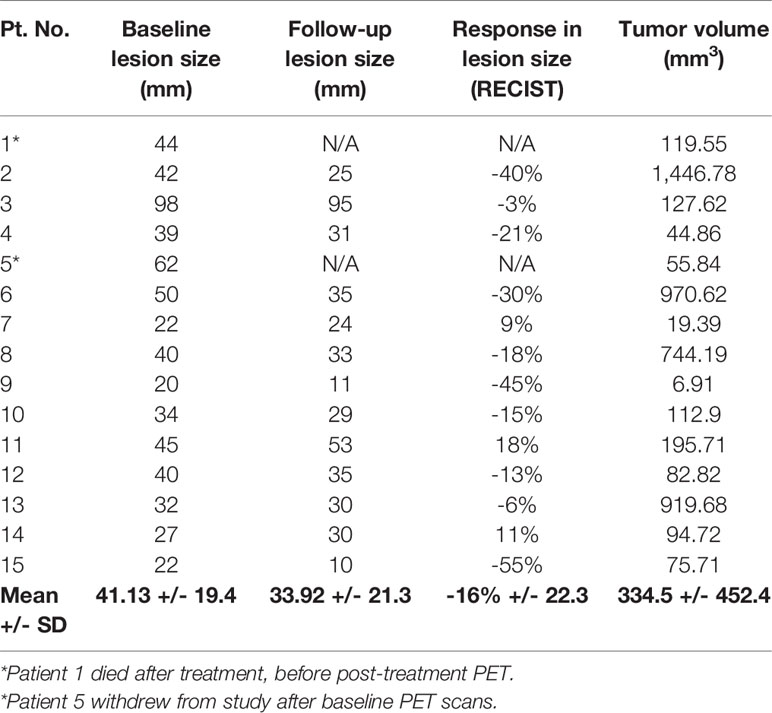
Table 3 Diagnostic CT findings and therapy response.
Using the EORTC/NCI criteria for evaluation of metabolic response on FDG PET scan, there were 12 patients with partial metabolic response (decrease in SUVmax of 15%–25%), of which 10 patients had a decrease of >25%, and 1 patient had stable metabolic disease with a small decrease in SUVmax of 2% (Table 2). Although similar criteria could not be applied to FMISO uptake in response to treatment, there were two patients with a decrease in FMISO SUVmax of >20%, two patients with moderate decrease in FMISO SUVmax between 10%–20%, seven patients who had small decreases in FMISO SUVmax of <10%. There were two patients with no change in FMISO uptake.
The TGV changes on FDG PET following treatment were greater, with eight patients demonstrating decreases in TGV of >50%; while four patients had decreases in TGV between 20%–50%, and one patient had an increase of 17% (Table 2). The tumor to normal ratio (TNR) changes on FMISO PET showed four patients had decreases between 20%–50%; two patients had decreases between 10%–20%; three patients had minor decrease of <10%; one patient had no change in FMISO TNR; and two patients had minor increase of up to 10%. One patient had an increase of 33%, who was also the single patient who demonstrated an increase in burden of disease on FDG PET too.
Blood Biomarkers and Positron Emission Tomography Scan Parameters
To evaluate the PET scan parameters of TGV and SUVmax for FDG PET scans, and TNR and SUVmax for FMISO PET scans, compared to the blood biomarker of VEGF and osteopontin, one-way ANOVA was performed. The ANOVA analysis indicated that there was a statistically significant correlation between all the PET parameters and VEGF levels and osteopontin levels in each patient (p-value <0.05).
Survival Assessment
Progression-free survival and overall survival in this cohort of patients was also evaluated, using a median cut-off of 6.6 for FDG SUVmax, 2.25 for FMISO SUVmax, 333 for FDG TGV. A cut-off value of 1.2 was used for FMISO TNR according to previously well published data (11). These were not statistically significant for neither progression-free or overall survival for all four PET parameters. However, the survival curves for the post-treatment FMISO TNR did demonstrate a trend towards significance, with p-value of 0.16 for PFS and 0.14 for OS (Figures 4A, B).
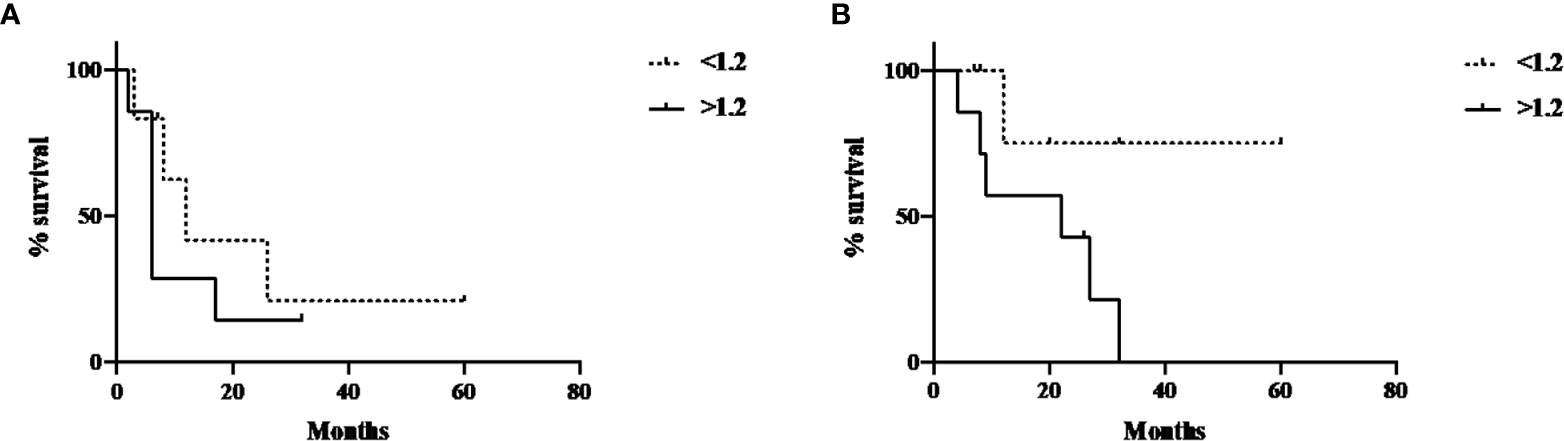
Figure 4 Post-treatment FMISO TNR and PFS and OS. (A) Post-treatment FMISO TNR and PFS (p-value 0.16); (B) Post-treatment FMISO TNR and OS (p-value 0.14).
Discussion
Tumor hypoxia and angiogenesis are hallmarks of cancer, and tumor cells have been found to be accompanied by angiogenic blood vasculature that exhibited altered permeability and vessel compression, with compressed and non-functional lymphatic vessels (20). These features lead to increased interstitial fluid pressure, which is a major transport barrier for the delivery of chemotherapeutic agents in tumor (20, 21). The concept of vascular “normalization” by anti-VEGF agents for improved drug delivery and efficacy is the basis of anti-angiogenic treatments (e.g., bevacizumab) which has been approved for treatment of metastatic colorectal cancer.
Our study evaluating FMISO response in patients with metastatic colorectal carcinoma treated with bevacizumab has demonstrated that hypoxia is present at baseline, but there is only minor changes in hypoxia in the tumor following initial treatment. While FDG uptake in the metastases was greater than FMISO uptake at baseline, FDG change in response to treatment was also greater than hypoxia change. Changes in FDG uptake (particularly TGV) were also associated with the response to anti-angiogenic treatment. These findings indicate that there is a complex interplay between tumor metabolism and hypoxic levels following anti-angiogenic treatment of metastatic colorectal cancer.
Following treatment with bevacizumab, changes in FMISO TNR showed a correlation with progression free and overall survival, although this did not reach statistical significance. To our knowledge, our study is the first to explore dynamic changes in hypoxia following bevacizumab treatment in colorectal cancer patients. In a prior study, a preclinical model of colorectal xenografts treated with bevacizumab demonstrated that post-treatment FMISO scan demonstrated a trend toward lower FMISO uptake, however, this did not correspond to hypoxia related parameters of carbonic anhydrase IX and GLUT1 staining which increased following treatment. This is likely due to the “normalization” of tumor vasculature and permeability following bevacizumab which improves blood supply to the tumor (22, 23). Changes in vascular morphology following anti-angiogenesis therapy have been reported from a study of patients with hepatic liver metastases where treatment with bevacizumab resulted in tumor vessel stabilization, reduced vascular density and increased necrosis (24).
The baseline VEGF and osteopontin levels correlated significantly with all the baseline PET parameters on FDG and FMISO scans, indicating that the serum levels of these markers are reflective of the underlying level of hypoxia in patients with metastatic colorectal cancer.
The study limitations are this is a pilot study, and there were a small number of patients who had PET scans available for comparison post-treatment. The changes in vascularization, and hence changes in hypoxia with anti-angiogenic treatments may also require a longer period of treatment before significant changes in hypoxia level are seen to be able to be assessed by FMISO PET scans, which were performed after 1 cycle of treatment in our study. In addition, possible changes in normal liver blood flow following anti-angiogenic therapy and subsequent impact on FMISO uptake and TNR values are not fully understood, and could be addressed in future studies with direct measurement of normal liver blood flow changes following anti-angiogenic therapy.
This study has shown that hypoxia in metastatic colorectal cancer, assessed by FMISO PET, is present and shows minor changes following initial treatment with anti-angiogenic therapy, but is associated with therapeutic response. FDG PET uptake changes (SUVmax and TGV) are also associated with response to anti-angiogenic therapy. Both FDG and FMISO PET parameters showed significant correlation with biomarkers of angiogenesis. These findings demonstrate the complex interplay between tumor metabolism and hypoxic regulation following anti-angiogenic treatment of metastatic colorectal cancer.
Data Availability Statement
The original contributions presented in the study are included in the article/Supplementary Material. Further inquiries can be directed to the corresponding author.
Ethics Statement
The studies involving human participants were reviewed and approved by the Austin Health Human Research Committee. The patients/participants provided their written informed consent to participate in this study.
Author Contributions
SL made the patient review, consent, experimental design and preparation, manuscript preparation, PET review, and image analysis. NT made the patient review, experimental design, consent, and manuscript review. HG made the experimental design, statistical analysis, and manuscript review. ZL performed the laboratory experiments and gave advice. JS made the PET tracer preparation and QC. KP. made the PET scan acquisition and QC. AS made the experimental design, manuscript preparation and review, and PET review. All authors contributed to the article and approved the submitted version.
Funding
Funding from the Cancer Council Victoria and University of Melbourne for STL, NHMRC grants (Nos. 1084178 and 1092788), and Operational Infrastructure Support Program provided by the Victorian Government is acknowledged. AS is supported by an NHMRC Investigator Fellowship.
Conflict of Interest
The authors declare that the research was conducted in the absence of any commercial or financial relationships that could be construed as a potential conflict of interest.
Supplementary Material
The Supplementary Material for this article can be found online at: https://www.frontiersin.org/articles/10.3389/fonc.2021.606210/full#supplementary-material
References
1. Bray F, Ferlay J, Soerjomataram I, Siegel RL, Torre LA, Jemal A. Global cancer statistics 2018: GLOBOCAN estimates of incidence and mortality worldwide for 36 cancers in 185 countries. CA Cancer J Clin (2018) 68(6):394–424. doi: 10.3322/caac.21492
2. Pessaux P, Lermite E, Brehant O, Tuech JJ, Lorimier G, Arnaud JP. Repeat hepatectomy for recurrent colorectal liver metastases. J Surg Oncol (2006) 93(1):1–7. doi: 10.1002/jso.20384
3. Poston GJ, Adam R, Alberts S, Curley S, Figueras J, Haller D, et al. OncoSurge: a strategy for improving resectability with curative intent in metastatic colorectal cancer. J Clin Oncol (2005) 23(28):7125–34. doi: 10.1200/JCO.2005.08.722
4. Modest DP, Ricard I, Heinemann V, Hegewisch-Becker S, Schmiegel W, Porschen R, et al. Outcome according to KRAS-, NRAS- and BRAF-mutation as well as KRAS mutation variants: pooled analysis of five randomized trials in metastatic colorectal cancer by the AIO colorectal cancer study group. Ann Oncol (2016) 27(9):1746–53. doi: 10.1093/annonc/mdw261
5. Seeber A, Gunsilius E, Gastl G, Pircher A. Anti-Angiogenics: Their Value in Colorectal Cancer Therapy. Oncol Res Treat (2018) 41(4):188–93. doi: 10.1159/000488301
6. Folkman J. What is the evidence that tumors are angiogenesis dependent? J Natl Cancer Inst (1990) 82(1):4–6. doi: 10.1093/jnci/82.1.4
7. Folkman J. Tumor angiogenesis:therapeutic implications. N Engl J Med (1971) 285(21):1182–6. doi: 10.1056/NEJM197111182852108
8. Hanahan D, Folkman J. Patterns and emerging mechanisms of the angiogenic switch during tumorigenesis. Cell (1996) 86(3):353–64. doi: 10.1016/S0092-8674(00)80108-7
9. Hanahan D, Weinberg RA. The hallmarks of cancer. Cell (2000) 100(1):57–70. doi: 10.1016/S0092-8674(00)81683-9
10. Shweiki D, Itin A, Soffer D, Keshet E. Vascular endothelial growth factor induced by hypoxia may mediate hypoxia-initiated angiogenesis. Nature (1992) 359(6398):843–5. doi: 10.1038/359843a0
11. Lee ST, Scott AM. Hypoxia positron emission tomography imaging with 18f-fluoromisonidazole. Semin Nucl Med (2007) 37(6):451–61. doi: 10.1053/j.semnuclmed.2007.07.001
12. Gagel B, Reinartz P, Dimartino E, Zimny M, Pinkawa M, Maneschi P, et al. pO(2) Polarography versus positron emission tomography ([(18)F] fluoromisonidazole, [(18)F]-2-fluoro-2’-deoxyglucose). An appraisal of radiotherapeutically relevant hypoxia. Strahlenther Onkol (2004) 180(10):616–22. doi: 10.1007/s00066-004-1229-y
13. Lawrentschuk N, Poon AM, Foo SS, Putra LG, Murone C, Davis ID, et al. Assessing regional hypoxia in human renal tumors using 18F-fluoromisonidazole positron emission tomography. BJU Int (2005) 96(4):540–6. doi: 10.1111/j.1464-410X.2005.05681.x
14. Guedj N, Bretagnol F, Rautou PE, Deschamps L, Cazals-Hatem D, Bedossa P, et al. Predictors of tumor response after preoperative chemoradiotherapy for rectal adenocarcinomas. Hum Pathol (2011) 42(11):1702–9. doi: 10.1016/j.humpath.2011.01.015
15. Cascinu S, Graziano F, Catalano V, Barni S, Giordani P, Baldelli AM, et al. Vascular endothelial growth factor and p53 expressions in liver and abdominal metastases from colon cancer. Tumor Biol (2003) 24(2):77–81. doi: 10.1159/000071080
16. Kuramochi H, Hayashi K, Uchida K, Miyakura S, Shimizu D, Vallbohmer D, et al. Vascular endothelial growth factor messenger RNA expression level is preserved in liver metastases compared with corresponding primary colorectal cancer. Clin Cancer Res (2006) 12(1):29–33. doi: 10.1158/1078-0432.CCR-05-1275
17. Hurwitz H, Fehrenbacher L, Novotny W, Cartwright T, Hainsworth J, Heim W. Bevacizumab plus irinotecan, fluorouracil and leucovorin for metastatic colorectal cancer. N Engl J Med (2004) 350:2335–42. doi: 10.1056/NEJMoa032691
18. Zhao M, Liang F, Zhang B, Yan W, Zhang J. The impact of osteopontin on prognosis and clinicopathology of colorectal cancer patients: a systematic meta-analysis. Sci Rep (2015) 5:12713. doi: 10.1038/srep12713
19. Busk M, Horsman MR, Jakobsen S, Bussink J, van der Kogel A, Overgaard J. Cellular uptake of PET tracers of glucose metabolism and hypoxia and their linkage. Eur J Nucl Med Mol Imag (2008) 35(12):2294–303. doi: 10.1007/s00259-008-0888-9
20. Hagendoorn J, Tong R, Fukumura D, Lin Q, Lobo J, Padera TP, et al. Onset of abnormal blood and lymphatic vessel function and interstitial hypertension in early stages of carcinogenesis. Cancer Res (2006) 66(7):3360–4. doi: 10.1158/0008-5472.CAN-05-2655
21. Duda DG. Antiangiogenesis and drug delivery to tumors: bench to bedside and back. Cancer Res (2006) 66(8):3967–70. doi: 10.1158/0008-5472.CAN-05-4536
22. Heijmen L, ter Voert EGW, Oyen WJG, Punt CJA, van Spronsen DJ, Heerschap A. Multimodality Imaging to Predict Response to Systemic Treatment in Patients with Advanced Colorectal Cancer. PloS One (2015) 10(4):e0120823. doi: 10.1371/journal.pone.0120823
23. Ulivi P, Marisi G, Passardi A. Relationship between hypoxia and response to antiangiogenic therapy in metastatic colorectal cancer. Oncotarget (2016) 7(29):46678–91. doi: 10.18632/oncotarget.8712
Keywords: metastatic colorectal carcinoma, fluoromisonidazole (FMISO) positron emission tomography (PET), hypoxia, bevacizumab, angiogenesis, response
Citation: Lee ST, Tebbutt N, Gan HK, Liu Z, Sachinidis J, Pathmaraj K and Scott AM (2021) Evaluation of 18F-FMISO PET and 18F-FDG PET Scans in Assessing the Therapeutic Response of Patients With Metastatic Colorectal Cancer Treated With Anti-Angiogenic Therapy. Front. Oncol. 11:606210. doi: 10.3389/fonc.2021.606210
Received: 14 September 2020; Accepted: 02 February 2021;
Published: 17 March 2021.
Edited by:
Po-Hsiang Tsui, Chang Gung University, TaiwanReviewed by:
John Buscombe, Consejo Nacional de Investigaciones Científicas y Técnicas (CONICET), ArgentinaKalevi Kairemo, Docrates Cancer Center, Finland
Copyright © 2021 Lee, Tebbutt, Gan, Liu, Sachinidis, Pathmaraj and Scott. This is an open-access article distributed under the terms of the Creative Commons Attribution License (CC BY). The use, distribution or reproduction in other forums is permitted, provided the original author(s) and the copyright owner(s) are credited and that the original publication in this journal is cited, in accordance with accepted academic practice. No use, distribution or reproduction is permitted which does not comply with these terms.
*Correspondence: Sze Ting Lee, c3pldGluZy5sZWVAYXVzdGluLm9yZy5hdQ==