 Ruizhi Gao1†Hui Qin1†Peng Lin1Chenjun Ma2Chengyang Li2Rong Wen1Jing Huang1Da Wan1Dongyue Wen1Yiqiong Liang3Jiang Huang3Xin Li4
 Xinrong Wang4
 Gang Chen5Yun He1*
 Hong Yang1*
- 1Department of Medical Ultrasound, The First Affiliated Hospital of Guangxi Medical University, Nanning, China
- 2Department of Urology, The First Affiliated Hospital of Guangxi Medical University, Nanning, China
- 3Department of Radiology, The First Affiliated Hospital of Guangxi Medical University, Nanning, China
- 4GE Healthcare Global Research, GE, Shanghai, China
- 5Department of Pathology, The First Affiliated Hospital of Guangxi Medical University, Nanning, China
Purpose: The present study aims to comprehensively investigate the prognostic value of a radiomic nomogram that integrates contrast-enhanced computed tomography (CECT) radiomic signature and clinicopathological parameters in kidney renal clear cell carcinoma (KIRC).
Methods: A total of 136 and 78 KIRC patients from the training and validation cohorts were included in the retrospective study. The intraclass correlation coefficient (ICC) was used to assess reproducibility of radiomic feature extraction. Univariate Cox analysis and least absolute shrinkage and selection operator (LASSO) as well as multivariate Cox analysis were utilized to construct radiomic signature and clinical signature in the training cohort. A prognostic nomogram was established containing a radiomic signature and clinicopathological parameters by using a multivariate Cox analysis. The predictive ability of the nomogram [relative operating characteristic curve (ROC), concordance index (C-index), Hosmer–Lemeshow test, and calibration curve] was evaluated in the training cohort and validated in the validation cohort. Patients were split into high- and low-risk groups, and the Kaplan–Meier (KM) method was conducted to identify the forecasting ability of the established models. In addition, genes related with the radiomic risk score were determined by weighted correlation network analysis (WGCNA) and were used to conduct functional analysis.
Results: A total of 2,944 radiomic features were acquired from the tumor volumes of interest (VOIs) of CECT images. The radiomic signature, including ten selected features, and the clinical signature, including three selected clinical variables, showed good performance in the training and validation cohorts [area under the curve (AUC), 0.897 and 0.712 for the radiomic signature; 0.827 and 0.822 for the clinical signature, respectively]. The radiomic prognostic nomogram showed favorable performance and calibration in the training cohort (AUC, 0.896, C-index, 0.846), which was verified in the validation cohort (AUC, 0.768). KM curves indicated that the progression-free interval (PFI) time was dramatically shorter in the high-risk group than in the low-risk group. The functional analysis indicated that radiomic signature was significantly associated with T cell activation.
Conclusions: The nomogram combined with CECT radiomic and clinicopathological signatures exhibits excellent power in predicting the PFI of KIRC patients, which may aid in clinical management and prognostic evaluation of cancer patients.
Introduction
Regarded as one of the most prevalent tumors of the urogenital system, renal cell cancer (RCC) is a highly malignant cancer derived from the renal epithelium of the parenchyma. In 2020, 45,520 new cases were diagnosed in males and 28,230 in females. RCC accounted for 5% of all male malignancies and 3% of all female malignancies in 2020 (1). KIRC, the most epidemic histological subtype of primary RCC, accounts for almost 90% of all kidney malignancies with five-year survival rates of approximately 44–69% (2, 3). Progress has been achieved through multiple optional methods in surgical resection and systemic therapies for KIRC; however, overall survival and prognosis, especially if the cancer is detected at an advanced stage, are still unsatisfactory if the cancer is not treated optimally, due to high invasiveness, high mortality, and resistance to chemoradiotherapy (2, 4). Worse still, the incidence of RCC has been steadily increasing over the past several years (1, 2). The ability to predict prognosis preoperatively and non-invasively is vital. However, specific biomarkers are still lacking because of the complexity of disease progression and high heterogeneity of KIRC. It is urgent that we explore biomarkers that are capable of predicting and monitoring prognosis with good accuracy and then provide a personalized strategy for judgment of clinical treatment.
Radiomics, as a rapidly developing field of transforming medical images into available data in radiology, has the capability to investigate efficacy monitoring, prognosis surveillance, micro-environment evaluation, and biological behavior assessment via quantitatively extracting features and excavating in-depth characterization of tumor phenotypes beyond imaging interpretation (5, 6). Radiomics not only can show relationships between radiomic signatures and genomics, metabolomics, and proteomics but also offer a non-invasive way to create objectively quantitative biomarkers of tumor biology that might be of value in predicting prognosis and therapy response (7). Recently, increasing attention has been focused on the application of computed tomography (CT) radiomic in RCC, which has satisfactory potential in lesion characterization (8–10), histological grade (11–13) and assessment of response to treatment (14, 15). Nevertheless, the correlation between radiomic features and the prognosis of KIRC patients is still undefined, and thorough research should be conducted to provide references for clinical work.
To address the need for a non-invasive, preoperative method of assessing the prognosis of KIRC patients, we have developed a contrast-enhanced computed tomography (CECT) radiomic prognostic signature based on three-dimensional (3D) medical images, and we have identified clinical signature based on clinical parameters in this study. With the combination of radiomic features and clinical parameters, a comprehensive nomogram was established to evaluate the progression-free interval (PFI) of patients suffering from KIRC. In order to further investigate the relationship between radiomic characteristics and gene regulation, weighted correlation network analysis (WGCNA) and function enrichment as well as signaling pathway analysis were performed. Fortunately, the results of this research indicated that our radiomic nomogram could not only predict prognosis and guide clinical therapy of KIRC but also elucidate the underlying molecular mechanism of KIRC.
Materials And Methods
Sample Collection
A total of 136 patients with KIRC were collected from our hospital from 2012 to 2016 as the training cohort of the study. This study was approved by the hospital ethics committee, and informed consent was waived due to its retrospective nature. The inclusion criteria were as follows: (1) KIRC was histologically confirmed postoperatively; (2) patients preoperatively received CECT examination; and (3) CECT images and corresponding prognostic data could be obtained. The exclusion criteria were as follows (1): the patients received preoperative chemotherapy or chemoradiotherapy; (2) the renal lesion was poorly displayed on the images; and (3) preoperative CECT image, relevant clinicopathological parameters of patients were lacking. Data of clinicopathological parameters [age, gender, clinical staging (cTNM), and pathology grade, PFI time] and CECT images were obtained from electronic patient record system.
The validation cohort comprised CECT images of patients with KIRC from The Cancer Imaging Archive (TCIA; http://www.cancerimagingarchive.net/) datasets and their relevant clinicopathological data gathered from websites from The Cancer Genome Atlas (TCGA; https://cancergenome.nih.gov/). The inclusion and exclusion criteria and collection of clinicopathological parameters were consistent with those mentioned above.
Image Acquisition and Delineation of the Area of Interest
An abdominal CECT examination containing phase scanning of the corticomedullary phases (CMP) (30–40 s), nephrographic phases (NP) (70–90 s), and excretory phases (EP) (3–4 min) was preoperatively adopted in enrolled patients. Three CT scanning instruments were applied in this study, and the specific models and scanning parameter configurations were shown in Table 1. In our study, only the corticomedullary phase (CMP) of CECT was used for radiomic analysis, and the identification of CMP was determined by the method of previous studies (16, 17). The 3D volumes of interest (VOI), including the target lesion on the CMP of the CECT images, was segmented by two experienced radiologists with 10 years of radiology experience using ITK-SNAP (http://www.itksnap.org/) (18).
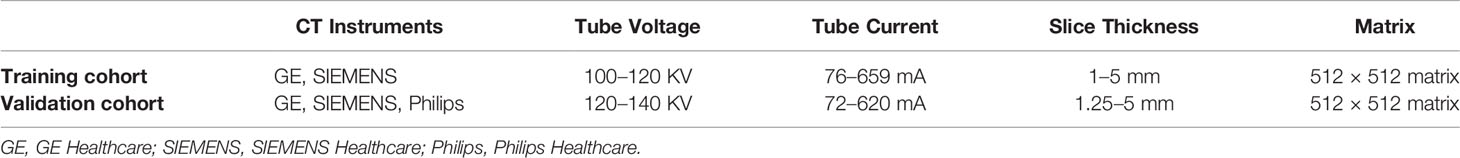
Table 1 Summary of parameters of CT models and scanning protocols.
Radiomic Features Extraction
Feature extraction was conducted by Ultrasomics (Version 2.1), which is software capable of high-throughput extraction of massive image features (19–21). A total of 2,944 high-throughput radiomic characteristics were acquired automatically from VOI based on each target lesion of the tumor. The radiomic features consisted of six different feature types (1): 122 original (such as first-order statistics, shape descriptors, texture classes, gray-level co-occurrence matrix, gray-level run length matrix, and gray-level size zone matrix) (2); 1,170 co-occurrence of local anisotropic gradient orientations (CoLIAGe) (3); 432 wavelets + local binary pattern (LBP) (4); 1,080 Gabors (5); 80 phased congruency-based local binary pattern (PLBP); and (6) 60 wavelet-based improved local binary pattern (WILBP) features.
Intraclass Correlation Coefficient Analysis
In order to assess the reproducibility of radiomic features exaction, 30 cases were randomly chosen from all patients, and their CECT images were segmented by the two radiologists mentioned above in a double-blind condition to test the consistency of the delineation of the tumor VOI. The intraclass correlation coefficient (ICC) was adopted to measure the inter-observer consistency of the feature extraction. Radiomic features with ICC values ≥0.75 indicate a strong consistency.
Sample Grouping and Feature Preprocessing
In the design of this study, the cases from our hospital were used as the training cohort, and the cases from TCIA were used as the validation cohort. Similarly, according to the grouping information, the corresponding radiomic features and clinical parameters were divided into two groups. A calculative model was applied to the training cohort to learn underlying patterns hidden in the datasets, and a validation cohort was used to evaluate the predictability of the model. For these radiomic features, z-score standardization was conducted to normalize the radiomic profiles in the training cohort and validation cohort, respectively.
Survival Analysis and Establishment of Prognostic Signatures
To search for radiomic features and clinical parameters significantly associated with survival, survival analysis of the training cohort was performed using the “survival” package. We defined PFI as an end point event, and PFI is commonly used in cancer therapy monitoring. The definition of the endpoint was consistent with previous studies (22, 23). Univariate Cox regression analysis was conducted to investigate the relevance of each radiomic feature, clinical variable, and PFI. Significant (P < 0.1) variables were contained in the subsequent regressive analysis. Aimed at selecting predictors with the highest predictive power, using the R “glmnet” package the LASSO-penalized Cox regression algorithm was adopted to reduce the dimension of high-dimensional data in the training cohort and to select the radiomic features with the strongest prognostic value and the lowest relationship among each other (24, 25). In LASSO regression, the optimal Lambda value was chosen according to the minimum mean square error. With the help of the “survival” package, multivariable Cox analysis was applied to further determine the most useful prognostic radiomic features and clinical variables with independent prognostic values using stepwise regression analysis and the best subset regression method. Subsequently, a radiomic signature and a clinical signature were established by linear combination method. The weight coefficients of the radiomic features and clinical variables were derived from the regression coefficients in multivariate survival analysis by setting the PFI as the attributive variable. The KIRC patients were split into low- and high-risk groups according to the median risk score of each risk signature. The KM curve, time-dependent ROC curve, and Concordance index (C-index) were used to assess the efficiency of each risk signature by using the “survivalROC” package and the “survcomp” package (26, 27).
Development and Validation of the Nomogram
To explore the prognostic value of the combinative signature with clinical factors, we took the radiomic signature and meaningful clinical parameters into the Cox regression model to generate a combined clinical–radiomic model. In order to visualize model efficiency, the trained cohort was applied to develop the easy-to-use nomogram of the clinical prognostic prediction model using the “rms” package, and the validated cohort was used for external verification. Similarly, high- and low-risk groups were determined based on the median risk score from the clinical–radiomic prediction model, and KM curves were drawn to assess differences in PFI between the two groups of patients. C-index and ROC curve analysis were used to measure nomogram performance. A calibration curve was utilized to assess the predictive accuracy of the nomogram, and model fitness was assessed by the Hosmer and Lemeshow goodness-of-fit test.
WGCNA and Functional Analysis
In order to investigate the molecular microcosmic meaning of radiomic features and reveal the underlying association of radiomic features and transcriptome molecular function, unsigned WGCNA was performed to determine genes that were correlated to prognostic radiomic features using the “WGCNA” package (28). WGCNA is a systematic biology approach illustrating patterns of gene relevance of different phenotypes and seeking clusters (modules) of highly relevant genes and correlative modules with external sample traits. Transcriptomics data of KIRC were acquired from TCGA. In this study, only the protein-encoding messenger RNAs (mRNAs) were selected to investigate the molecular functional characteristics of KIRC; low-abundance protein-coding genes with average log2 (count + 1) values <0.5 were discarded. The gene modules that correlated with radiomic features most significantly were selected as the key modules, which were used for subsequent function enrichment and signaling pathways analysis. The “clusterProfiler” package was used for performing Gene Ontology (GO) and Kyoto Encyclopedia of Genes and Genomes (KEGG) analysis. As a conventional method, GO enrichment analysis was applied to assess biological process (BP), molecular functions (MF), and cellular components (CC) involved in the genes of interest. KEGG pathway analysis was aimed at identifying the underlying functional and signaling pathways connected to modules genes.
RESULTS
Patient Clinical Parameters
The flowchart of our research was displayed in Figure 1, and the flowchart of patients selected and included from TCIA was shown in Supplementary Figure 1. There were 78 KIRC patients from TCGA who satisfied the entry criteria for enrolling in the study. The schematic diagram of the complete 3D geometric image obtained by manually drawing and segmenting the VOI was shown in Figure 2. Detailed clinical baseline characteristics of patients were presented in Supplementary Table 2. In the training cohort, there were 97 cases in males and 39 cases in females, with a median age of 53 years and an age range of 20–81 years. The median follow-up time for PFI was 1,470 days. In the validation cohort, there were 44 cases in males and 34 cases in females, with a median age of 59 years and an age range of 26–85 years. The median follow-up time for PFI was 1,227 days.
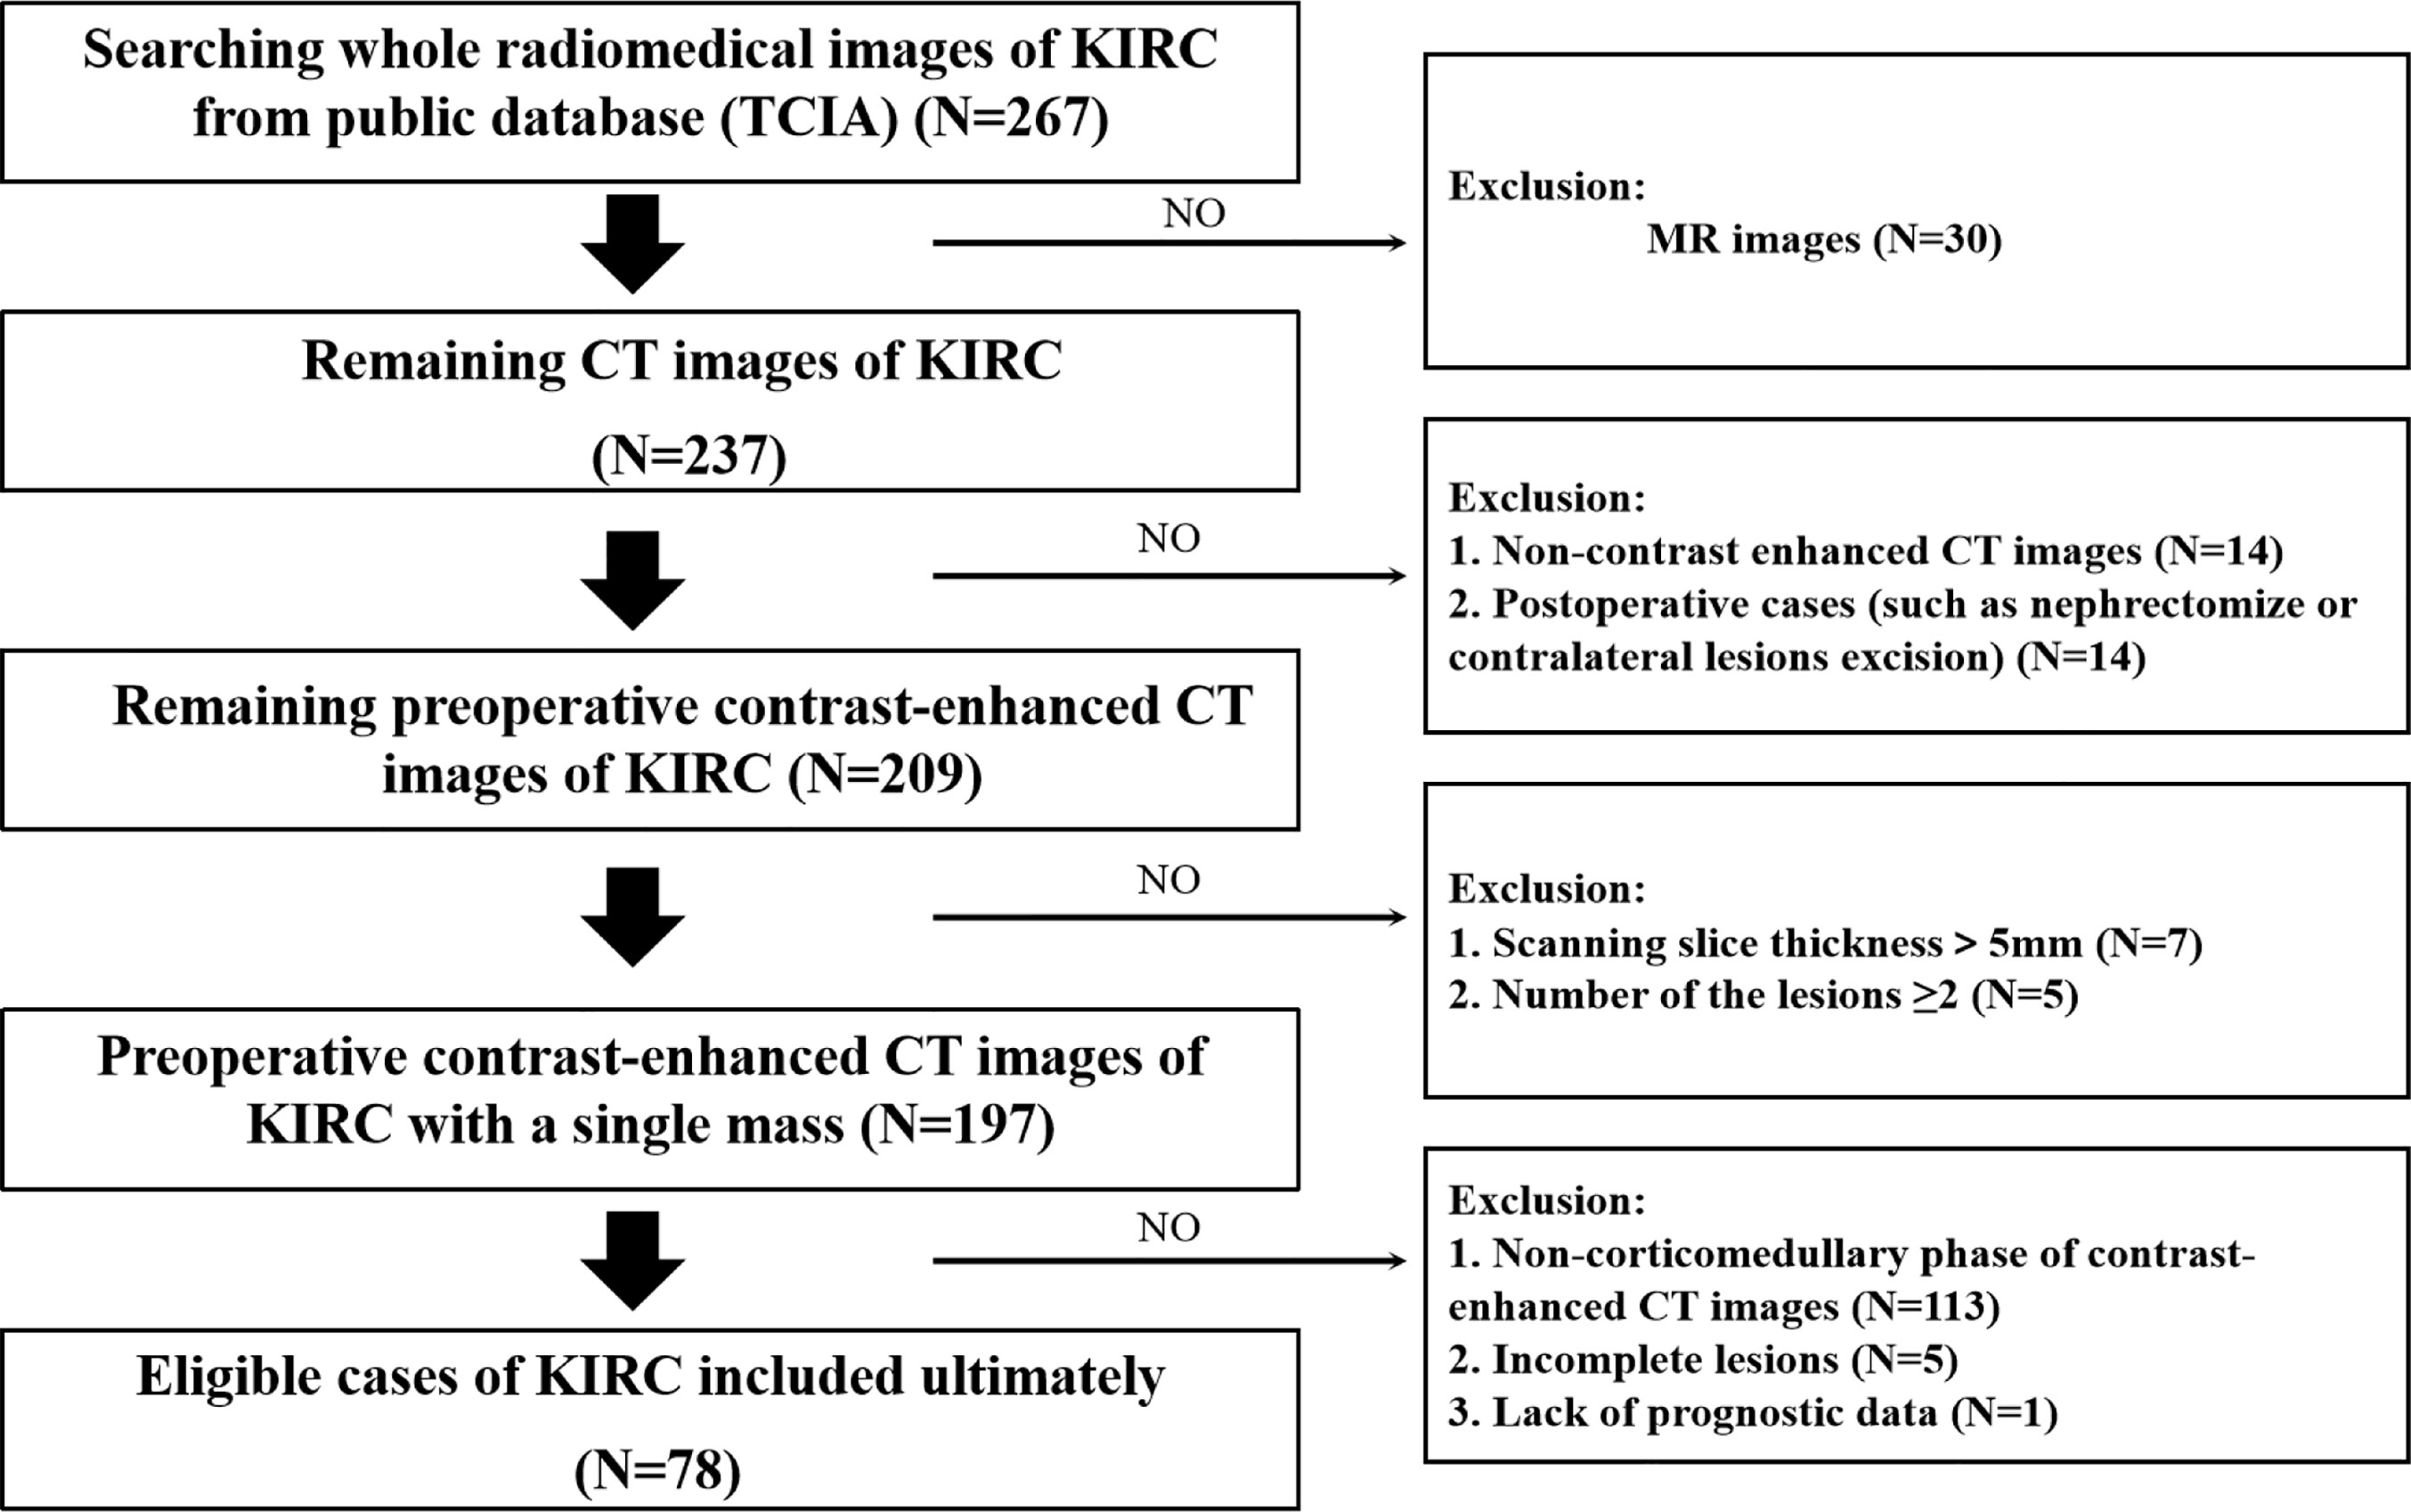
Figure 1 Technology roadmap of this study.
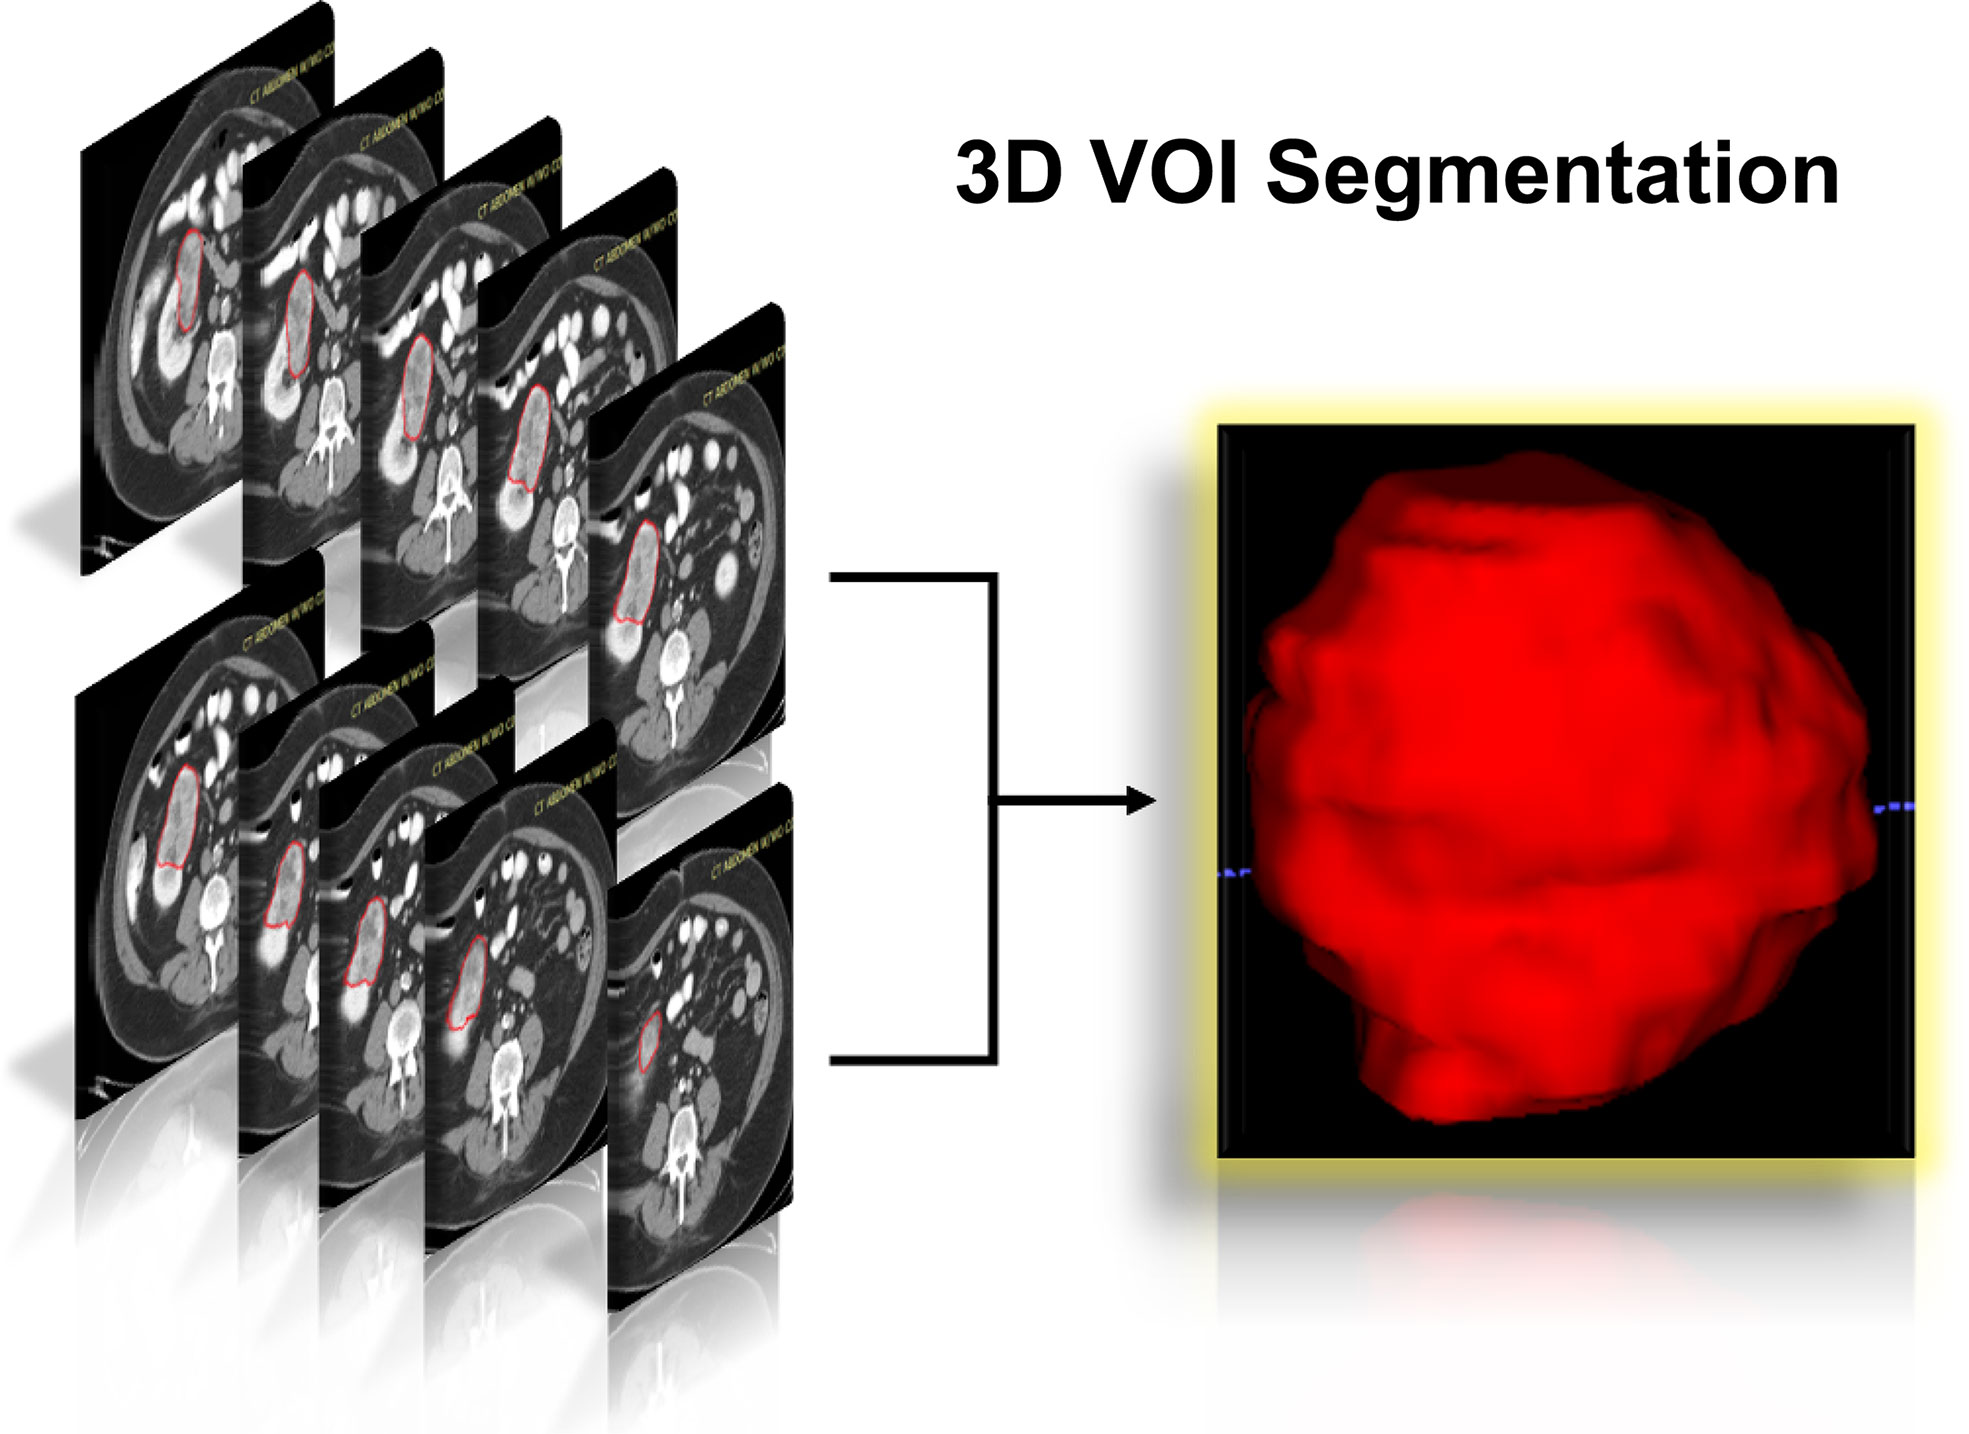
Figure 2 Schematic diagram of the complete 3D geometric image obtained by manually drawing and segmenting the VOI from the CECT examination. 3D, three dimensions; VOI, volumes of interest; CECT, contrast-enhanced computed tomography.
Intraclass Correlation Coefficient Analysis and Feature Preprocessing
A total of 2,944 features were extracted from the CT images. The average and median values of the inter-observer ICC of radiomic features were 0.814 and 0.974. The ICC result showed good consistency between groups. After the ICC analysis, there were 2,244 (76.22%) radiomic features with ICC≥0.75, which indicated that these radiomic features had good reproducibility. Z-score standardization of radiomic features was done as described in the Materials and Methods section. A total of 1,901 radiomic features were used for subsequent prognostic analysis.
Radiomic Features and Clinical Variable Selection
In the univariate Cox regression analyses, 43 radiomic features, age, cTNM, and grade were significantly correlated with the PFI of KIRC patients (P < 0.1) and were used for subsequent investigation. In multivariate analysis, double feature-dimension reduction methods (LASSO and stepwise regression analysis) were used to identify the 10 radiomic features and clinical variable (cTNM) (P < 0.05) that were independent prognostic markers for PFI (Figure 3). Although age (P = 0.051) and pathological grade (P = 0.059) did not show significant significance in multivariate Cox regression analysis, both of them are clinically important factors affecting the prognosis of KIRC, so we also included them in our clinical prediction signature (Table 2).
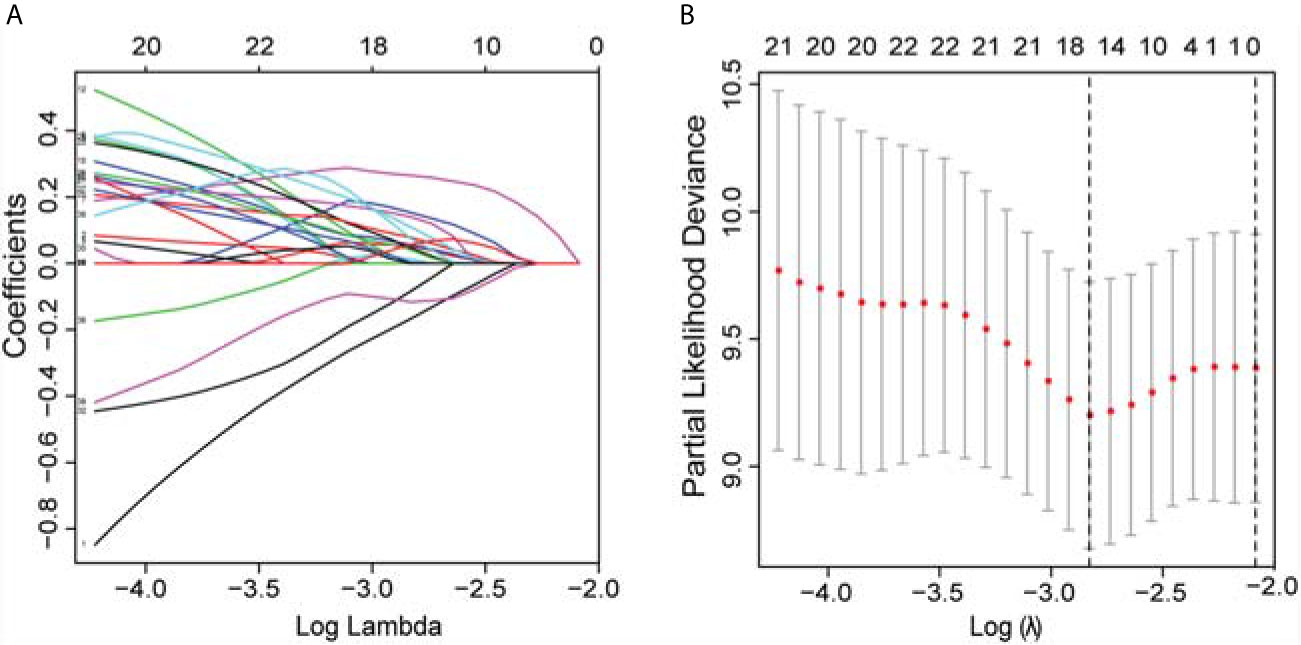
Figure 3 LASSO was utilized to identify the radiomic features that highly correlated with the PFI of KIRC patients. (A) LASSO path map, radiomic features corresponding to different alpha features. (B) Optimal lambda resulted in 16 non-zero coefficients for the radiomic signature. PFI, progression-free interval; LASSO, least absolute shrinkage and selection operator; KIRC, Kidney Renal Clear Cell Carcinoma.
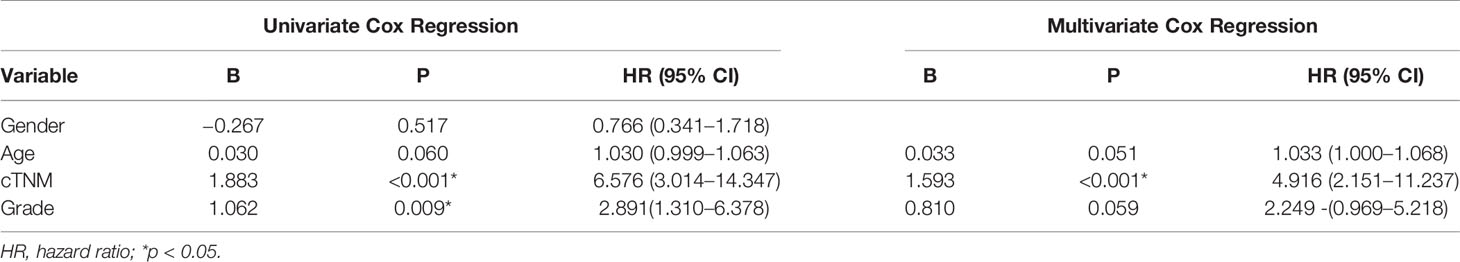
Table 2 Univariate and multivariate Cox regression analyses of clinicopathological parameters.
Development and Validation of the Prognostic Signatures
The radiomic prognostic signature, consisting of ten features, and the clinical prognostic signature, consisting of three clinical variables, were constructed by multivariate Cox analysis (Table 3 and Supplementary Table 2). The correlation analysis heat maps of the modeling radiomic features in the training cohort and the validation cohort were shown in Figure 4. In terms of prediction accuracy, we found that our prediction signatures performed well. For radiomic signature, the AUC for the training cohort was 0.897, and the AUC for the validation cohort was 0.712 (Figures 5A, B). The AUC of the training cohort in the clinical signature was 0.827, and the AUC of the validation cohort was 0.822 (Figures 5C, D). The C-index values of the radiomic signature and the clinical signature were 0.861 (95% CI 0.789–0.927) and 0.784 (95% CI 0.696–0.872), respectively. The KM survival curve analysis of both the radiomic signature and the clinical signature revealed that the PFI of the high-risk group was dramatically shorter than that of the low-risk group (P < 0.05) (Supplementary Figures 2 and 3). These results mean that the above-risk signatures performed well in predicting the clinical outcome of KIRC patients.
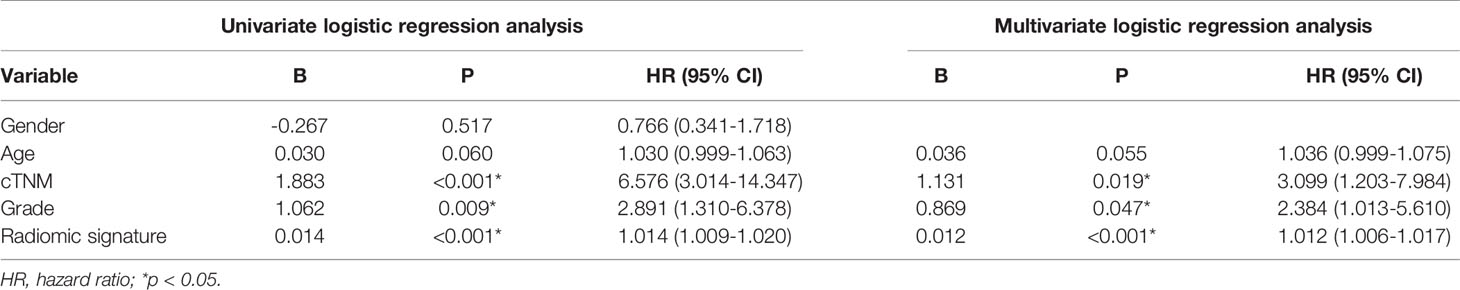
Table 3 Univariate and multivariate Cox regression analysis of radiomic normogram.
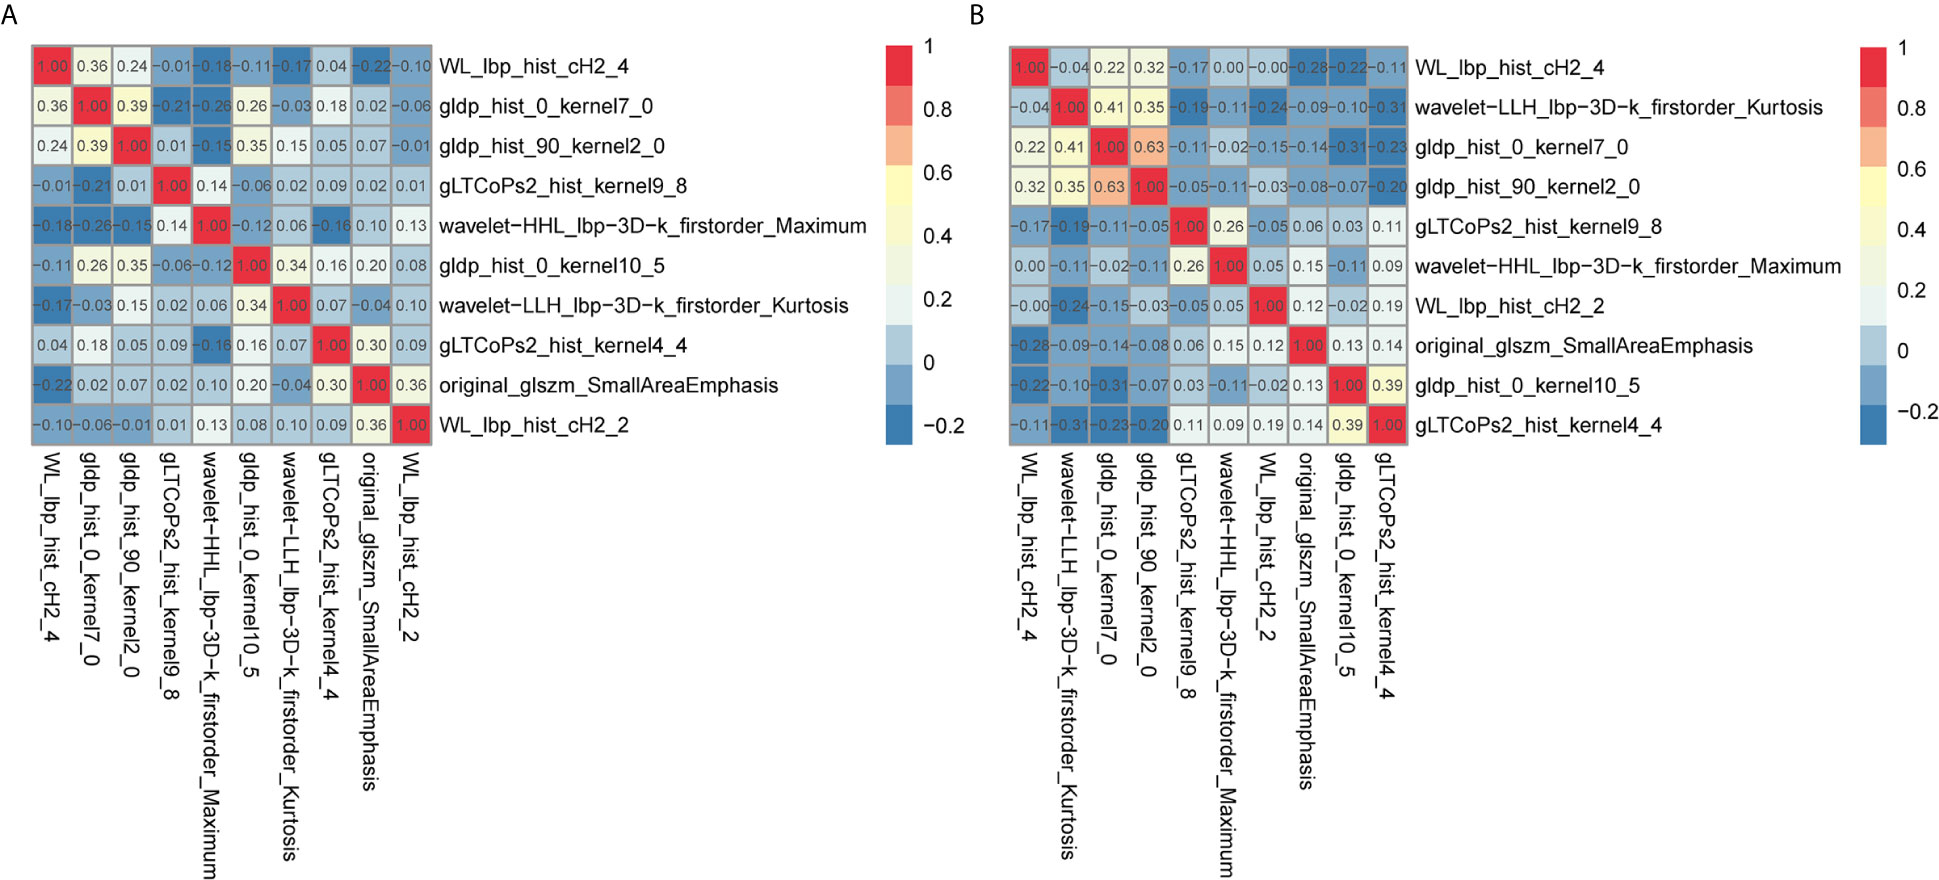
Figure 4 Co-expression heat maps of radiomic features used to build the radiomic signature. (A, B) co-expression heat maps of the radiomic modeling features in the training cohort and validation cohort. Positive correlation represents co-expression relationships between radiomic features; and negative correlation represents negative co-expression relationships between features. Red indicates a positive correlation; blue indicates a negative correlation.
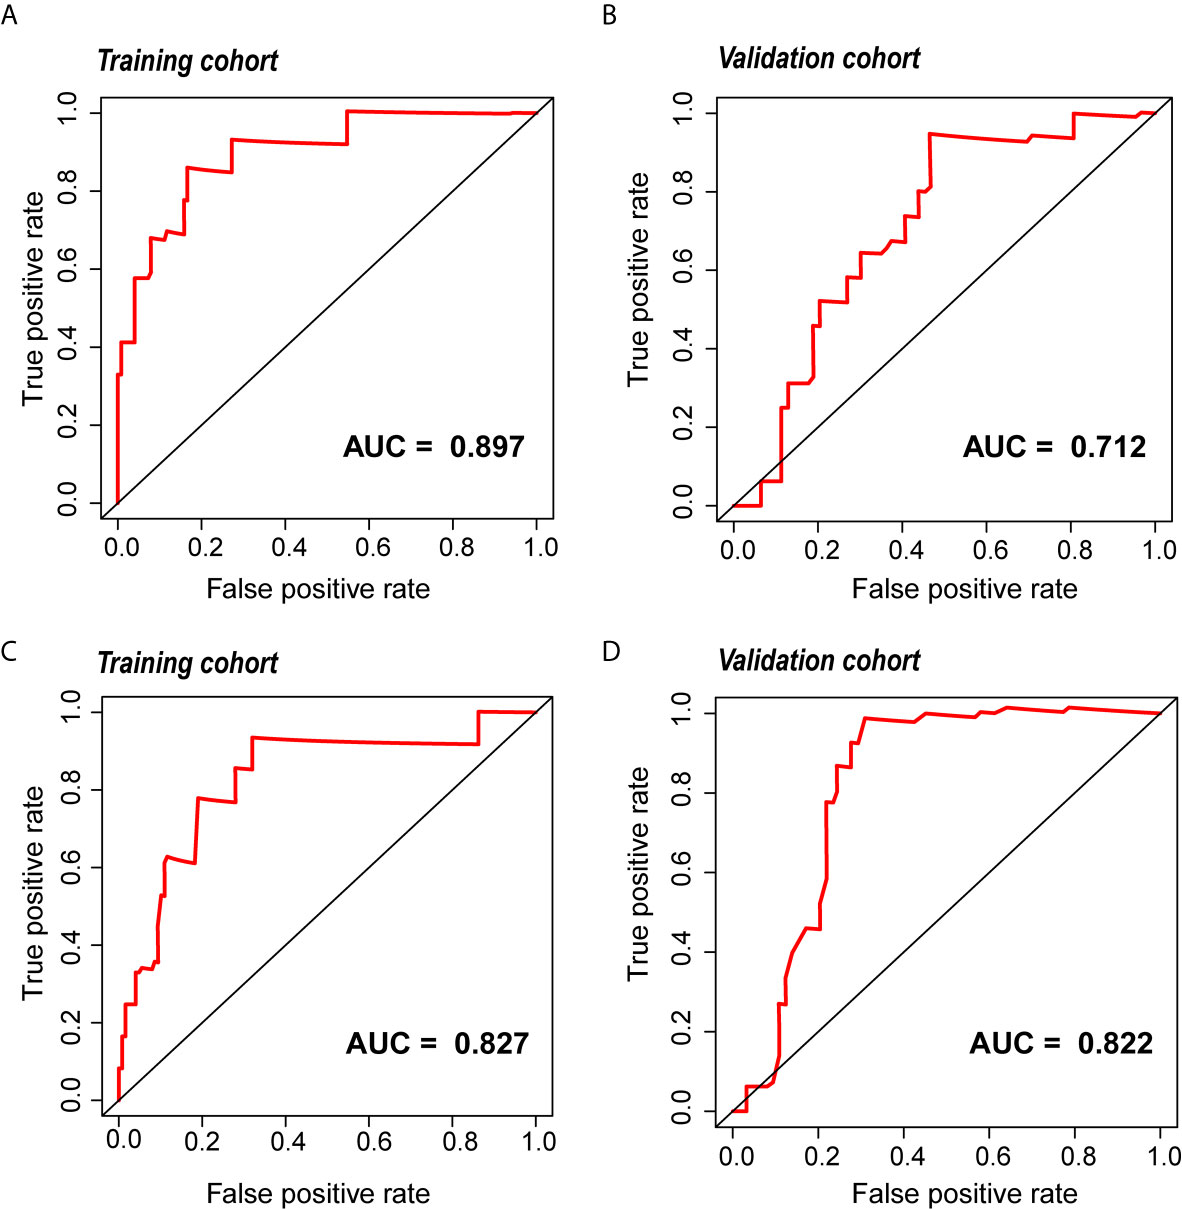
Figure 5 The ROC curve of the radiomic and clinical signature. (A, B) The ROC of the radiomic signature in the training cohort and the validation cohort. (C, D) The ROC of the clinical signature in the training cohort and the validation cohort. ROC, relative operating characteristic curve.
Nomogram Construction and Evaluation
Because clinical characteristics are also important factors in cancer outcome, they were added to the comprehensive multivariate Cox regression model. A comprehensive nomogram including radiomic score and clinical pathological parameters was developed and visualized for intuitively predicting the PFI of KIRC patients (Figure 6A). The comprehensive risk model in the training cohort had an AUC of 0.896 in predicting PFI of KIRC, and the AUC was 0.768 in the validation cohort (Figures 6B, C). The C-index was 0.846. The calibration curves exhibited good agreement between the forecast by the nomogram and actual 1-, 3- and 5-year PFI in both the training cohort and the validation cohort (Figures 7A, B). Determination coefficient (R2) was used to test the goodness fit of the model. In the present design, the value of the determination coefficient was R2 = 0.381. The survival analysis showed that the PFI time of the high-risk group was significantly shorter than that of the low-risk group (Figure 8). Collectively, these consequences indicated that the clinical–radiomic signature was a valuable prognostic index for KIRC patients’ stratification and a good indicator for outcome.
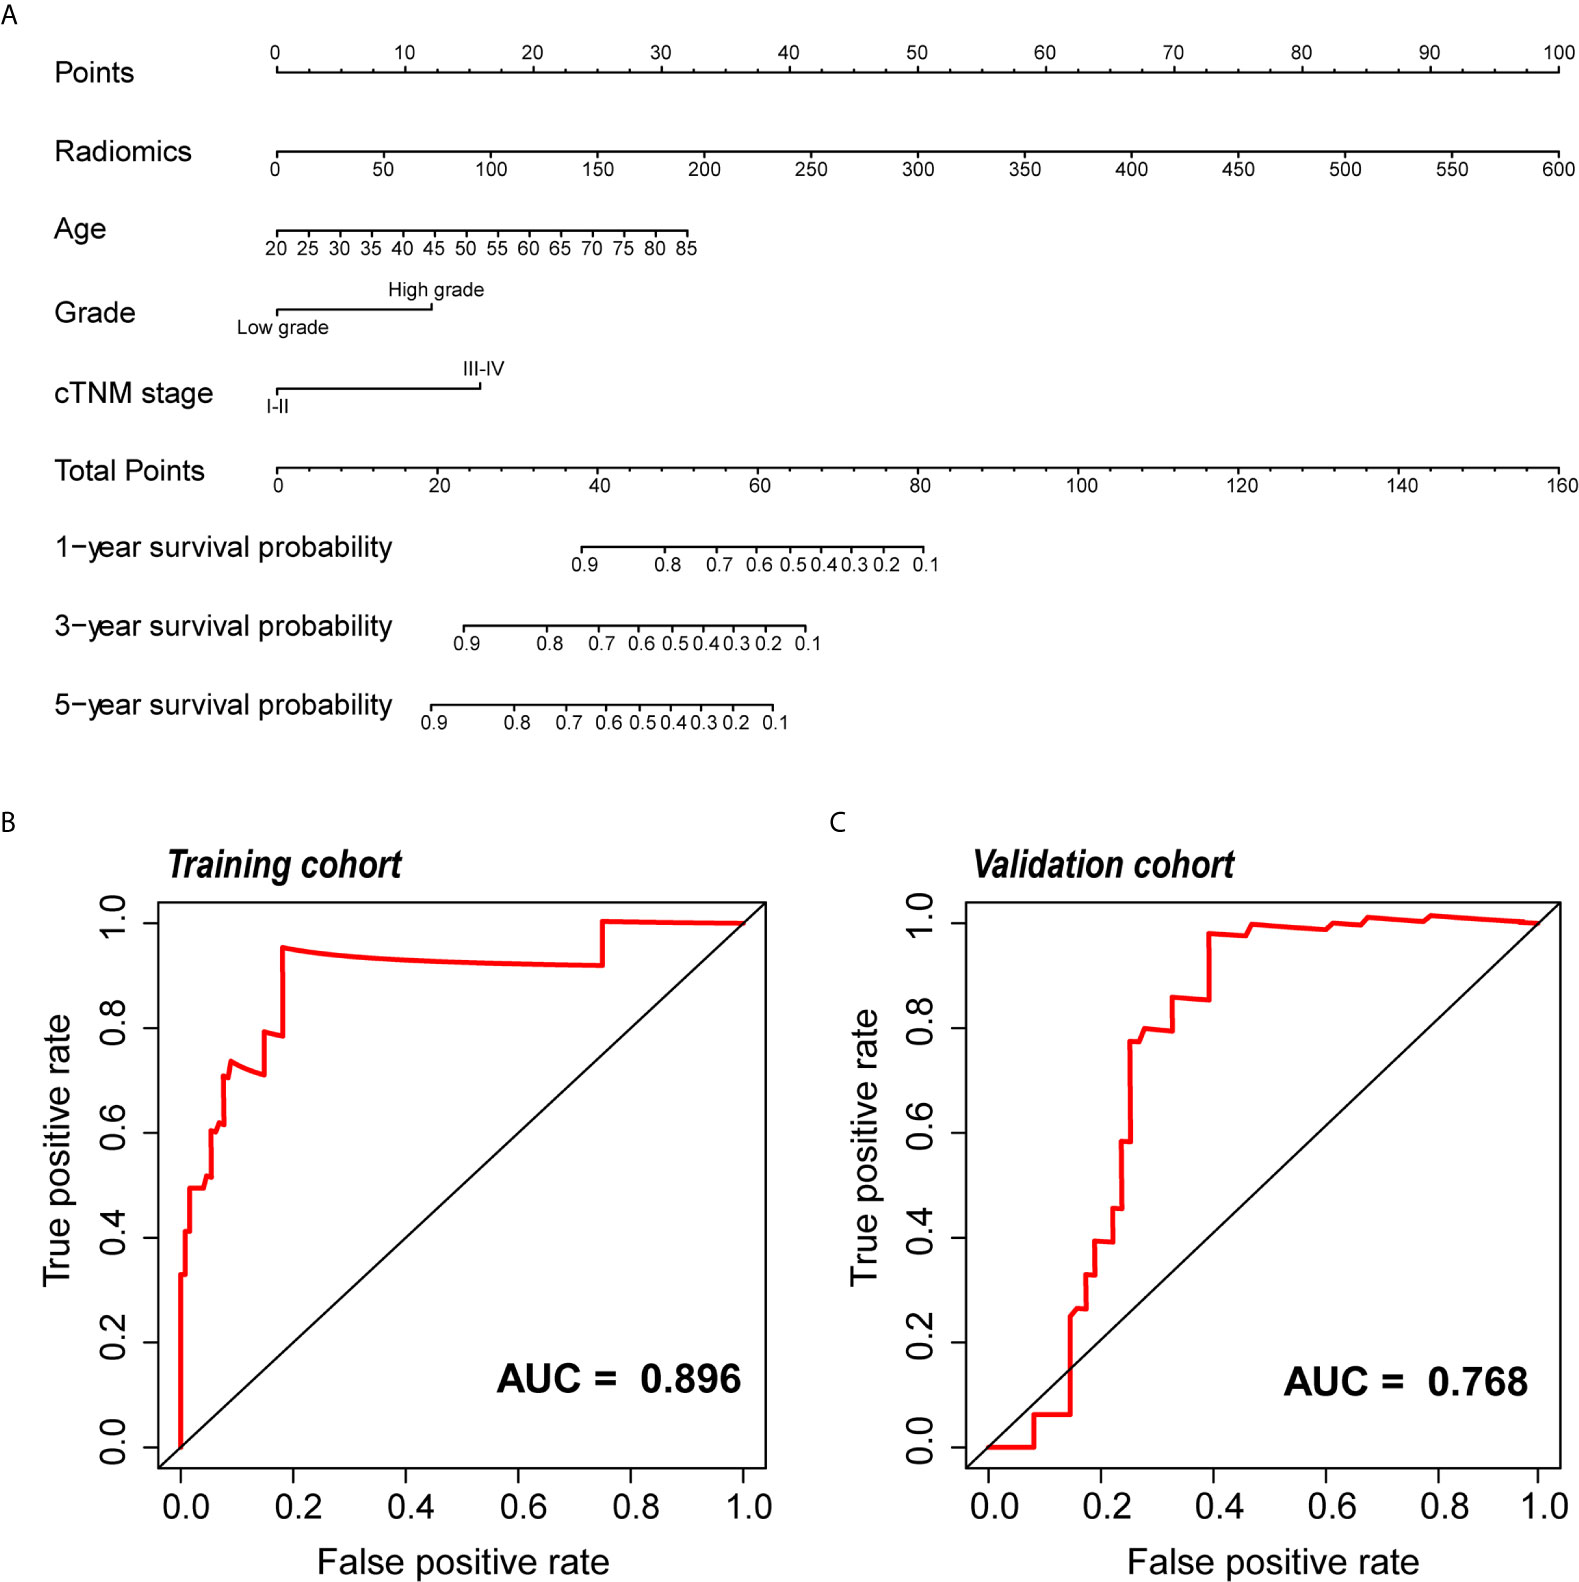
Figure 6 Development and validation of the nomogram. (A) The nomogram for predicting 1, 3, and 5 years PFI of KIRC patients. An example of how to use the nomogram was presented below: a patient that has a radiomic score of 150 and is 60 years old; the pathological grade is high and the cTNM stage is IV. According to the point scale on the nomogram, the points for the four indicators are 25, 10, 12.5 and 0, then the points of these four factors are added up to a total score of 47.5. The next step is to find 47.5 points on the total points scale below, and draw a line perpendicular to the following three axes. Then the probability of one-year PFI of this patient is between 0.8 and 0.9, which is about 0.82, indicating that the probability of one-year PFI of this patient is 82%, and the remaining probability values can be obtained in the same way. (B, C) ROC curve of the nomogram for predicting PFI in the training and the validation cohorts. PFI, progression-free interval; KIRC, Kidney Renal Clear Cell Carcinoma; ROC, relative operating characteristic curve.
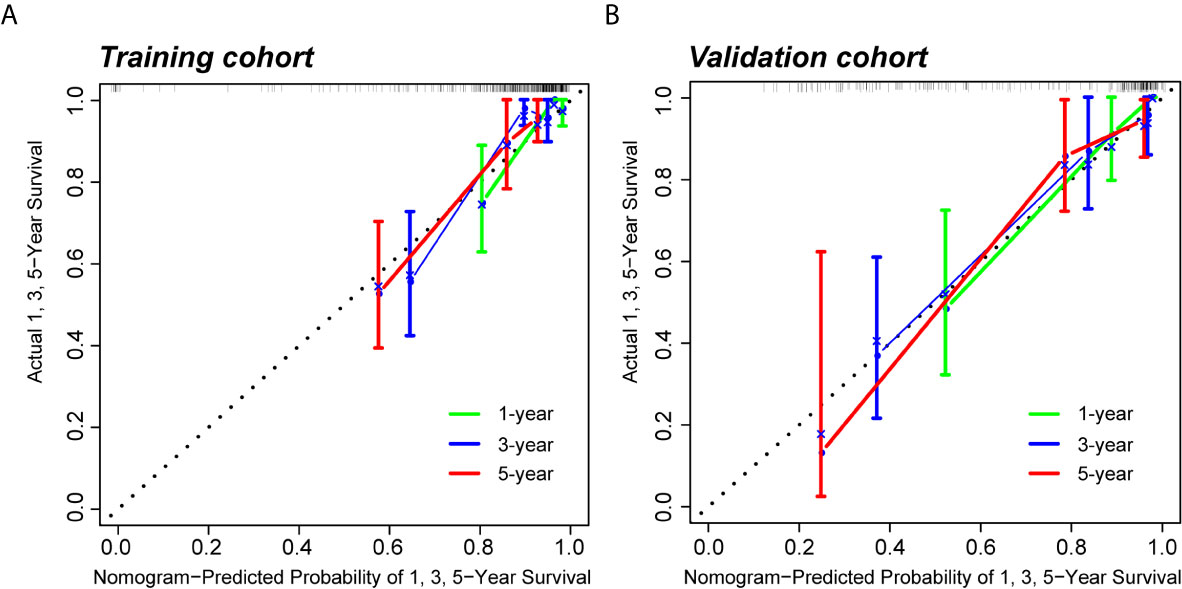
Figure 7 Calibration curves of the predictive nomogram. (A, B) Calibration curves of the nomogram to predict the probability of PFI at 1, 3, and 5 years in the training cohort and the validation cohort. PFI, progression-free interval.
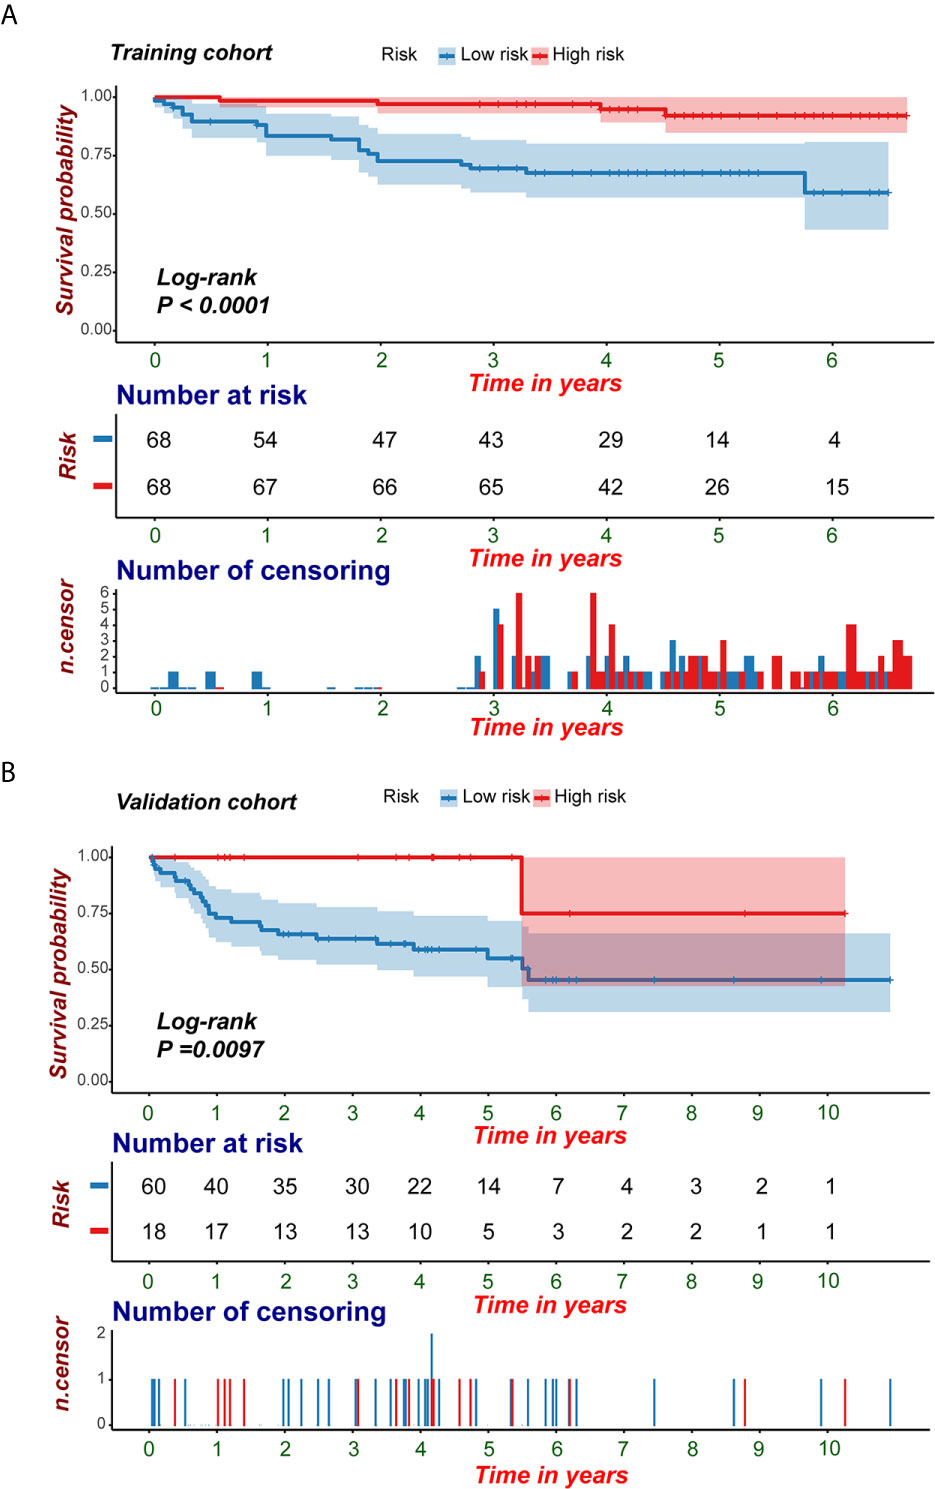
Figure 8 KM survival analyses of the predictive nomogram. (A, B) KM analysis of the predictive nomogram indicated that the high-risk group had a shorter PFI compared with that of the low-risk group. KM, Kaplan-Meier; PFI, progression-free interval.
Molecular Characteristics of the Radiomic Features
WGCNA was applied to seek highly co-expressed gene modules and to investigate the correlation between modules and biological traits. WGCNA networks are superior to correlation networks because genes could be zoned into various modules, probably with similar biological function within each individual module (29). To investigate the underlying molecular function of radiomic features, WGCNA was used to find gene modules of highly correlated radiomic signature risk scores (Figures 9A, B). Eight modules of covariant gene sets were identified to be correlated with radiomic risk score (Figure 10A). Correlation analysis between each module was performed and visualized as a correlation heat map (Figure 10B). Among these eight modules, the most relevant module is the turquoise module (R = 0.46, P = 8.3e-23, Figure 11), which was selected for functional enrichment analysis. The functional analysis showed that genes in the turquoise module were most enriched in T cell activation in BP. For CC, genes were most strongly related to immunological synapse. For MF, genes of modules were mainly enriched in chemokine activity. KEGG analysis of those genes showed their enrichment in T cell receptor signaling pathway. The ten most meaningful pathways of these four enrichment analyses were shown in Figure 12 and Table 4.
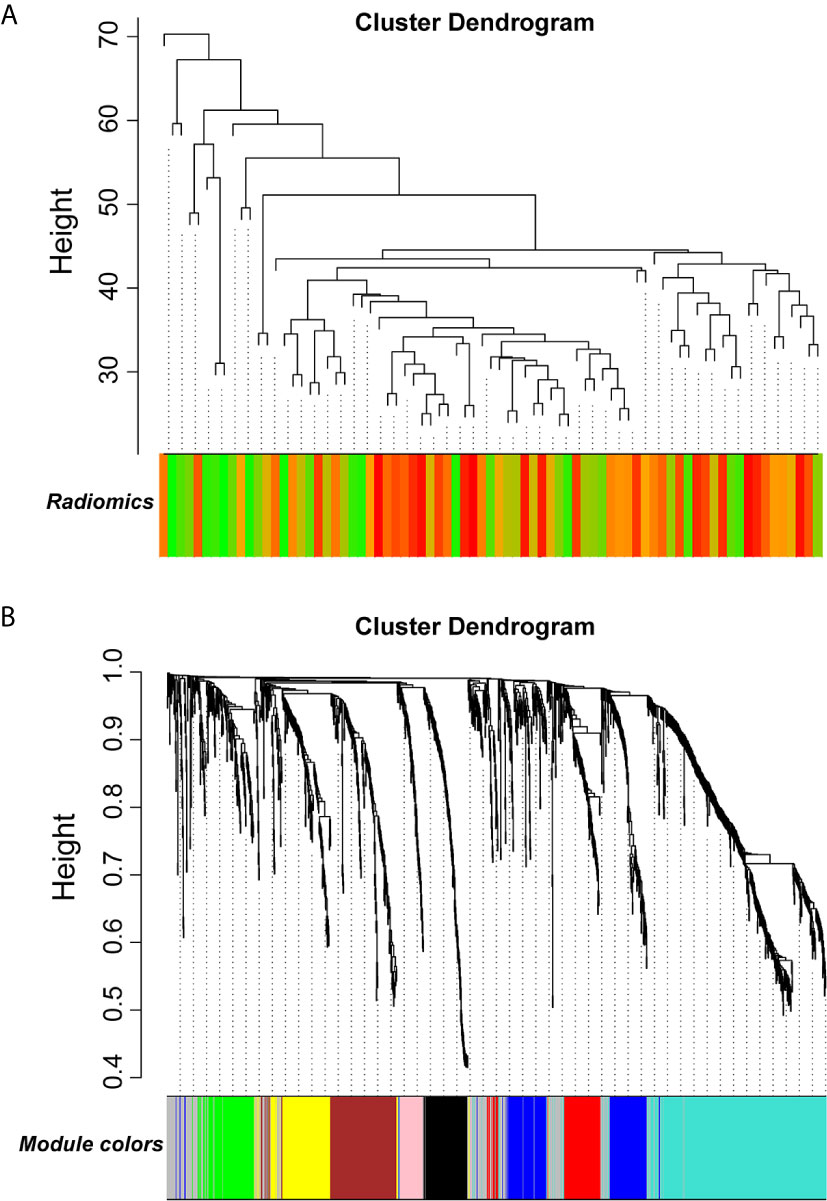
Figure 9 Gene modules associated with radiomic risk scores were determined by WGCNA. (A) The association between diversified samples. (B) Cluster dendrogram and module assignment for modules from network analysis. WGCNA, weighted correlation network analysis.
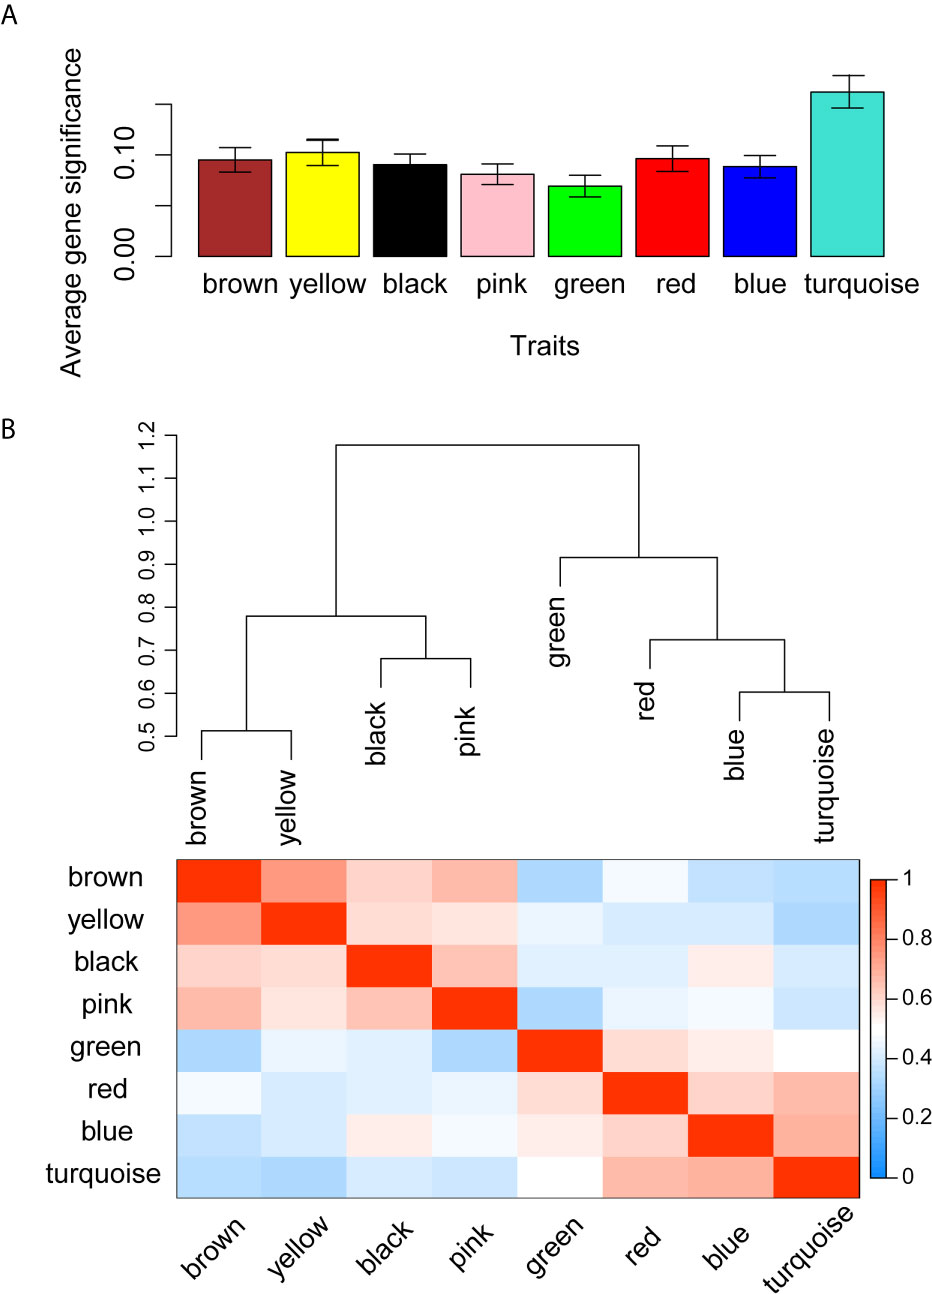
Figure 10 Gene co-expression module identification and correlation analysis. (A) Distribution of average gene significance in the modules related with radiomic risk scores. The y-axis represents the significance values. (B) The heat map of the correlation between gene modules.
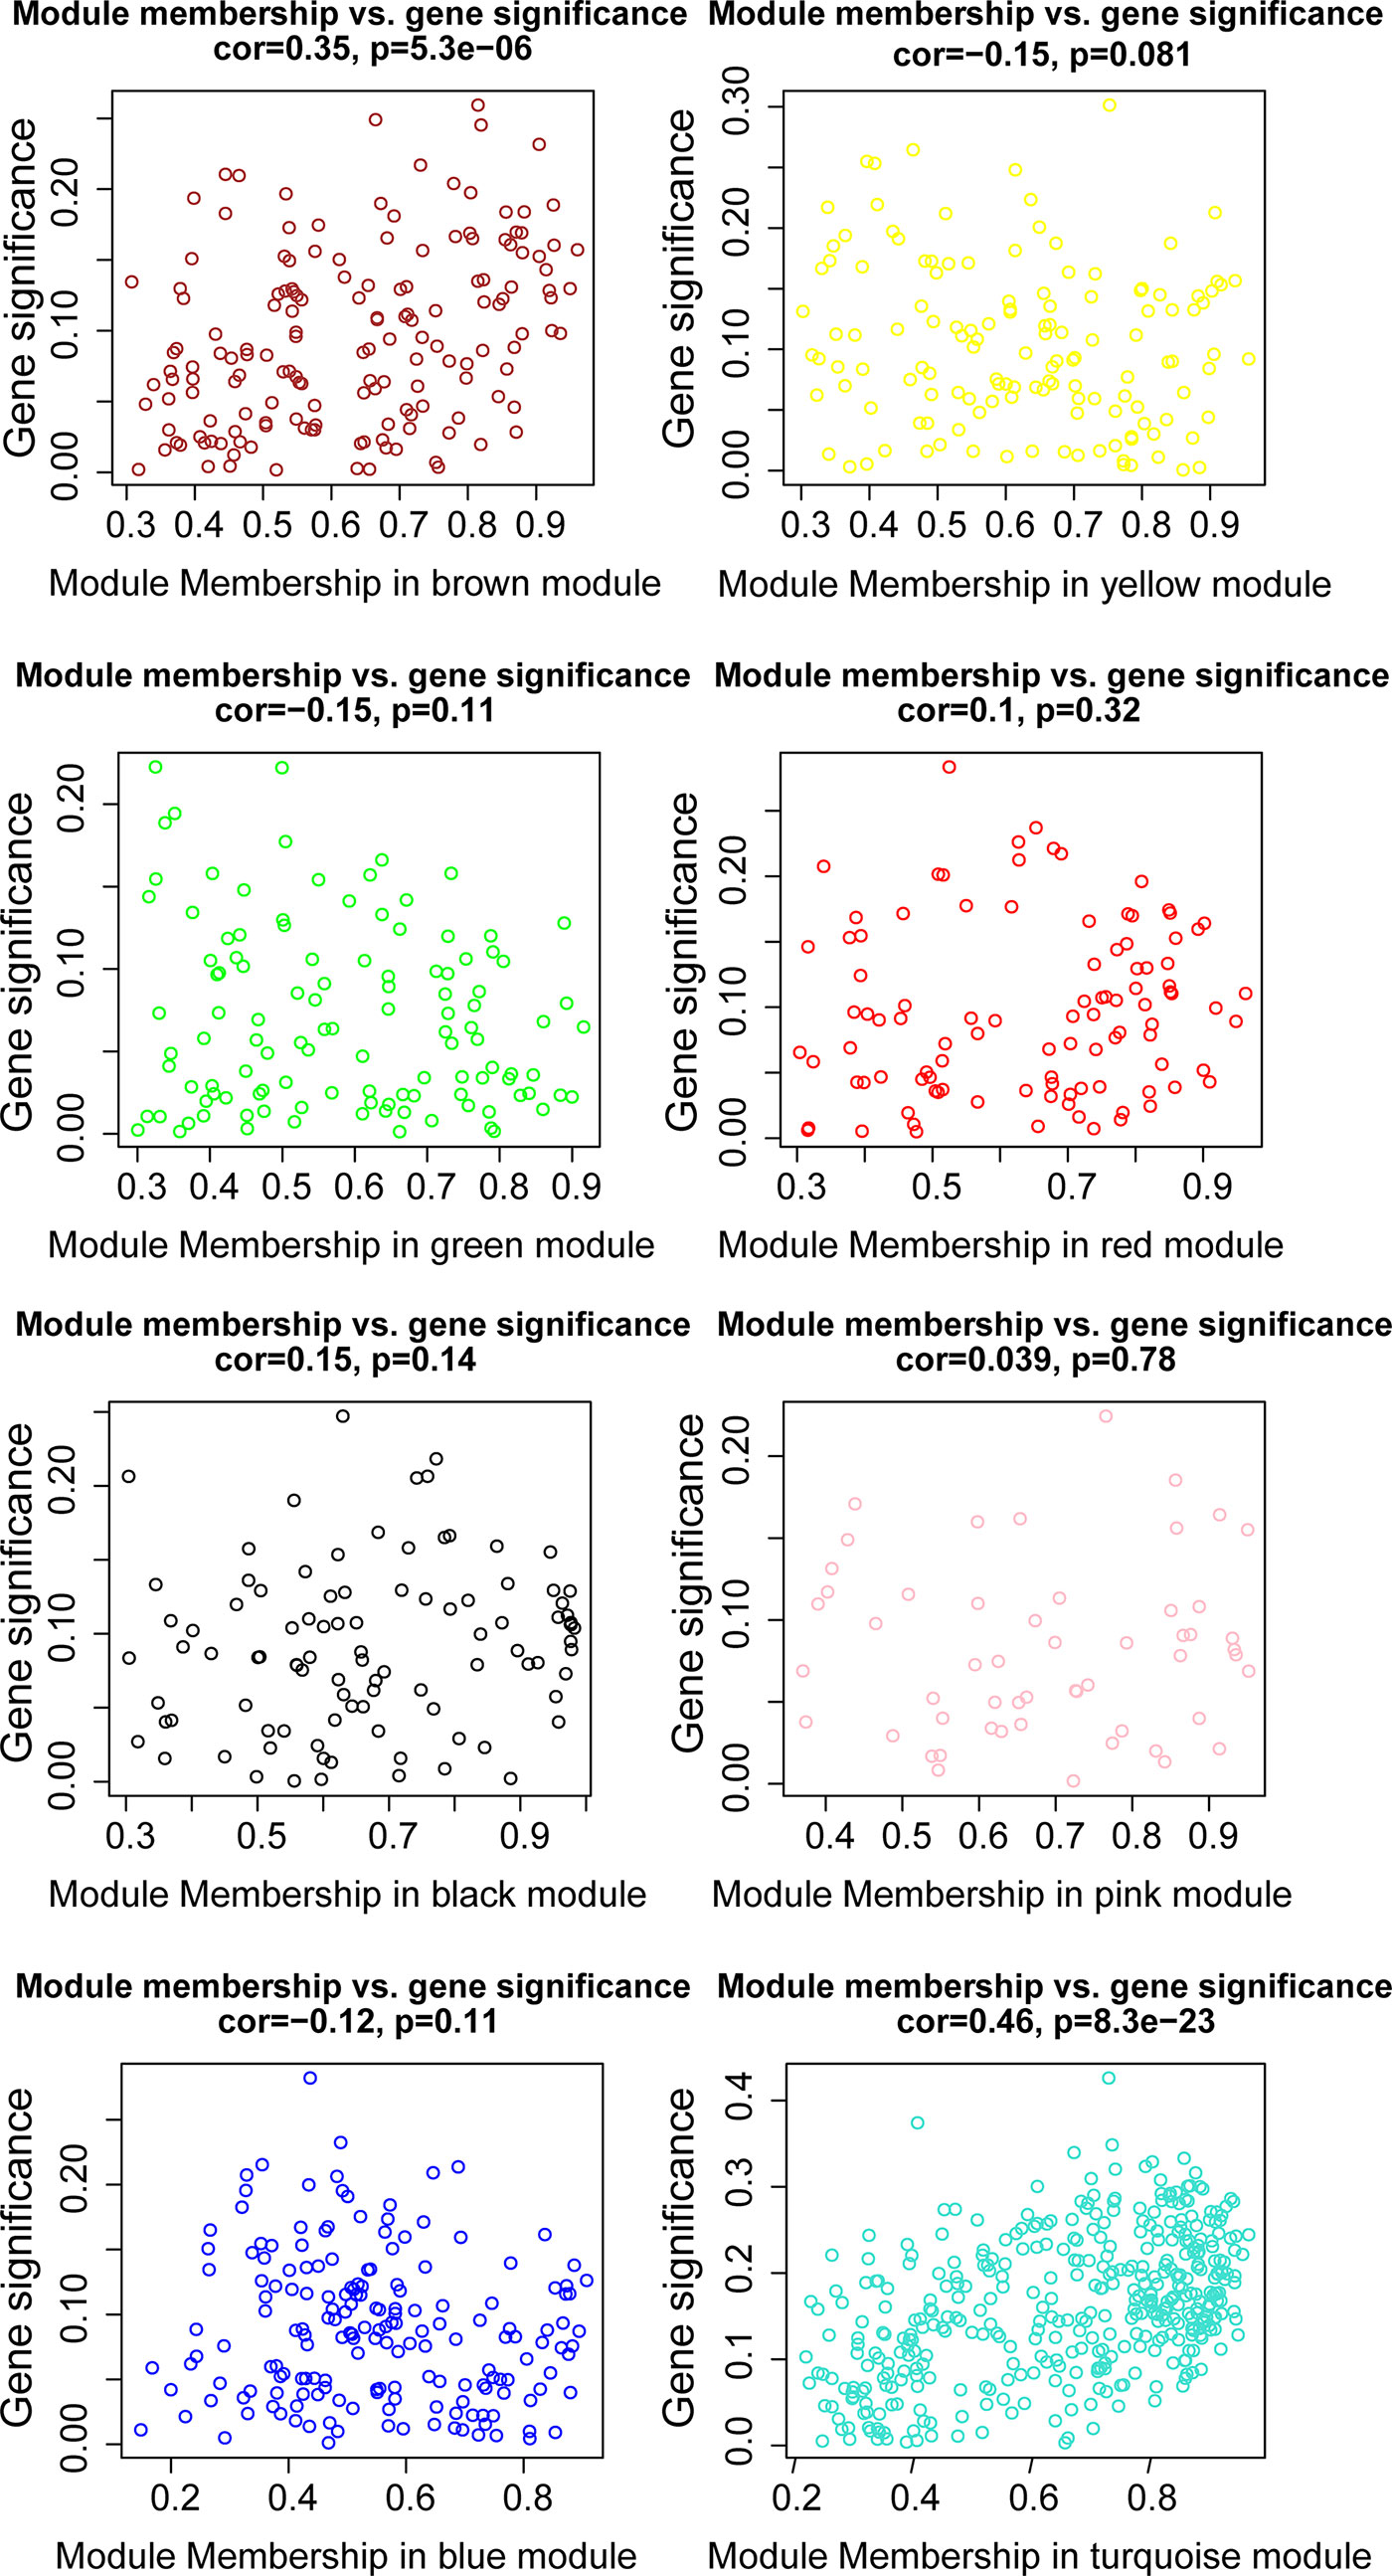
Figure 11 The relationships between the radiomic signature and genes in eight modules. The turquoise modules was highly associated with radiomic risk score and the genes that were selected for further analysis.
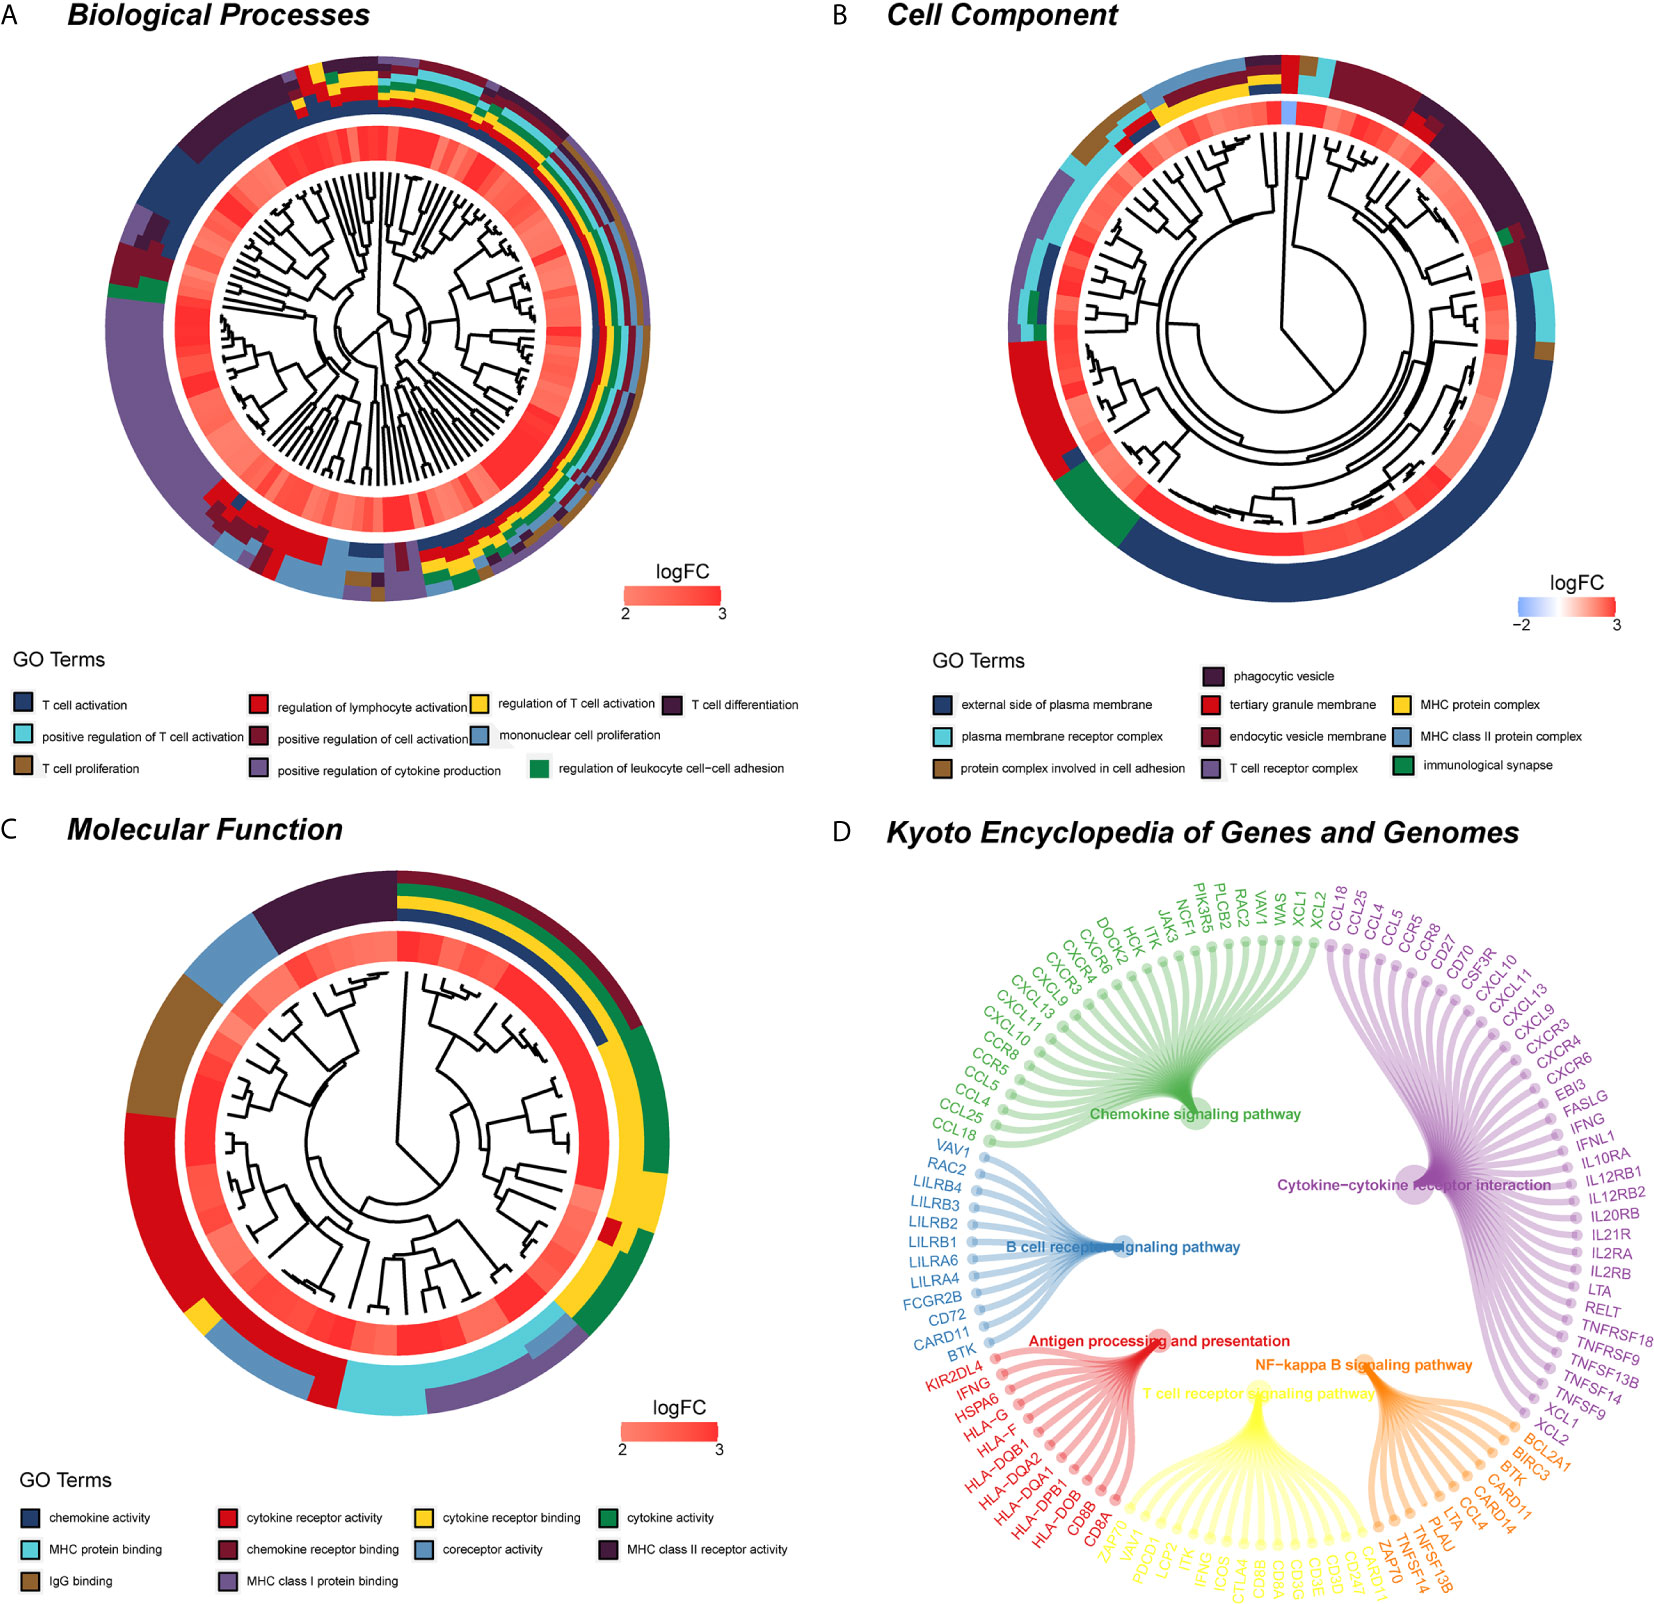
Figure 12 Functional enrichment analysis and signaling pathway analyses of genes associated with radiomic signature. (A) Biological process. (B) Cellular components. (C) Molecular functions. (D) KEGG pathway. KEGG, Kyoto Encyclopedia of Genes and Genomes.
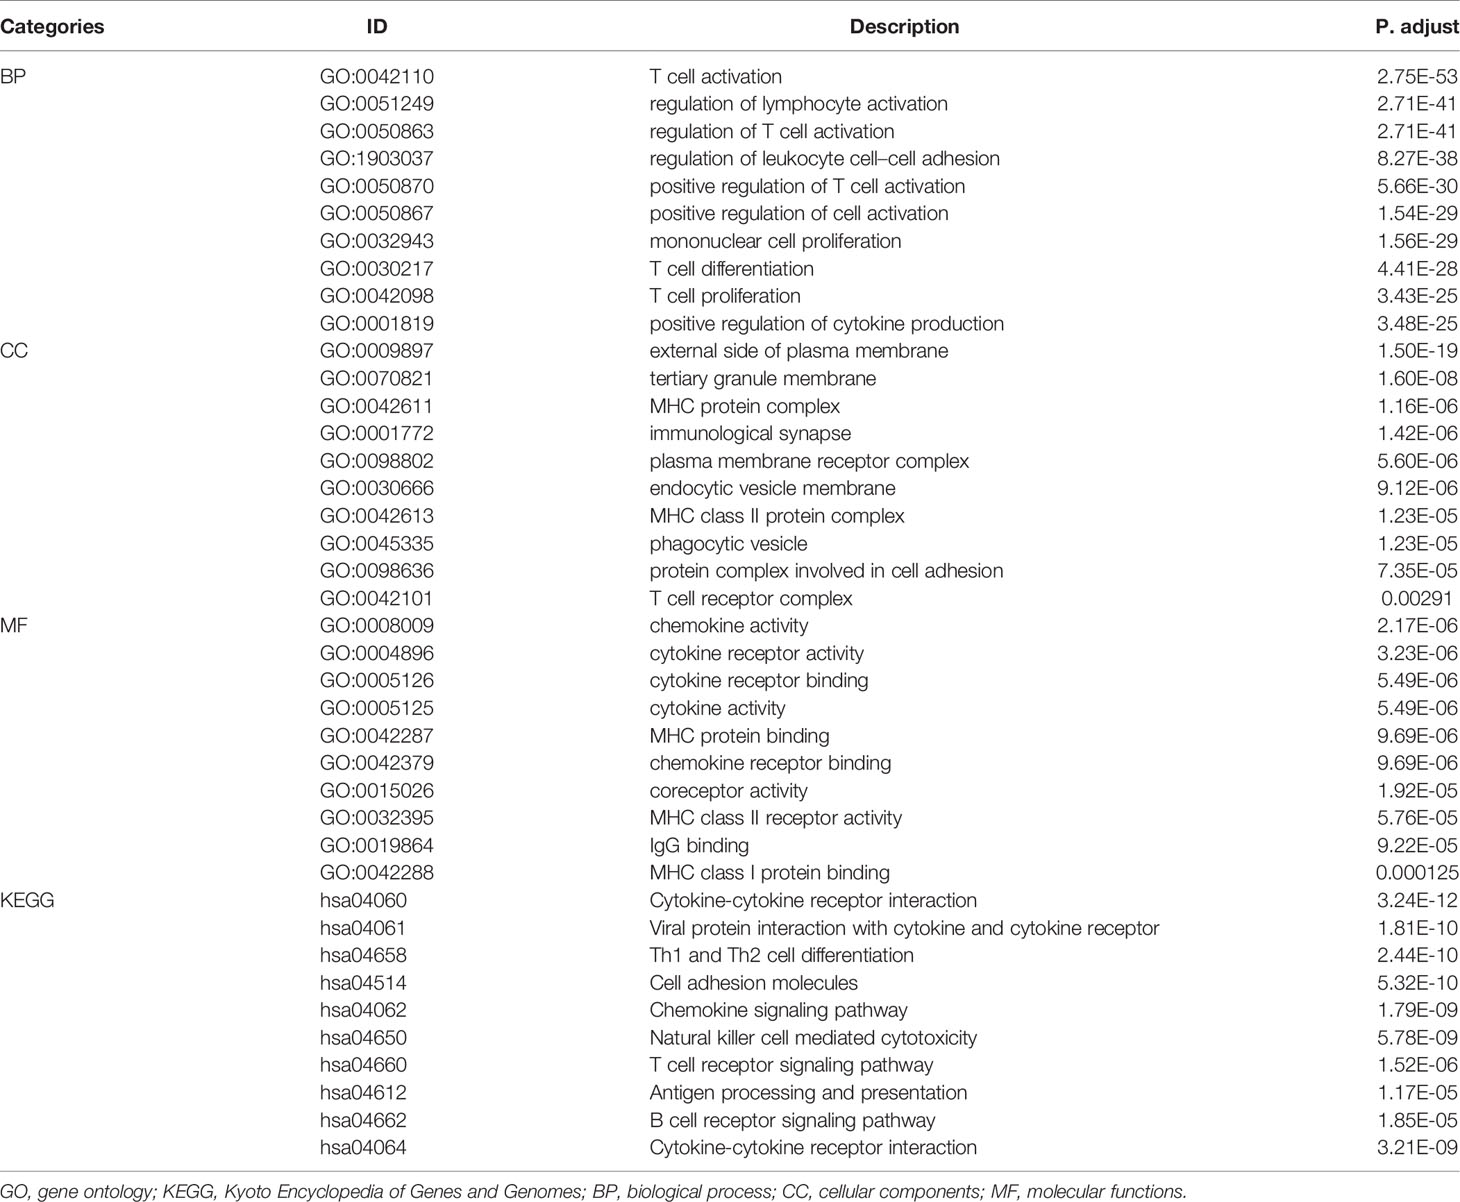
Table 4 GO and KEGG pathway enrichment analysis of radiomic-related genes.
Discussion
As we expected, it has been a focus that a combination of radiomic and clinical markers would help predict survival outcome non-invasively and guide clinical decisions for clinicians. Our study is innovative because this is the first time 3D radiomic signature and clinicopathological characteristics of KIRC patients have been comprehensively integrated with CECT to confirm radiomic indicators for predicting the PFI of patients, and it is the first time a nomogram that can visually display numerical quantization of each factor to predict survival of KIRC patients has been developed. We investigated the correlation between radiomic features and molecular biological characteristics, which might be conducive to a deeper understanding of biological processes and molecular mechanisms in KIRC. The excellent performance of our radiomic signature, clinical signature, and predictive nomogram was observed based on our results, and it suggests that our models can be used to efficiently predict prognosis of KIRC patients and create a robust clinical decision framework for clinicians.
As the most common subtype, which comprised almost 90% of RCC patients in clinic, KIRC has strong potential to metastasize, resulting in the worst prognosis (30). Patients diagnosed with KIRC with lymph node involvement or distant metastasis have low five-year survival rates (31). Additionally, KIRC patients with the same type of tumor might have different prognoses due to the complex internal structure and high heterogeneity within tumors. Complete resection or percutaneous core histopathology biopsy is still a traditional invasive method to assess prognostic indicators (i.e. histological classification, grades, and stages) of KIRC for guiding further treatment (30, 32). An objective and non-invasive approach is needed to evaluate and predict clinical outcome of patients with KIRC. CECT performs a vital part in the diagnosis and prognosis monitoring of renal disease because it is non-invasive and convenient, especially when compared to biopsy, surgery, and immunohistochemistry. Biopsy is not always necessary, because imaging is a highly accurate way of characterizing renal malignancy (33). Radiomics, which has been a popular way to extract characteristics in mass data from each medical image, could provide the characteristics and functions of tumors at the macroscopic even at micromolecular level (7). Recently, several studies of immense value in exploring the biological progress of KIRC via the construction of radiomic models by CT images have been published. Zhan Feng and Burak Kocak B et al., respectively proved that CT radiomic has the potential to predict BRCA1-associated protein 1 (BAP1) mutation status in KIRC patients (34, 35). Payel Ghosh et al. provided a radiomic–genetics pipeline that can extract 3D intra-tumor heterogeneity features from CECT images and explore associations between features and gene mutation status (36). A proposed integrative radiogenomics method could evaluate risk of postoperative metastasis in KIRC with pathological stage T1, which would be beneficial for postsurgical metastasis treatment of KIRC patients (37). Burak Kocak et al. provided a radiomic model to predict histopathologic nuclear grade by using the radiomic features extracted from unenhanced CT texture analysis of KIRC tumors (13). Other researches constructed classification models that preoperatively identified pathological grades of KIRC patients by using machine-learning-based CT radiomic with non-invasion (38–43). Certain studies also showed the significance of CT radiomic in distinguishing KIRC from other renal mass diseases. Ruimeng Yang et al. developed various machine-learning-based classification models to differentiate renal angiomyolipoma and KIRC with favorable performance (44). Heidi Coy et al. illustrated the utility of machine learning in differentiating KIRC from oncocytoma on routine CT images by using their models, which had the ability to accurately predict renal lesion histology on imaging (45). Xiaoli Meng et al. proposed a CT-based radiomic method to distinguish sarcoma and KIRC with good diagnostic performance (46). However, no published studies explore and predict the PFI of KIRC patients via construction of CT radiomic. 3D analysis has shown that 3D structures of targeted lesion is more representative of tumor heterogeneity than two-dimension analysis (47). Our study is the first to predict the PFI of KIRC patients by developing CT radiomic models based on 3D CECT images, and our model achieves good predictive efficacy. In the area of radiomic signature, the radiomic features that were selected as relative factors of prognosis in our study might reflect the degree of tumor progression and assist in the evaluation of postoperative disease progression, treatment effect, and prognosis prediction of KIRC patients. In the area of genomic analysis, identification of specific molecular biological characteristics and regulatory mechanism could not only assist in management and surveillance for KIRC patients but also improve the diagnosis, prognosis, and therapeutic strategy choices for KIRC patients (48–51). In this study, we are the first to provide a predictive nomogram that integrates radiomic and clinicopathological characteristics for predicting the PFI of KIRC patients. The results indicate that our models could be a pivotal tool for prognostic surveillance of KIRC.
The highlight of this study was to explore the relationship between biological information analysis and radiomic features in KIRC, which would provide further information to help us understand the underlying mechanisms and lay the foundation for accurate diagnosis, prognostic judgment, and optimal strategy choice of KIRC for clinicians. Interestingly, the radiomic risk score we performed was closely bound up with various cells of the immune system, especially T cell activation in biological processes. For all we know, at the molecular level, the tumor often involves various cells of the immune-system participation, and it is a complex interplay that has many stages and steps related to the tumor microenvironment. The role of regulatory T cells in cancer has gained concern, and regulatory T cells play a vital role in the progression of KIRC in internal and peripheral tissues (52–54). The high percentages of regulatory T cell activation in peripheral blood or tumorous tissues were correlated to low survival rates in kidney cancer (55–57). Hence, timely and appropriate anticancer treatment, especially immunotherapy, should take the dynamics of the immune response in KIRC patients into account. Several recent studies had investigated the relationship between the cellular immunity-activating system and radiomic signatures in cancer management. For instance, Roger Sun et al. used radiomic to evaluate tumor-infiltrating CD8 cells and response to anti-PD-1 or anti-PD-L1 immunotherapy, which offered a novel method for predicting the immune phenotype and inferring clinical results for cancer patients (6). Xujie Gao et al. proposed a CT radiomic feature to assess tumor-infiltrating T cells and predict prognosis of gastric carcinoma (58). These findings possibly reflected the close relationship among radiomic features and cells of the immunity-activating system. The radiomic features could serve as non-invasive predictors of immuno-oncological characteristics, and they may aid in treatment and outcome management of cancer patients. However, assessment of the crucial relationship between the radiomic score we developed and immune-system cell response, especially T cell activation, needs further exploration and verification in future studies.
There were some inevitable limitations to our study. First of all, the sample size was insufficient. Our study contained only 214 KIRC patients, and the performance and efficiency of the predictive signatures were limited. A prospective cohort study with larger sample sets is recommended. Moreover, our conclusion depended on two center institutions, which might limit the scope of its generalizability. A multi-center prospective study is required to validate this predictive model in a larger population in the future. Additionally, our model only explored the tumor regions with imaging and clinicopathological characteristics. To the best of our knowledge, the peripheral tumor also provided the biological information related to prognosis monitoring. We recommend further exploration of this aspect in the future.
Summarily, our results show satisfactory performance of CECT radiomic and clinical signatures in predicting clinical prognosis. Risk stratification with specific risk scores by radiomic signature has been accurately performed, and the predictive nomogram, which comprehensively integrates radiomic and clinical signature, has the capability to effectively predict outcomes for KIRC patients and to facilitate clinical decision-making for clinicians. Multi-center studies with larger samples are needed to validate our models for clinical practice.
Contribution
Kidney renal clear cell carcinoma (KIRC) has a poor overall survival and prognosis especially in advanced stage due to high invasiveness, high mortality, and insensitivity to chemoradiotherapy. Radiomics, as a rapidly developing field of transforming medical images into available data in radiology, has the capability to investigate efficacy monitoring, prognosis surveillance, and biological behavior assessment via quantitatively extracting features and excavating in-depth characterization of tumor phenotypes beyond imaging interpretation. Radiomics is expected to become an intelligent tool for clinical diagnosis, efficacy evaluation, and prognosis prediction of cancer. Contrast-enhanced computed tomography (CECT), as an imaging exam way, was commonly used in clinic to perform a vital part in the diagnosis and prognosis monitoring of renal disease. The present study aims to explore the relationship between radiomic features, clinical parameters, and progression-free interval (PFI) of KIRC. We further developed and validated a radiomic nomogram that integrates CECT radiomic signature and clinical–pathological parameters for predicting the clinical outcome of KIRC. Meanwhile, we also conducted the molecular functional enrichment analysis to reveal the potential molecular mechanism. In our results, our radiomic signature, clinical signature, and radiomic nomogram were proved robust for prognostic prediction in KIRC patients. To some extent, this study may reveal the underlying molecular mechanism in the development and progression of KIRC and may contribute to clinical management and prognostic evaluation of patients with KIRC.
Data Availability Statement
Publicly available datasets were analyzed in this study. This data can be found here: The Transcriptomes data of KIRC were acquired from The Cancer Genome Atlas (TCGA; https://cancergenome.nih.gov/), and the CECT images of patients with KIRC were downloaded from The Cancer Imaging Archive (TCIA; http://www.cancerimagingarchive.net/).
Ethics Statement
The studies involving human participants were reviewed and approved by the institutional review board and ethics committee of the First Affiliated Hospital of Guangxi Medical University. The ethics committee waived the requirement of written informed consent for participation.
Author Contributions
RG and HQ took part in the conception and design of the study. PL, RW, JingH, YL, JiangH, CM, CL, and DyW collected and sorted the data. RG, HQ, DyW, XL, and XW participated in data analysis and interpretation. GC, HY, and YH supervised and revised the manuscript. All authors contributed to the article and approved the submitted version.
Conflict of Interest
Authors XL and XW were employed by GE, Shanghai.
The remaining author declares that the research was conducted in the absence of any commercial or financial relationships that could be construed as a potential conflict of interest.
Acknowledgments
No funding or financial support was received for this study. The authors would like to thank the TCGA and TCIA databases for the availability of the data.
Supplementary Material
The Supplementary Material for this article can be found online at: https://www.frontiersin.org/articles/10.3389/fonc.2021.613668/full#supplementary-material
References
1. Siegel RL, Miller KD, Jemal A. Cancer Statistics, 2020. CA Cancer J Clin (2020) 70(1):7–30. doi: 10.3322/caac.21590
3. Motzer RJ, Tannir NM, McDermott DF, Aren Frontera O, Melichar B, Choueiri TK, et al. Nivolumab Plus Ipilimumab Versus Sunitinib in Advanced Renal-Cell Carcinoma. N Engl J Med (2018) 378(14):1277–90. doi: 10.1056/NEJMoa1712126
4. Rini BI, Campbell SC, Escudier B. Renal Cell Carcinoma. Lancet (2009) 373(9669):1119–32. doi: 10.1016/S0140-6736(09)60229-4
5. Lambin P, Rios-Velazquez E, Leijenaar R, Carvalho S, van Stiphout RG, Granton P, et al. Radiomics: Extracting More Information From Medical Images Using Advanced Feature Analysis. Eur J Cancer (2012) 48(4):441–6. doi: 10.1016/j.ejca.2011.11.036
6. Sun R, Limkin EJ, Vakalopoulou M, Dercle L, Champiat S, Han SR, et al. A Radiomics Approach to Assess Tumour-Infiltrating CD8 Cells and Response to Anti-PD-1 or Anti-PD-L1 Immunotherapy: An Imaging Biomarker, Retrospective Multicohort Study. Lancet Oncol (2018) 19(9):1180–91. doi: 10.1016/S1470-2045(18)30413-3
7. Gillies RJ, Kinahan PE, Hricak H. Radiomics: Images are More Than Pictures, They Are Data. Radiology (2016) 278(2):563–77. doi: 10.1148/radiol.2015151169
8. Lubner MG. Radiomics and Artificial Intelligence for Renal Mass Characterization. Radiol Clin North Am (2020) 58(5):995–1008. doi: 10.1016/j.rcl.2020.06.001
9. Hodgdon T, McInnes MD, Schieda N, Flood TA, Lamb L, Thornhill RE. Can Quantitative Ct Texture Analysis be Used to Differentiate Fat-Poor Renal Angiomyolipoma From Renal Cell Carcinoma on Unenhanced Ct Images? Radiology (2015) 276(3):787–96. doi: 10.1148/radiol.2015142215
10. Varghese BA, Chen F, Hwang DH, Cen SY, Desai B, Gill IS, et al. Differentiation of Predominantly Solid Enhancing Lipid-Poor Renal Cell Masses by Use of Contrast-Enhanced Ct: Evaluating the Role of Texture in Tumor Subtyping. AJR Am J Roentgenol (2018) 211(6):W288–96. doi: 10.2214/AJR.18.19551
11. Bektas CT, Kocak B, Yardimci AH, Turkcanoglu MH, Yucetas U, Koca SB, et al. Clear Cell Renal Cell Carcinoma: Machine Learning-Based Quantitative Computed Tomography Texture Analysis for Prediction of Fuhrman Nuclear Grade. Eur Radiol (2019) 29(3):1153–63. doi: 10.1007/s00330-018-5698-2
12. Han D, Yu Y, Yu N, Dang S, Wu H, Jialiang R, et al. Prediction Models for Clear Cell Renal Cell Carcinoma ISUP/WHO Grade: Comparison Between CT Radiomics and Conventional Contrast-Enhanced CT. Br J Radiol (2020) 93(1114):20200131. doi: 10.1259/bjr.20200131
13. Kocak B, Durmaz ES, Ates E, Kaya OK, Kilickesmez O. Unenhanced CT Texture Analysis of Clear Cell Renal Cell Carcinomas: A Machine Learning-Based Study for Predicting Histopathologic Nuclear Grade. AJR Am J Roentgenol (2019), W1–8. doi: 10.2214/AJR.18.20742
14. Haider MA, Vosough A, Khalvati F, Kiss A, Ganeshan B, Bjarnason GA. CT Texture Analysis: A Potential Tool for Prediction of Survival in Patients With Metastatic Clear Cell Carcinoma Treated With Sunitinib. Cancer Imaging (2017) 17(1):4. doi: 10.1186/s40644-017-0106-8
15. Goh V, Ganeshan B, Nathan P, Juttla JK, Vinayan A, Miles KA. Assessment of Response to Tyrosine Kinase Inhibitors in Metastatic Renal Cell Cancer: CT Texture as a Predictive Biomarker. Radiology (2011) 261(1):165–71. doi: 10.1148/radiol.11110264
16. Cohan RH, Sherman LS, Korobkin M, Bass JC, Francis IR. Renal Masses: Assessment of Corticomedullary-Phase and Nephrographic-Phase CT Scans. Radiology (1995) 196(2):445–51. doi: 10.1148/radiology.196.2.7617859
17. Kocak B, Ates E, Durmaz ES, Ulusan MB, Kilickesmez O. Influence of Segmentation Margin on Machine Learning-Based High-Dimensional Quantitative CT Texture Analysis: A Reproducibility Study on Renal Clear Cell Carcinomas. Eur Radiol (2019) 29(9):4765–75. doi: 10.1007/s00330-019-6003-8
18. Yushkevich PA, Yang G, Gerig G. Itk-Snap: An Interactive Tool for Semi-Automatic Segmentation of Multi-Modality Biomedical Images. Annu Int Conf IEEE Eng Med Biol Soc (2016) 2016:3342–5. doi: 10.1109/EMBC.2016.7591443
19. Wang W, Wu SS, Zhang JC, Xian MF, Huang H, Li W, et al. Preoperative Pathological Grading of Hepatocellular Carcinoma Using Ultrasomics of Contrast-Enhanced Ultrasound. Acad Radiol (2020). doi: 10.1016/j.acra.2020.05.033
20. Li W, Huang Y, Zhuang BW, Liu GJ, Hu HT, Li X, et al. Multiparametric Ultrasomics of Significant Liver Fibrosis: A Machine Learning-Based Analysis. Eur Radiol (2019) 29(3):1496–506. doi: 10.1007/s00330-018-5680-z
21. Li W, Lv XZ, Zheng X, Ruan SM, Hu HT, Chen LD, et al. Machine Learning-Based Ultrasomics Improves the Diagnostic Performance in Differentiating Focal Nodular Hyperplasia and Atypical Hepatocellular Carcinoma. Front Oncol (2021) 11:544979. doi: 10.3389/fonc.2021.544979
22. Liu J, Lichtenberg T, Hoadley KA, Poisson LM, Lazar AJ, Cherniack AD, et al. An Integrated Tcga Pan-Cancer Clinical Data Resource to Drive High-Quality Survival Outcome Analytics. Cell (2018) 173(2):400–16.e11. doi: 10.1016/j.cell.2018.02.052
23. Lin P, Wen DY, Chen L, Li X, Li SH, Yan HB, et al. A Radiogenomics Signature for Predicting the Clinical Outcome of Bladder Urothelial Carcinoma. Eur Radiol (2020) 30(1):547–57. doi: 10.1007/s00330-019-06371-w
24. Tibshirani R. The Lasso Method for Variable Selection in the Cox Model. Stat Med (1997) 16(4):385–95. doi: 10.1002/(sici)1097-0258(19970228)16:4<385::aid-sim380>3.0.co;2-3
25. Sauerbrei W, Royston P, Binder H. Selection of Important Variables and Determination of Functional Form for Continuous Predictors in Multivariable Model Building. Stat Med (2007) 26(30):5512–28. doi: 10.1002/sim.3148
26. Heagerty PJ, Zheng Y. Survival Model Predictive Accuracy and ROC Curves. Biometrics (2005) 61(1):92–105. doi: 10.1111/j.0006-341X.2005.030814.x
27. Schroder MS, Culhane AC, Quackenbush J, Haibe-Kains B. Survcomp: An R/Bioconductor Package for Performance Assessment and Comparison of Survival Models. Bioinformatics (2011) 27(22):3206–8. doi: 10.1093/bioinformatics/btr511
28. Langfelder P, Horvath S. WGCNA: An R Package for Weighted Correlation Network Analysis. BMC Bioinf (2008) 9:559. doi: 10.1186/1471-2105-9-559
29. Bryan JM, Fufa TD, Bharti K, Brooks BP, Hufnagel RB, McGaughey DM. Identifying Core Biological Processes Distinguishing Human Eye Tissues With Precise Systems-Level Gene Expression Analyses and Weighted Correlation Networks. Hum Mol Genet (2018) 27(19):3325–39. doi: 10.1093/hmg/ddy239
30. Sun M, Shariat SF, Cheng C, Ficarra V, Murai M, Oudard S, et al. Prognostic Factors and Predictive Models in Renal Cell Carcinoma: A Contemporary Review. Eur Urol (2011) 60(4):644–61. doi: 10.1016/j.eururo.2011.06.041
31. Matsuda T, Hori M. Five-Year Relative Survival Rate of Kidney and Renal Pelvis Cancer in the USA, Europe and Japan. Jpn J Clin Oncol (2015) 45(1):136. doi: 10.1093/jjco/hyu216
32. Silverman SG, Israel GM, Trinh QD. Incompletely Characterized Incidental Renal Masses: Emerging Data Support Conservative Management. Radiology (2015) 275(1):28–42. doi: 10.1148/radiol.14141144
33. Zhang H, Li Q, Li S, Ma J, Huang J. A Radiomic Approach to Differential Diagnosis of Renal Cell Carcinoma in Patients With Hydronephrosis and Renal Calculi. Nan Fang Yi Ke Da Xue Xue Bao (2019) 39(5):547–53. doi: 10.12122/j.issn.1673-4254.2019.05.08
34. Feng Z, Zhang L, Qi Z, Shen Q, Hu Z, Chen F. Identifying BAP1 Mutations in Clear-Cell Renal Cell Carcinoma by CT Radiomics: Preliminary Findings. Front Oncol (2020) 10:279. doi: 10.3389/fonc.2020.00279
35. Kocak B, Durmaz ES, Kaya OK, Kilickesmez O. Machine Learning-Based Unenhanced CT Texture Analysis for Predicting BAP1 Mutation Status of Clear Cell Renal Cell Carcinomas. Acta Radiol (2020) 61(6):856–64. doi: 10.1177/0284185119881742
36. Ghosh P, Tamboli P, Vikram R, Rao A. Imaging-Genomic Pipeline for Identifying Gene Mutations Using Three-Dimensional Intra-Tumor Heterogeneity Features. J Med Imaging (Bellingham) (2015) 2(4):41009. doi: 10.1117/1.JMI.2.4.041009
37. Lee HW, Cho HH, Joung JG, Jeon HG, Jeong BC, Jeon SS, et al. Integrative Radiogenomics Approach for Risk Assessment of Post-Operative Metastasis in Pathological T1 Renal Cell Carcinoma: A Pilot Retrospective Cohort Study. Cancers (Basel) (2020) 12(4):866. doi: 10.3390/cancers12040866
38. Sun X, Liu L, Xu K, Li W, Huo Z, Liu H, et al. Prediction of ISUP Grading of Clear Cell Renal Cell Carcinoma Using Support Vector Machine Model Based on CT Images. Med (Baltimore) (2019) 98(14):e15022. doi: 10.1097/MD.0000000000015022
39. Shu J, Tang Y, Cui J, Yang R, Meng X, Cai Z, et al. Clear Cell Renal Cell Carcinoma: CT-based Radiomics Features for the Prediction of Fuhrman Grade. Eur J Radiol (2018) 109:8–12. doi: 10.1016/j.ejrad.2018.10.005
40. Shu J, Wen D, Xi Y, Xia Y, Cai Z, Xu W, et al. Clear Cell Renal Cell Carcinoma: Machine Learning-Based Computed Tomography Radiomics Analysis for the Prediction of WHO/ISUP Grade. Eur J Radiol (2019) 121:108738. doi: 10.1016/j.ejrad.2019.108738
41. Cui E, Li Z, Ma C, Li Q, Lei Y, Lan Y, et al. Predicting the ISUP Grade of Clear Cell Renal Cell Carcinoma With Multiparametric MR and Multiphase CT Radiomics. Eur Radiol (2020) 30(5):2912–21. doi: 10.1007/s00330-019-06601-1
42. Nazari M, Shiri I, Hajianfar G, Oveisi N, Abdollahi H, Deevband MR, et al. Noninvasive Fuhrman Grading of Clear Cell Renal Cell Carcinoma Using Computed Tomography Radiomic Features and Machine Learning. Radiol Med (2020) 125(8):754–62. doi: 10.1007/s11547-020-01169-z
43. Ding J, Xing Z, Jiang Z, Chen J, Pan L, Qiu J, et al. CT-Based Radiomic Model Predicts High Grade of Clear Cell Renal Cell Carcinoma. Eur J Radiol (2018) 103:51–6. doi: 10.1016/j.ejrad.2018.04.013
44. Yang R, Wu J, Sun L, Lai S, Xu Y, Liu X, et al. Radiomics of Small Renal Masses on Multiphasic CT: Accuracy of Machine Learning-Based Classification Models for the Differentiation of Renal Cell Carcinoma and Angiomyolipoma Without Visible Fat. Eur Radiol (2020) 30(2):1254–63. doi: 10.1007/s00330-019-06384-5
45. Coy H, Hsieh K, Wu W, Nagarajan MB, Young JR, Douek ML, et al. Deep Learning and Radiomics: The Utility of Google Tensorflow Inception in Classifying Clear Cell Renal Cell Carcinoma and Oncocytoma on Multiphasic CT. Abdom Radiol (NY) (2019) 44(6):2009–20. doi: 10.1007/s00261-019-01929-0
46. Meng X, Shu J, Xia Y, Yang R. A CT-Based Radiomics Approach for the Differential Diagnosis of Sarcomatoid and Clear Cell Renal Cell Carcinoma. BioMed Res Int (2020) 2020:7103647. doi: 10.1155/2020/7103647
47. Ng F, Kozarski R, Ganeshan B, Goh V. Assessment of Tumor Heterogeneity by CT Texture Analysis: can the Largest Cross-Sectional Area be Used as an Alternative to Whole Tumor Analysis? Eur J Radiol (2013) 82(2):342–8. doi: 10.1016/j.ejrad.2012.10.023
48. Marigliano C, Badia S, Bellini D, Rengo M, Caruso D, Tito C, et al. Radiogenomics in Clear Cell Renal Cell Carcinoma: Correlations Between Advanced CT Imaging (Texture Analysis) and MicroRNAs Expression. Technol Cancer Res Treat (2019) 18:1533033819878458. doi: 10.1177/1533033819878458
49. Senbabaoglu Y, Gejman RS, Winer AG, Liu M, Van Allen EM, de Velasco G, et al. Tumor Immune Microenvironment Characterization in Clear Cell Renal Cell Carcinoma Identifies Prognostic and Immunotherapeutically Relevant Messenger RNA Signatures. Genome Biol (2016) 17(1):231. doi: 10.1186/s13059-016-1092-z
50. Wang Y, Chen L, Wang G, Cheng S, Qian K, Liu X, et al. Fifteen Hub Genes Associated With Progression and Prognosis of Clear Cell Renal Cell Carcinoma Identified by Coexpression Analysis. J Cell Physiol (2019) 234(7):10225–37. doi: 10.1002/jcp.27692
51. Cheng G, Li M, Ma X, Nan F, Zhang L, Yan Z, et al. Systematic Analysis of Microrna Biomarkers for Diagnosis, Prognosis, and Therapy in Patients With Clear Cell Renal Cell Carcinoma. Front Oncol (2020) 10:543817. doi: 10.3389/fonc.2020.543817
52. Minarik I, Lastovicka J, Budinsky V, Kayserova J, Spisek R, Jarolim L, et al. Regulatory T Cells, Dendritic Cells and Neutrophils in Patients With Renal Cell Carcinoma. Immunol Lett (2013) 152(2):144–50. doi: 10.1016/j.imlet.2013.05.010
53. Lionello I, Mangia P, Gattinoni L, Pende D, Cippone A, Sensi M, et al. Cd8(+) T Lymphocytes Isolated From Renal Cancer Patients Recognize Tumour Cells Through An HLA- and TCR/CD3-Independent Pathway. Cancer Immunol Immunother (2007) 56(7):1065–76. doi: 10.1007/s00262-006-0268-x
54. Strizova Z, Taborska P, Stakheev D, Partlova S, Havlova K, Vesely S, et al. NK and T Cells With a Cytotoxic/Migratory Phenotype Accumulate in Peritumoral Tissue of Patients With Clear Cell Renal Carcinoma. Urol Oncol (2019) 37(7):503–9. doi: 10.1016/j.urolonc.2019.03.014
55. Liotta F, Gacci M, Frosali F, Querci V, Vittori G, Lapini A, et al. Frequency of Regulatory T Cells in Peripheral Blood and in Tumour-Infiltrating Lymphocytes Correlates With Poor Prognosis in Renal Cell Carcinoma. BJU Int (2011) 107(9):1500–6. doi: 10.1111/j.1464-410X.2010.09555.x
56. Jeron A, Pfoertner S, Bruder D, Geffers R, Hammerer P, Hofmann R, et al. Frequency and Gene Expression Profile of Regulatory T Cells in Renal Cell Carcinoma. Tumour Biol (2009) 30(3):160–70. doi: 10.1159/000228909
57. Griffiths RW, Elkord E, Gilham DE, Ramani V, Clarke N, Stern PL, et al. Frequency of Regulatory T Cells in Renal Cell Carcinoma Patients and Investigation of Correlation With Survival. Cancer Immunol Immunother (2007) 56(11):1743–53. doi: 10.1007/s00262-007-0318-z
Keywords: contrast-enhanced computed tomography, artificial intelligence, kidney renal clear cell carcinoma, prognosis, weighted correlation network analysis
Citation: Gao R, Qin H, Lin P, Ma C, Li C, Wen R, Huang J, Wan D, Wen D, Liang Y, Huang J, Li X, Wang X, Chen G, He Y and Yang H (2021) Development and Validation of a Radiomic Nomogram for Predicting the Prognosis of Kidney Renal Clear Cell Carcinoma. Front. Oncol. 11:613668. doi: 10.3389/fonc.2021.613668
Received: 03 October 2020; Accepted: 01 June 2021;
Published: 06 July 2021.
Edited by:
Bo Gao, Affiliated Hospital of Guizhou Medical University, ChinaReviewed by:
Qijun Shen, Zhejiang University School of Medicine, ChinaRongpin Wang, Guizhou Provincial People’s Hospital, China
Copyright © 2021 Gao, Qin, Lin, Ma, Li, Wen, Huang, Wan, Wen, Liang, Huang, Li, Wang, Chen, He and Yang. This is an open-access article distributed under the terms of the Creative Commons Attribution License (CC BY). The use, distribution or reproduction in other forums is permitted, provided the original author(s) and the copyright owner(s) are credited and that the original publication in this journal is cited, in accordance with accepted academic practice. No use, distribution or reproduction is permitted which does not comply with these terms.
*Correspondence: Yun He, MjI4Mzg4MDcyQHFxLmNvbQ==; Hong Yang, eWFuZ2hvbmdAZ3htdS5lZHUuY24=
†These authors have contributed equally to this work and share first authorship