 Guoqiang Xu1†‡
 Mei Yang2‡
 Qiaoli Wang1†‡Liufang Zhao3‡
 Sijin Zhu1‡Lixiu Zhu1
 Tianrui Xu1
 Ruixue Cao1Cheng Li1Qiuyan Liu4
 Wei Xiong1*Yan Su5*Jian Dong6*
- 1Department of Radiotherapy, Yunnan Cancer Hospital, the Third Affiliated Hospital of Kunming Medical University, Kunming, China
- 2Cadre Medical Department, Yunnan Cancer Hospital, the Third Affiliated Hospital of Kunming Medical University, Kunming, China
- 3The First Department of Head and Neck Surgery, Yunnan Cancer Hospital, the Third Affiliated Hospital of Kunming Medical University, Kunming, China
- 4Department of Oncology, Affiliated Hospital of Panzhihua University, Panzhihua Integrated Traditional Chinese and Western Medicine Hospital, Panzhihua, China
- 5Department of Graduate Student Management, Yunnan Cancer Hospital, the Third Affiliated Hospital of Kunming Medical University, Kunming, China
- 6Department of Medical Oncology, Yunnan Cancer Hospital, the Third Affiliated Hospital of Kunming Medical University, Kunming, China
Introduction: Colorectal cancer (CRC) is the most common gastrointestinal cancer and has a low overall survival rate. Tumor–node–metastasis staging alone is insufficient to predict patient prognosis. Autophagy and long noncoding RNAs play important roles in regulating the biological behavior of CRC. Therefore, establishing an autophagy-related lncRNA (ARlncRNA)-based bioinformatics model is important for predicting survival and facilitating clinical treatment.
Methods: CRC data were retrieved from The Cancer Genome Atlas. The database was randomly divided into train set and validation set; then, univariate and multivariate Cox regression analyses were performed to screen prognosis-related ARlncRNAs for prediction model construction. Interactive network and Sankey diagrams of ARlncRNAs and messenger RNAs were plotted. We analyzed the survival rate of high- and low-risk patients and plotted survival curves and determined whether the risk score was an independent predictor of CRC. Receiver operating characteristic curves were used to evaluate model sensitivity and specificity. Then, the expression level of lncRNA was detected by quantitative real-time polymerase chain reaction, and the location of lncRNA was observed by fluorescence in situ hybridization. Additionally, the protein expression was detected by Western blot.
Results: A prognostic prediction model of CRC was built based on nine ARlncRNAs (NKILA, LINC00174, AC008760.1, LINC02041, PCAT6, AC156455.1, LINC01503, LINC00957, and CD27-AS1). The 5-year overall survival rate was significantly lower in the high-risk group than in the low-risk group among train set, validation set, and all patients (all p < 0.001). The model had high sensitivity and accuracy in predicting the 1-year overall survival rate (area under the curve = 0.717). The prediction model risk score was an independent predictor of CRC. LINC00174 and NKILA were expressed in the nucleus and cytoplasm of normal colonic epithelial cell line NCM460 and colorectal cancer cell lines HT29. Additionally, LINC00174 and NKILA were overexpressed in HT29 compared with NCM460. After autophagy activation, LINCC00174 expression was significantly downregulated both in NCM460 and HT29, while NKILA expression was significantly increased.
Conclusion: The new ARlncRNA-based model predicts CRC patient prognosis and provides new research ideas regarding potential mechanisms regulating the biological behavior of CRC. ARlncRNAs may play important roles in personalized cancer treatment.
1 Introduction
Colorectal cancer (CRC) is a common gastrointestinal cancer. According to the 2020 global cancer statistics, more than 1.9 million new cases of CRC were diagnosed, and 935,000 CRC patients died. CRC ranks third in morbidity and second in mortality for all tumors (1). With advancements in comprehensive therapy, including surgery, chemotherapy, biological immunotherapy, and radiotherapy, CRC outcomes are improving, but the overall survival rate is still low (2). Historically, the tumor–node–metastasis (TNM) staging system has been widely used to predict the prognosis of CRC patients. Generally, the prognosis is better with earlier staging. In recent years, however, some studies have shown that the combination of biomarkers and TNM staging is more accurate in predicting the prognosis of CRC patients (3, 4).
Long noncoding RNAs (lncRNAs) are defined as RNAs that contain more than 200 nucleotides and do not encode a protein. They play important roles in transcription, translation, and cell cycle regulation (5). A growing body of evidence indicates that lncRNAs play important roles in CRC occurrence, development, metastasis, and drug resistance (6–9). Moreover, several lncRNA-based prediction models have been built to predict the survival of patients with CRC (10–12), indicating that lncRNAs can serve as CRC biomarkers.
Autophagy is a process of intracellular degradation that helps maintain homeostasis by promoting nutrient recycling during nutrient deficiency, hypoxia, DNA damage, and infection (13, 14). It plays an important role in tumor development, maintenance, and progression (15). Studies have shown that autophagy is a double-edged sword, as it promotes CRC invasion and metastasis and CRC cell apoptosis (16, 17). Current studies show that tumor autophagy can predict patient prognosis (18, 19).
Overall, autophagy and lncRNAs both play important biological roles in CRC. To date, few studies have been conducted that investigate the role of autophagy-related lncRNAs (ARlncRNAs) in the survival of cancer patients. One study showed that the prognosis of patients with lung adenocarcinoma is related to the abnormal expression of 13 ARlncRNAs (20). We hypothesize that ARlncRNAs are closely related to the survival of CRC patients and that ARlncRNAs are potential biomarkers of and treatment targets for CRC. In this study, using bioinformatics technology, we identified and screened ARlncRNAs related to the prognosis of CRC patients and built a novel model that can be used to predict prognosis. This model is of great significance in predicting the prognosis of CRC patients in clinical practice.
2 Methods
2.1 Data Collection
We downloaded transcriptome and clinical data of CRC samples from The Cancer Genome Atlas (TCGA: https://portal.gdc.cancer.gov/repository) database. RNAs were annotated via human gene annotation files (GRCh38.p12) downloaded from the Ensembl database (https://asia.ensembl.org/index.html). Next, we downloaded human autophagy-related gene profiles from the Human Autophagy database (HADb: http://www.autophagy.lu/clustering/index.html).
2.2 Data Analysis
We employed Strawberry Perl software (v5.30.2.1) to compile the clinical data of CRC patients. After deleting “unknown” and incomplete survival data (“NULL”), we recorded the survival time, survival status, age at diagnosis, sex, clinical stage, T stage, M stage, and N stage of each patient. We used the Strawberry Perl program to organize the transcriptome data of CRC samples into an expression matrix and then used GRCh38.p12 to annotate the genes. Next, we obtained separate messenger RNA (mRNA) and lncRNA expression matrices for CRC samples and used the “limma” package in R (v4.0.0) for coexpression analysis of the mRNA expression matrix and autophagy-related gene profile to obtain the expression matrix for autophagy-related genes. Then, we performed coexpression analysis of the autophagy-related expression matrix and lncRNA expression matrix (selection criterion: absolute correlation coefficient > 0.3, p < 0.001) to obtain the lncRNA matrix coexpressed with autophagy-related genes, that is, ARlncRNAs. We utilized Strawberry Perl software to merge the clinical data of CRC patients and the information from the ARlncRNA expression matrix to obtain a matrix of the expression levels of ARlncRNAs and survival status. The flow chart of overall procedures is shown in Figure 1.
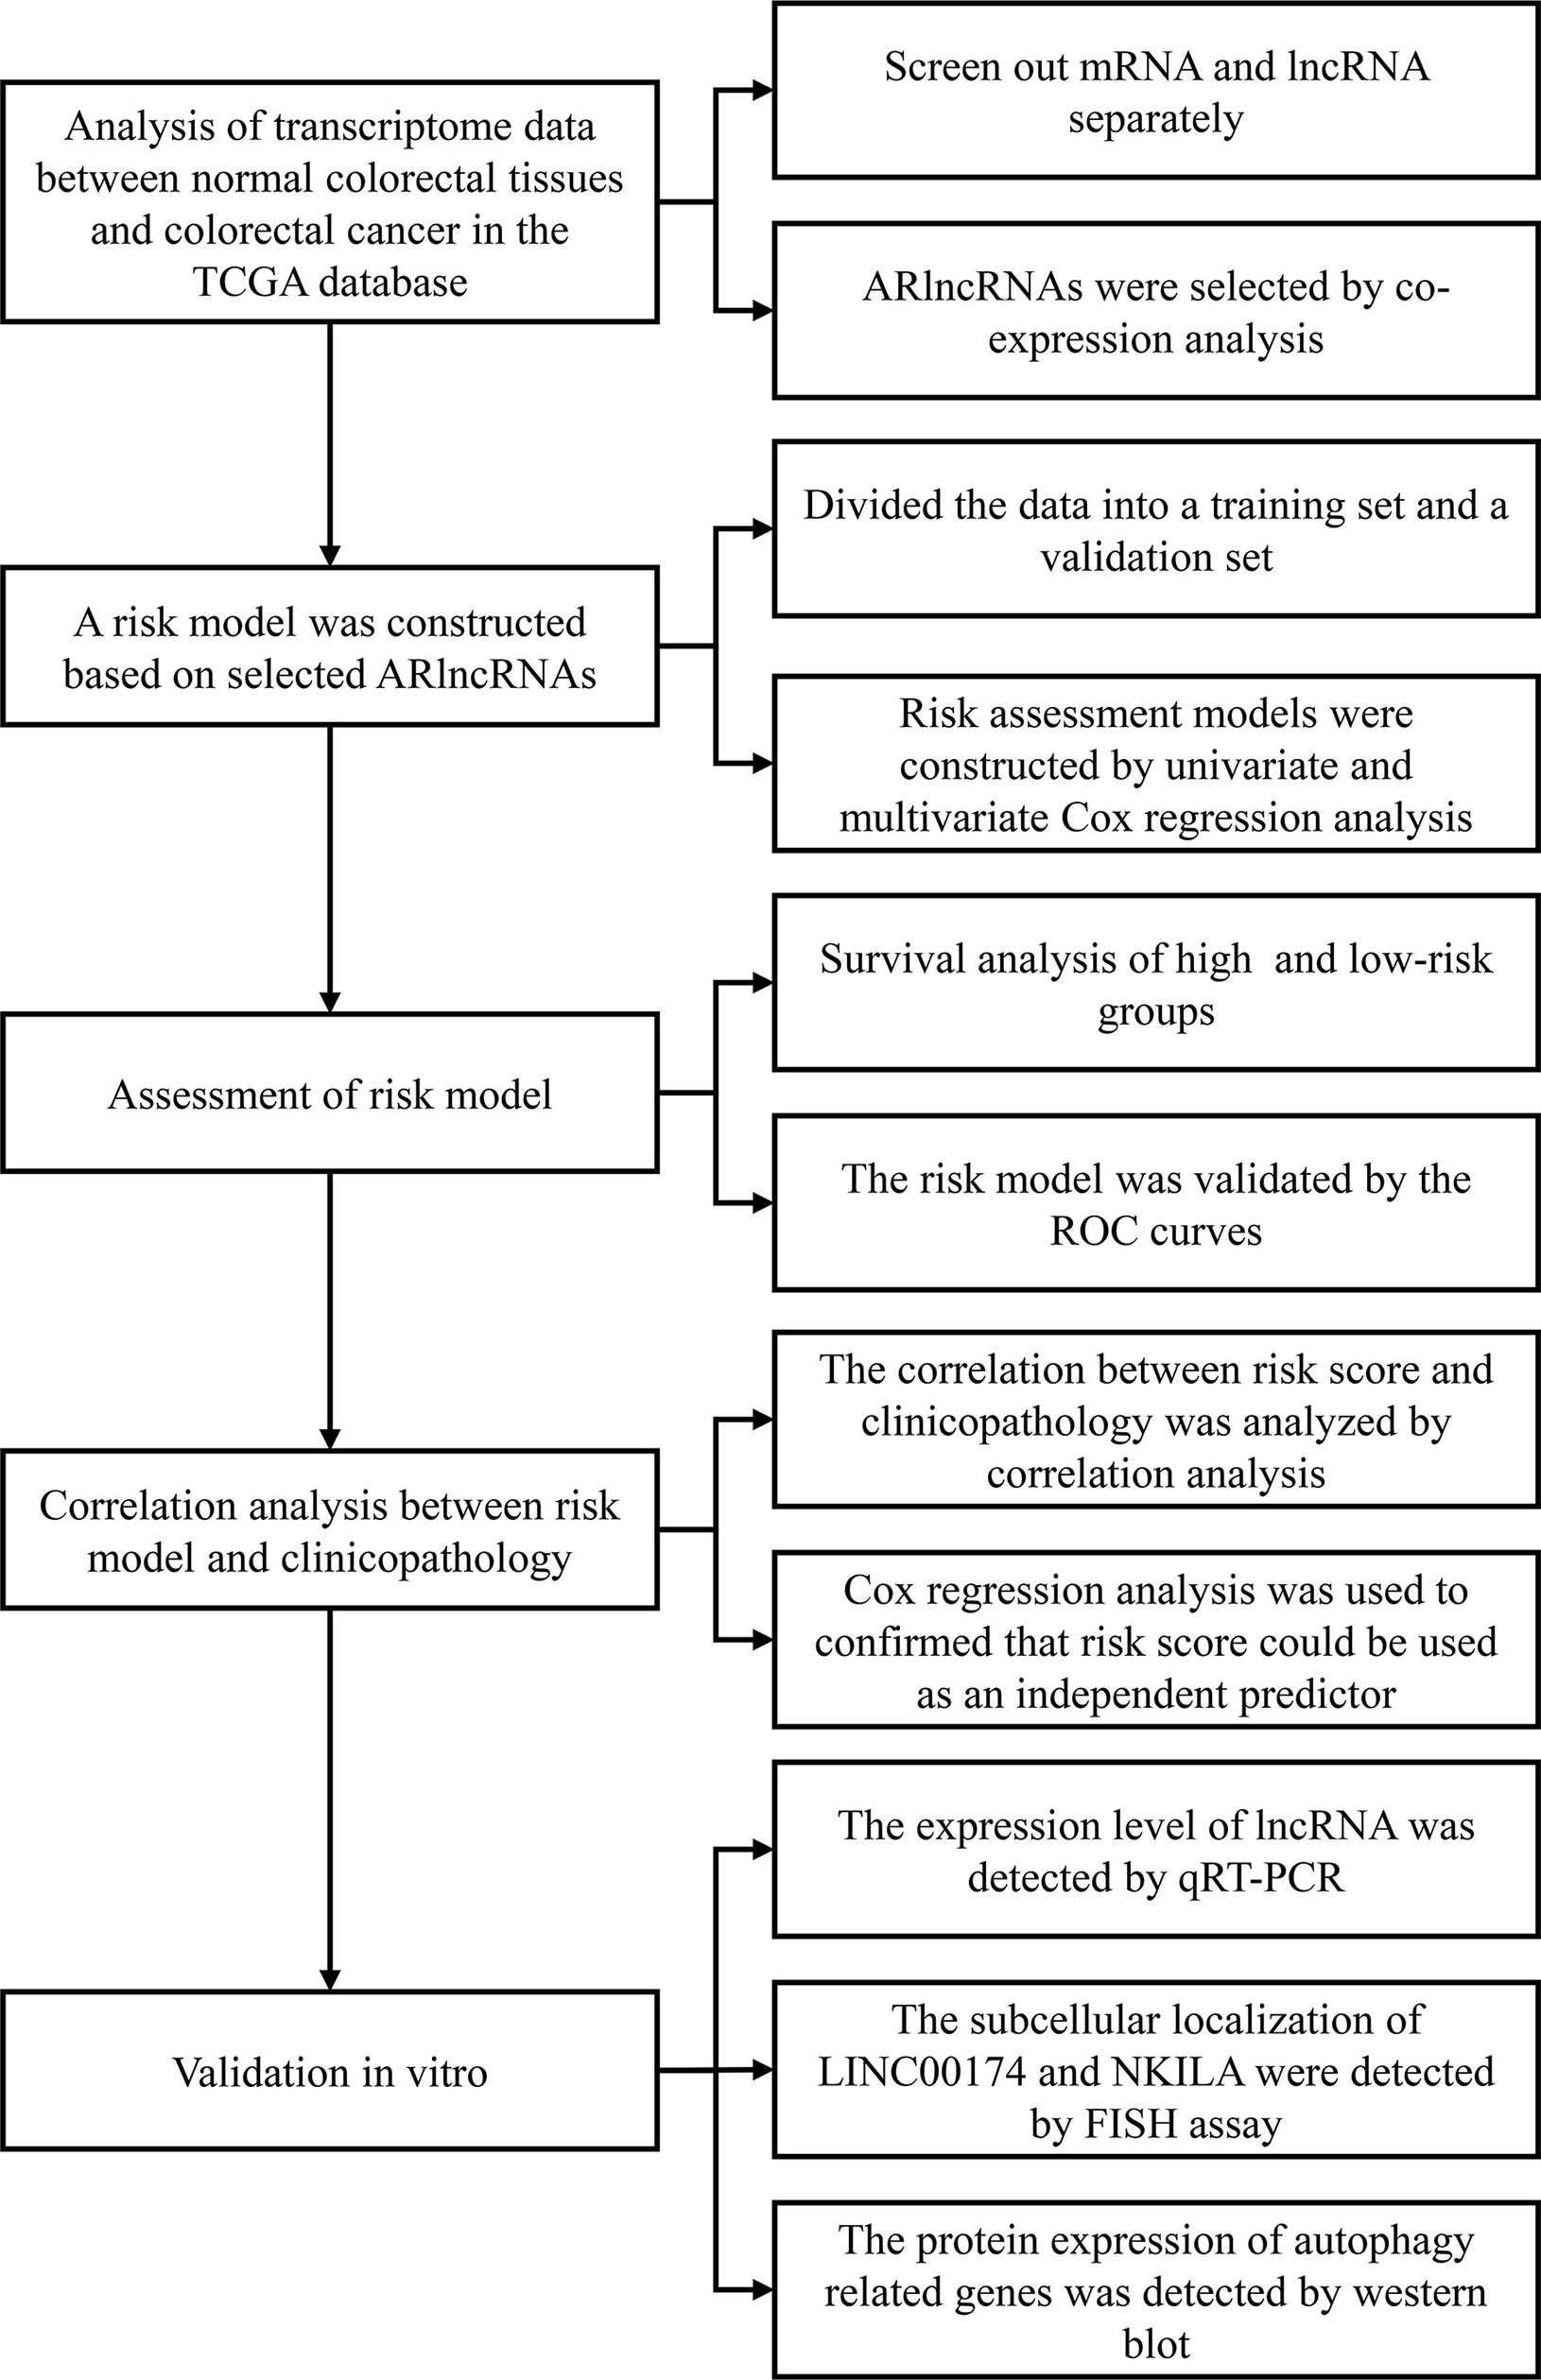
Figure 1 The flow chart of overall procedures. TGCA, the Cancer Genome Atlas; IncRNA, long non-coding RNA; ARIcRNAs, autophagy-related IncRNAs; ROC, receiver operating characteristic; qRT-PCR, quantitative real-time polymerase chain reaction; FISH, fluorescence in situ hybirdization.
2.3 Model Establishment
We used the “caret” package in R to divide the database into train set and validation set. Then, we used the “survival” package in R to conduct univariate Cox regression analysis (p < 0.05) to screen ARlncRNAs related to the 5-year OS of CRC patients and then performed multivariate Cox regression analysis with optimization based on the optimal Akaike information criterion to screen ARlncRNAs for the prediction model. The risk score was the sum of the product of the expression level of each ARlncRNA and the corresponding multivariate Cox regression coefficient (21, 22). The above model was applied to calculate the risk score for each patient. The patients were divided into high- and a low-risk groups with the median risk score as the cutoff value. Next, the “pheatmap” package in R was employed to plot the heat maps of nine ARlncRNAs in each group.
2.4 Survival Analysis
We used the “survival” package in R to plot Kaplan–Meier survival curves to analyze the 5-year OS associated with high or low expression of each ARlncRNA and then performed the log-rank sum test to analyze survival differences between the high and low expression groups. We also compared the 5-year OS between the high-risk group and the low-risk group obtained from this model. Next, the “pheatmap” package in R was used to plot the survival time and survival status.
2.5 Model Evaluation
We utilized the “survivalROC” package in R to plot the receiver operating characteristic (ROC) curve to evaluate the sensitivity and specificity of the ARlncRNA-based risk model via the area under the curve (AUC). Moreover, we analyzed the performance of the risk score from the ARlncRNA-based model versus TNM stage, age, sex, and clinical stage for predicting 5-year survival. In addition, we performed multivariate Cox regression analysis and stratified analysis to determine whether the risk score was independent of clinical variables.
2.6 Gene Ontology and Kyoto Encyclopedia of Genes and Genomes
Gene Ontology (GO) and Kyoto Encyclopedia of Genes and Genomes (KEGG) analyzed the signal pathways of enrichment of genes that construct an interaction network with lncRNAs in the model.
2.7 ARlncRNA Interactive Networks
We used Perl software to screen autophagy-related genes coexpressed with prognostic ARlncRNAs and then used Cytoscape software (v3.8.0) to plot and visualize interactive networks of ARlncRNAs and mRNAs from the prediction model. Next, we utilized the “ggplot2,” “gglluvial,” and “dplayr” packages in R to plot a Sankey diagram to determine whether the ARlncRNAs included in the model were risk factors or protective factors.
2.8 Validation In Vitro
2.8.1 Cell Culture
Human colorectal cancer cell lines HT29 (Procell Life Science & Technology Co., Ltd., China), HCT116, and RKO (BeNa culture collection, China) and normal colonic epithelial cell line NCM460 (BeNa culture collection, China) were used for further investigations. Cell line HCT116 was cultured in Roswell Park Memorial Institute (RPMI) 1640 complete medium containing 10% fetal bovine serum (FBS), RKO, and NCM460 in Dulbecco’s modified Eagle’s medium (DMEM) (H) complete medium containing 10% FBS, and cell line HT29 in McCoy’s 5A complete medium containing 10% FBS. The cells were cultured at 37°C in an incubator and passaged by 0.1% trypsin digestion every 3–4 days during the logarithmic growth period. All cells were grown addictively. To detect the function of lncRNAs in autophagy, cells were applied with 25 nM mammalian target of rapamycin (mTOR) inhibitor Rapamycin for 72 h for further investigation.
2.8.2 Quantitative Real-Time Polymerase Chain Reaction
RNAs were extracted using the Trizol reagent (Invitrogen, Carlsbad, CA, USA), followed by removal of DNA with the TurboDNase kit (Ambion). Quantification of extracted RNA was performed using NanoDrop. Complementary DNA synthesis was performed using PrimeScript real-time (RT) reagent kit (Takara Bio, Japan) using 1,000 ng of total RNA. Quantitative real-time polymerase chain reaction (qRT-PCR) was performed using the SYBR Select Master Mix (Applied Biosystems, Waltham, MA, USA) on an ABI 7900 system (Applied Biosystems). Glyceraldehyde 3-phosphate dehydrogenase (GAPDH) was used as a control. The Ct value was calculated based on the ΔΔCt method. Fold change of gene expression was expressed as 2−ΔΔCt. The primers used in this study were as follows: NKILA, sense strand 5′-CGGATACATCTTAGTTGTTATG-3′, antisense strand 5′-GTGCTGGAATCATCATTG-3′ and LINC00174, sense strand 5′-GCATTAGATTCTCATAGG-3′, antisense strand 5′-GGCATTAGATTCTCATAG-3′.
2.8.3 Western Blot
LC3B, p62, beclin1, and ATG7 were extracted from the indicated cells using radioimmunoprecipitation assay (RIPA) lysis buffer, and a BCA Protein Assay Kit (Thermo Scientific, USA) was used to measure the protein concentration. In total, 60 μg of protein was separated on 10% sodium dodecyl sulfate–polyacrylamide gel electrophoresis (SDS-PAGE) gels by PAGE and transferred onto nitrocellulose membranes. The membranes were blocked using 5% non-fat dry milk and incubated with primary rabbit monoclonal antibody overnight at 4°C. The membranes were washed with Tris-buffered saline with Tween 20 (TBST) and then incubated with the appropriate secondary antibody. Enhanced chemiluminescence reagent was used to detect the signal on the membrane. The antibody used in this study are shown in Supplementary Table 1.
2.8.4 Fluorescence In Situ Hybridization
The subcellular localization of LINC00174 and NKILA was detected by FISH assay. Cells were fixed with 4% paraformaldehyde (Aladdin, China) and incubated overnight at 37°C with a labeled LINC00174 or NKILA probe (Sangon, China). Then, cells were incubated with 4′,6-diamidino-2-phenylindole (Best-Bio, Shanghai, China). The image was acquired by laser scanning confocal microscopy (LSM710, Carl Zeiss, Germany).
2.9 Statistical Analysis
The Cox proportional hazard model was employed for univariate and multivariate analyses. The Kaplan–Meier method was used to plot survival curves, and the log-rank sum test was performed to analyze between-group differences. Due to homogeneity of variance, Student’s t-test and Dunnett’s multiple comparisons test in analysis of variance were used to analyze the expression levels of lncRNA in different cells. Statistical analyses were conducted with R (v4.0.0) and GraphPad Prism (v9.2.0) software. A two-tailed value of p < 0.05 was considered statistically significant, unless otherwise specified.
3 Results
3.1 Identification of Nine Prognostic ARlncRNAs
Using univariate Cox regression analysis and the Kaplan–Meier method, we screened 32 prognostic ARlncRNAs (Supplementary Table 2). Further multivariate Cox regression analysis of these 32 ARlncRNAs with optimization at an Akaike information criterion of 365.59 yielded an interactive network diagram with 9 ARlncRNAs and 53 coexpressed mRNAs (Figure 2). We then plotted Kaplan–Meier survival curves to analyze survival and plotted the corresponding survival curve associated with high or low expression of each of the nine ARlncRNAs (Figure 3). The results showed that the 5-year survival rate was significantly lower in the high- than in the low-expression group among all ARlncRNAs (NKILA, LINC00174, AC008760.1, LINC02041, PCAT6, AC156455.1, LINC01503, LINC00957, and CD27-AS1, all p < 0.05).
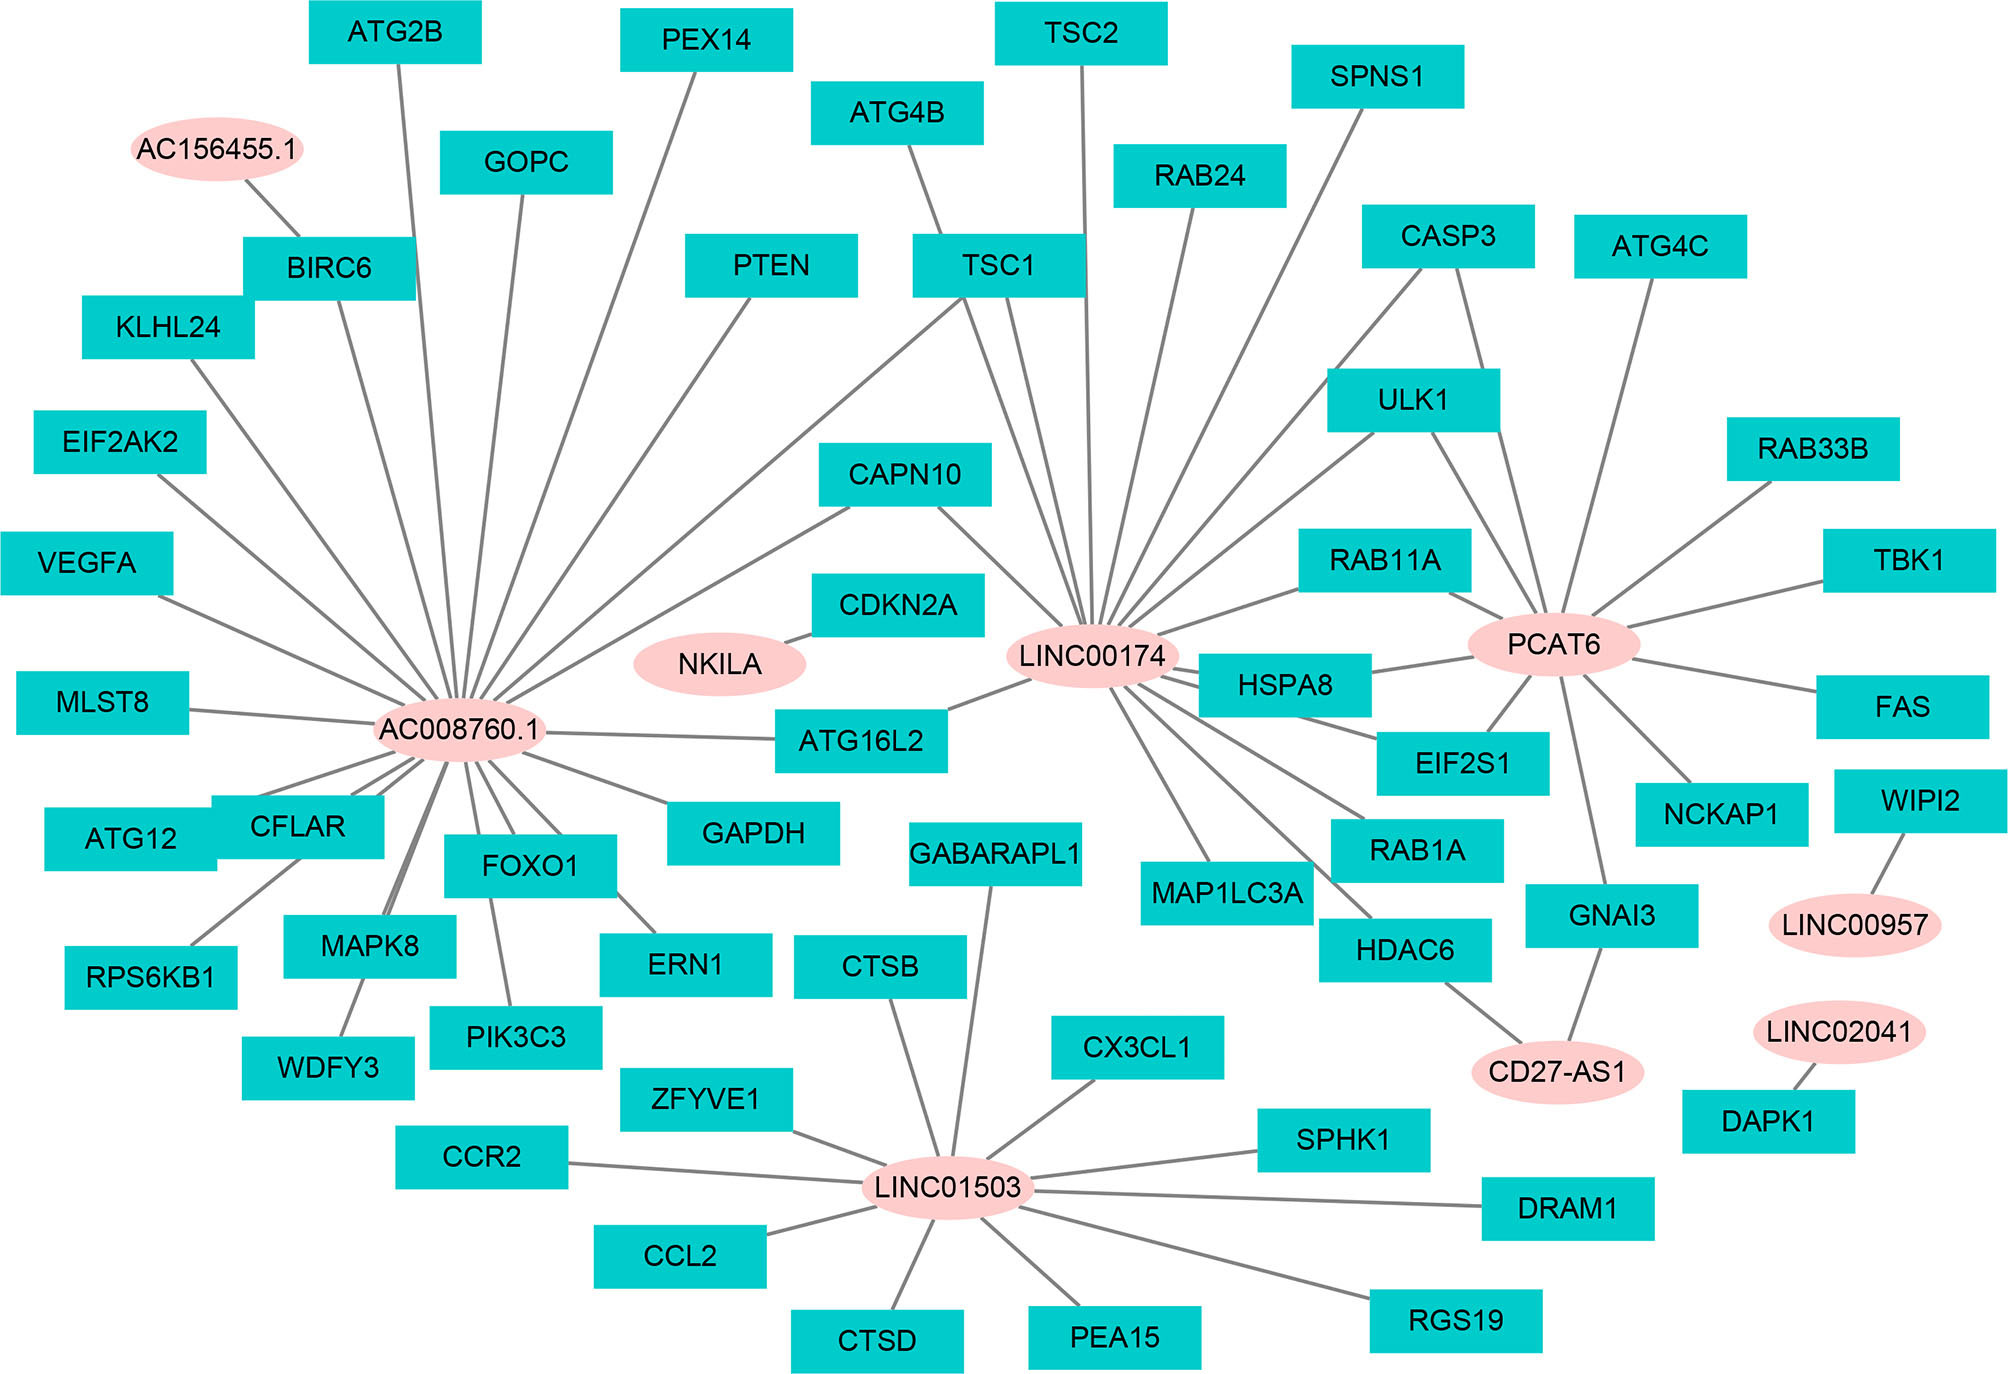
Figure 2 The interaction network of OS-associated lncRNAs and autophagy genes. The pink circle refers to ARlncRNA, and the cyan square refers to autophagy genes.
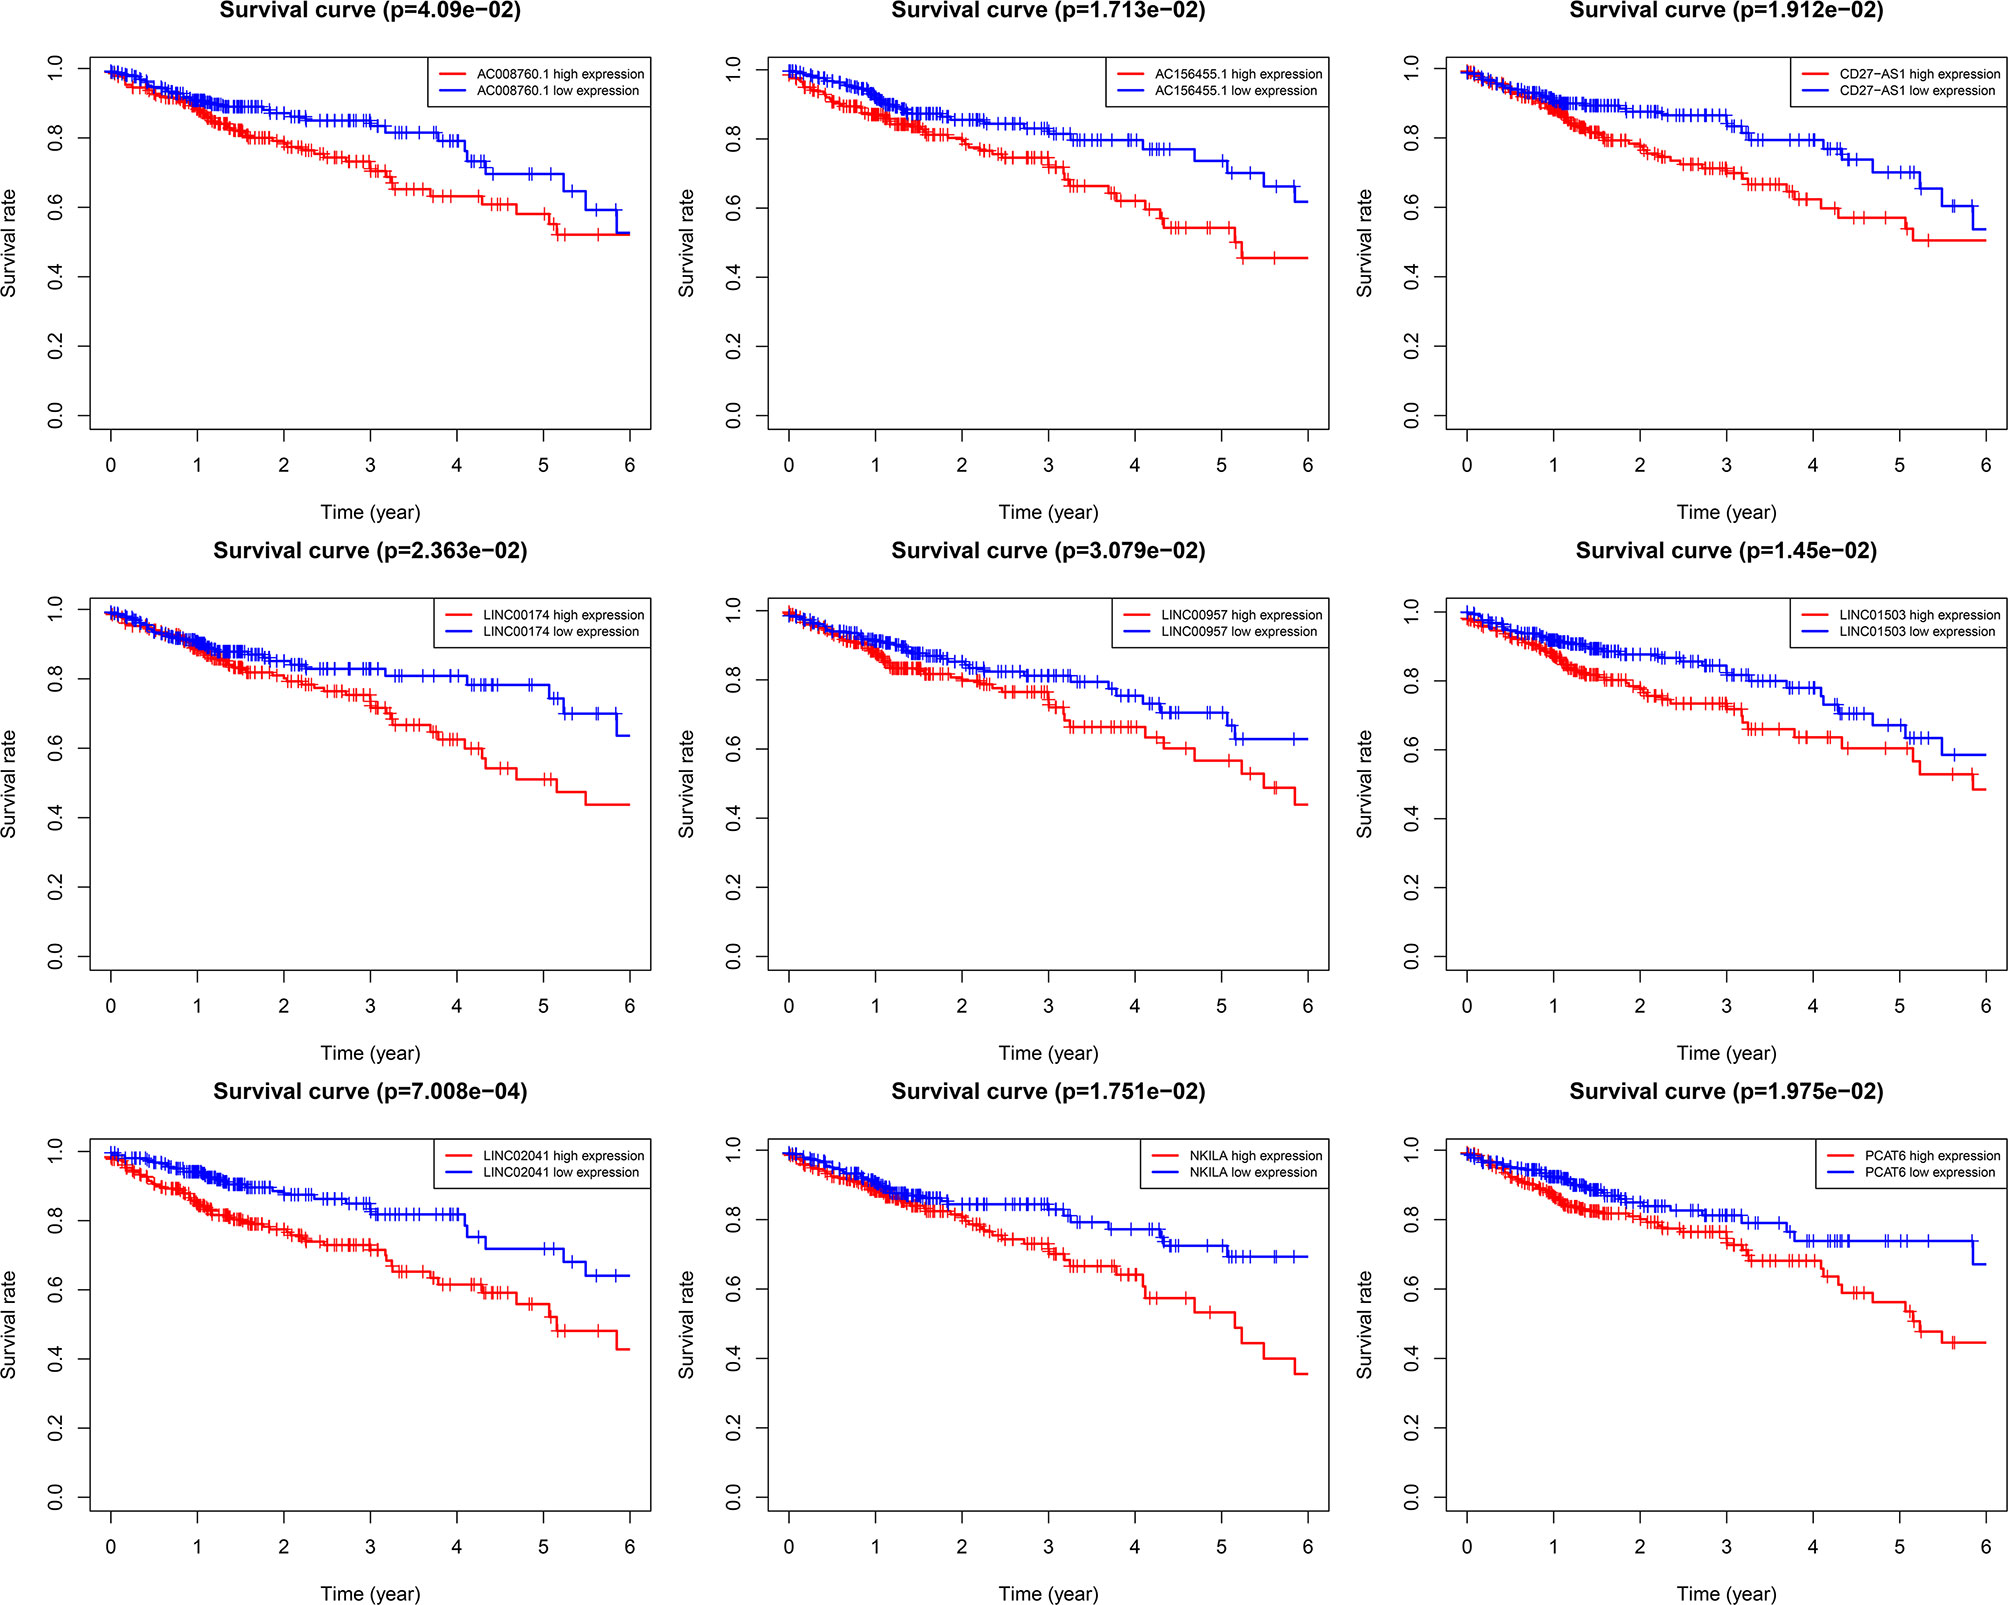
Figure 3 Kaplan–Meier 5-year overall survival (OS) curves for two groups divided by high and low expression level of ARlnRNAs. The red curves correspond to patients with high expression level of ARlnRNAs, while the blue curves correspond to patients with low expression level of ARlnRNAs.
3.2 Risk Score Model Based on Nine ARlncRNAs
We constructed a proportional hazards model of these nine ARlncRNAs using multivariate Cox regression analysis: risk score = (0.667 × the expression level of NKILA) + (−0.601 × the expression level of LINC00174) + (1.052 × the expression level of AC008760.1) + (0.543 × the expression level of LINC02041) + (0.533 × the expression level of PCAT6) + (0.843 × the expression level of AC156455.1) + (0.950 × the expression level of LINC01503) + (0.578 × the expression level of LINC00957) + (0.925 × the expression level of CD27-AS1) (Table 1).
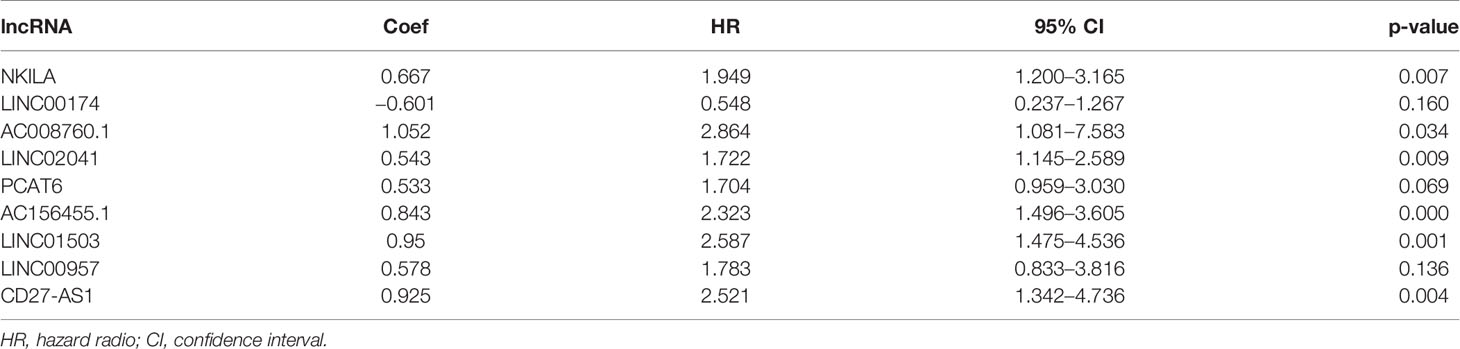
Table 1 ARlncRNAs applied to new prediction model.
3.3 Evaluation of the ARlncRNA-Based Prediction Model for CRC
We calculated the risk score for each patient based on the proportional hazard model for nine ARlncRNAs and then sorted the risk scores in ascending order. With the median as the cutoff value, we divided the patients into a high- and a low-risk group between train set and validation set. Figure 4 shows the risk score and survival status. Kaplan–Meier survival analysis indicated that the 5-year OS was significantly higher in the low- than in the high-risk group among train set (Figure 5A), validation set (Figure 5B), and all patients (Figure 5C). Moreover, the model had high sensitivity and specificity in predicting the 1-year OS of CRC patients among train set (Figure 5D), validation set (Figure 5E), and all patients (AUC = 0.717, Figure 5F). In addition, multivariate analysis showed that risk value was better than clinicopathological factors (Figure 5G). Sankey diagrams and heat maps were used to visualize the expression profiles for the nine ARlncRNAs in the low- and high-risk groups. The results showed that the expression level of all ARlncRNAs tended to be higher in the low- than in the high-risk group, and they were determined to be risk factors (Figures 5H–K).
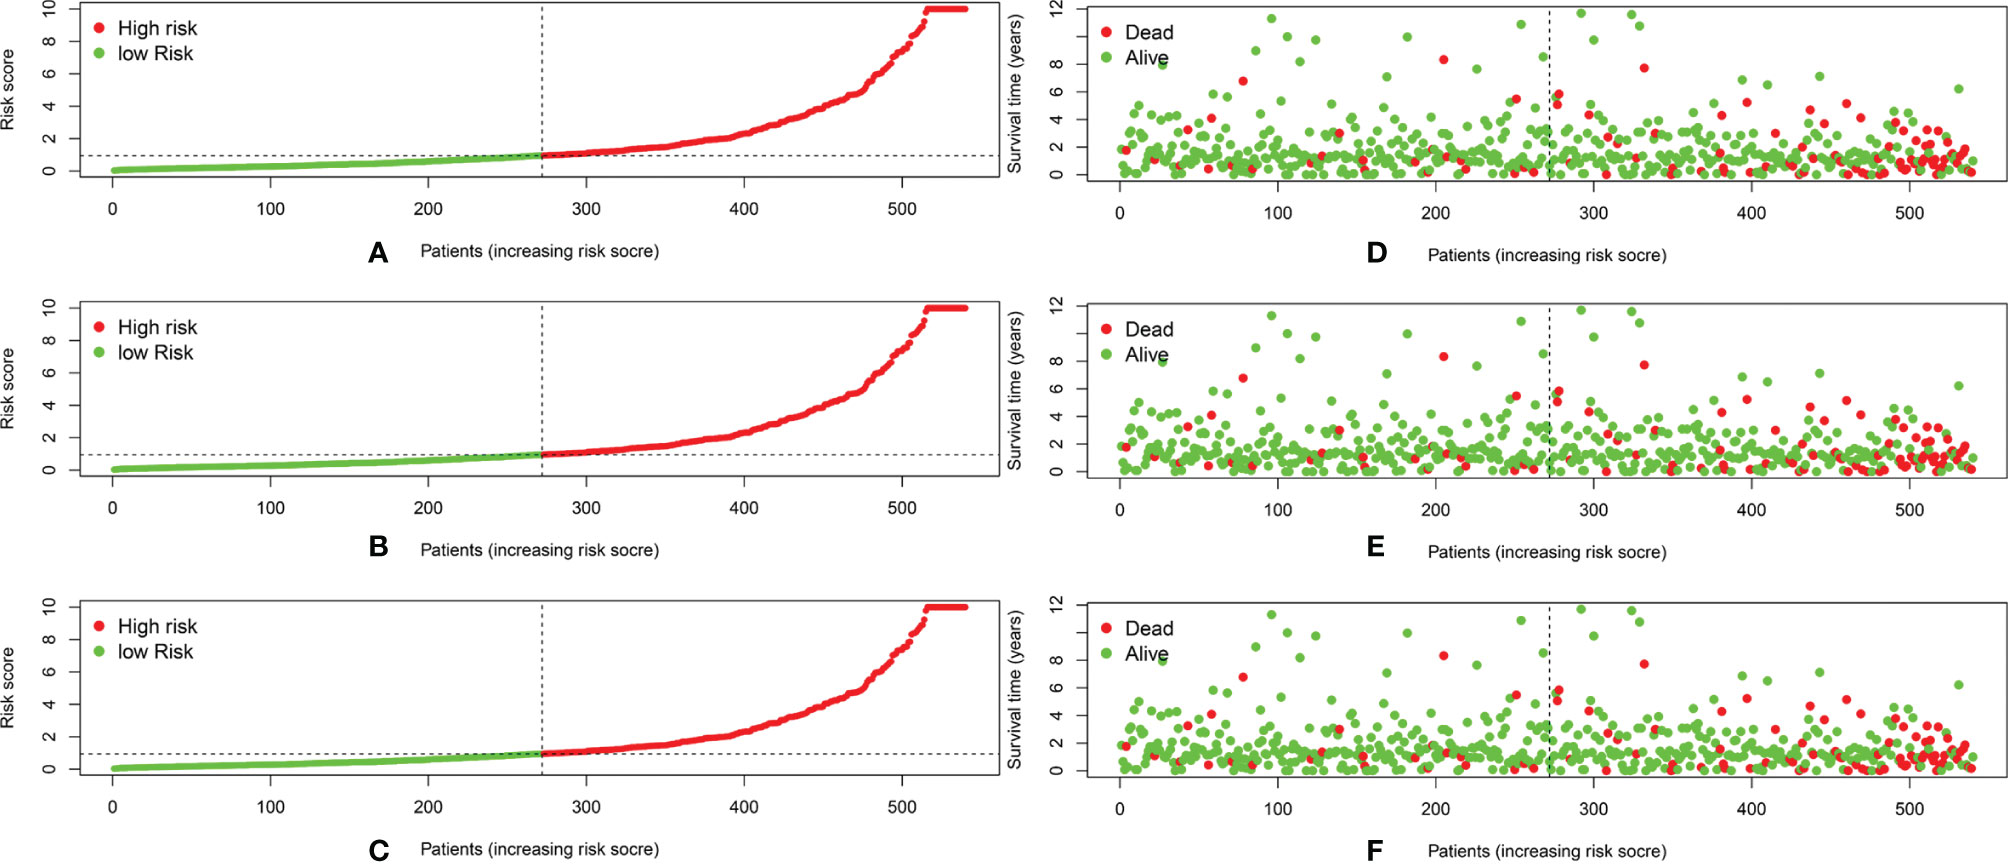
Figure 4 (A–C) The distribution of the risk scores of the patients in both high- and low-risk score groups among train set, validation set, and all patients. (D–F) Patients’ survival status and time distributed by risk score among train set, validation set, and all patients.
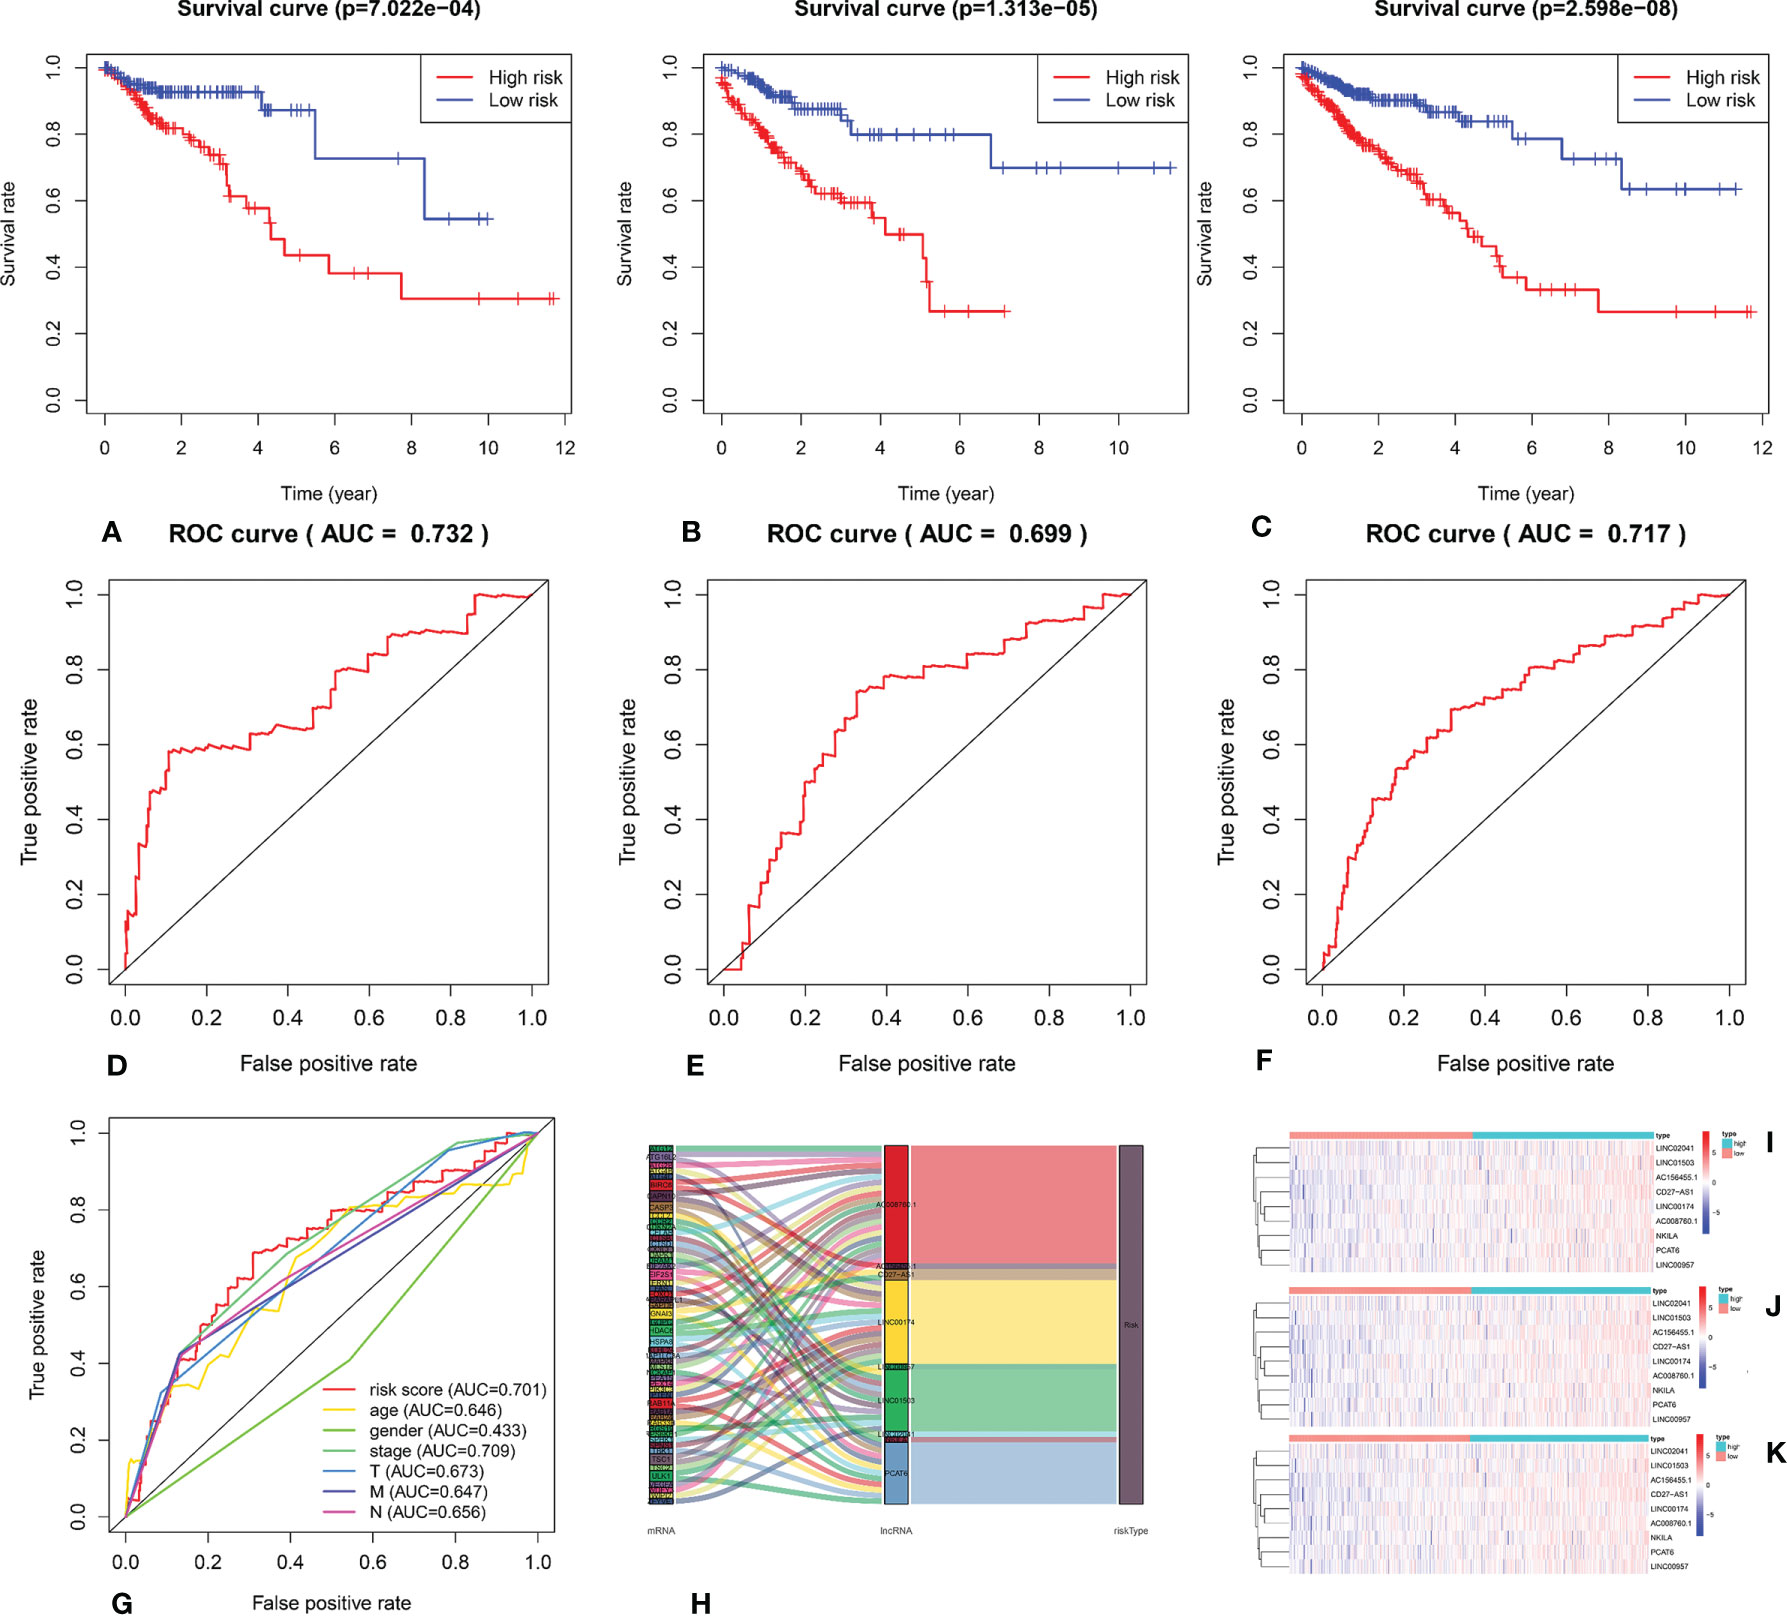
Figure 5 (A–C) Kaplan–Meier survival curve of the low- and high-risk groups based on median risk score valued by ARlnRNAs model among train set, validation set, and all patients. (D–F) The receiver operating characteristic (ROC) curve of nine ARlncRNAs model among train set, validation set, and all patients. (G) The receiver operating characteristic (ROC) curve of nine ARlncRNA risk score and clinicopathological parameters (age, gender, clinical stage, and TNM stage). (H) The Sankey diagram shows the connection degree between the 53 mRNAs and 9 ARlncRNAs. (I–K) The heatmap of the nine ARlncRNA expression value in low- and high-risk score groups among train set, validation set, and all patients. Red to blue indicates a trend from high to low expression.
3.4 Risk Factors for Predicting 5-Year OS
We performed univariate Cox regression analysis to screen prognostic clinicopathological factors and then performed multivariate Cox regression analysis to analyze the effect of multiple clinicopathological factors (including age at diagnosis, sex, TNM staging, clinical stage, and risk score from the ARlncRNA model) on 5-year OS to screen independent predictors of 5-year OS. The results showed that sex, clinical stage, N stage, and M stage were unrelated to 5-year OS (p > 0.05), whereas age (HR = 1.051; 95% CI, 1.029−1.075; p < 0.001), T stage (HR = 1.751; 95% CI, 1.071−2.863; p = 0.026), and risk score from the ARlncRNA model (HR = 1.014; 95% CI, 1.005−1.022, p = 0.002) were independent predictors (Figures 6A, B). Moreover, the risk score was a risk factor, as the 5-year survival rate was lower if the risk score was >0.943.
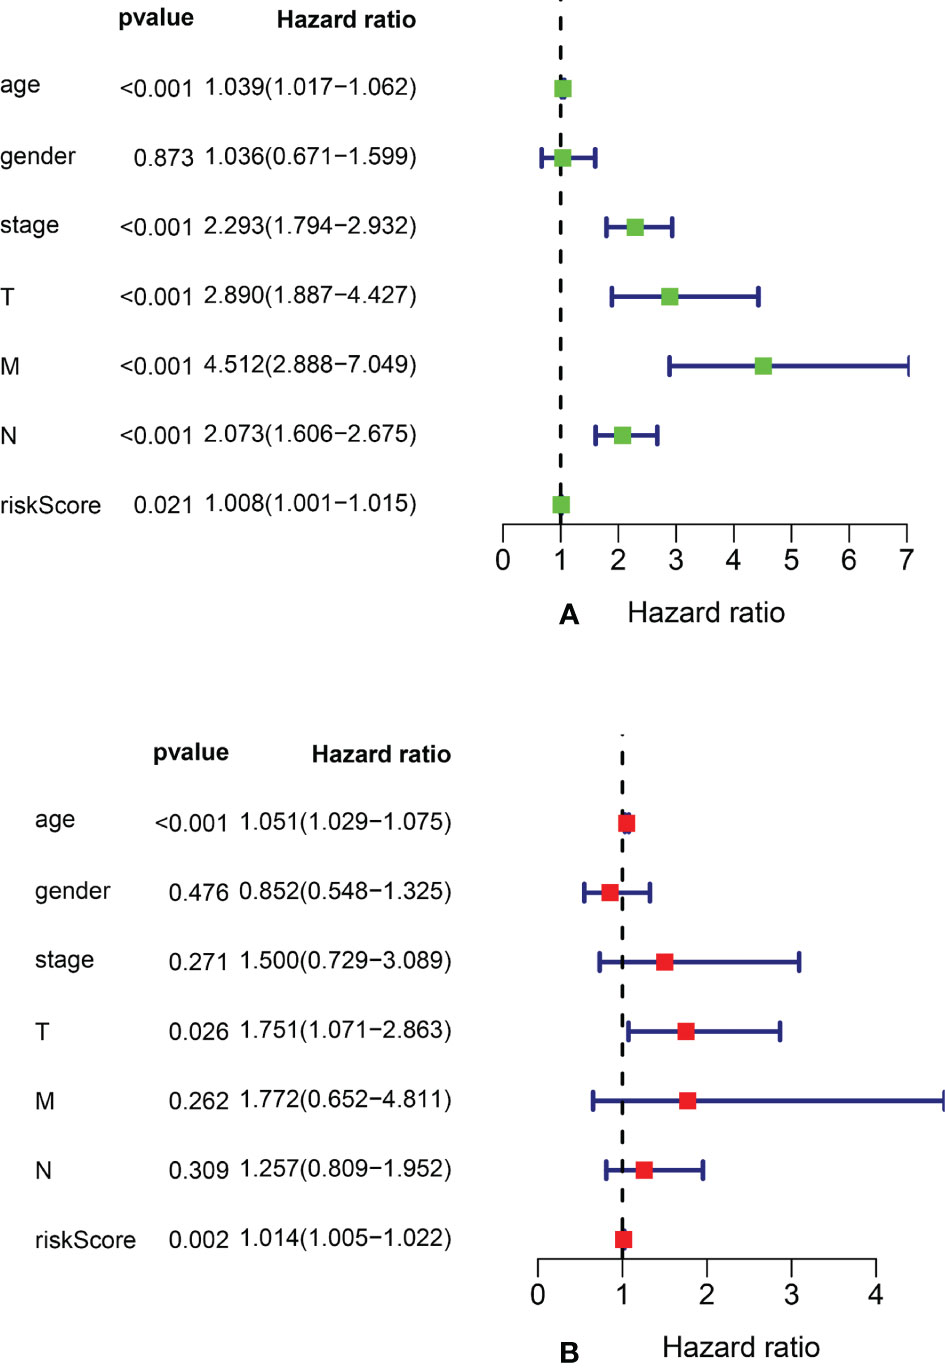
Figure 6 Forest plots of univariate and multivariate Cox regression analyses of clinicopathological parameters (age, gender, clinical stage, and TNM stage) and risk scores associated with 5-year overall survival. (A) Forest plot of univariate Cox regression analysis. (B) Forest plot of multivariate Cox regression analysis.
3.5 Correlation Between the Model Risk Score and Clinical Data
We performed stratified analysis based on age, sex, clinical stage, T stage, M stage, and N stage. The mean risk score for each factor was compared between the two groups of patients. Table 2 shows that the risk score from the ARlncRNA-based model was unrelated to sex (p = 0.204), age (≤65 vs. > 65 years old, p = 0.512), clinical stage (stage I–II vs. stage III–IV, p = 0.623), M stage (M0 vs. M1, p = 0.379), and N stage (N0 vs. N1–2, p = 0.556). The risk score for patients with T3–T4 stage was significantly higher than that for patients with T1–T2 stage (p = 0.005).
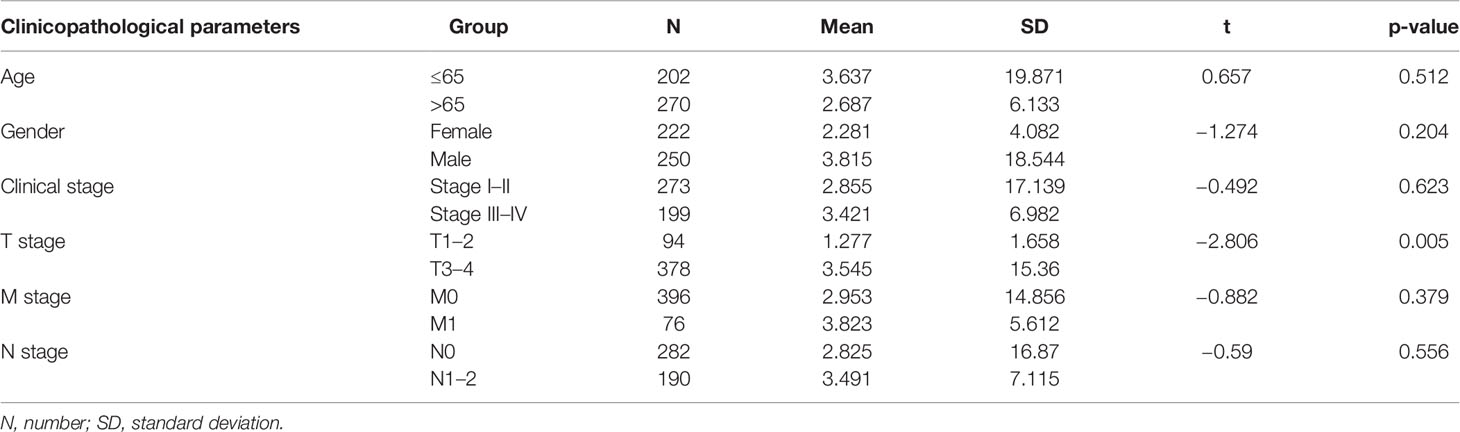
Table 2 Correlation analysis between risk scores valued by new prediction model and clinicopathologic parameters.
3.6 Signaling Pathways Enriched With the Nine ARlncRNAs
We performed Gene Ontology (GO) and Kyoto Encyclopedia of Genes and Genomes (KEGG) to identify the signal pathways of enrichment of genes that construct an interaction network with lncRNAs in the model. The results showed that those genes were most enrichment in autophagy signal pathways (Figures 7A, B).
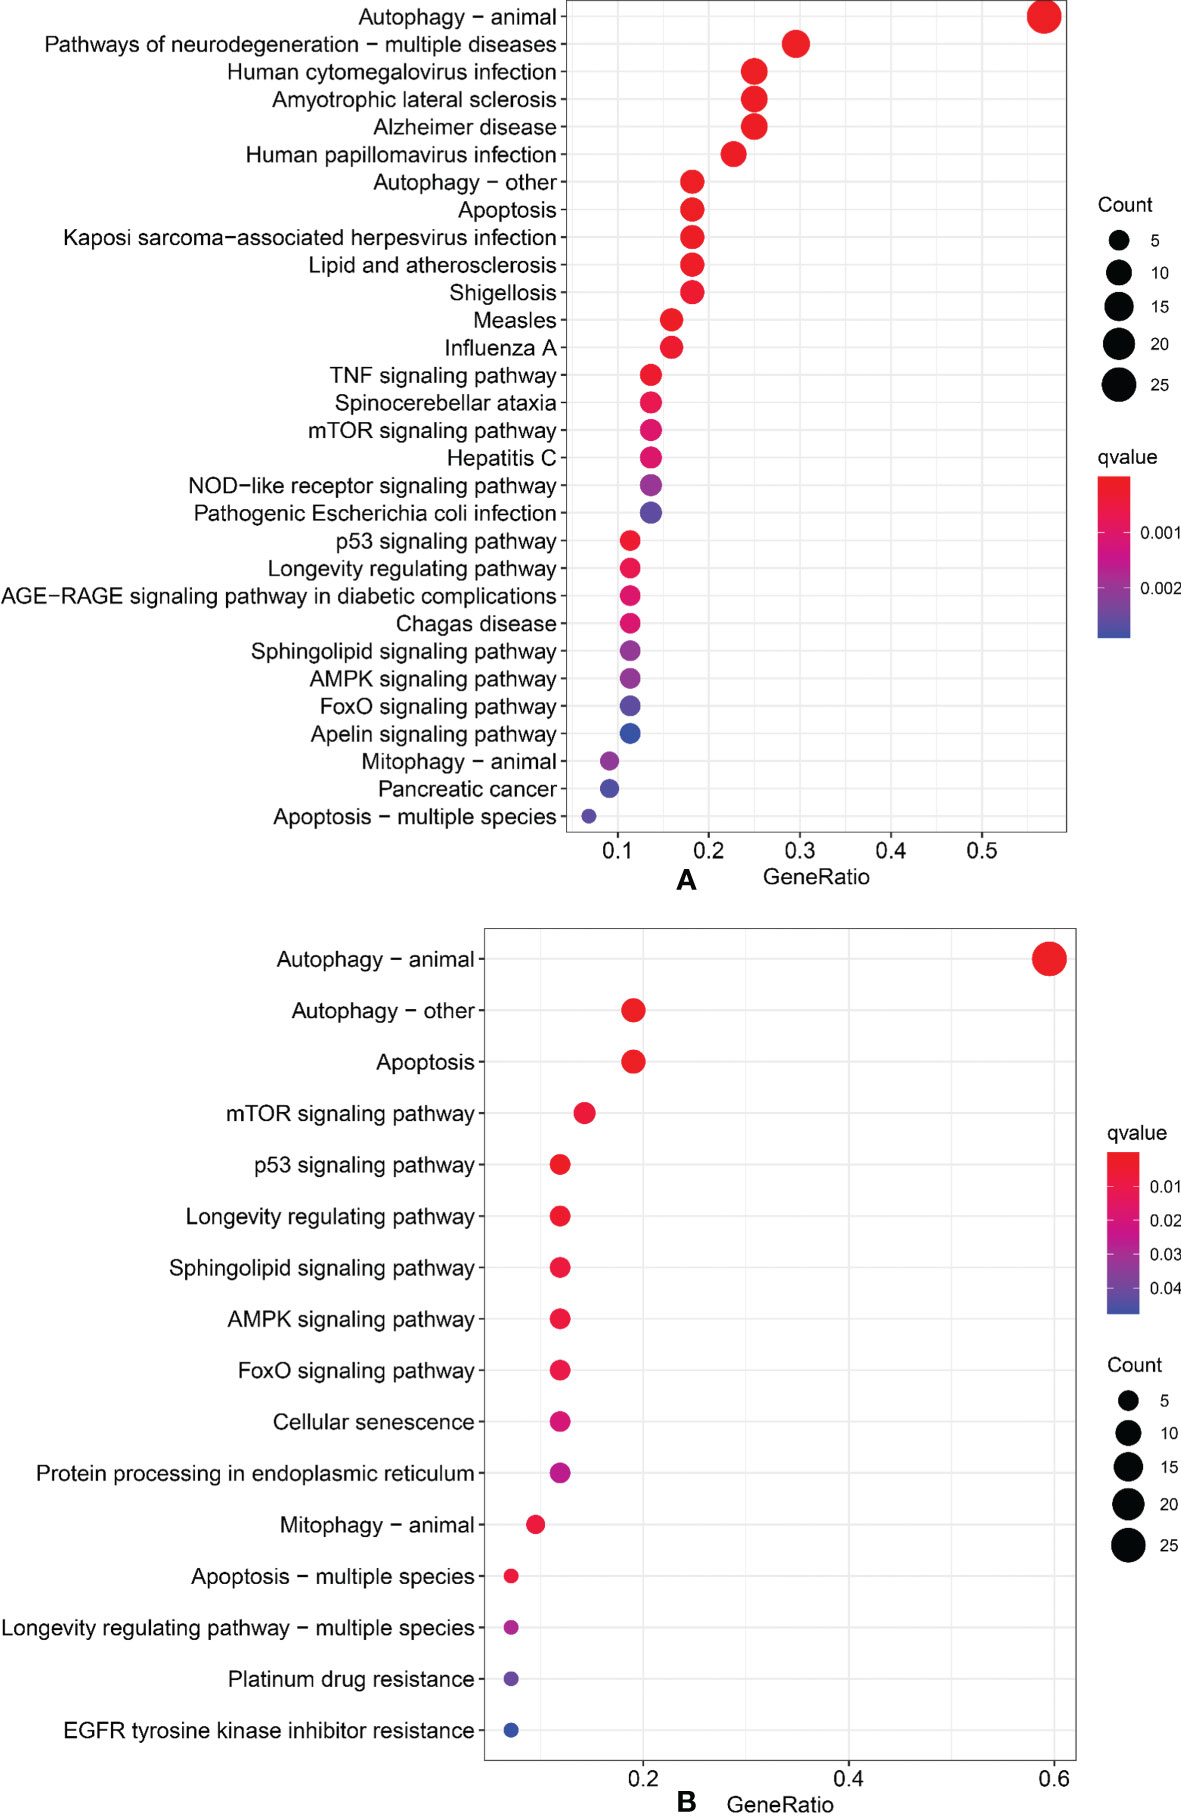
Figure 7 Gene Ontology and Kyoto Encyclopedia of Genes and Genomes. (A) GO analysis. (B) KEGG analysis.
3.7 Validation In Vitro
To verify the expression of selected lncRNAs, i.e., NKILA and LINC00174, in colorectal cancer cell lines, qRT-PCR was performed. As shown in results, NKILA and LINC00174 were all higher expressed in colorectal cancer cell line HT29 compared to normal colonic epithelial cell line NCM460 (Figure 8). FISH assay was used to detect the subcellular localization of LINC00174 and NKILA. The results showed that the target genes LINC00174 and NKILA were both expressed in the nucleus and cytoplasm of the NCM460 and HT29 cells (Figure 9). In addition, the protein expression of autophagy-related genes was detected by Western blot. The results showed that, compared to NCM460 cell, LC3B and ATG7 were lower expressed in RKO and HT29 cell (Figure 10). To detect the relation of NKILA and LINC00174 with autophagy, we stimulated the cells with mTOR inhibitor to activate the autophagy. As shown in the results, significant upregulation of LC3B and ATG7 protein expression was observed between HT29 and NCM460, which suggested that they were related to the activation of autophagy (Figure 11). In addition, compared with normal cultured cells, the expression of LINC00174 was significantly decreased in both NCM460 and HT29 cells after the addition of mTOR inhibitor, while the expression of NKILA was significantly increased (Figure 12), which suggested that NKILA and LINC00174 were related to autophagy.
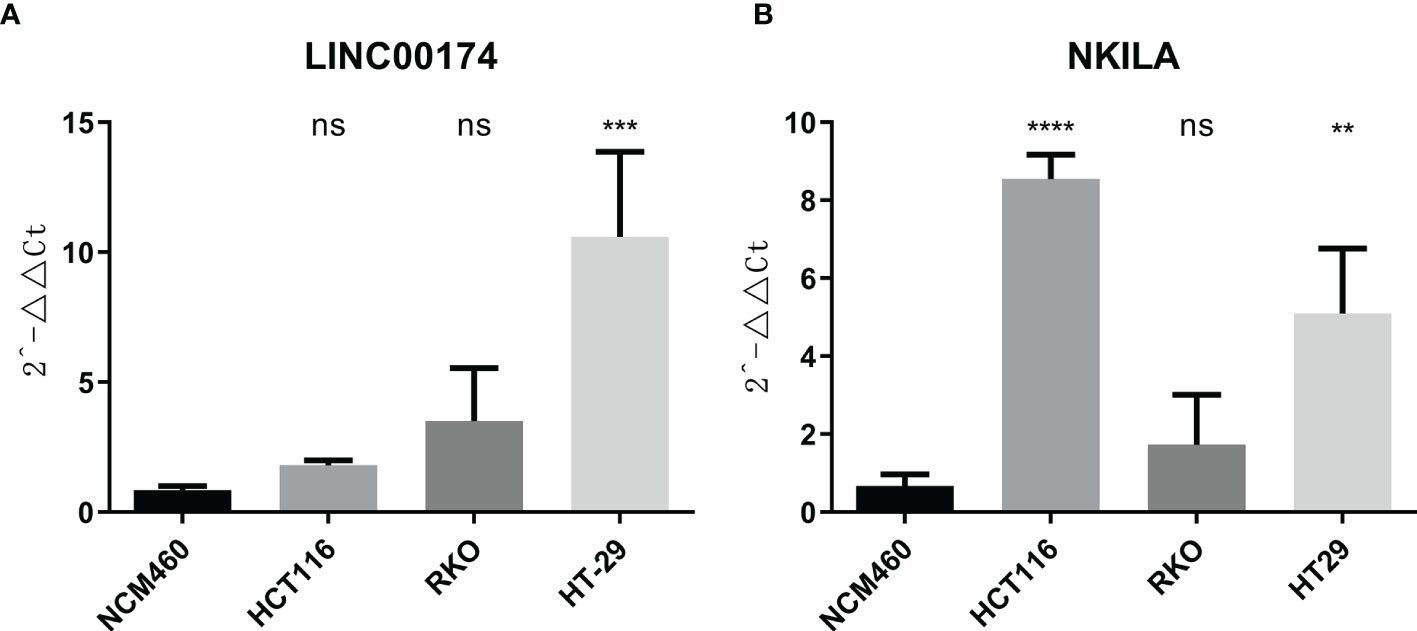
Figure 8 The expression of LINC00174 and NKILA was detected by qRT-PCR. (A) The expression of LINC00174 among normal colonic epithelial cell line and colorectal cancer cell lines. (B) The expression of NKILA among normal colonic epithelial cell line and colorectal cancer cell lines. All p-values were the comparison of the lncRNA expression of HCT116, RKO, HT29, and that of NCM460. ****p < 0.0001; ***0.0001 < p < 0.001; **0.01 < p < 0.001; ns: p > 0.05.
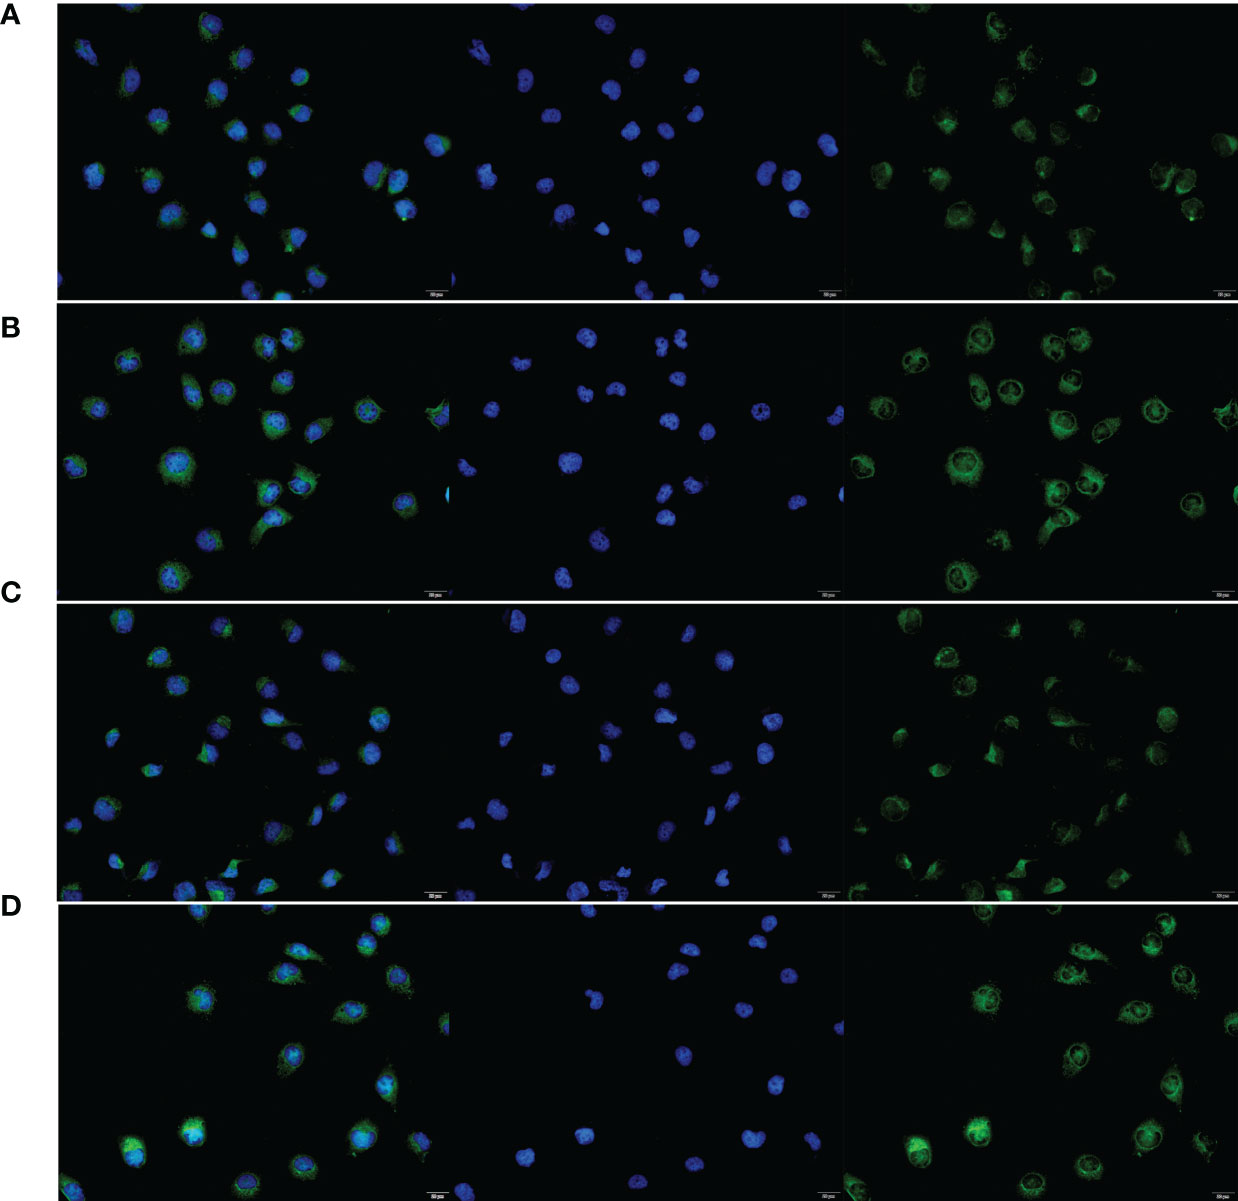
Figure 9 The subcellular localization of LINC00174 and NKILA between NCM460 and HT29 cells. (A) Subcellular localization of LINC00174 in NCM460 cells. (B) Subcellular localization of LINC00174 in HT29 cells. (C) Subcellular localization of NKILA in NCM460 cells. (D) Subcellular localization of NKILA in HT29 cells.
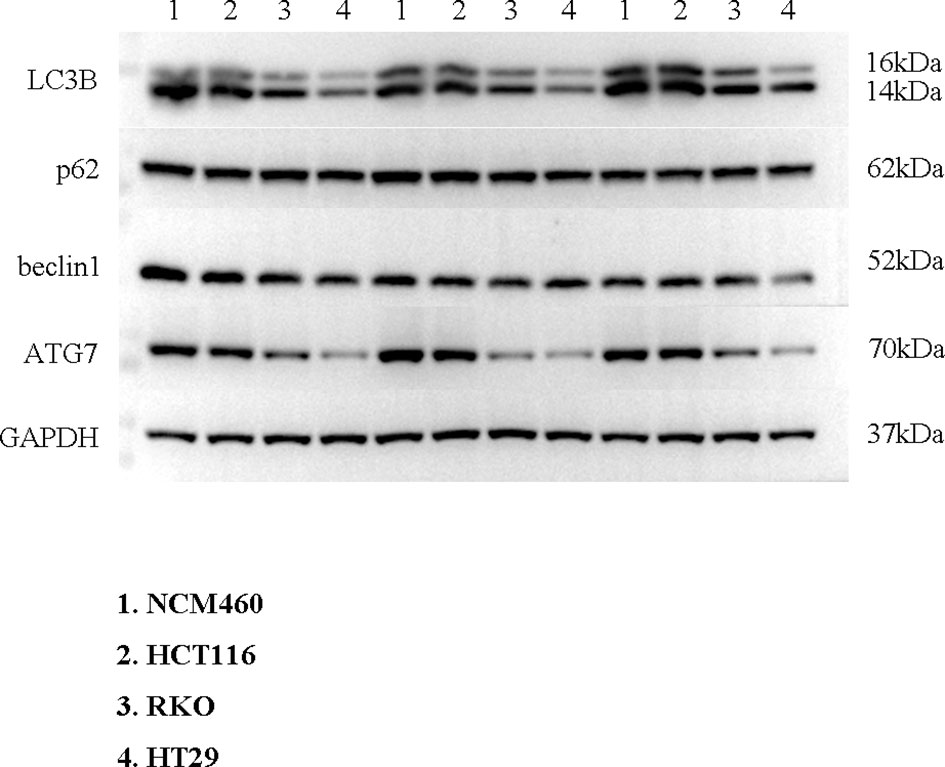
Figure 10 The protein expression of autophagy-related genes was detected by Western blot.
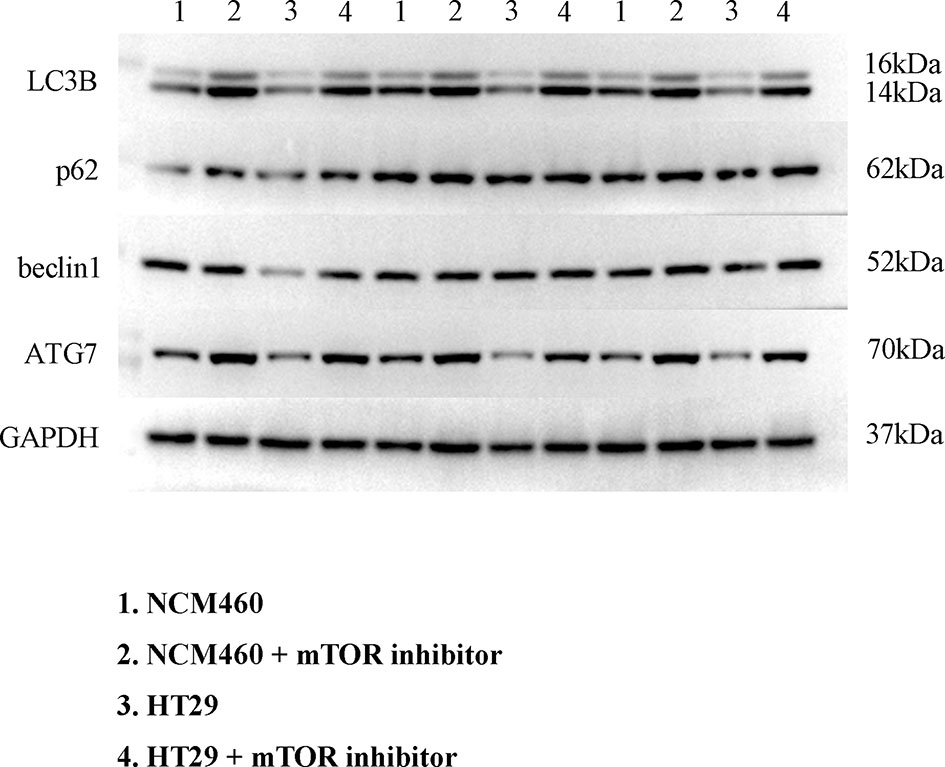
Figure 11 Expression of autophagy-related proteins after autophagy activation.
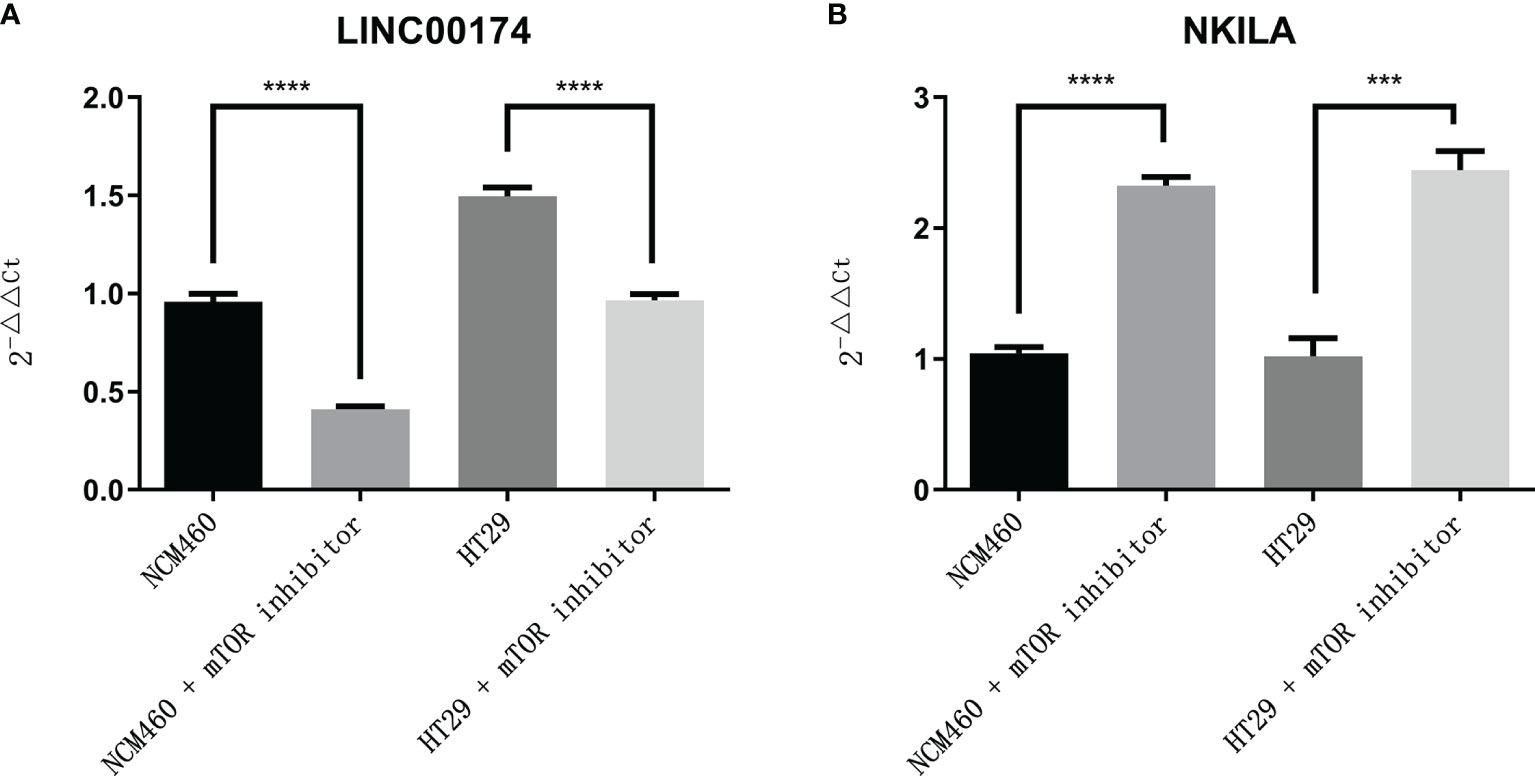
Figure 12 The expression of LINC00174 and NKILA after autophagy activation. (A) LINC00174, (B) NIKLA. ****p < 0.0001; ***0.0001 < p < 0.001.
4 Discussion
Cell death occurs via necrosis, apoptosis, and autophagy. Cell apoptosis and autophagy are programmed cell death pathways, and current studies show that apoptosis and autophagy are both regulated by lncRNAs and that regulating the expression level of lncRNAs involved in apoptosis and autophagy regulates the biological behavior of tumor cells. Wei et al. (23) showed that, in CRC, lncRNA CA3-AS1 reduces miR-93 expression by directly binding to miR-93, thereby promoting CRC apoptosis and suppressing tumor proliferation and invasion. In another study, lncRNA FAL1 promoted CRC apoptosis, thereby reducing tumor proliferation (24).
ARlncRNAs and apoptosis-related lncRNAs may have similar effects. In recent years, researchers have shown increased interest in the role of lncRNAs in tumor autophagy. lncRNA SLCO4A1-AS1 binds to miR-508-3p to upregulate PARD3, thereby promoting protective CRC autophagy and CRC proliferation (25). Zheng et al. (26) showed that the survival time of CRC patients is shorter for those with high lncRNA HAGLROS expression than for those with low expression. HAGLROS inhibits apoptosis and promotes autophagy to regulate tumor biological behavior mainly via the PI3K/AKT/mTOR and miR-100/ATG5 pathways. These data indicate that apoptosis and autophagy may have common regulatory pathways. We suspect that HAGLROS may be a marker for predicting the prognosis of patients with CRC. Another study showed that lncRNA Malat1 directly binds to miR-101 to regulate CRC autophagy, apoptosis, and proliferation. Further studies showed that the use of 3-methyladenine, an autophagy inhibitor, decreased Malat1-induced cell proliferation and promoted Malat1-induced apoptosis (27). Taken together, these studies show that lncRNAs play important roles in activating CRC autophagy, suggesting that lncRNAs regulate tumor biological behavior by activating CRC autophagy pathways, thereby enhancing tumor cell proliferation. This conclusion should be taken into consideration in clinical treatment.
In addition, ARlncRNAs play important roles in resistance to chemotherapy. Liu et al. (28) showed that lncRNA nuclear paraspeckle assembly transcript 1 (NEAT1) is highly expressed in CRC tissues and cell lines and is negatively correlated with miR-34a, which is involved in autophagy activation via targeted sites (HMGB1, ATG9A, and ATG4B). NEAT1 knockdown significantly inhibits CRC proliferation and enhances sensitivity to 5-fluorouracil (5-FU). Wang et al. (29) showed that lncRNA H19 triggers autophagy and induces 5-FU resistance in CRC cells via the miR-194-5p/SIRT1 pathway. H19 expression is significantly increased in patients with recurrent CRC, and the recurrence-free survival time is significantly shorter in patients with high H19 expression than in patients with low H19 expression. Han et al. (30) showed that, in CRC, the expression levels of lncRNA SNHG14 and ATG14, an autophagy-related gene, are significantly increased and that lncRNA SNHG14 regulates tumor proliferation, invasion, migration, apoptosis, and autophagy via the miR-186/ATG14 axis. High ATG14 expression significantly promotes the proliferation and reduces the apoptosis of cisplatin-resistant CRC cell lines. The expression of autophagy-related LC3B decreases after lncRNA SNHG14 knockdown in cisplatin-resistant CRC cell lines. These studies provide direct evidence that lncRNAs are closely related to autophagy and regulate drug resistance of CRC cells via autophagy pathways. ARlncRNAs may become novel treatment targets for resistance reversal.
Numerous studies have shown that lncRNA-based models can predict the prognosis of CRC patients (10–12). However, no ARlncRNA-based model has been established for predicting the prognosis of CRC patients. One study showed that an ARlncRNA-based model can predict the prognosis of patients with lung adenocarcinoma (20). In this study, we established an ARlncRNA-based model to predict the survival of CRC patients for the first time. We performed univariate analysis and obtained 32 prognostic ARlncRNAs from 612 tissue samples from TCGA and then performed multivariate Cox regression analysis to build a risk score model of nine significant prognostic ARlncRNAs (NKILA, LINC00174, AC008760.1, LINC02041, PCAT6, AC156455.1, LINC01503, LINC00957, and CD27-AS1). Next, we calculated the risk score for each CRC patient based on this model. Survival analysis showed that the 5-year OS was significantly higher in the low-risk group (risk score < 0.943) than in the high-risk group. A multivariate ROC curve showed that the model had high sensitivity and accuracy in predicting the 5-year OS rate (AUC = 0.717). Moreover, the risk score from this model, based on nine ARlncRNAs, was an independent predictor of CRC.
LINC01503 is an ARlncRNA that we screened that is negatively correlated with patient prognosis. Previous studies have shown that LINC01503 is highly expressed in CRC cell lines. LINC01503 overexpression promotes CRC proliferation and invasion, while LINC01503 silencing inhibits CRC proliferation and invasion. Moreover, LINC01503 regulates CRC proliferation and invasion via the miR-4492/FOXK1 signaling pathway (31). In gastric cancer and brain glioma, LINC01503 promotes tumor proliferation and invasion via the Wnt signaling pathway (32, 33). Using bioinformatics analysis, we concluded that LINC01503 is an autophagy-related prognostic predictor for CRC, but further research is needed to investigate the mechanism by which LINC01503 regulates tumor biological behaviors via autophagy pathways.
Numerous studies have shown that PCAT6 also plays an important role in tumor proliferation and invasion, such as in non-small cell lung cancer (34–36), breast cancer (37), cervical cancer (38, 39), and liver cancer (40, 41). Furthermore, PCAT6, a lncRNA, is highly expressed in colon cancer and is closely related to tumor malignancy. High PCAT6 expression is associated with low survival. PCAT6 activates the expression of antiapoptotic ARC and inhibits colon cancer cell apoptosis by increasing EZH2 expression (42). This study showed that PCAT6 is negatively correlated with the prognosis of CRC patients. Moreover, this study showed that PCAT6 is associated with autophagy and that PCAT6 probably increases tumor malignancy via autophagy pathways. Therefore, PCAT6 may regulate tumor biological behaviors through different molecular mechanisms, but research on autophagy pathways is still lacking. Another study showed that PCAT6 is an adverse prognostic predictor of CRC. Moreover, PCAT6 inhibits miR-204 expression, thereby promoting activation of the HMGA2/PI3K pathway and enhancing 5-FU resistance in CRC (43). Further research is needed to investigate additional mechanisms through which PCAT6 affects the biological behaviors of CRC.
Colorectal cancer patients with overexpression of LINC00174 have a poor prognosis. Overexpression of LINC00174 promotes the proliferation, migration, and invasion of colorectal cancer cells by regulating Mir-1910-3p/TAZ and Mir-3127-5p/E2F7 signaling pathways (44, 45). LINC00174, as an autophagy-related lncRNA, secreted by vascular endothelial cells, inhibits autophagy by SRSF1/P53 signaling pathway, which can alleviate myocardial insulin–reperfusion injury (46). In addition, NKILA can enhance autophagy of HK2 cells through Mir-140-5p/CLDN2/LPS pathway to induce acute kidney injury (47). In our research, we found that NKILA and LINC00174 were related to autophagy in colorectal cancer. However, at present, no study has found whether LINC00174 and NKILA can affect the occurrence and development of colorectal cancer through autophagy, which will also be the focus of our follow-up research.
5 Conclusion
We constructed a novel prediction model based on nine ARlncRNAs to predict the prognosis of CRC patients. Moreover, we verified the relationship among LINC00174, NKILA, and autophagy in colorectal cancer cells. Our results provide new ideas for further research on potential mechanisms involved in regulating the biological behaviors of CRC.
5.1 Limitations
The prediction model based on nine ARlncRNAs has some limitations. First, no prospective studies have been conducted to confirm its reliability. Second, while we plotted the complex interactive networks between ARlncRNAs and mRNAs, we did not perform in-depth pathway research. Last, we did not consider each patient’s treatment plan in this study, which may affect the study results. In summary, few studies have been conducted to investigate the use of ARlncRNAs to predict the prognosis of patients with CRC and how ARlncRNAs regulate autophagy. In the future, well-designed, randomized, controlled trials are needed to validate the reliability of this model.
Data Availability Statement
Publicly available datasets were analyzed in this study. This data can be found here: The Cancer Genome Atlas (https://portal.gdc.cancer.gov/repository), the Ensembl database (https://asia.ensembl.org/index.html), and the Human Autophagy database (http://www.autophagy.lu/clustering/index.html).
Ethics Statement
Ethical review and approval was not required for the study on human participants in accordance with the local legislation and institutional requirements. Written informed consent for participation was not required for this study in accordance with the national legislation and the institutional requirements.
Author Contributions
WX: fundraising. WX, YS, and JD: revision and confirmation of final manuscript. GX and MY: validation in vitro and manuscript revision. GX, QW, SZ, and LZhao: data analysis and drafting of manuscript. LZhu, TX, and RC: data collection and collation. CL and QL: optimize and organize pictures. All authors contributed to the article and approved the submitted version.
Funding
This study was supported by “Ten Thousand Plan” Youth Talent Project in Yunnan Province and Innovation Fund project of Graduate Student in Kunming Medical University (2021S242).
Conflict of Interest
The authors declare that the research was conducted in the absence of any commercial or financial relationships that could be construed as a potential conflict of interest.
Publisher’s Note
All claims expressed in this article are solely those of the authors and do not necessarily represent those of their affiliated organizations, or those of the publisher, the editors and the reviewers. Any product that may be evaluated in this article, or claim that may be made by its manufacturer, is not guaranteed or endorsed by the publisher.
Acknowledgments
Thanks to the bioinformatics self-study network for providing part of the code and thanks to TGCA for providing the data.
Supplementary Material
The Supplementary Material for this article can be found online at: https://www.frontiersin.org/articles/10.3389/fonc.2021.613949/full#supplementary-material
Abbreviations
CRC, colorectal cancer; TNM, tumor–node–metastasis; OS, overall survival; lncRNA, long noncoding RNA; ARlncRNA, autophagy-related long noncoding RNA; HADb, Human Autophagy database; mRNA, messenger RNA; ROC, receiver operating characteristic; AUC, the area under the curve; GO, Gene Ontology; KEGG, Kyoto Encyclopedia of Genes and Genomes; qRT-PCR, quantitative real-time polymerase chain reaction; FISH, fluorescence in situ hybridization; mTOR, mammalian target of rapamycin; NEAT19, nuclear paraspeckle assembly transcript 1; 5-FU, 5-fluorouracil.
References
1. Sung H, Ferlay J, Siegel RL, Laversanne M, Soerjomataram I, Jemal A, et al. Global Cancer Statistics 2020: GLOBOCAN Estimates of Incidence and Mortality Worldwide for 36 Cancers in 185 Countries. CA Cancer J Clin (2021) 71:209–49. doi: 10.3322/caac.21660
2. Siegel RL, Miller KD, Fedewa SA, Ahnen DJ, Meester RGS, Barzi A, et al. Colorectal Cancer Statistics, 2017. CA Cancer J Clin (2017) 67:177–93. doi: 10.3322/caac.21395
3. Brito MJ, Honavar M, Cipriano MA, Lopes J, Coelho H, Silva AR, et al. Molecular Staging of Patients With Colon Cancer. The C-Closer-II Study: A Multicentre Study in Portugal. Acta Med Port (2018) 31:661–9. doi: 10.20344/amp.9696
4. Huang L, Fang J, Wu J, Zhou X, Wei H. Prognostic Value of Combining Preoperative Serum Tumor Markers and Peripheral Blood Routine Indexes in Patients With Colorectal Cancer. Zhonghua Wei Chang Wai Ke Za Zhi (2018) 21:1421–6. doi: 10.3760/cma.j.issn.1671-0274.2018.12.016
5. Clark MB, Mattick JS. Long Noncoding RNAs in Cell Biology. Semin Cell Dev Biol (2011) 22:366–76. doi: 10.1016/j.semcdb.2011.01.001
6. Cui S, Yang X, Zhang L, Zhao Y, Yan W. LncRNA MAFG-AS1 Promotes the Progression of Colorectal Cancer by Sponging miR-147b and Activation of NDUFA4. Biochem Biophys Res Commun (2018) 506:251–8. doi: 10.1016/j.bbrc.2018.10.112
7. Qiao L, Liu X, Tang Y, Zhao Z, Zhang J, Liu H. Knockdown of Long non-Coding RNA Prostate Cancer-Associated ncRNA Transcript 1 Inhibits Multidrug Resistance and C-Myc-Dependent Aggressiveness in Colorectal Cancer Caco-2 and HT-29 Cells. Mol Cell Biochem (2018) 441:99–108. doi: 10.1007/s11010-017-3177-8
8. Shan Z, An N, Qin J, Yang J, Sun H, Yang W. Long Non-Coding RNA Linc00675 Suppresses Cell Proliferation and Metastasis in Colorectal Cancer via Acting on miR-942 and Wnt/β-Catenin Signaling. BioMed Pharmacother (2018) 101:769–76. doi: 10.1016/j.biopha.2018.02.123
9. Yu C, Sun J, Leng X, Yang J. Long Noncoding RNA SNHG6 Functions as a Competing Endogenous RNA by Sponging miR-181a-5p to Regulate E2F5 Expression in Colorectal Cancer. Cancer Manag Res (2019) 11:611–24. doi: 10.2147/cmar.S182719
10. Liu Y, Liu B, Jin G, Zhang J, Wang X, Feng Y, et al. An Integrated Three-Long Non-Coding RNA Signature Predicts Prognosis in Colorectal Cancer Patients. Front Oncol (2019) 9:1269. doi: 10.3389/fonc.2019.01269
11. Li S, Chen S, Wang B, Zhang L, Su Y. And Zhang X. A Robust 6-lncRNA Prognostic Signature for Predicting the Prognosis of Patients With Colorectal Cancer Metastasis. Front Med (Lausanne) (2020) 7:56. doi: 10.3389/fmed.2020.00056
12. Yang H, Lin HC, Liu H, Gan D, Jin W, Cui C, et al. A 6 lncRNA-Based Risk Score System for Predicting the Recurrence of Colon Adenocarcinoma Patients. Front Oncol (2020) 10:81. doi: 10.3389/fonc.2020.00081
13. Levine B, Klionsky DJ. Development by Self-Digestion: Molecular Mechanisms and Biological Functions of Autophagy. Dev Cell (2004) 6:463–77. doi: 10.1016/s1534-5807(04)00099-1
14. Klionsky DJ, Abdelmohsen K, Abe A, Abedin MJ, Abeliovich H, Acevedo Arozena A, et al. Guidelines for the Use and Interpretation of Assays for Monitoring Autophagy (3rd Edition). Autophagy (2016) 12:1–222. doi: 10.1080/15548627.2015.1100356
15. Mah LY, Ryan KM. Autophagy and Cancer. Cold Spring Harb Perspect Biol (2012) 4:a008821. doi: 10.1101/cshperspect.a008821
16. Mokarram P, Albokashy M, Zarghooni M, Moosavi MA, Sepehri Z, Chen QM, et al. New Frontiers in the Treatment of Colorectal Cancer: Autophagy and the Unfolded Protein Response as Promising Targets. Autophagy (2017) 13:781–819. doi: 10.1080/15548627.2017.1290751
17. Xiong W, Liao Y, Qin J-Y, Li W-H, Tang Z-Y. Adverse Effects of Chemoradiotherapy on Invasion and Metastasis of Tumor Cells. Genes Dis (2020) 7:351–8. doi: 10.1016/j.gendis.2020.04.004
18. Hu D, Jiang L, Luo S, Zhao X, Hu H, Zhao G, et al. Development of an Autophagy-Related Gene Expression Signature for Prognosis Prediction in Prostate Cancer Patients. J Transl Med (2020) 18:160. doi: 10.1186/s12967-020-02323-x
19. Yang H, Han M, Li H. Construction and Validation of an Autophagy-Related Prognostic Risk Signature for Survival Predicting in Clear Cell Renal Cell Carcinoma Patients. Front Oncol (2020) 10:707. doi: 10.3389/fonc.2020.00707
20. Zhou M, Shao W, Dai H. And Zhu X. A Robust Signature Based on Autophagy-Associated LncRNAs for Predicting Prognosis in Lung Adenocarcinoma. BioMed Res Int (2020) 2020:3858373. doi: 10.1155/2020/3858373
21. Alizadeh AA, Gentles AJ, Alencar AJ, Liu CL, Kohrt HE, Houot R, et al. Prediction of Survival in Diffuse Large B-Cell Lymphoma Based on the Expression of 2 Genes Reflecting Tumor and Microenvironment. Blood (2011) 118:1350–8. doi: 10.1182/blood-2011-03-345272
22. Zhang XQ, Sun S, Lam KF, Kiang KM, Pu JK, Ho AS, et al. A Long non-Coding RNA Signature in Glioblastoma Multiforme Predicts Survival. Neurobiol Dis (2013) 58:123–31. doi: 10.1016/j.nbd.2013.05.011
23. Wei H, Yang Z, Lin B. Overexpression of Long non Coding RNA CA3-AS1 Suppresses Proliferation, Invasion and Promotes Apoptosis via miRNA-93/PTEN Axis in Colorectal Cancer. Gene (2019) 687:9–15. doi: 10.1016/j.gene.2018.11.008
24. Wu K, Zhang N, Ma J, Huang J, Chen J, Wang L, et al. Long Noncoding RNA FAL1 Promotes Proliferation and Inhibits Apoptosis of Human Colon Cancer Cells. IUBMB Life (2018) 70:1093–100. doi: 10.1002/iub.1880
25. Wang Z, Jin J. LncRNA SLCO4A1-AS1 Promotes Colorectal Cancer Cell Proliferation by Enhancing Autophagy via miR-508-3p/PARD3 Axis. Aging-Us (2019) 11:4876–89. doi: 10.18632/aging.102081
26. Zheng Y, Tan K, Huang H. Long Noncoding RNA HAGLROS Regulates Apoptosis and Autophagy in Colorectal Cancer Cells via Sponging miR-100 to Target ATG5 Expression. J Cell Biochem (2019) 120:3922–33. doi: 10.1002/jcb.27676
27. Si Y, Yang Z, Ge Q, Yu L, Yao M, Sun X, et al. Long Non-Coding RNA Malat1 Activated Autophagy, Hence Promoting Cell Proliferation and Inhibiting Apoptosis by Sponging miR-101 in Colorectal Cancer. Cell Mol Biol Lett (2019) 24:50. doi: 10.1186/s11658-019-0175-8
28. Liu F, Ai F-Y, Zhang D-C, Tian L, Yang Z-Y, Liu S-J. LncRNA NEAT1 Knockdown Attenuates Autophagy to Elevate 5-FU Sensitivity in Colorectal Cancer via Targeting miR-34a. Cancer Med (2020) 9:1079–91. doi: 10.1002/cam4.2746
29. Wang M, Han D, Yuan Z, Hu H, Zhao Z, Yang R, et al. Long non-Coding RNA H19 Confers 5-Fu Resistance in Colorectal Cancer by Promoting SIRT1-Mediated Autophagy. Cell Death Dis (2018) 9:1149. doi: 10.1038/s41419-018-1187-4
30. Han Y, Zhou S, Wang X, Mao E, Huang L. SNHG14 Stimulates Cell Autophagy to Facilitate Cisplatin Resistance of Colorectal Cancer by Regulating miR-186/ATG14 Axis. Biomed Pharmacother (2020) 121:109580. doi: 10.1016/j.biopha.2019.109580
31. Lu SR, Li Q, Lu JL, Liu C, Xu X, Li JZ. Long Non-Coding RNA LINC01503 Promotes Colorectal Cancer Cell Proliferation and Invasion by Regulating miR-4492/FOXK1 Signaling. Exp Ther Med (2018) 16:4879–85. doi: 10.3892/etm.2018.6775
32. Wang H, Sheng ZG, Dai LZ. Long non-Coding RNA LINC01503 Predicts Worse Prognosis in Glioma and Promotes Tumorigenesis and Progression Through Activation of Wnt/β-Catenin Signaling. Eur Rev Med Pharmacol Sci (2019) 23:1600–9. doi: 10.26355/eurrev_201902_17119
33. Ding J, Shi F, Xie G, Zhu Y. Long Non-Coding RNA LINC01503 Promotes Gastric Cancer Cell Proliferation and Invasion by Regulating Wnt Signaling. Dig Dis Sci (2020) 66:452–9. doi: 10.1007/s10620-020-06215-4
34. Wan L, Zhang L, Fan K, Wang JJ. Diagnostic Significance of Circulating Long Noncoding RNA PCAT6 in Patients With non-Small Cell Lung Cancer. Onco Targets Ther (2017) 10:5695–702. doi: 10.2147/ott.S149314
35. Cui LH, Xu HR, Yang W, Yu LJ. lncRNA PCAT6 Promotes non-Small Cell Lung Cancer Cell Proliferation, Migration and Invasion Through Regulating miR-330-5p. Onco Targets Ther (2018) 11:7715–24. doi: 10.2147/ott.S178597
36. Shi X, Liu Z, Liu Z, Feng X, Hua F, Hu X, et al. Long Noncoding RNA PCAT6 Functions as an Oncogene by Binding to EZH2 and Suppressing LATS2 in non-Small-Cell Lung Cancer. EBioMedicine (2018) 37:177–87. doi: 10.1016/j.ebiom.2018.10.004
37. Shi R, Wu P, Liu M, Chen B, Cong L. Knockdown of lncRNA PCAT6 Enhances Radiosensitivity in Triple-Negative Breast Cancer Cells by Regulating miR-185-5p/TPD52 Axis. Onco Targets Ther (2020) 13:3025–37. doi: 10.2147/ott.S237559
38. Lv XJ, Tang Q, Tu YQ, Yan DD, Wei QC. Long Noncoding RNA PCAT6 Regulates Cell Growth and Metastasis via Wnt/β-Catenin Pathway and Is a Prognosis Marker in Cervical Cancer. Eur Rev Med Pharmacol Sci (2019) 23:1947–56. doi: 10.26355/eurrev_201903_17233
39. Ma Z, Gu G, Pan W, Chen X. LncRNA PCAT6 Accelerates the Progression and Chemoresistance of Cervical Cancer Through Up-Regulating ZEB1 by Sponging miR-543. Onco Targets Ther (2020) 13:1159–70. doi: 10.2147/ott.S232354
40. Chen S, Chen Y, Qian Q, Wang X, Chang Y, Ju S, et al. Gene Amplification Derived a Cancer-Testis Long Noncoding RNA PCAT6 Regulates Cell Proliferation and Migration in Hepatocellular Carcinoma. Cancer Med (2019) 8:3017–25. doi: 10.1002/cam4.2141
41. Luo Y, Lin J, Zhang Y, Dai G, Li A, Liu X. LncRNA PCAT6 Predicts Poor Prognosis in Hepatocellular Carcinoma and Promotes Proliferation Through the Regulation of Cell Cycle Arrest and Apoptosis. Cell Biochem Funct (2020) 38:895–4. doi: 10.1002/cbf.3510
42. Huang W, Su G, Huang X, Zou A, Wu J, Yang Y, et al. Long Noncoding RNA PCAT6 Inhibits Colon Cancer Cell Apoptosis by Regulating Anti-Apoptotic Protein ARC ExpressionVia EZH2. Cell Cycle (2019) 18:69–83. doi: 10.1080/15384101.2018.1558872
43. Wu H, Zou Q, He H, Liang Y, Lei M, Zhou Q, et al. Long non-Coding RNA PCAT6 Targets miR-204 to Modulate the Chemoresistance of Colorectal Cancer Cells to 5-Fluorouracil-Based Treatment Through HMGA2 Signaling. Cancer Med (2019) 8:2484–95. doi: 10.1002/cam4.1809
44. Ma Y, Li Y, Tang Y, Tang N, Wang D, Li X. LINC00174 Facilitates Proliferation and Migration of Colorectal Cancer Cells via miR-3127-5p/E2F7 Axis. J Microbiol Biotechnol (2021) 31:1098–108. doi: 10.4014/jmb.2103.03001
45. Shen Y, Gao X, Tan W, Xu T. STAT1-Mediated Upregulation of lncRNA LINC00174 Functions a ceRNA for miR-1910-3p to Facilitate Colorectal Carcinoma Progression Through Regulation of TAZ. Gene (2018) 666:64–71. doi: 10.1016/j.gene.2018.05.001
46. Su Q, Lv XW, Xu YL, Cai RP, Dai RX, Yang XH, et al. Exosomal LINC00174 Derived From Vascular Endothelial Cells Attenuates Myocardial I/R Injury via P53-Mediated Autophagy and Apoptosis. Mol Ther Nucleic Acids (2021) 23:1304–22. doi: 10.1016/j.omtn.2021.02.005
47. Han D, Fang R, Shi R, Jin Y, Wang Q. LncRNA NKILA Knockdown Promotes Cell Viability and Represses Cell Apoptosis, Autophagy and Inflammation in Lipopolysaccharide-Induced Sepsis Model by Regulating miR-140-5p/CLDN2 Axis. Biochem Biophys Res Commun (2021) 559:8–14. doi: 10.1016/j.bbrc.2021.04.074
Keywords: colorectal cancer, autophagy, long noncoding RNAs, risk score, prognostic prediction model
Citation: Xu G, Yang M, Wang Q, Zhao L, Zhu S, Zhu L, Xu T, Cao R, Li C, Liu Q, Xiong W, Su Y and Dong J (2021) A Novel Prognostic Prediction Model for Colorectal Cancer Based on Nine Autophagy-Related Long Noncoding RNAs. Front. Oncol. 11:613949. doi: 10.3389/fonc.2021.613949
Received: 04 October 2020; Accepted: 14 September 2021;
Published: 08 October 2021.
Edited by:
Fenglin Liu, Fudan University, ChinaCopyright © 2021 Xu, Yang, Wang, Zhao, Zhu, Zhu, Xu, Cao, Li, Liu, Xiong, Su and Dong. This is an open-access article distributed under the terms of the Creative Commons Attribution License (CC BY). The use, distribution or reproduction in other forums is permitted, provided the original author(s) and the copyright owner(s) are credited and that the original publication in this journal is cited, in accordance with accepted academic practice. No use, distribution or reproduction is permitted which does not comply with these terms.
*Correspondence: Wei Xiong, cGFuZGFfd2VpX3dlaUAxNjMuY29t; Yan Su, MTAyMzQ0NTQ2NkBxcS5jb20=; Jian Dong, eW5zemx5eWRqQDE2My5jb20=
†ORCID: Guoqiang Xu, orcid.org/0000-0003-3708-4167
Qiaoli Wang, orcid.org/0000-0003-3709-9166
‡These authors have contributed equally to this work