 Ling Liu1Jinghua Feng1,2Julian Polimeni1Manli Zhang3Hai Nguyen1Urmi Das1Xu Zhang4Harminder Singh5Xiao-Jian Yao4Etienne Leygue6Sam K. P. Kung3
 Jiuyong Xie1*
- 1Department of Physiology & Pathophysiology, Max Rady College of Medicine, Rady Faculty of Health Sciences, University of Manitoba, Winnipeg, MB, Canada
- 2Department of Obstetrics and Gynaecology, College of Medicine, Guangxi University of Science & Technology, Guangxi, China
- 3Department of Immunology, Max Rady College of Medicine, Rady Faculty of Health Sciences, University of Manitoba, Winnipeg, MB, Canada
- 4Department of Medical Microbiology & Infectious Diseases, Max Rady College of Medicine, Rady Faculty of Health Sciences, University of Manitoba, Winnipeg, MB, Canada
- 5Department of Medicine, Max Rady College of Medicine, Rady Faculty of Health Sciences, University of Manitoba, Winnipeg, MB, Canada
- 6Department of Biochemistry & Medical Genetics, Max Rady College of Medicine, Rady Faculty of Health Sciences, University of Manitoba, Winnipeg, MB, Canada
Circulating cell-free methyl-DNA (mcfDNA) contains promising cancer markers but its low abundance and possibly diverse origin pose challenges toward the accurate diagnosis of early stage cancers. By whole-genome bisulfite sequencing (WGBS) of cell-free DNA (cfDNA) from about 0.5 mL plasma of mice xenografted with human tumors, we obtained and aligned the reads to the human genome, filtered out the mouse and carrier bacterial sequences, and confirmed the tumor origin of methyl-cfDNA (mctDNA) by methylation-sensitive restriction enzyme digestion prior to species-specific PCR. We estimated that human tumor-specific reads (ctDNA) or mctDNA comprised about 0.29 or 0.01%, respectively of the xenograft mouse cfDNA, and about 0.029 or 0.001% of the cfDNA of human early stage cancer patients. Similar WGBS of early stage (0-II, node- and metastasis-free) breast, lung or colorectal cancer samples identified hundreds of specific DMRs (differentially methylated regions) compared to healthy controls. Their association with tumourigenesis was supported by stage-dependent methylation, tumor suppressor or oncogene clusters, and genes also identified in the xenograft samples. Using 20 three-cancer-common and 17 colorectal cancer-specific DMRs in combination (top 0.0018% of the WGBS methylation clusters) was sufficient to distinguish the stage I colorectal cancers from breast and lung cancers and healthy controls. Our data thus confirmed the tumor origin of mctDNA by sequence specificity, and provide a selection threshold for authentic tumor mctDNA markers toward precise diagnosis of early stage cancers solely by top DMRs in combination.
Introduction
Cancer is a leading cause of death worldwide, with lung, colorectal and breast cancers among the deadliest (1). The identification of highly specific and sensitive blood markers from the cell-free methyl-DNA of early stage cancers has drawn much attention for its potential to lower mortality and improve cancer management. Nevertheless, the low abundance and possibly multiple origins of these markers have limited their clinical application, especially for accurate early stage diagnosis (2–5).
Cell-free DNA (cfDNA) fragments renew quickly in the blood (half-life: 16 min to 3 h) and thus in cancer patients are likely to contain up-to-date changes in tumourigenesis (6–8). Tumor-derived cfDNA (ctDNA) could be identified by tumor-specific mutations and methylated ctDNA (mctDNA) by differential methylation between cancer and healthy controls (5). Mutations can be easily distinguished from somatic wild type sequences, but their low frequency in cancer patients and presence in healthy individuals limit successful identification to only a small group of individuals (9); therefore, they have been used in combination with other markers, such as proteins, for higher coverage diagnosis (10–12). In contrast, some mctDNA changes seem to be cancer-specific and much more prevalent among patients. For example, hypermethylation of SEPT9 is detectable in the plasma of 79.3% of stage III and 93.9% of stage IV colorectal cancers (13, 14). More importantly, certain mctDNA changes are detectable in early stage cancers (15), opening possibilities for earlier diagnosis.
In recent years, genome-wide cfDNA methylation profiles have been explored for tumor detection through whole-genome bisulfite sequencing (WGBS) (16), or bisulfite-free techniques (17), with high sensitivity and specificity for cancers in mixed or late stages. The genome-wide analysis of mctDNA is thus promising for non-invasive cancer detection. However, for early stage cancers, the sensitivity is still low, 18% for stage I and 43% for stage II of more than 50 cancer types using a hybridization capture panel of 103,456 methylation regions (18). Relevant but unanswered questions include how we could make sure that methyl-DNA markers are not of non-tumor origins [e.g., inflammatory/autoimmune responses or diabetes (2–5)], and what their abundance is in the plasma DNA (as a threshold reference for marker selection). Answering these questions with clear sequence data would help guide the selection of authentic methylation markers at certain thresholds toward precise early diagnosis.
Xenograft tumor models have been used for studying metastasis and therapeutic drug effects (19–21), which often share strong epigenetic similarities with primary tumors (22). Tumor-specific ctDNA, if present in the xenografted mouse plasma, is identifiable based on species differences between human and mouse DNA sequences (23). Bisulfite deep sequencing could not only identify these sequences but also their methylation status at a single cytosine resolution. We thus first used WGBS to confirm the tumor origin and abundance of ctDNA and mctDNA in the blood plasma of mice xenografted with human tumors. We then applied the WGBS approach and its ctDNA abundance threshold to identify a small group of differentially methylated regions (DMRs) of mctDNA in patients with early stage (0-II) breast, colorectal or lung cancer, clearly distinguishing the colorectal cancers from the other cancers and healthy controls by using only the top DMRs in combination.
Materials and Methods
Cell Culture
The human breast cancer MDA-MB-231 cells (ATCC, VA, USA) were grown adherently in RPMI-1,640 medium supplemented with 10% fetal bovine serum and 1% Penicillin-Streptomycin-Glutamine in a humidified 37°C incubator with 5% CO2. Adherent cells were collected using Trypsin-EDTA (0.05%) (ThermoFisher, MA, USA).
Xenograft Mouse Model of Human Breast Cancer, and Cell-Free Plasma Preparation
RAG-2−/−γc−/− double-knockout mice were obtained from Dr. Kees Weijer (24), under the MTA from Netherlands Cancer Institute, and were housed in the animal facility at the University of Manitoba. Animal maintenance was performed in accordance with the animal care guidelines of the University of Manitoba, Canada. All the animal experiments (under the animal protocol by S.K.P.K) were approved by the Animal Care and ethical Committee of the University of Manitoba, Canada. Four female mice (over 8 weeks old) were injected with 5 × 10⁶ MDA-MD-231 cells, at the mammary gland fat pads on the lower abdomen and grown for 2–3 weeks until the nodular eminences reached 3–6 mm in diameter. At the end of the experiment, the animals were euthanized and nodular eminences and whole blood samples (collected by heart puncture) were collected for plasma DNA extraction. Briefly, ~1 ml of whole blood was collected into an EDTA tube for each mouse by heart puncture.
For cell-free plasma preparation from xenograft mice, the fresh whole blood samples were immediately diluted with phosphate-buffered saline (PBS, blood:PBS = 1:2), then the diluted blood was carefully transferred to the top of the GE Healthcare Ficoll-Paque™ PLUS media (Fisher Scientific, Ficoll-Paque medium: blood dilution = 1: 2) in a 15 ml tube. The whole blood was separated into different layers after centrifugation for 25 min at 1,400 rpm using a refrigerated centrifuge. Plasma was carefully collected from the top layer and then filtered by a 0.45 μm filter (Pall Acrodisc® Sterile Syringe Filters with Supor® Membrane, Pall Laboratory, VWR) to remove any intact cells. All steps were processed on ice.
Fresh cell-free plasma samples from healthy individuals were extracted as above. Fresh frozen EDTA plasma (around 1 ml) from patients with breast cancer, colorectal cancer and lung cancer without reported complications of inflammatory/immune diseases or diabetes were obtained from the Ontario Tumor Bank, which is funded by the Ontario Institute for Cancer Research, Toronto, Ontario. The criteria for choosing cell-free plasma samples from cancer patients are: (1) blood drawn pre-operatively before tumor removal; (2) blood processed within <4 h; (3) pre-treatment for cancer: none; (4) TNM stage: T1-3, node negative and metastases negative; (5) anatomical stages: 0 – II; (6) histology: the same in one type of cancer; (7) sex: half female, half male; and (8) age: variable, covering different age groups. The first five conditions were strictly applied, with the last three considered as much as possible depending on the availability of samples from the Ontario Tumor Bank at the start of the experiment. All cell-free plasma samples were stored at −80°C before cfDNA extraction.
DNA Extraction
Cell-free plasma samples were thawed in 4°C cold room and then filtered using 0.45 μm filters to remove potential residual cell debris. cfDNA was extracted from the cell-free plasma samples on ice using GenElute™ Plasma/Serum Cell-Free Circulating DNA Purification Midi Kit (Sigma-Aldrich). Genomic DNA (gDNA) of xenograft tumors was extracted from the fresh nodular eminence tissues of each mouse using DNeasy Blood and Tissue Kits (Qiagen).
The gDNA from breast cancer patients included a small subset of six invasive breast cancer samples (node negative tumor, estrogen receptor positive) that was obtained from the Manitoba Breast Tumor Bank (MBTB), which operates with the approval of the Faculty of Medicine, University of Manitoba, Research Ethics Board. Genomic DNA from frozen tissue sections was extracted using InvitrogenTM TrizolTM Reagent (Cat# 15596026, Fisher Scientific, Pittsburgh, PA), according to the manufacturer's instruction. All DNA samples were stored at −20°C.
Whole-Genome Bisulfite Sequencing (WGBS), BSMAP and BSmooth Analysis
Half of the plasma cfDNA samples from xenograft mice (2–12.8 ng mouse cfDNA each) were used, together with methyltransferase deficient E. coli [NEB C2925I, genotype: ara-14 leuB6 fhuA31 lacY1 tsx78 glnV44 galK2 galT22 mcrA dcm-6 hisG4 rfbD1 R (zgb210::Tn10) TetS endA1 rspL136 (StrR) dam13::Tn9 (CamR) xylA-5 mtl-1 thi-1 mcrB1 hsdR2] DNA where indicated. Twelve PCR cycles were performed to generate bisulfite-converted libraries using the NEB Ultra II kit, to yield four libraries of 25.8 ng (±18), at the McGill Quebec Genome Center. Due to the low yield, much less than the required 1,000 ng for CpG island capture, only the second highest one (#S2, 12.8 ng in total) was used for the capture experiment using the SeqCap Epi 4M CpGiant enrichment system (Roche Co.), resulting in 0.42 ng/μl (qPCR concentration, 18.06 ng in total). On average, 58.3 M (±10.8) reads were obtained from each sample by Illumina HiSeq 2,500 sequencing.
Before reads mapping, the sequence quality was evaluated using FastQC (25). The adaptors and low-quality sequences were trimmed to 90 nt by Trimmomatic (26). We aligned the paired-end bisulfite sequencing reads to the reference genomes of Human (Homo sapiens hg 38.78), Mouse (Mus musculus GRCm 38.70) and E. coli (Escherichia coli str. K-12 substr. MG1655, NCBI: txid511145), respectively, using BSMAP (27) in the Whole Genome Bisulfite deep sequencing (WGBS) mode, allowing a maximum of 2 nt mismatches within the 90 nt T->C converted reads in the initial screen. For sequences aligned to the human genome, we eliminated those also found in either the mouse or E. coli genome. For those without a known overlapping gene, the IDs of genes within 10 kb of the reads were assigned as the associated gene ID. The gene ID was used to search for common genes among the four samples. After filtering for the gene ID without mismatches in the reads, 109 common genes were identified for DAVID functional analysis (28).
For plasma cfDNA from patients, WGBS was carried out following the same procedure described above, except using Illumina HiSeqX PE150 sequencing. The sequence quality was controlled by FastQC and the adaptors and low-quality sequences were trimmed and filtered by Trimmomatic. We identified DMRs with minimal 3 methylation sites between groups, using BSmooth (29). The patient samples were obtained following biosafety procedures from the Ontario Tumor Bank with ethical approval from the Health Research Ethics Board of the University of Manitoba.
Methylation-Sensitive Restriction Enzyme-PCR (MSRE-PCR)
Three hundred and fifty nanograms of genomic DNA were digested with isoschizomer restriction enzymes in a 25 ul reaction mixture, containing methylation-insensitive MspI (NEB, # R0171S) or methylation-sensitive HpaII (NEB, # R0106S), for 6 h. Fourteen nanograms of digested DNA were used to amplify target fragments by PCR in a 13 ul reaction mixture for 32 cycles. The target gene primers were designed to bind specifically to human sequences flanking the MspI/HpaII recognition sites (CCGG). Electrophoresis of the PCR products was performed in 2.5% agarose gels containing ethidium bromide (EtBr) and visualized with a digital camera under UV light. DNA methylation percentages were calculated by comparing the band intensities of HpaII-digested products to those without prior enzyme digestion.
Results
Confirmation of Tumor mctDNA by Their Human-Specific Sequences in Xenograft Mice
We identified mctDNA using xenograft mice by inoculating human breast cancer MDA-MD-231 cells into RAG-2−/−γc−/− double-knockout mice (Figure 1). Approximately 2 to 3 weeks later, when the tumors grew to 3–6mm in diameter, we collected about 1 mL of blood and the tumors from each mouse. Before cfDNA extraction, we filtered the fresh plasma through a 0.45 μm filter to remove any residual cells or their debris.
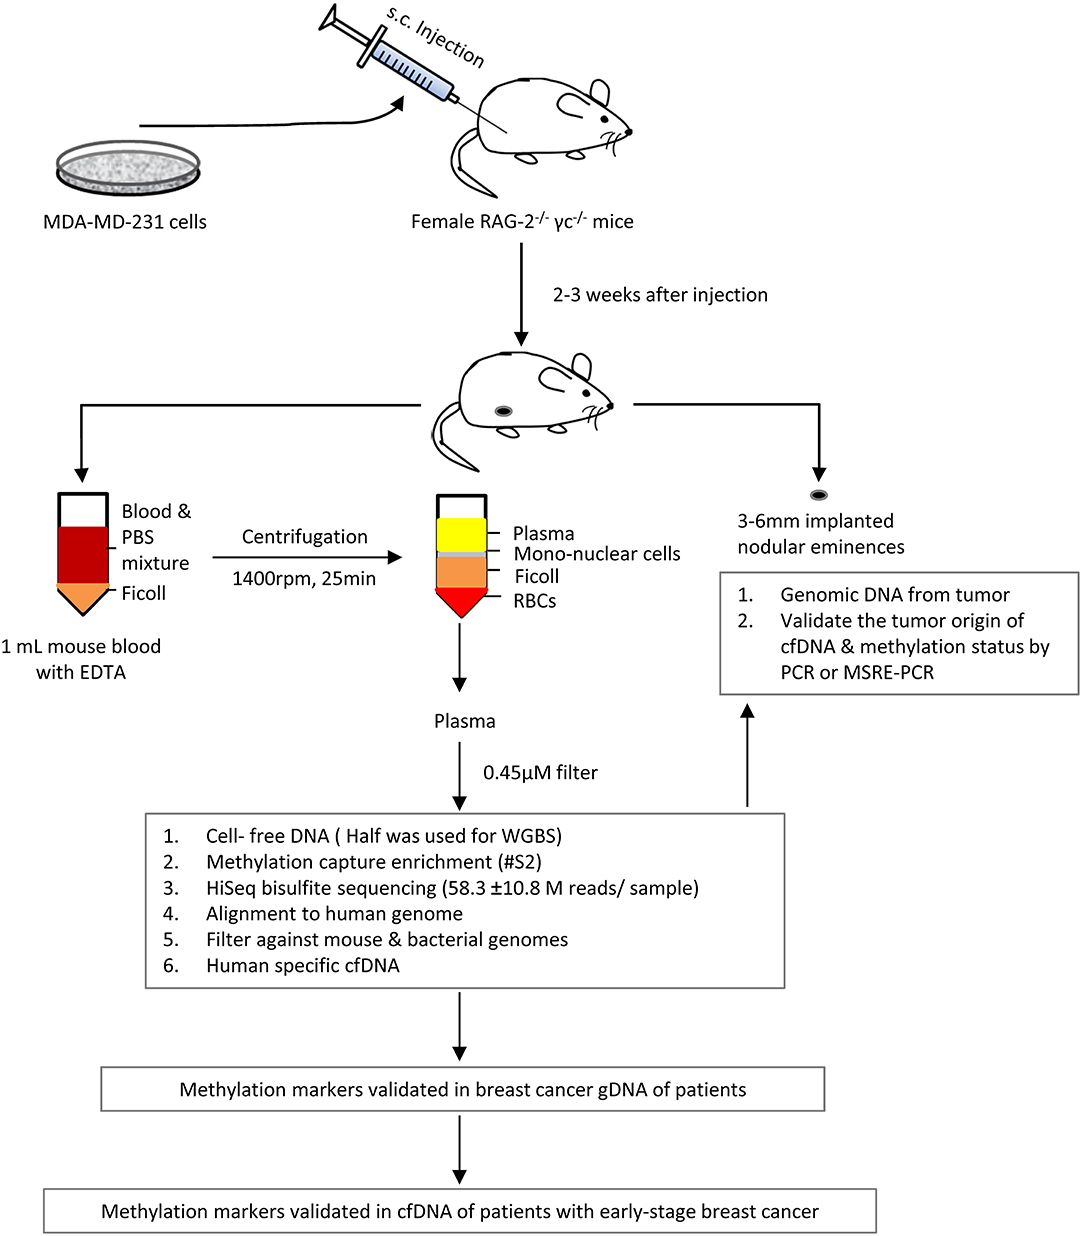
Figure 1. Outline of the identification of plasma cfDNA of tumor origin in mice xenografted with human breast cancer MDA-MD-231 cells, using whole genome bisulfite deep sequencing and/or methyl-DNA capture.
Half of the extracted DNA (2–12.8 ng) was used for HiSeq bisulfite sequencing to obtain 48.8–71.0 million paired reads (Supplementary Table 1), employing methyltransferase-deficient E. coli DNA as a carrier. After aligning the reads with the human genome using bisulfite sequence MAPping (BSMAP) (27), and filtering them against mouse and E. coli genomes, we obtained 0.13 million (± 0.03, average ± SEM, same as following, n = 4) human-specific sequences (ctDNA, Figure 2A), with a maximum of 2 nt mismatches permitted per read. Based on the human-specific paired reads, we estimated that the tumor-specific sequences/reads comprised 0.15–1.71% of cfDNA depending on whether a CpG enrichment step was applied [Supplementary Table 2, 0.29 (±0.07)% without or 1.71% with enrichment]. Moreover, addition of the E. coli carrier DNA appeared to have doubled the number of human-specific reads in samples S1 and S4 over S3, which had no carrier DNA.
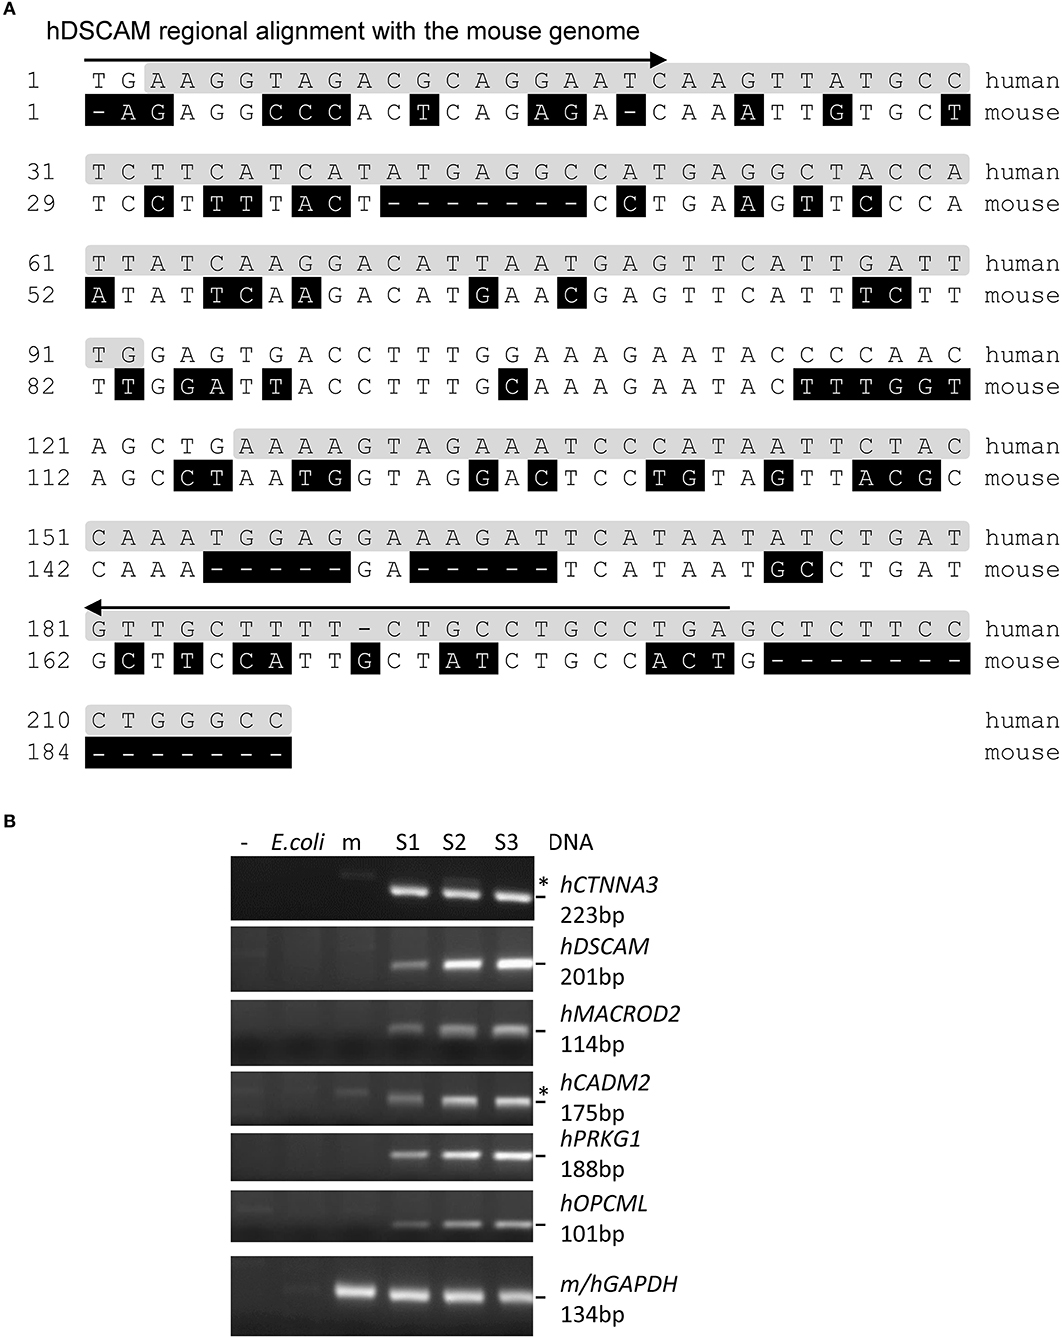
Figure 2. Examples of human-specific sequences of the WGBS reads. (A) Human-specific reads of a gene identified through WGBS of the xenografted mouse cfDNA. Arrow: PCR primer; shaded in gray: reads sequence identified by BSMAP; shaded in black: mismatch from human sequences. (B) Agarose gels of the PCR products of six successfully amplified genes from the S1–S3 tumors using human-specific primers (the S4 tumor DNA was accidentally lost during preparation). *:non-specific bands also present in the PCR negative control or mouse lanes. m: mouse; h: human. The GAPDH primers bind both mouse and human GAPDH.
The methyl-Cytosines of the reads (mC: mCG, mCHH or mCHG, H: A, C or T) were mapped mostly to the gene-rich regions of the 23 chromosomes (Supplementary Figure 1A), suggesting genome-wide coverage by the WGBS. We estimated the bisulfite conversion rate of unmethylated cytosines to be 99.66%, or a false-positive rate of 0.34% (±0.003%) in the WGBS by counting in total about 129 millions of C/T in the reads of the methylation-deficient E. coli DNA. Accordingly, the methylation rate (Supplementary Table 1) of the human sequences can be adjusted to about 3.5% of the cytosines of the human-specific reads without the CpG enrichment step and to about 40% with the enrichment. The 3.5% rate is slightly higher than the 2.66% (n = 4.76 millions of C/T counted) of the cfDNA reads mapped to the mouse genome, suggesting hypermethylation of the human ctDNA over the mouse cfDNA (p < 0.02). Additionally, ten of the mCs are shared by the four plasma DNA samples (Supplementary Figure 1B), including seven sites within a novel chromosome region (16p11.2–q11.2) not yet known associated with breast cancer. Overall, the BSMAP analysis allowed us to estimate the abundance of the methylated ctDNA (mctDNA) in the mouse plasma cfDNA at about 0.01% (0.29 × 3.5%), assuming even distribution of mCs among the reads.
To validate the tumor-specific sequence identity of the reads, we focused on sequences within or <10 kb from known Ensembl genes common to the four samples. There are 1,883–9,414 reads without any mismatch for 109 genes. We successfully amplified by PCR the target regions of nine top genes that have the highest numbers of reads, using human-specific primers in three clean tumor samples (Supplementary Tables 3, 4 and Figures 2, 3). All of them are specific to human and not mouse or E. coli DNA. This confirmed the tumor origin of these cfDNA.
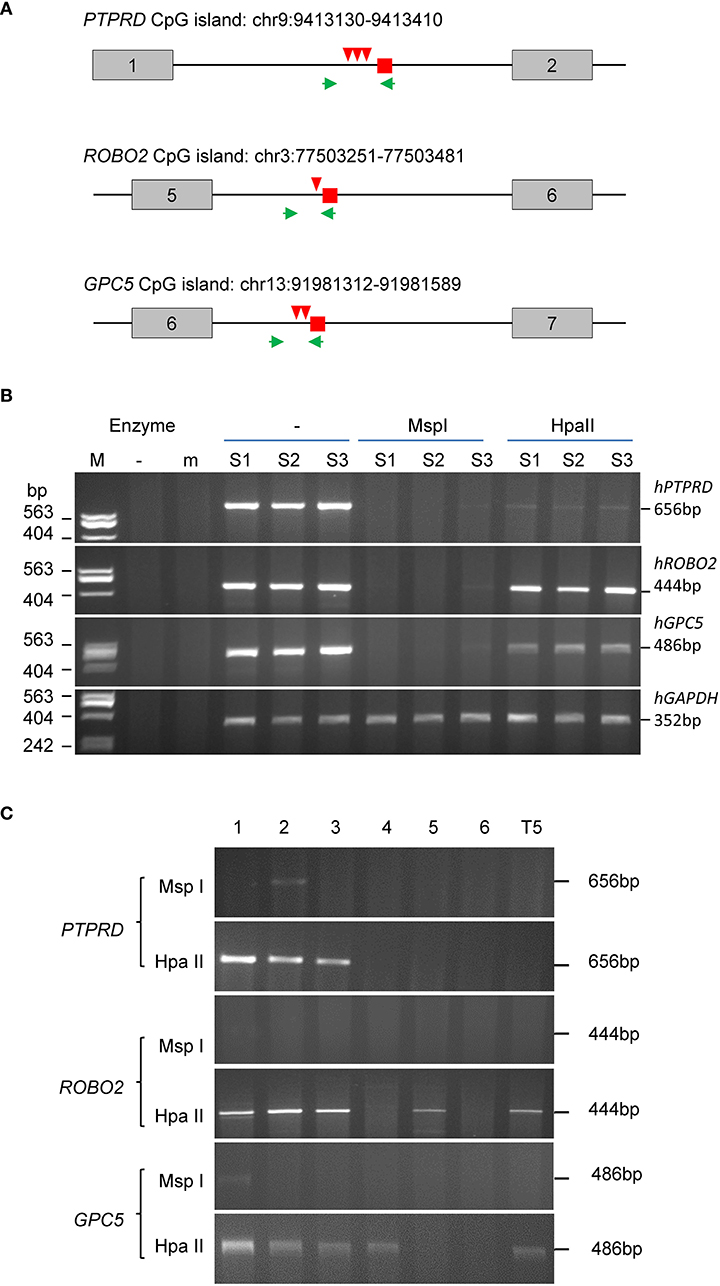
Figure 3. MSRE-PCR validation of methylated CpG DNA of human (tumor) origin. (A) Diagram of the reads location (small square), restriction sites (arrowheads) and PCR primer locations (arrows) relative to the exon (boxes) and intron (lines) locations in PTPRD, ROBO2 and GPC5. Above each gene diagram is the chromosomal location of the CpG island covered by the PCR. (B) Agarose gels of PCR and MSRE-PCR products. The tumor DNA samples were digested using the methylation insensitive MspI or the sensitive HpaII prior to PCR using the gene-specific primers. The GAPDH primers are human-specific. (C) Agarose gels of methylation-sensitive MSRE-PCR products of the methylated markers (PTPRD, ROBO2 and GPC5) from the gDNA of breast cancer tissues from node-negative patients. T5: lymphoblastoid cell line.
To verify their methylation status, we selected three genes that contain CCGG restriction enzyme sites within 500 bp of the reads, to carry out PCR from tumor genomic DNA pre-digested with methylation-insensitive MspI or methylation-sensitive HpaII (MSRE-PCR, Figure 3). The intensities of the PCR products suggest the DNA was almost completely digested by MspI and only partially by HpaII. The estimated methylation levels are: 69.10% (ROBO2), 35.24% (GPC5) and 2.71% (PTPRD). Moreover, the PTPRD and GPC5 levels represent the simultaneous methylation of 2 and 3 CCGG sites within the fragments, respectively (Figure 3A).
We further examined the methylation status of the three genes in a group of randomly selected breast tumors of node-negative patients (Figure 3C). Methylation was detected in PTPRD for three of six tumors and both ROBO2 and GPC5 for four of six tumors. The methylation of ROBO2 and GPC5 also occurred in the transformed lymphoblastoid cell line T5.
Therefore, our xenograft-WGBS experiment, which required as little as 2 ng of plasma cfDNA from 0.5 mL of mouse plasma, detected ~0.29% of cfDNA as ctDNA and 0.01% as mctDNA by confirming the sequence specificity and methylation status of representative fragments.
Identification of Tumor-Specific mctDNA by WGBS of cfDNA From Patients With Early Stage Cancers
To apply this sensitive sequencing approach and the ctDNA abundance threshold to identify mctDNA markers for early stage cancers of human patients (Figure 4), we estimated the human ctDNA threshold from the xenograft mice data by considering: (1) larger sizes of human than mouse tumor volumes in the experiment (332 times on average, Supplementary Tables 1, 5), and (2) higher blood volumes (3,333 times, human's 5,000 mL vs. mouse's 1.5 mL on average). The human ctDNA threshold is thus 0.029% (i.e., 0.29 × 332/3,333) and the mctDNA threshold 0.001% (i.e., 0.029 × 3.5%). We then obtained cfDNA from breast cancer (stages 0/I/II), colorectal cancer (stage I) and lung cancer (stage II) patients, as well as healthy controls, and carried out WGBS similarly (Supplementary Table 5).
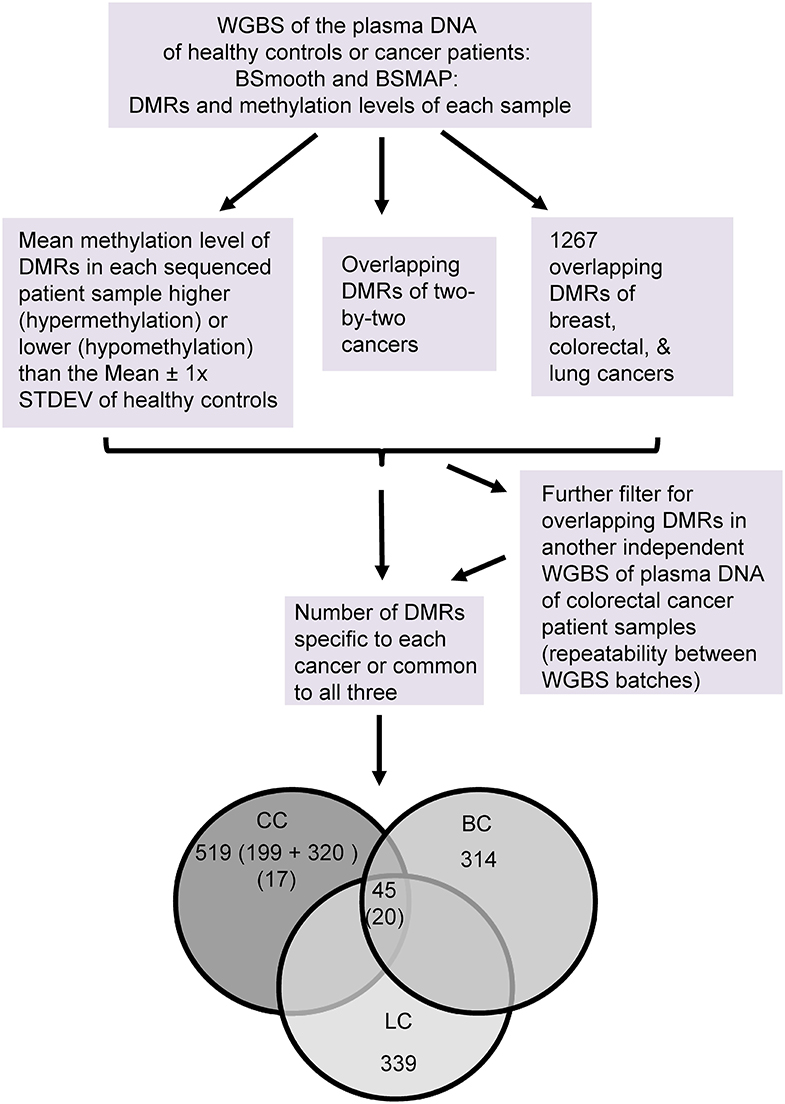
Figure 4. Flowchart of the WGBS analysis of the plasma DNA of early stage cancers of humans. Number of DMRs in each group are as indicated. The numbers of DMRs found in both batches of colon cancers are bracketed. CC: colorectal cancer, BC: breast cancer, and LC: lung cancer.
We used ~1 mL of plasma to obtain 0*-34.4 ng of cfDNA (*: beyond the detection limit of fluorescence assay) for sequencing, resulting in about 20.5–133.0 million reads of 150 bp long, equivalent to about 1–6 times the total length (~3.2 × 10E-09 bp) of the human genome. We performed a BSmooth analysis of the reads to identify 5–13 thousand differentially methylated regions (DMRs) compared to the healthy controls out of about two million methylation clusters detected in the genomes. Of these, 1,267 DMRs have at least one overlapping mC and changed significantly in the same direction of hyper- or hypo- methylation in all three types of cancers.
We then obtained the methylation levels of each DMR in individual plasma samples byw BSMAP. Those with a methylation level more (hypermethylation) or less (hypomethylation) than the mean ± 1 × standard deviation of healthy controls were arbitrarily set as “positive” for the DMR in cancer samples or “false positive” for control samples. According to these criteria, only those DMRs having 100% “specificity” and “sensitivity” (all cancer samples “positive” without any “false positive” samples) for the sequenced cancer type were selected for further analyses. In total, there are 314 (top 4.1%), 199 (1.4%) and 339 (3.6%) specific DMRs for the breast-, colorectal or lung-cancers, respectively. There are 45 DMRs common to the three types of cancers.
Three lines of evidence support association of the selected DMRs with early stage tumourigenesis. Firstly, an analysis of the DMRs from breast cancers of three different stages showed that average methylation levels increased or decreased in a stage-dependent (0-II) manner (Figure 5A). We also observed tumor size-dependent changes in methylation in a group of DMRs associated with the colorectal and lung cancers (Supplementary Figure 2). These suggest dynamic epigenetic changes during progression or growth of these tumors. Secondly, the DMR-associated genes are mainly tumor suppressors or oncogenes that cluster most significantly for membrane [e.g., Cadherin-related 23, CDH23 (30), hypomethylated; 19 members of the protocadherin γ family (31), hyper- or hypo-methylated (32)], signaling (e.g., WNT11 (33, 34) , hypomethylated) or homeodomain [e.g., engrailed homeobox 2, EN2 (35, 36), hypomethylated] proteins for the breast, colorectal or lung cancers, respectively (Figure 5B). Thirdly, 34 of the 109 human genes (a third) in the xenograft experiment were also detected in the human breast cancer DMR group, increasing in percentages with each stage (Figure 5C). Two of the genes are shared among all three stages: TRIQK encoding a vertebrate endoplasmic reticulum membrane protein likely involved in cell growth (37), and ENTPD1-AS1 lncRNA in the tumourigenesis of glioblastoma or hepatocarcinoma (38, 39). Together, the dependence of methylation level on cancer stage, the gene function clusters for tumor suppressors/oncogenes, as well as the shared genes between the xenograft and patient samples support that a group of these DMRs are associated with tumourigenesis and derived from the tumors (mctDNA).
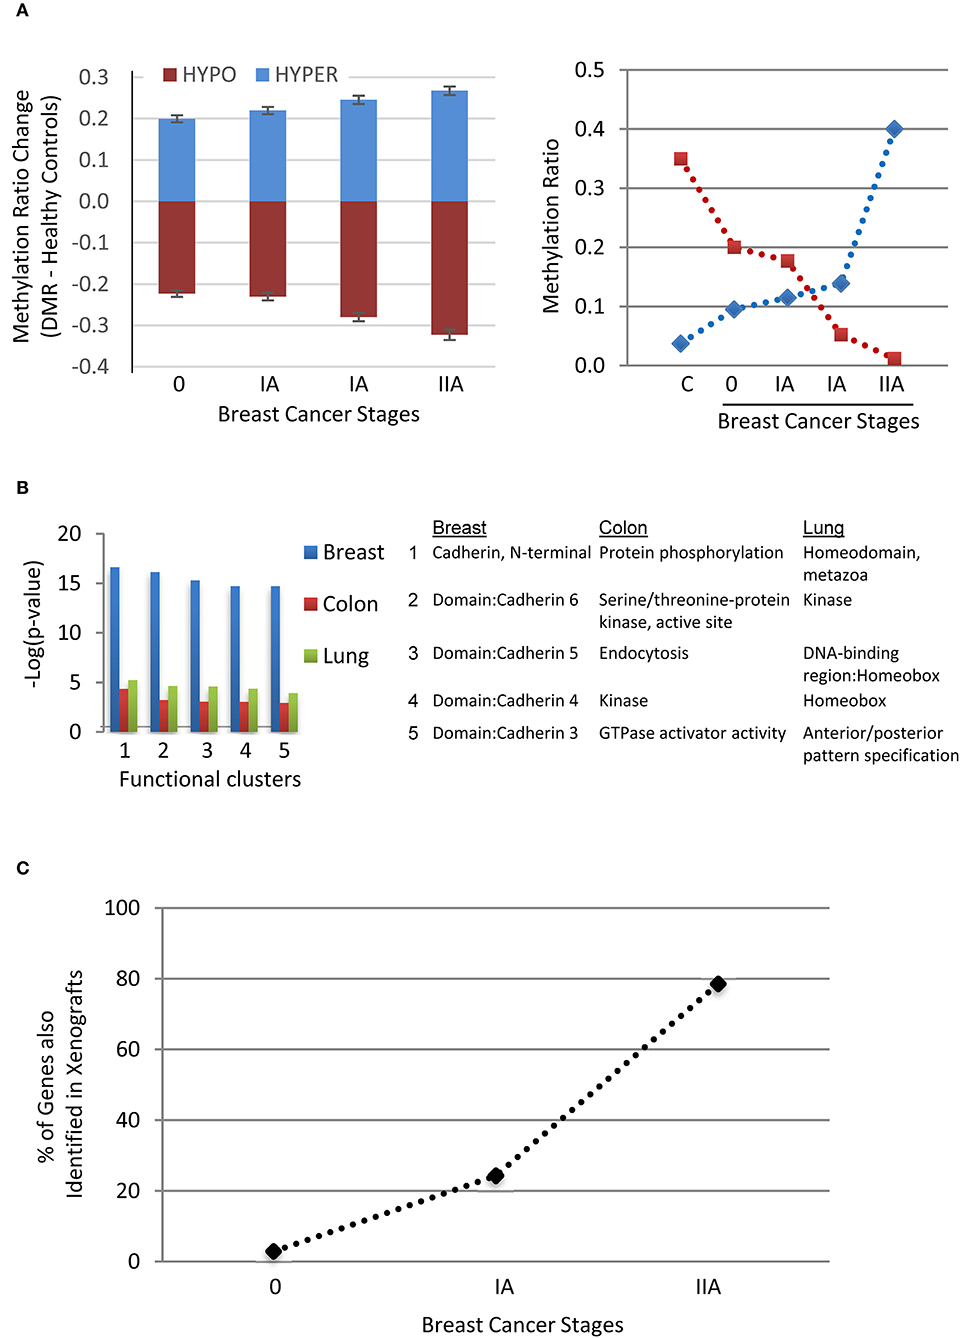
Figure 5. Evidence supporting the association of the DMRs with tumorigenesis. (A) Stage-dependent methylation changes of breast cancer-specific DMRs (Mean ± SEM, n = 314, Left panel) compared to the mean of healthy controls (C) and two examples of hyper- or hypo- methylation from stage 0 to stage II with two samples at stage IA. (B) Top five DAVID functional clusters of the cancer-specific DMR-associated human genes of the three types of cancers. (C) Percentages of identified genes shared (n = 34) between the human breast cancer and xenograft tumor samples among the three stages of breast cancer.
We also performed WGBS of cfDNA on an independent batch of samples from colorectal cancer patients (stage I, n = 5) to determine the repeatability between experiments and to obtain more reliable common or specific DMRs (Figure 4). We obtained 320 DMRs that are 100% specific and sensitive for this batch of cancer samples (relative to the four healthy controls). Of these, 19 DMRs (~5%) have at least one mC overlapping with such DMRs of the previous batch, and none has the exact same chromosome start.end coordinates of the DMR regions. Moreover, by filtering all DMRs of the two batches, we identified 20 common DMRs for the three types of cancers (Figure 4 and Supplementary Table 6) and 17 specific ones for the colorectal cancer (Figure 4 and Supplementary Table 7), with at least 75 and 66% sensitivity, respectively among the 12 colorectal cancer samples. Their mean methylation ratio change among colon cancers ranges from 0.11 to 0.37 (or 11–37%) with an overall mean of 0.25 (or 25%), 74 times over the 0.34% false-positive rate of the WGBS, supporting the authenticity of their methylation changes.
To compare the selected top DMRs with the human ctDNA or mctDNA threshold, we took the about two million WGBS methylation clusters in BSmooth analysis as the whole genome methylation regions covered by reads with a similar genome-wide distribution as the ctDNA among the cfDNA. The top 20 or 17 DMRs represent 0.001% or 0.0008% (~0.0018% in total) of the two million genome-wide methylation clusters. This is only about one 36th or 30th of the human ctDNA threshold 0.029% (maximal 592 DMRs). We thus used the chromosome coordinates of these 37 top DMRs (Supplementary Table 8) from the previous batch of colorectal cancers to assess their potential for early diagnosis.
Separation of Early Stage Colorectal Cancer Samples From Other Cancers or Healthy Controls Solely by the Top mctDNA Markers in Combination
The 37 top DMRs based on the chromosome coordinates from the BSmooth analysis of the colorectal cancer samples were 100% specific and sensitive in its own batch of cancer vs. healthy control comparisons but not necessarily so for their overlapping ones in the other cancers or the other batch of the same cancer type. We thus also obtained the overlapping DMR's methylation levels in the samples of the other two cancer types or the other colorectal cancer batch and corresponding healthy controls. Since the healthy control's DMR chromosome coordinates paired with the cancer samples in each BSmooth analysis, the four control samples each had four sets of coordinates (and methylation levels). By analyzing all these 37 DMRs, we then obtained a percentage of the “positive” DMRs of both the cancer-common (20 DMRs) and the colorectal cancer-specific (17 DMRs) markers for each sample. Ranking these samples according to the “positive” (or “false positive” for controls) rate of the 37 DMRs demonstrates a distinct separation between healthy and cancer samples (Figure 6A). All cancer samples (n = 20) have over 70% of the DMRs identified as positive (circles), while corresponding DMRs in healthy controls (6 sets of DMR chromosome coordinates and methylation levels of the four samples for the four cancer groups/batches and two groups of common/specific DMRs) all have <20% of the DMRs identified as false positive. The cancer and healthy control samples remained well-separated (crosses) even after excluding the colorectal cancer samples (batches) where the 37 DMRs were selected in the last step of filtering for their 100% specificity and sensitivity.
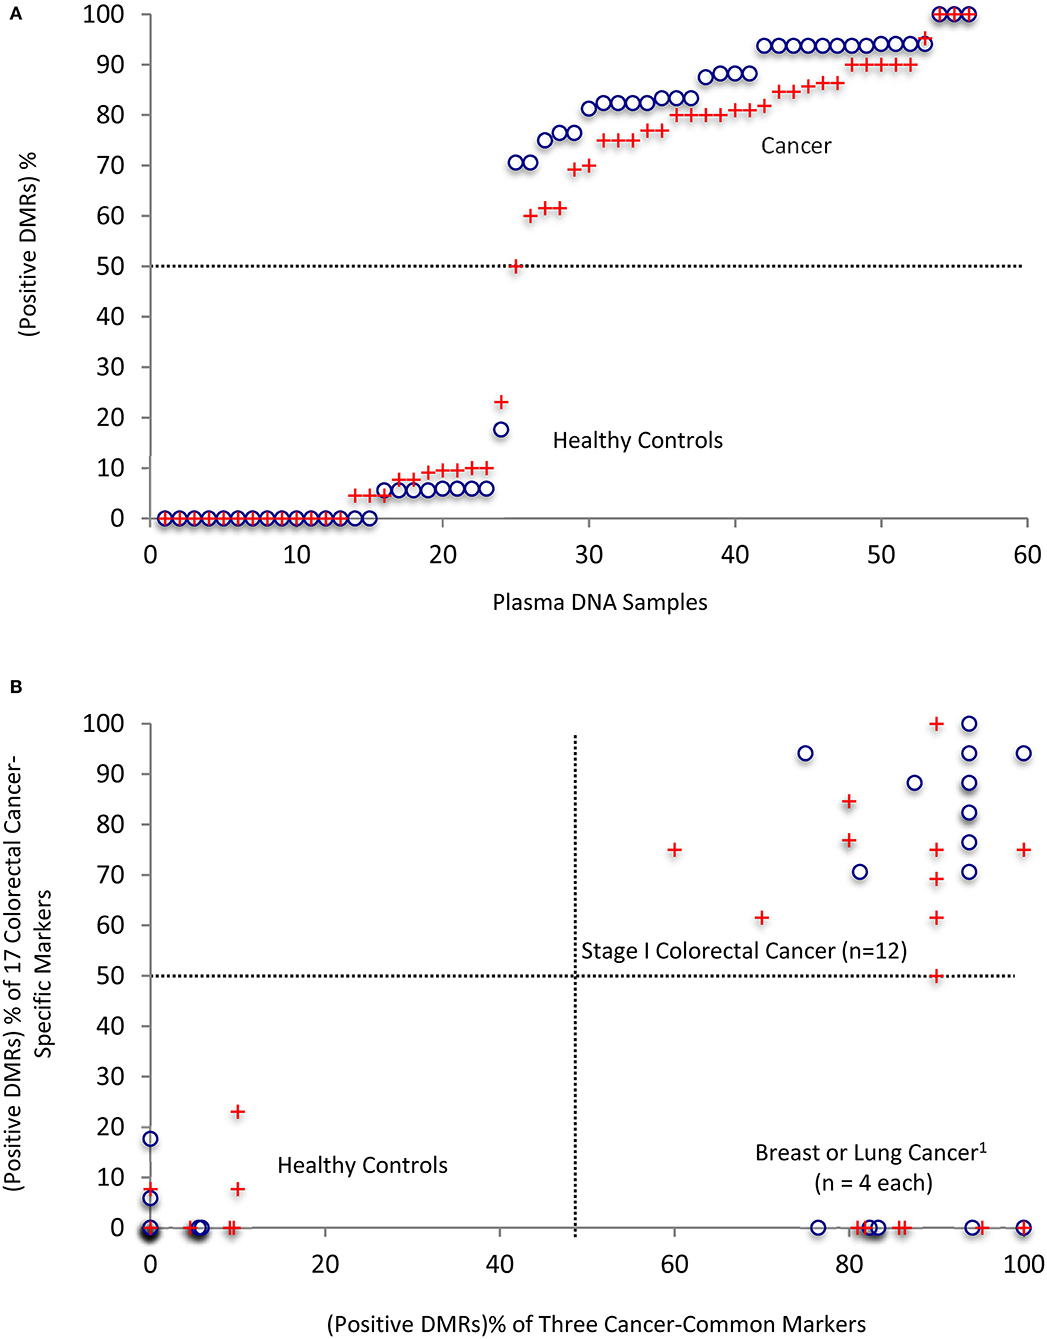
Figure 6. Separation of cancer samples from healthy controls by using the 37 top DMRs in combination. (A) Ranking of all of the individual plasma samples/analyses by the “positive DMR” percentages in each patient or healthy controls. (B) Clean separation of colon cancer (CC) patient samples from other cancers and healthy controls by the percentages of positive common and colon cancer-specific markers in each patient. 1The breast and lung cancer samples did not have significantly changed DMRs that are specific for the colon cancers; therefore, the 17-colon cancer-specific ones were counted as 0% in these samples. This could be refined in the future in targeted methylation analysis by their values, which should be <50% cut-off level expected from their no significant difference form the healthy controls. Please see also the text: “Positive” is defined for a DMR that has a methylation level of more than Mean + 1 X STDEV (hypermethylation) or less than Mean -1 X STDEV (hypomethylation) of the healthy controls. 18 DMRs used for breast cancers and 17 for lung cancers, and 37 for colorectal cancers in the analyses. Circles: 56 values in total, representing the 20 cancers, four healthy controls, and 37 DMRs. The four healthy controls have 24 DMR values from their pairing with six cancer groups (breast, lung cancers and two batches of colon cancers for the three cancer-common DMRs, and two batches of colon cancers for the specific DMRs). Crosses: same as above but excluded the colorectal cancer batch(es) where the top DMRs were selected for their 100% specificity and sensitivity.
Importantly, a scatter plot displaying the positive rates of the two categories of markers (common to all three types of cancers vs. colon cancer-specific) indicates that individual samples from the healthy, colorectal cancer and the other two cancer groups are separated into three quadrants (Figure 6B, circles), and remain well-separated even when the colorectal cancer samples (batches) for selecting the 100% specific and sensitive DMRs were excluded (crosses). Thus, combinations of the common or specific top DMR markers with >65% sensitivity or specificity are sufficient to distinguish between the early stage cancer patients and healthy controls or among patients with different types of early stage cancer with 100% accuracy.
In summary, the xenograft tumor model has given us an estimated ctDNA and mctDNA abundance of 0.29 and 0.01%, respectively, of cfDNA WGBS reads. Converted to the human counterparts by considering the larger tumor sizes and blood volumes, these estimates become 0.029 and 0.001%, respectively, for the plasma DNA samples of early stage cancer patients. Within the human ctDNA and mctDNA threshold, our selected top DMRs from the WGBS methylation clusters based on specificity, sensitivity and repeatability is sufficient to allow an accurate separation of cancer from healthy controls.
Discussion
Since most reports have been on the mctDNA in mixed or late stages, with varying extents of sensitivity and specificity (16, 40, 41), we chose to focus on early stage cancers to develop an approach to accurately separate samples of cancer patients from healthy controls. Here we used WGBS of cfDNA in a xenograft model to examine mctDNA authenticity and threshold levels, and potential application to early stage cancer detection. Due to the rarity of some early stage cancers, particularly lung cancers in the tumor bank used, the sample size is still small to cover the diverse epigenetic changes in cancers such as in the CpG island methylator of colorectal cancers (42). Nevertheless, together with recent reports on multistage cancers (16–18), our data point to the promising potential of a small group of selected top DMR markers with more confidence based on the xenograft ctDNA and mctDNA thresholds for the accurate diagnosis of early stage cancers.
Threshold for Authentic Tumor-Derived ctDNA Markers
Whether and what proportion of the cfDNA fragments, particularly methyl-DNA, are shed from tumors (ctDNA) have been difficult to assess in patient samples due to their possibly multiple origins (5). As expected, using a large number of methylation clusters indeed has only <50% sensitivity for early stage cancers (18). Our xenograft-WGBS approach estimated the tumor-derived cfDNA level (ctDNA) to be 0.29% in the breast cancer model and 0.029% for humans, providing a threshold for us to select DMRs with more confidence for authentic mctDNA markers for precise diagnosis of early stage cancers in the future. The approach could also be used to obtain the threshold percentages of cfDNA that are authentic ctDNA or mctDNA for more cancers in the future, as a more refined guidance for subsequent selection for a limited number of top mctDNA DMR markers from patient samples.
High Sensitivity
Our analysis suggests that 1 mL of plasma from a patient with one of the three types of early stage cancers (0-II) is sufficient to obtain enough WGBS reads to identify highly consistent DMR markers, detected from nominally 0-34 ng (9.99 ± 1.9) of cfDNA with methyltransferase-deficient bacterial DNA as a carrier. This plasma volume is about 10 times less than the amount of blood commonly drawn in clinical settings, making it also possible to use WGBS for patients with limited blood samples. The selected top DMR markers, together with their tumourigenesis-associated properties (Figure 5 and Supplementary Tables 6, 7) and the ctDNA abundance threshold of 0.029%, strongly support them as authentic mctDNA fragments. As expected, their distribution among individual patients should more accurately distinguish the early stage colon cancers from healthy controls and other cancers (Figure 6) than hundred thousands of DMRs used together (18).
Potential for Screening
The ability to distinguish early stage cancers from healthy controls supports the potential application of this approach for accurate early stage diagnosis or large group screening in the future. Few screening markers can achieve a perfect sensitivity or specificity for early stage cancers. Therefore, practical concerns regarding false-positives and related ethical issues remain to be addressed (43). For instance, even a 0.1% false-positive rate would result in a substantial 1,000 false-positive cases in a population screen of one million individuals. As we advance toward more accurate early diagnosis, combinatorial application of a whole set(s) of selected sensitive and specific DMR markers could be a promising choice (Figure 6), instead of one-by-one or too many but each with insufficient specificity/sensitivity.
Future Applications
Would WGBS of cfDNA be still accurate if it was directly applied for patient diagnosis or population screening in clinics using the selected DMR markers for early detection of cancers? Our WGBS results from the two batches of early stage colorectal cancer samples do not seem to support this approach by overlapping only ~5% of the specific and sensitive DMRs; neither did the result (low sensitivity) using hundred thousands of selected methylation regions in hybridization panels (18). The two independent sequencing batches were carried out using the same library preparation protocol of shotgun library preparation with the NEBNext® Ultra™ II DNA Library Prep Kit but overlapped by only less than a half for common DMRs and 10% for the colorectal cancer-specific DMRs when using WGBS without CpG enrichment (Figure 4). To achieve a higher rate of repeatability between patients/batches of sequencing, CpG enrichment or a much higher depth of sequencing reads (e.g., >10× human genome) is necessary, however at a much higher cost, which will reduce its clinical applicability. An alternative is thus needed to bypass the coverage/cost issue of whole genome sequencing for the routine diagnosis of early stage cancers. One such approach could be targeted bisulfite sequencing (Supplementary Tables 1, 2) of the selected top DMR markers (Figure 6).
Beyond diagnostic markers, the high specificity and sensitivity of the xenograft-WGBS approach will also allow for efficient identification of tumor-specific mctDNA from the plasma of other xenograft models, such as the patient-derived xenograft model (PDX), potentially establishing markers of prognosis, treatment effects and drug responses to personalized cancer management in the future.
Data Availability Statement
Part of the datasets presented in this study can be found in online repositories. The names of the repository/repositories and accession number(s) can be found below: NCBI BioProject; PRJNA655956.
Ethics Statement
The studies involving human participants were reviewed and approved by the Faculty of Medicine, University of Manitoba, Health Research Ethics Board. Written informed consent for participation was obtained by the CancerCare Manitoba or Ontario Tumor Banks for the respective patient samples as approved by their institute ethical boards. The animal study was reviewed and approved by Animal Care and Ethical Committee of the University of Manitoba, Canada.
Author Contributions
JX: study concepts, study design, manuscript editing, and manuscript review. LL, JF, MZ, XZ, X-JY, EL, and SK: data acquisition. LL, HN, and JX: quality control of data and algorithms and statistical analysis. LL, JP, HN, UD, and JX: data analysis and interpretation. LL, JP, HS, and JX: manuscript preparation. All authors contributed to the article and approved the submitted version.
Funding
Patient information and materials, with ethical approval, were provided by the Ontario Tumor Bank, which was supported by the Ontario Institute for Cancer Research through funding provided by the Government of Ontario. This work was supported by a Manitoba Research Chair fund to JX, an UMGF scholarship to LL, Research Manitoba Scholarship to HN, a CancerCare Manitoba Foundation (#761017325) grant to EL, a Canadian Cancer Society Research Institute Grant (#702459) and NSERC Discovery Grant (RGPIN-2015-04144) to SK, and a visiting scholarship to JF by the Education Department of Guangxi, China.
Conflict of Interest
The authors declare that the research was conducted in the absence of any commercial or financial relationships that could be construed as a potential conflict of interest.
Acknowledgments
We thank Dr. Kees Weijer for the RAG-2−/− × γc−/− double-knockout mice, the Genome Quebec Innovation Centre at McGill University for the WGBS service.
Supplementary Material
The Supplementary Material for this article can be found online at: https://www.frontiersin.org/articles/10.3389/fonc.2021.615821/full#supplementary-material
References
1. Bray F, Ferlay J, Soerjomataram I, Siegel RL, Torre LA, Jemal A. Global cancer statistics 2018: GLOBOCAN estimates of incidence and mortality worldwide for 36 cancers in 185 countries. CA Cancer J Clin. (2018) 68:394–424. doi: 10.3322/caac.21492
2. Kumar P, Dillon LW, Shibata Y, Jazaeri AA, Jones DR, Dutta A. Normal and cancerous tissues release extrachromosomal circular DNA (eccDNA) into the circulation. Mol Cancer Res. (2017) 15:1197–205. doi: 10.1158/1541-7786.MCR-17-0095
3. Rykova E, Sizikov A, Roggenbuck D, Antonenko O, Bryzgalov L, Morozkin E, et al. Circulating DNA in rheumatoid arthritis: pathological changes and association with clinically used serological markers. Arthritis Res Ther. (2017) 19:85. doi: 10.1186/s13075-017-1295-z
4. Tost J. Follow the trace of death: methylation analysis of cell-free DNA for clinical applications in non-cancerous diseases. Epigenomics. (2016) 8:1169–72. doi: 10.2217/epi-2016-0080
5. Bronkhorst AJ, Ungerer V, Holdenrieder S. The emerging role of cell-free DNA as a molecular marker for cancer management. Biomol Detect Quantif. (2019) 17:100087. doi: 10.1016/j.bdq.2019.100087
6. Lo YM, Zhang J, Leung TN, Lau TK, Chang AM, Hjelm NM. Rapid clearance of fetal DNA from maternal plasma. Am J Hum Genet. (1999) 64:218–24. doi: 10.1086/302205
7. Diehl F, Schmidt K, Choti MA, Romans K, Goodman S, Li M, et al. Circulating mutant DNA to assess tumor dynamics. Nat Med. (2008) 14:985–90. doi: 10.1038/nm.1789
8. Yao W, Mei C, Nan X, Hui L. Evaluation and comparison of in vitro degradation kinetics of DNA in serum, urine and saliva: a qualitative study. Gene. (2016) 590:142–8. doi: 10.1016/j.gene.2016.06.033
9. Yizhak K, Aguet F, Kim J, Hess JM, Kubler K, Grimsby J, et al. RNA sequence analysis reveals macroscopic somatic clonal expansion across normal tissues. Science. (2019) 364:eaaw0726. doi: 10.1126/science.aaw0726
10. Cohen JD, Javed AA, Thoburn C, Wong F, Tie J, Gibbs P, et al. Combined circulating tumor DNA and protein biomarker-based liquid biopsy for the earlier detection of pancreatic cancers. Proc Natl Acad Sci USA. (2017) 114:10202–7. doi: 10.1073/pnas.1704961114
11. Cohen JD, Li L, Wang Y, Thoburn C, Afsari B, Danilova L, et al. Detection and localization of surgically resectable cancers with a multi-analyte blood test. Science. (2018) 359:926–30. doi: 10.1126/science.aar3247
12. Isaksson S, George AM, Jonsson M, Cirenajwis H, Jonsson P, Bendahl PO, et al. Pre-operative plasma cell-free circulating tumor DNA and serum protein tumor markers as predictors of lung adenocarcinoma recurrence. Acta Oncol. (2019) 58:1079–86. doi: 10.1080/0284186X.2019.1610573
13. Payne SR. From discovery to the clinic: the novel DNA methylation biomarker (m)SEPT9 for the detection of colorectal cancer in blood. Epigenomics. (2010) 2:575–85. doi: 10.2217/epi.10.35
14. Wu D, Zhou G, Jin P, Zhu J, Li S, Wu Q, et al. Detection of colorectal cancer using a simplified SEPT9 gene methylation assay is a reliable method for opportunistic screening. J Mol Diagn. (2016) 18:535–45. doi: 10.1016/j.jmoldx.2016.02.005
15. Lee BB, Lee EJ, Jung EH, Chun HK, Chang DK, Song SY, et al. Aberrant methylation of APC, MGMT, RASSF2A, and Wif-1 genes in plasma as a biomarker for early detection of colorectal cancer. Clin Cancer Res. (2009) 15:6185–91. doi: 10.1158/1078-0432.CCR-09-0111
16. Li W, Li Q, Kang S, Same M, Zhou Y, Sun C, et al. CancerDetector: ultrasensitive and non-invasive cancer detection at the resolution of individual reads using cell-free DNA methylation sequencing data. Nucleic Acids Res. (2018) 46:e89. doi: 10.1093/nar/gky423
17. Shen SY, Singhania R, Fehringer G, Chakravarthy A, Roehrl MHA, Chadwick D, et al. Sensitive tumour detection and classification using plasma cell-free DNA methylomes. Nature. (2018) 563:579–83. doi: 10.1038/s41586-018-0703-0
18. Liu M, Oxnard G, Klein E, Swanton C, Seiden M, Liu MC, et al. Sensitive and specific multi-cancer detection and localization using methylation signatures in cell-free DNA. Ann Oncol. (2020) 31:745–59. doi: 10.1016/j.annonc.2020.02.011
19. Kisker O, Becker CM, Prox D, Fannon M, D'Amato R, Flynn E, et al. Continuous administration of endostatin by intraperitoneally implanted osmotic pump improves the efficacy and potency of therapy in a mouse xenograft tumor model. Cancer Res. (2001) 61:7669–74.
20. Richmond A, Su Y. Mouse xenograft models vs GEM models for human cancer therapeutics. Dis Model Mech. (2008) 1:78–82. doi: 10.1242/dmm.000976
21. Rubio-Viqueira B, Hidalgo M. Direct in vivo xenograft tumor model for predicting chemotherapeutic drug response in cancer patients. Clin Pharmacol Ther. (2009) 85:217–21. doi: 10.1038/clpt.2008.200
22. Goodspeed A, Heiser LM, Gray JW, Costello JC. Tumor-derived cell lines as molecular models of cancer pharmacogenomics. Mol Cancer Res. (2016) 14:3–13. doi: 10.1158/1541-7786.MCR-15-0189
23. Thierry AR, Mouliere F, Gongora C, Ollier J, Robert B, Ychou M, et al. Origin and quantification of circulating DNA in mice with human colorectal cancer xenografts. Nucleic Acids Res. (2010) 38:6159–75. doi: 10.1093/nar/gkq421
24. Gimeno R, Weijer K, Voordouw A, Uittenbogaart CH, Legrand N, Alves NL, et al. Monitoring the effect of gene silencing by RNA interference in human CD34+ cells injected into newborn RAG2-/- gammac-/- mice: functional inactivation of p53 in developing T cells. Blood. (2004) 104:3886–93. doi: 10.1182/blood-2004-02-0656
25. Andrews S. FastQC: A Quality Control Tool for High Throughput Sequence Data. (2010). Available online at: http://www.bioinformatics.babraham.ac.uk/projects/fastqc/ (accessed Febuary 16, 2021).
26. Bolger AM, Lohse M, Usadel B. Trimmomatic: a flexible trimmer for Illumina sequence data. Bioinformatics. (2014) 30:2114–20. doi: 10.1093/bioinformatics/btu170
27. Xi Y, Li W. BSMAP: whole genome bisulfite sequence MAPping program. BMC Bioinformatics. (2009) 10:232. doi: 10.1186/1471-2105-10-232
28. Huang DW, Sherman BT, Tan Q, Collins JR, Alvord WG, Roayaei J, et al. The DAVID gene functional classification tool: a novel biological module-centric algorithm to functionally analyze large gene lists. Genome Biol. (2007) 8:R183. doi: 10.1186/gb-2007-8-9-r183
29. Hansen KD, Langmead B, Irizarry RA. BSmooth: from whole genome bisulfite sequencing reads to differentially methylated regions. Genome Biol. (2012) 13:R83. doi: 10.1186/gb-2012-13-10-r83
30. Apostolopoulou M, Ligon L. Cadherin-23 mediates heterotypic cell-cell adhesion between breast cancer epithelial cells and fibroblasts. PLoS ONE. (2012) 7:e33289. doi: 10.1371/journal.pone.0033289
31. Berx G, van Roy F. Involvement of members of the cadherin superfamily in cancer. Cold Spring Harb Perspect Biol. (2009) 1:a003129. doi: 10.1101/cshperspect.a003129
32. Vega-Benedetti AF, Loi E, Moi L, Blois S, Fadda A, Antonelli M, et al. Clustered protocadherins methylation alterations in cancer. Clin Epigenetics. (2019) 11:100. doi: 10.1186/s13148-019-0695-0
33. Zhan T, Rindtorff N, Boutros M. Wnt signaling in cancer. Oncogene. (2017) 36:1461–73. doi: 10.1038/onc.2016.304
34. Galamb O, Kalmar A, Peterfia B, Csabai I, Bodor A, Ribli D, et al. Aberrant DNA methylation of WNT pathway genes in the development and progression of CIMP-negative colorectal cancer. Epigenetics. (2016) 11:588–602. doi: 10.1080/15592294.2016.1190894
35. Martin NL, Saba-El-Leil MK, Sadekova S, Meloche S, Sauvageau G. EN2 is a candidate oncogene in human breast cancer. Oncogene. (2005) 24:6890–901. doi: 10.1038/sj.onc.1208840
36. Gomez-Gomez E, Jimenez-Vacas JM, Pedraza-Arevalo S, Lopez-Lopez F, Herrero-Aguayo V, Hormaechea-Agulla D, et al. Oncogenic role of secreted engrailed homeobox 2 (EN2) in prostate cancer. J Clin Med. (2019) 8:1400. doi: 10.3390/jcm8091400
37. Onuma Y, Watanabe A, Aburatani H, Asashima M, Whitman M. TRIQK, a novel family of small proteins localized to the endoplasmic reticulum membrane, is conserved across vertebrates. Zoolog Sci. (2008) 25:706–13. doi: 10.2108/zsj.25.706
38. Zhou M, Zhang Z, Zhao H, Bao S, Cheng L, Sun J. An immune-related six-lncRNA signature to improve prognosis prediction of glioblastoma multiforme. Mol Neurobiol. (2018) 55:3684–97. doi: 10.1007/s12035-017-0572-9
39. Yan Y, Yu J, Liu H, Guo S, Zhang Y, Ye Y, et al. Construction of a long non-coding RNA-associated ceRNA network reveals potential prognostic lncRNA biomarkers in hepatocellular carcinoma. Pathol Res Pract. (2018) 214:2031–8. doi: 10.1016/j.prp.2018.09.022
40. Maggi EC, Gravina S, Cheng H, Piperdi B, Yuan Z, Dong X, et al. Development of a method to implement whole-genome bisulfite sequencing of cfDNA from cancer patients and a mouse tumor model. Front Genet. (2018) 9:6. doi: 10.3389/fgene.2018.00006
41. Liu L, Toung JM, Jassowicz AF, Vijayaraghavan R, Kang H, Zhang R, et al. Targeted methylation sequencing of plasma cell-free DNA for cancer detection and classification. Ann Oncol. (2018) 29:1445–53. doi: 10.1093/annonc/mdy119
42. Nazemalhosseini Mojarad E, Kuppen PJ, Aghdaei HA, Zali MR. The CpG island methylator phenotype (CIMP) in colorectal cancer. Gastroenterol Hepatol Bed Bench. (2013) 6:120–8.
Keywords: whole-genome bisulfite sequencing, xenograft mice, early stage cancers, diagnosis, cell free methyl-DNA, colon cancer
Citation: Liu L, Feng J, Polimeni J, Zhang M, Nguyen H, Das U, Zhang X, Singh H, Yao X-J, Leygue E, Kung SKP and Xie J (2021) Characterization of Cell Free Plasma Methyl-DNA From Xenografted Tumors to Guide the Selection of Diagnostic Markers for Early-Stage Cancers. Front. Oncol. 11:615821. doi: 10.3389/fonc.2021.615821
Received: 10 October 2020; Accepted: 05 February 2021;
Published: 26 March 2021.
Edited by:
David Stephen Guttery, University of Leicester, United KingdomReviewed by:
Genta Nagae, The University of Tokyo, JapanJun Zhong, National Cancer Institute (NCI), United States
Copyright © 2021 Liu, Feng, Polimeni, Zhang, Nguyen, Das, Zhang, Singh, Yao, Leygue, Kung and Xie. This is an open-access article distributed under the terms of the Creative Commons Attribution License (CC BY). The use, distribution or reproduction in other forums is permitted, provided the original author(s) and the copyright owner(s) are credited and that the original publication in this journal is cited, in accordance with accepted academic practice. No use, distribution or reproduction is permitted which does not comply with these terms.
*Correspondence: Jiuyong Xie, eGllakB1bWFuaXRvYmEuY2E=