 Junyu Zhang1,2,3,4,5†
 Yan Lu2,3,6†
 Yinxiangzi Sheng2,3,6
 Weiwei Wang2,3,6
 Zhengshan Hong2,3,7
 Yun Sun1,2,3Rong Zhou4,5Jingyi Cheng1,2,3*
- 1Department of Nuclear Medicine, Shanghai Proton and Heavy Ion Center, Fudan University Cancer Hospital, Shanghai, China
- 2Shanghai Key Laboratory of Radiation Oncology, Shanghai, China
- 3Shanghai Engineering Research Center of Proton and Heavy Ion Radiation Therapy, Shanghai, China
- 4College of Physics, Sichuan University, Chengdu, China
- 5Key Laboratory of Radiation Physics and Technology, Ministry of Education, Chengdu, China
- 6Department of Medical Physics, Shanghai Proton and Heavy Ion Center, Shanghai, China
- 7Department of Radiotherapy, Shanghai Proton and Heavy Ion Center, Shanghai, China
Purpose: Positron emission tomography (PET) range verification is an important method that can help improve the confidence in proton therapy for clinical applications. Two kinds of verification methods are implemented and compared based on clinical cases in this study.
Method: The study is conducted on 14 breast cancer patients following proton irradiation treatment. Verification is done by calculating the depth error between the numerically predicted values with the measured PET image along the beam direction. Point-based and segment-based methods are applied and compared. The verification results are presented as depth error means and standard deviations in a region of interest (ROI).
Results: The mean value of the depth error of all 14 cases is within the range of [−3, 3] mm for both point-based and segment-based methods, and only one case result calculated by the point-based method is slightly beyond −3 mm. When comparing the mean depth error from the two methods, the paired t-test result shows that the p-value is 0.541, and the standard deviation of the segment-based method is smaller than that of the point-based method.
Conclusion: In breast cancer case verification application, point-based and segment-based methods show no significant difference in the mean value of results. Both methods can quantify the accuracy of proton radiotherapy to the millimeter level.
Introduction
A proton beam demonstrates a good dose distribution with a clear edge because of the presence of the Bragg peak on the dose depth deposition curve. Proton therapy is widely utilized to treat solid tumors close to critical organs, as the clear dose edge is good at sparing normal tissue while destroying tumor tissue. The range verification methods, which are necessary to check the irradiation accuracy, are applied to patients during or/and after proton therapy to ensure the proton beam delivered the dose to tumor tissue precisely.
Many in vivo non-invasive verification methods are developed (1); positron emission tomography (PET) is one of the most widely used verification techniques following proton irradiation. Positron emitter isotopes are generated by proton beam decay and release a positron. The positron annihilates with an electron and releases a pair of annihilation photons, which is recorded by the coincident detecting system. Using a suitable reconstruction algorithm, the positron distribution image can be reconstructed to reveal quantified information about beam irradiation.
Proton therapy PET verification has been developed through many phantom-based studies (2–5) and clinical cases (6–9). PET verification is assessed by comparing the measured PET image with the predicted PET image using two widely employed methods (3, 10): point-based and segment-based. The point-based method determines the PET depth by a marked point on the PET activity curve along the beam direction, while the segment-based method determines the depth difference relying on a segment of the curve. Several published articles report that the point-based method has a lower robustness against noise and other fluctuations (11, 12), whereas the segment-based method provides higher robustness to curve fluctuation (3, 10). However, these reports have few descriptions on the implementation of the segment-based method, and the comparison between these two methods is not described thoroughly.
Here, we are going to evaluate point-based and segment-based verification methods and investigate the difference between the two methods in clinical application. Both methods are implemented and employed to verify PET depth range. The comparison is performed on breast cancer cases of PET examination following proton therapy.
Materials and Methods
Patient Set and PET Prediction
This retrospective study was approved by the ethics committee of Shanghai Proton and Heavy Ion Center, and the requirement for informed consent was waived. In this work, 14 breast cancer patients were analyzed, whose information is listed in Table 1. After proton beam treatment, patients underwent a PET scanning via the nuclear medicine PET device. All patients have two irradiation fields. In the treatment plans, fractional dose on the clinical target volume (CTV) was 2.0 or 2.66 Gray of photon Equivalent dose (GyE) in different cases, with a boost area (if exists) 20% higher than the CTV area. The relative biological effect (RBE) of proton beam is a fixed value 1.1.
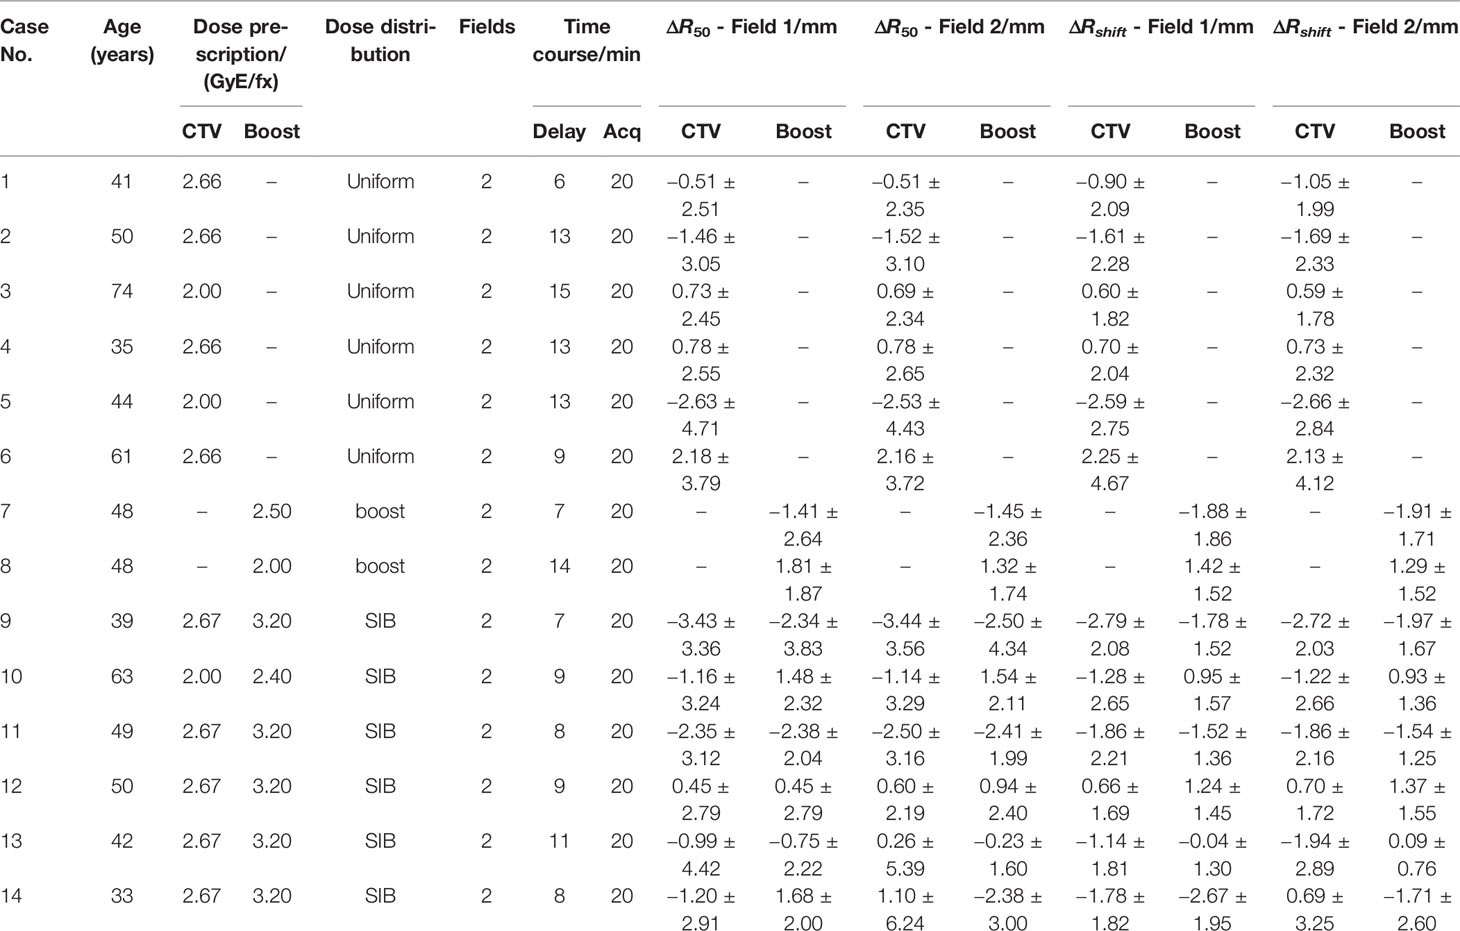
Table 1 Patient Information.
Given patient computer tomography (CT) data and treatment plan, the predicted PET image can be calculated by an analytical method (13). A group in Ludwig-Maximillian Universität (LMU) has developed a PET prediction module based on the Treatment Planning System (TPS) working frame (14), which calculates the predicted PET by convolving the dose with a filter function spot by spot and finally generates the PET distribution with washout (10, 15). This module is applied in this work as the source of predicted PET data.
PET Acquisition and Data Preprocess
In this work, the patient PET data are acquired by “offline” PET, which means that patients after proton irradiation will be transferred over a distance to the PET device; thus, the signal intensity decreased before the acquisition. Patients needed around 5–10 min to transport from the treatment room to the PET room. PET images are acquired by Biograph mCT (16) (Siemens), a PET/CT coupled device that acquires PET and CT data under the same geometry frame. It took us 20 min to acquire patient data. Furthermore, we reconstructed the images with ordered subsets expectation maximization algorithm (17, 18). In addition, CT attenuation correction was applied to reduce the signal attenuation caused by self-absorption. Since the predicted PET follows patient plan CT frame and measured PET follows the PET-CT frame, the plan CT is rigidly co-registered to the PET-CT and thus predicted and measured PET can be compared under one geometry frame.
Because of the low intensity of the PET signal, the reconstructed PET image has a lot of ripples, and the image has lost the accurate PET activity information; thus, measured PET is not suitable for a direct comparison with the predicted PET. A simple moving-average smoothing was applied to the original measured image to smoothen the ripples and then normalized to the scale of the predicted image (19). It is now possible to compare the predicted and measured PET to verify their range.
Depth Error Verification
Verification Result of an Irradiation Field
In each treatment plan, there could be one or more irradiation fields to provide a sufficient dose covering to the tumor tissue. In the treatment, the planned dose is delivered to the tumor tissue marked in “region of interest (ROI)”, which covers a certain 3-D region of the patient body (Figures 1A, B). One-dimensional PET scoring lines are drawn along the beam direction perpendicular to the beam’s eye view (BEV) plane (10). From the BEV, as shown in Figure 1C, the PET curve scoring line is uniformly distributed with an identical fixed interval (3 mm in our cases).
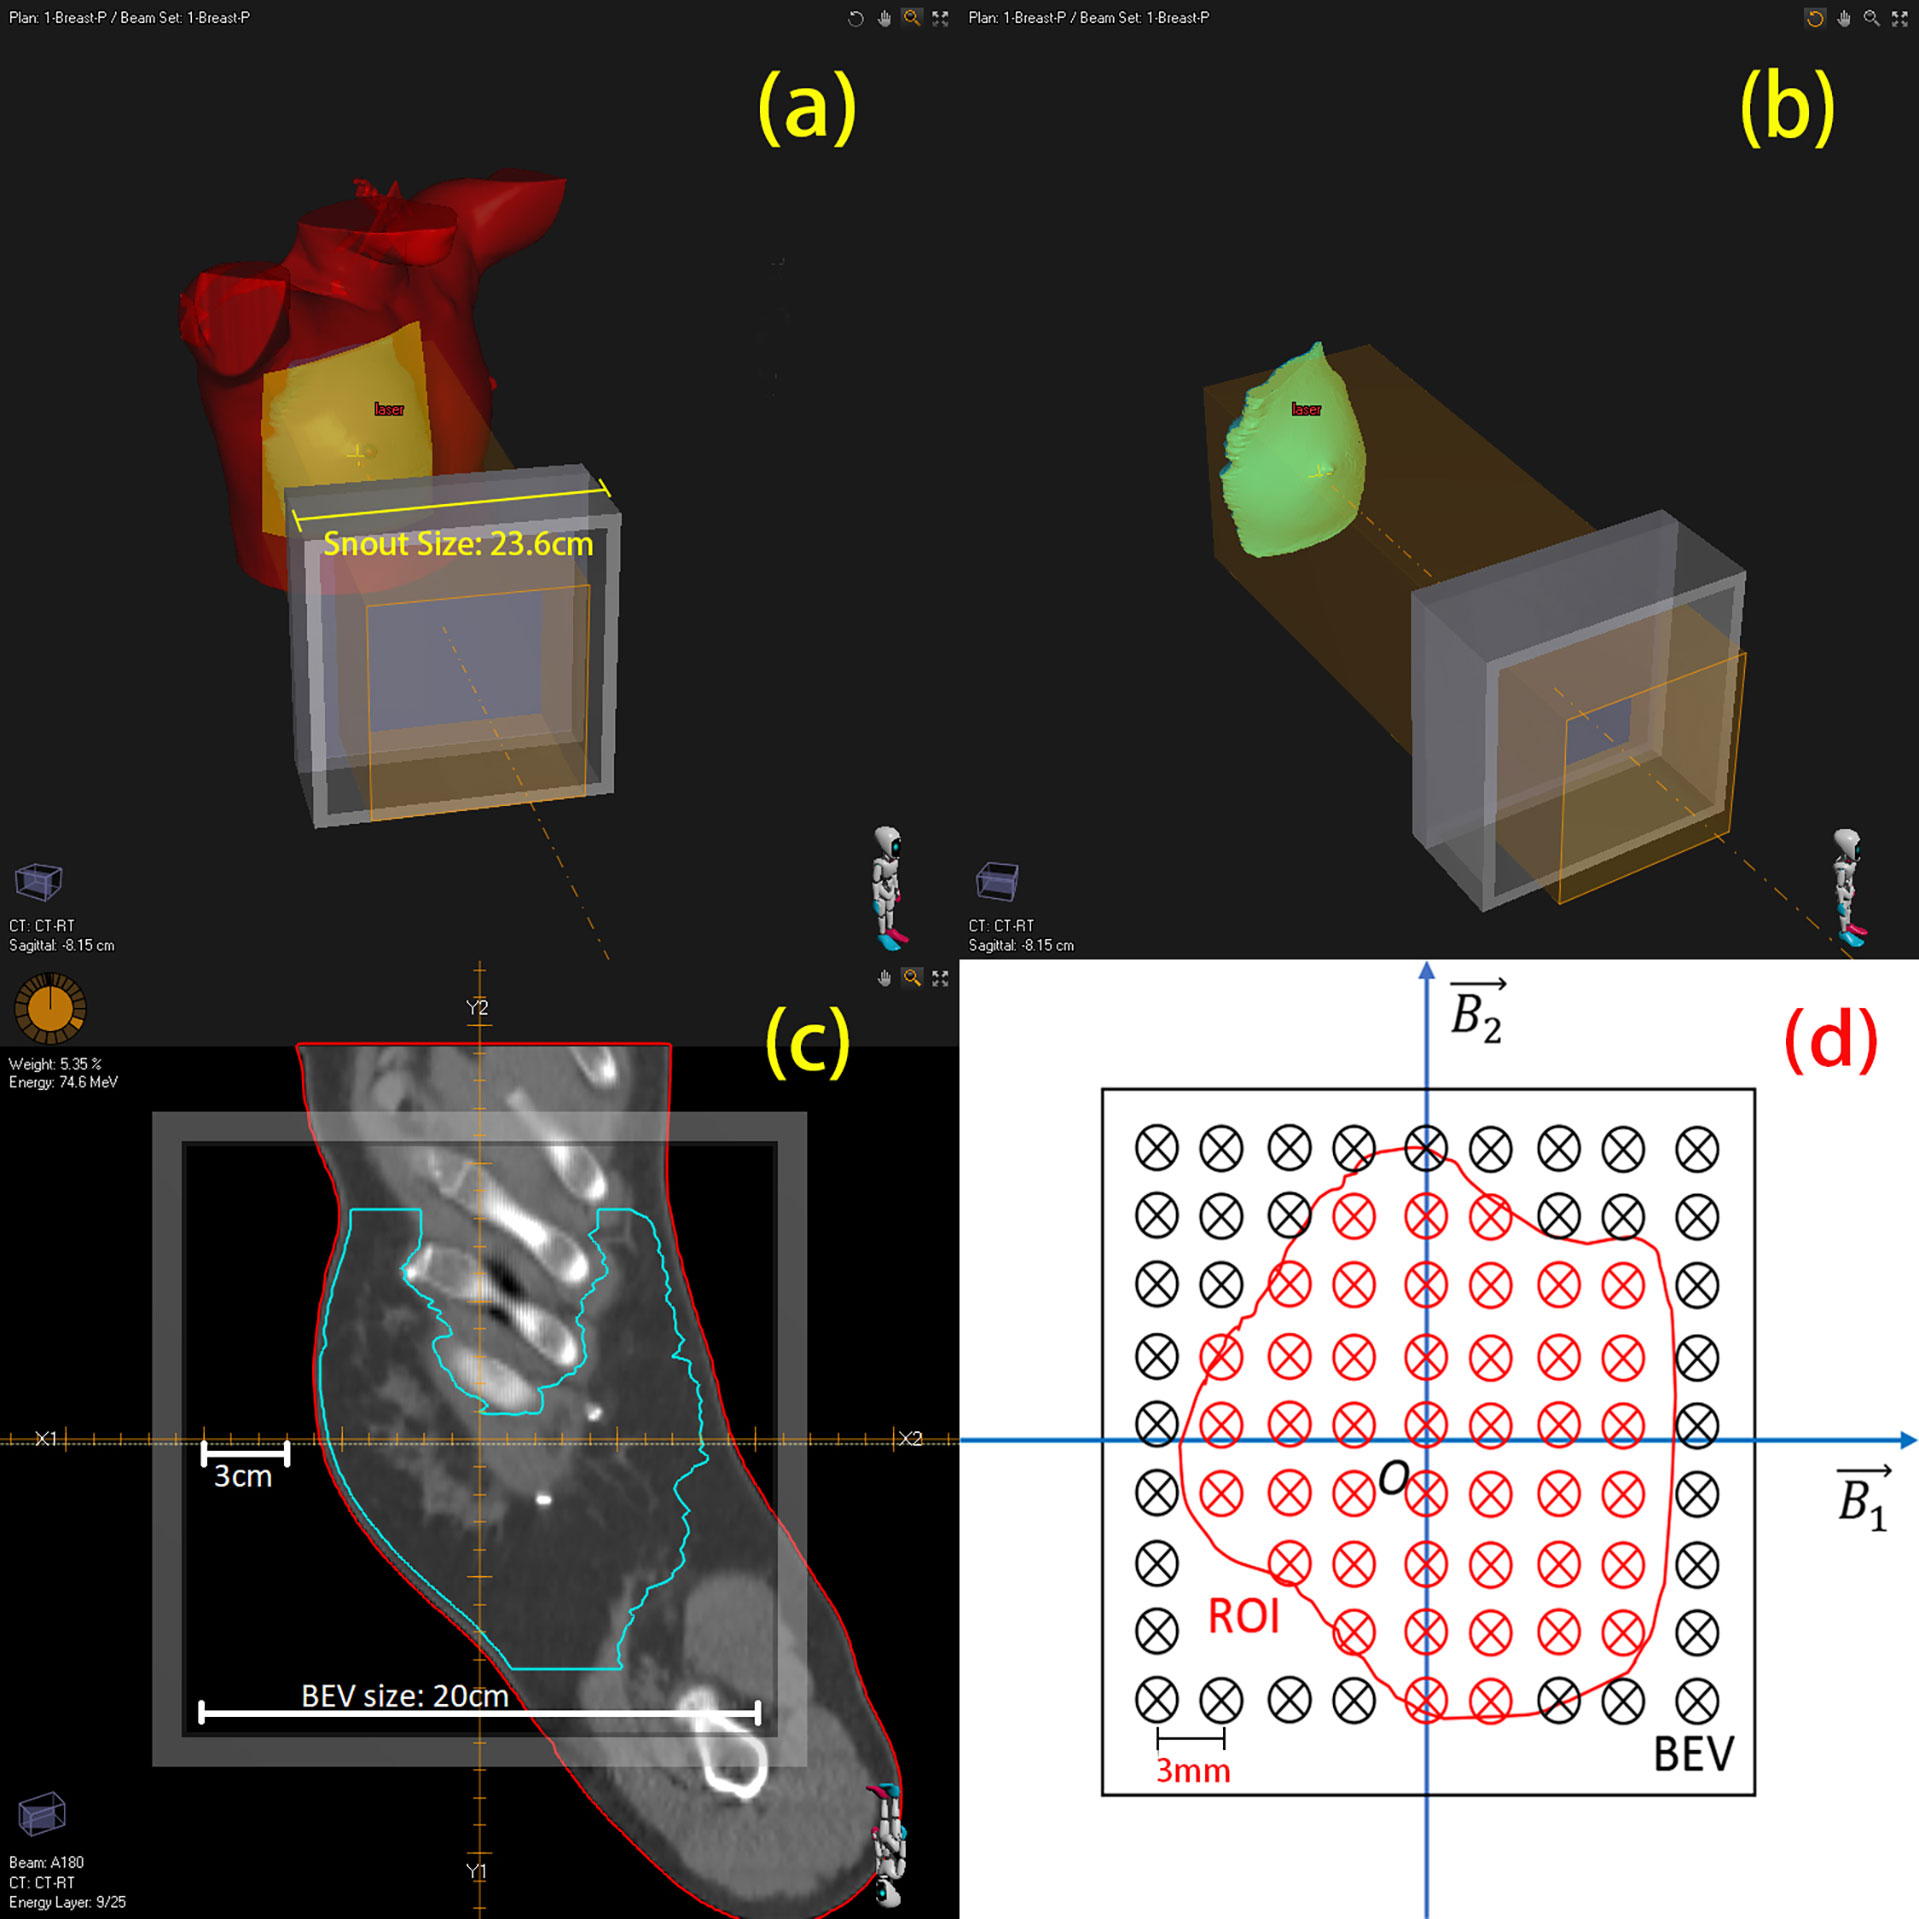
Figure 1 3-D view of region of interest (ROI) and mapping to BEV (beam’s eye view). (A) A single beam irradiates to the patient’s breast. (B) Irradiating to the patient CTV. (C) One slice image of CTV on BEV. (D) Sketch of scoring lines inside (red) and outside (black) the ROI; scoring line interval is 3 mm.
Obviously, not all the data from the scoring lines are useful to us. As the CTV is of our concern, we project this 3-D ROI on the BEV plane as a 2-D area, which circled a group of scoring lines (Figure 1D, just a sketch not real case). Only the scoring lines inside the ROI will be involved to calculate the mean value and standard deviation of the depth error of an irradiation field. This method of observing from the beam sight has been reported in many studies (6, 20–22). The comparison between two 3D-PET images is then degraded to one-dimensional curve problems; the statistical result of a case is then generated from the collection of one-dimensional curve comparison results.
R50 Method: Point-Based
In our verification cases, the predicted and measured PET curves had similar shapes and edges, but the distal edges did not have the same position and slope. R50 is defined as the position where the PET intensity is 50% of its maximum (3). The predicted PET curve is set as a reference, and a horizontal marking line is drawn at half of the maximum level. The horizontal line marked out two points at the distal side of the curves while the depth error calculated based on R50 is defined as ΔR50 = R50,pred - R50,meas. This process is shown in Figure 2.
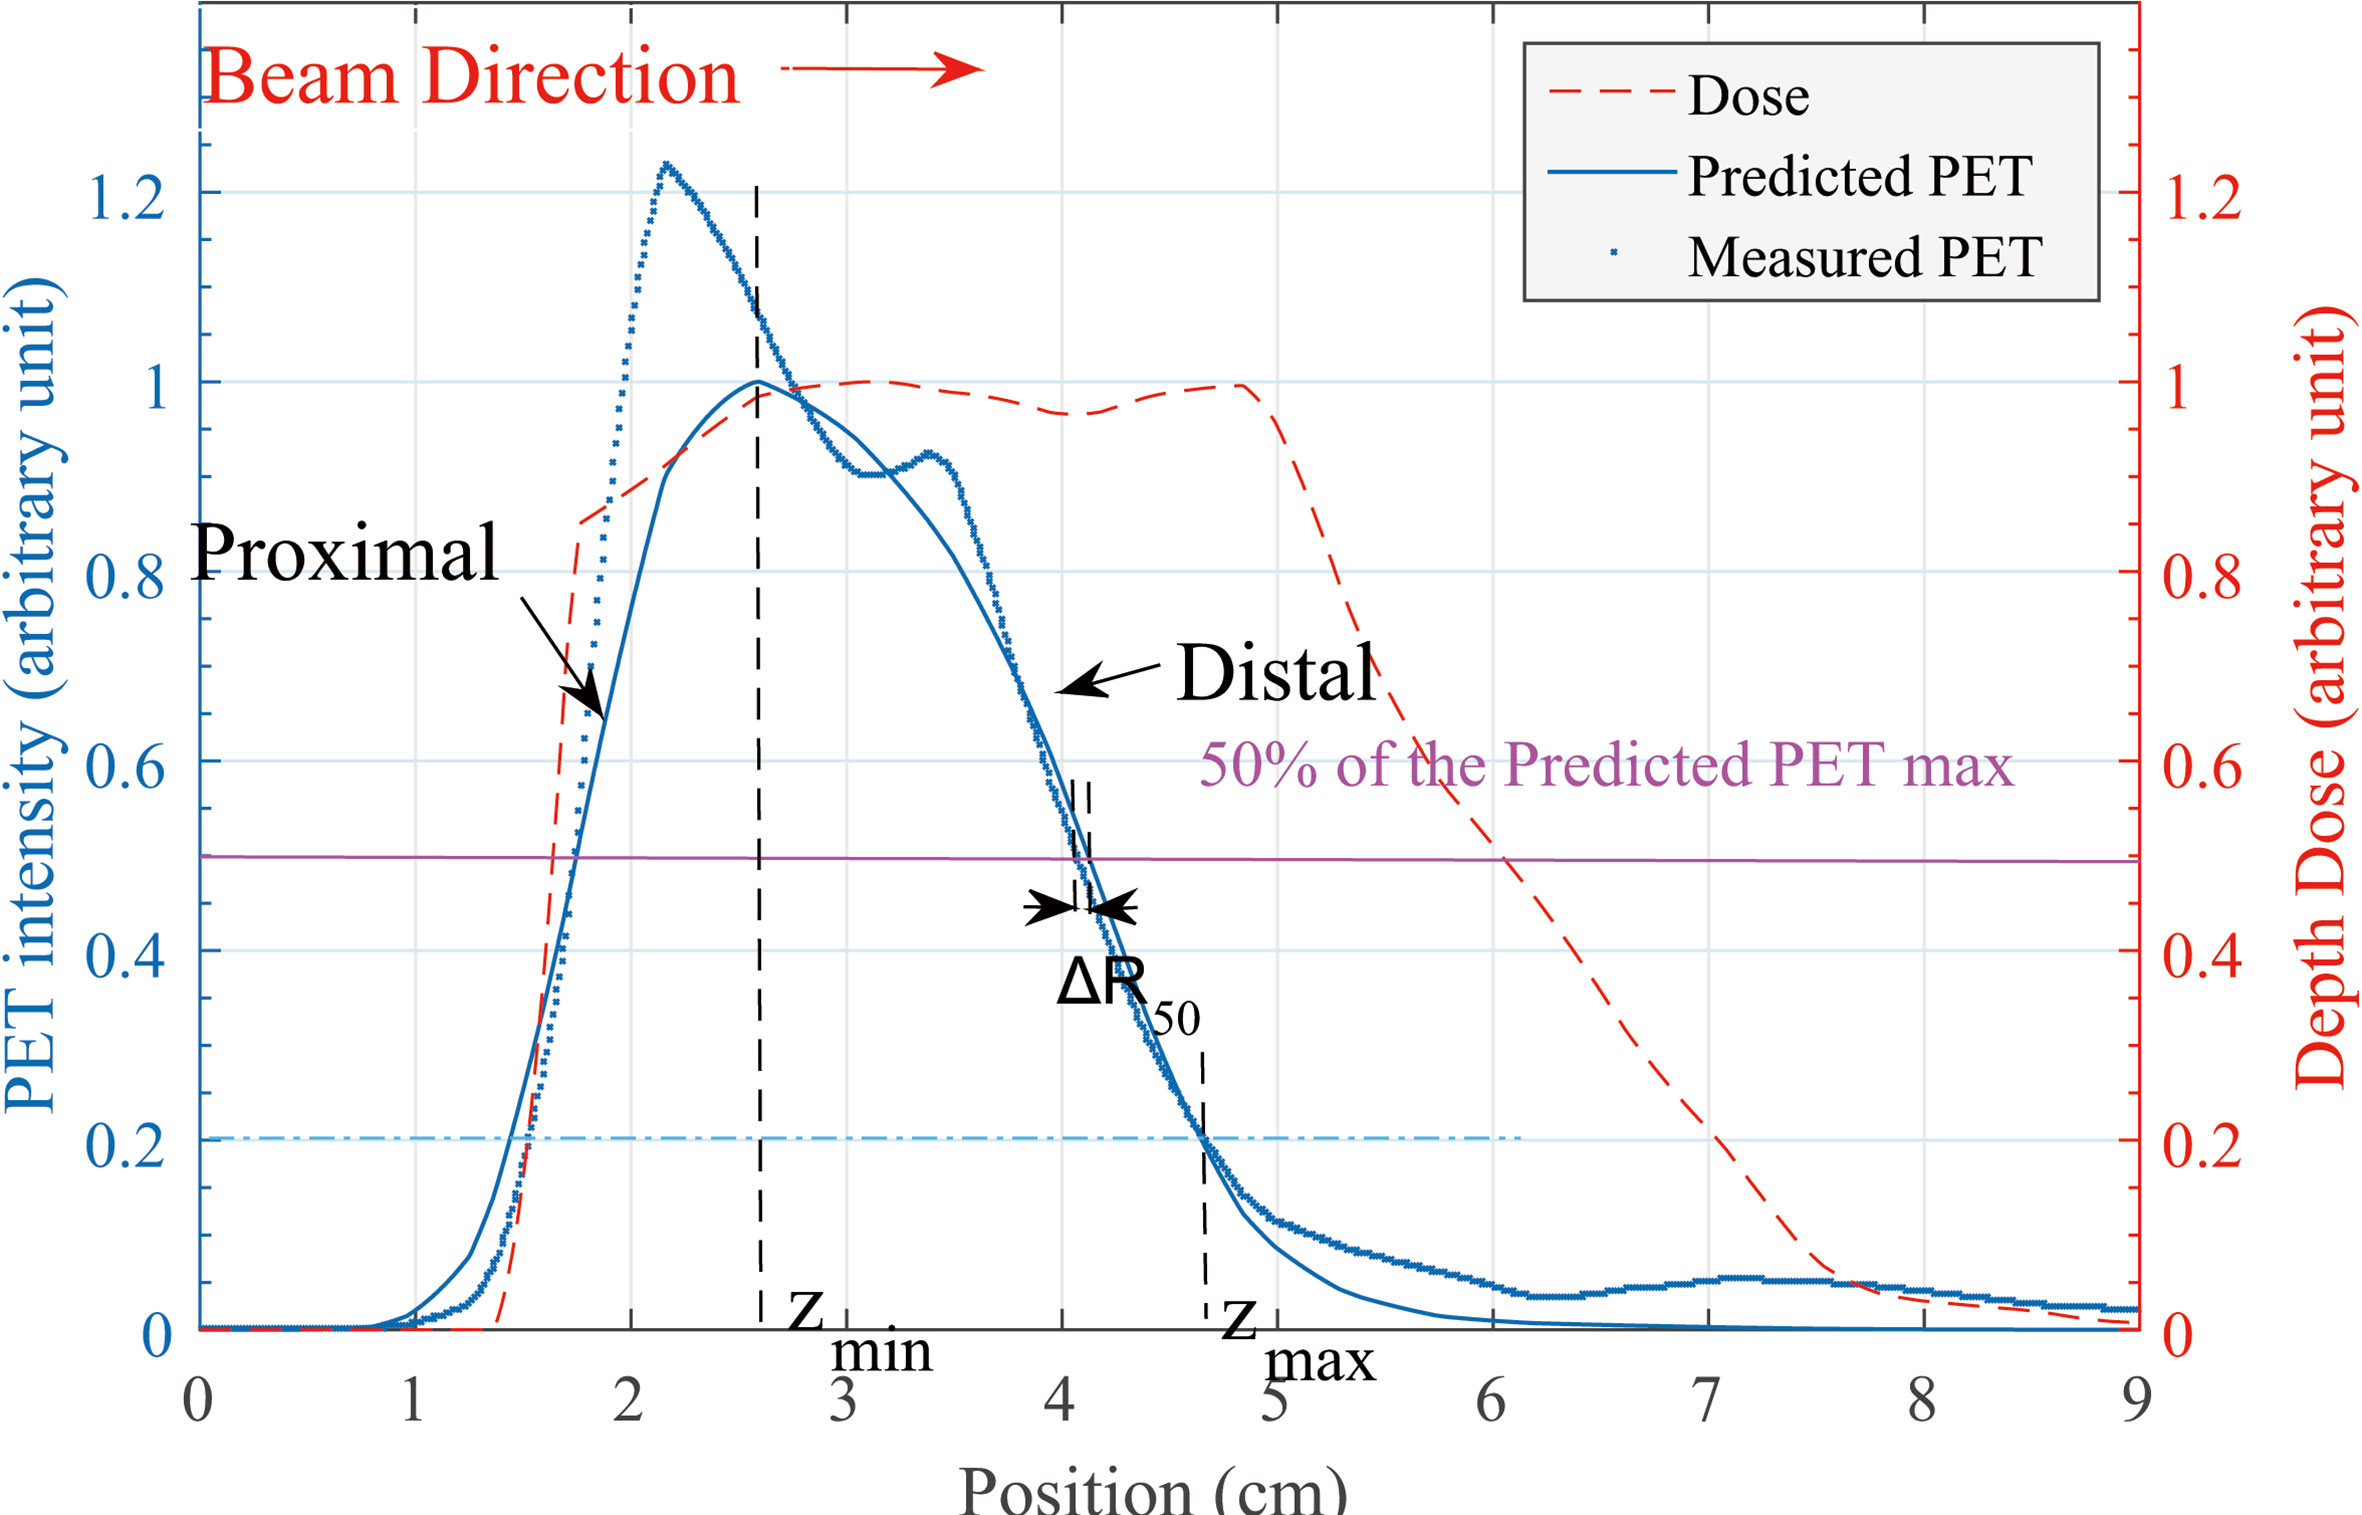
Figure 2 Predicted and measured PET 1-D curve. Along the beam direction, the depth error at distal edge is our concern. Definition of ΔR50 is shown in this figure. zmin and zmax location of the Rshift method is defined on the predicted PET curve.
Rshift Method: Segment-Based
Contrary to the R50 method, if we are not concerned about a certain point but a segment of the curve, then the depth error evaluation reflects the feature of the entire segment rather than a single point. One method to calculate the depth error for a segment of a curve is the Rshift method (3, 10, 20).
The kernel of the shift method is to find a shift distance δ that minimizes the difference between predicted and measured PET curves [Eq. (1)], this difference is presented as a cost function f(δ) [Eq. (2)].
In Eq. (2), A(z) is the PET activity depth distribution along the beam direction (for prediction and measurement, respectively) and δ is specified as a depth shift between two curves. The reason of the entire curve deviation between predicted and measured PET activity data is not fully understood in this work; by specifying the integral region [Zmin and Zmax in Eq. (2)], we focus on the curve difference in the distal edge area rather than the entire curve. We specify the Zmin as the peak position of the predicted PET curve and the Zmax as 20% of the maximum location (Figure 2).
In Eq. (2), the cost function f(δ) describes the difference between continuous curves in a region, but the data stored in the computer are always discrete data lists. Therefore, cost function f(δ) has both continuous and discrete descriptions. Here, in the discrete description of Eq. (2), i ∈ [0, M] is a list subscript index corresponding to the region [Zmin, Zmax] presented as a discretization data list Zi, and the value of δ should be chosen discretely with the same value interval of Zi, which is 3 mm, the same as our data grid voxel size and the curve’s spatial resolution. The value of δ is set in [–15,15]mm with a range step of 3 mm and f(δ) is plotted in Figure 3.
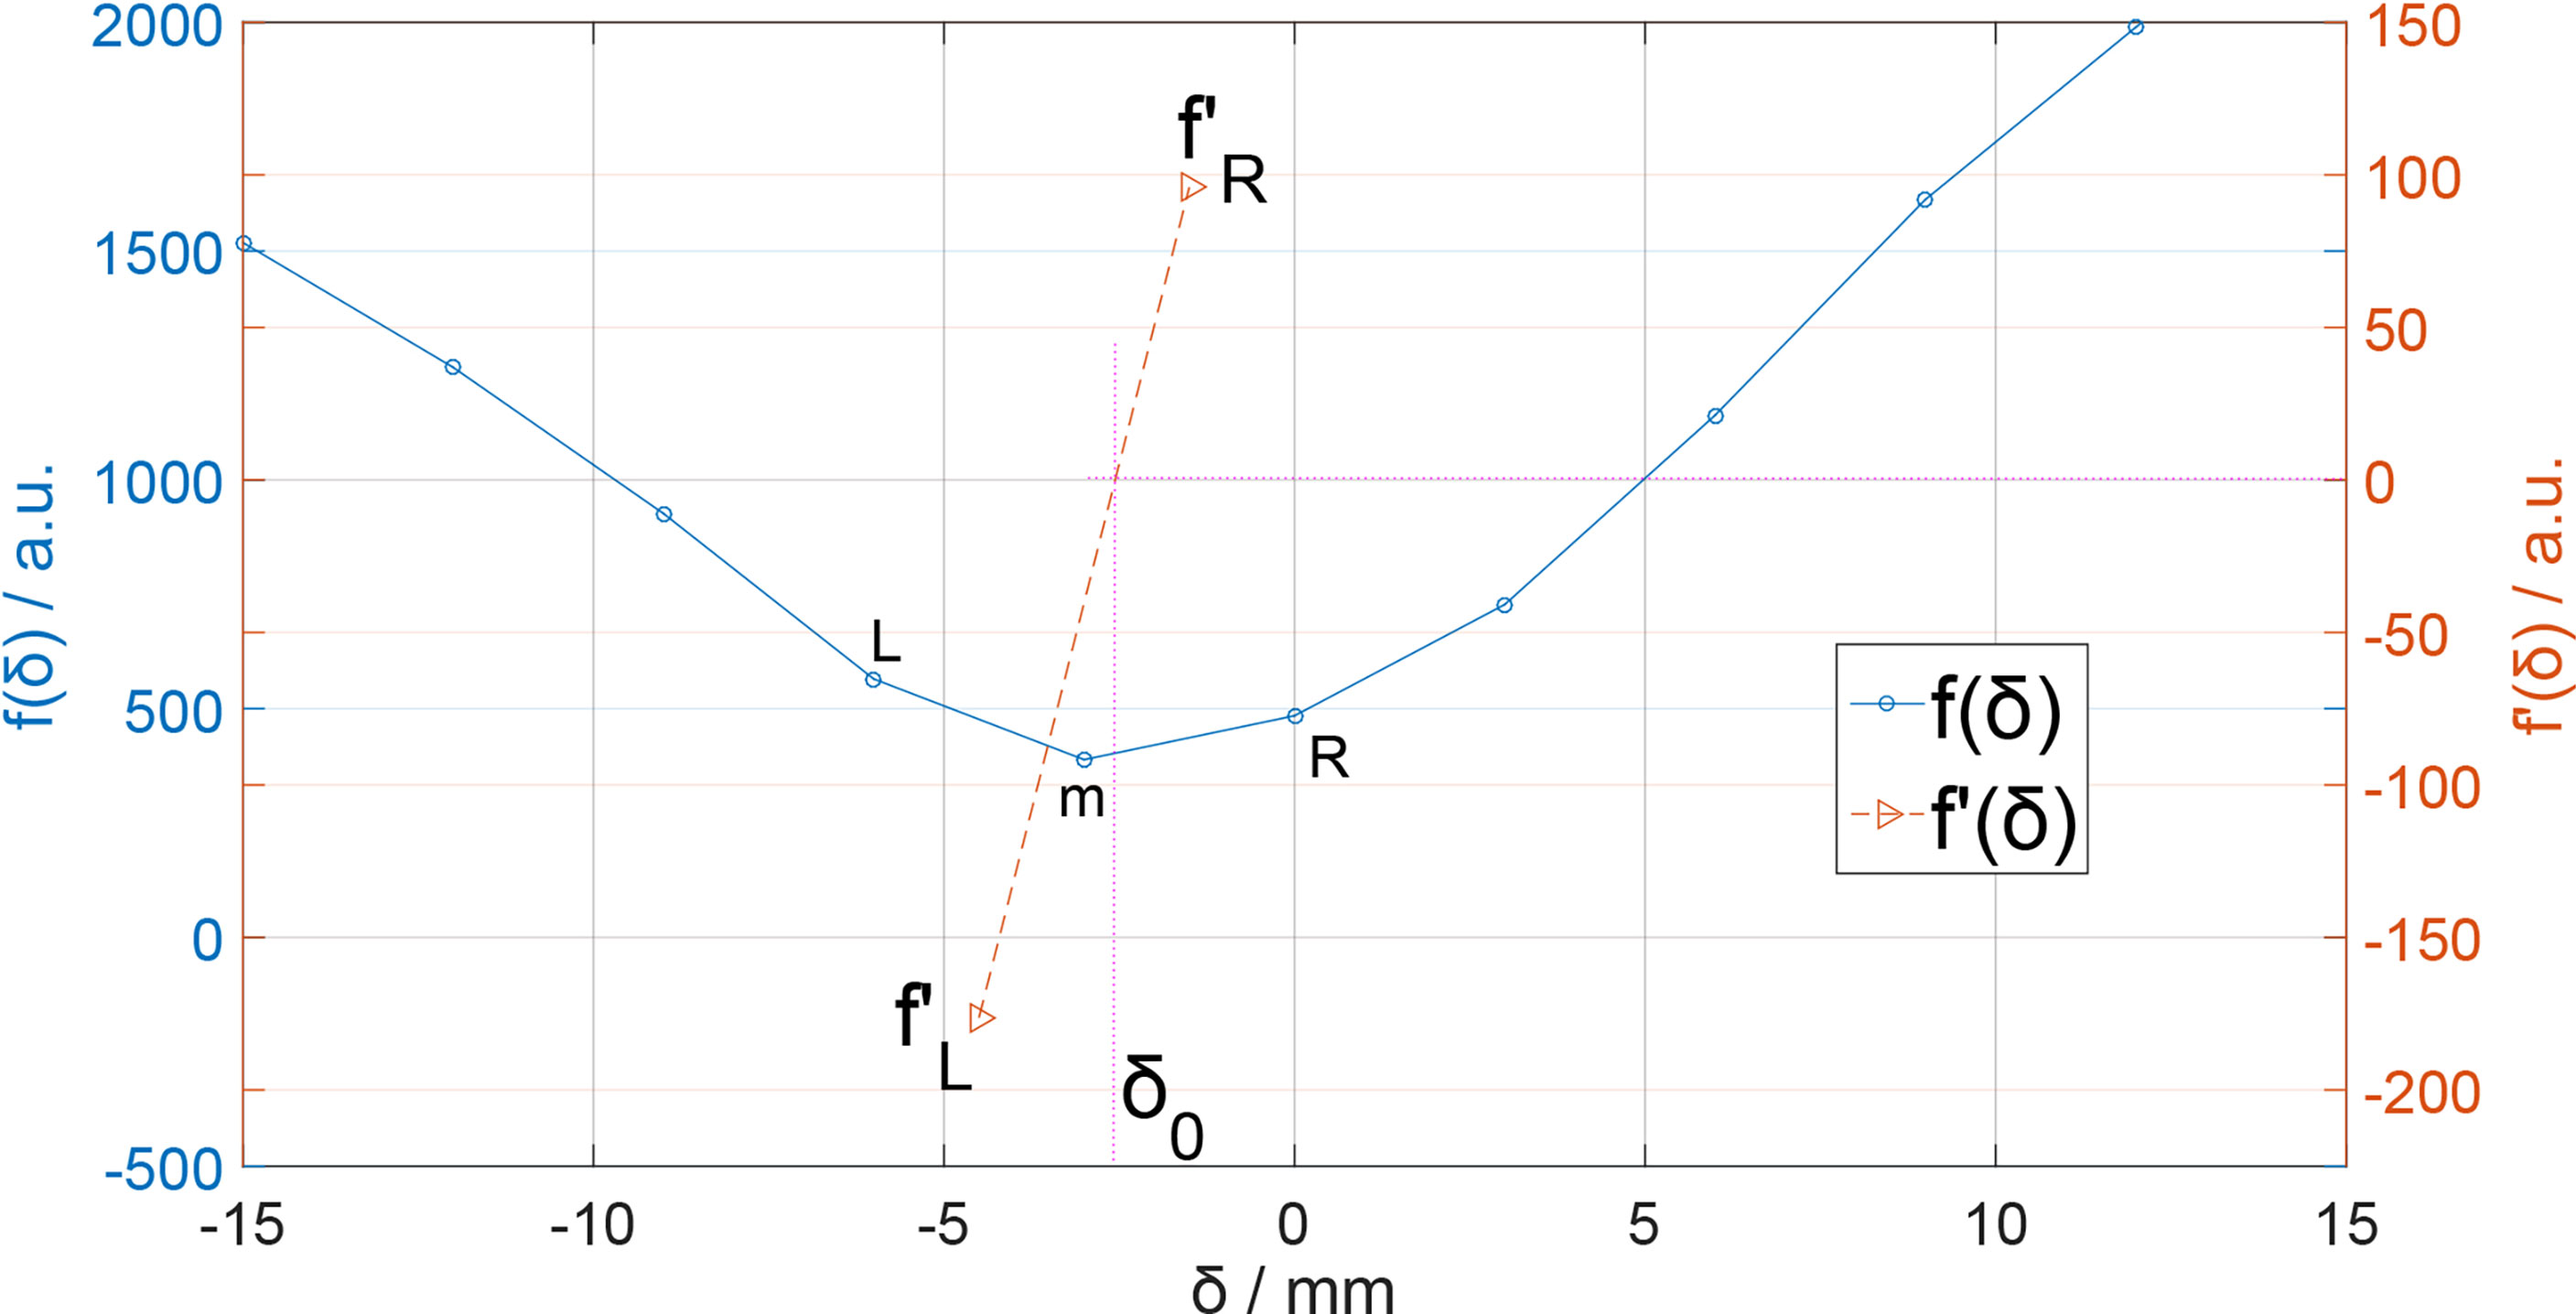
Figure 3 f(δ) and f'(δ) for seeking δ0. The position of δ0 is located where f'(δ0) = 0.
Obviously, there is a minimum value point on the f(δ) curve. If our δ sampling density was high enough, we can easily locate the minimum point of the f(δ) curve and the corresponding δ would be the ΔR for curves. In our case, however, the value of δ sampling step was 3 mm, which is not small enough. Here, we can use derivative interpolation to accurately find the minimum point of the f(δ) curve. In f(δ) discrete list, there is a minimum f(δm) with corresponding δm, which is in the discrete δ list (Figure 3); the point is recorded as point m[δm, f(δm)]. On the left and right side of point m, there are point L[δm-1, f(δm-1)] and point R[δm+1, f(δm+1)]. Obviously, the minimum point [δ0,f(δ0)] of f(δ) is between L and R. Then, we calculate the left and right derivative of point m:
We know that f(δm) is smaller than f(δm-1) and f(δm+1), so ; therefore, there must be a f'(δ0) = 0 and the corresponding δ0 is exactly the ΔRshift we want. We can easily estimate the δ0 by linearly interpolating :
Here, Δδ = 3mm is our data grid voxel size, and δm can be searched from the discrete f(δ) list. The δ0 in Eq. (4) is the point where f(δ) is minimized; thus, the integration in Eq. (1) is minimized, so the δ0 here is the ΔRshift we want.
Results
Both R50 and Rshift methods are applied to analyze the depth error of two fields of each patient. Depending on different types of dose distribution, depth error is scored and calculated for CTV, boost area, or both. The statistical result is in Table 1.
Table 1. Enrolled breast cancer patient information: age, planning dose, field, time course, and all their depth error. All patients are two-field cases. Patients may have different delay times before positron emission tomography scanning, but the data acquisition (Acq) time is the same for all cases. The ΔR50 and ΔRshift are scored in the CTV region and boost region (if exist). Different dose distribution strategies: Uniform: a dose is uniformly distributed in the CTV region in each fraction; Boost: dose is delivered to the tumor bed region in one fraction; SIB (simultaneous integrated boost): uniform and boost dose are simultaneously delivered in one fraction.
The mean value and standard deviation in Table 1 is calculated as:
The mean value of the depth error in all these 14 cases is within the range of [−3, 3] mm for both R50 and Rshift methods, except case 9 CTV region with the R50 method. The mean value and standard deviation of depth error of all cases are plotted in Figure 4, where the predicted PET depth is deeper than the measured PET if the ΔR is a positive value and vice versa. We can see that most patients have similar mean depth error calculated by R50 and Rshift methods in both field 1 and field 2. To evaluate whether the mean depth error from the two methods has significant difference, a paired Student’s t-test is applied. Setting the confidence level α = 0.01 and testing all the mean value of depth error, we get p = 0.541 > α which means the mean value of depth error has no significant difference between R50 and Rshift methods. Moreover, we also find that all cases have a smaller standard deviation of depth error calculated by Rshift rather than R50 except case 6. This can be roughly explained as the segment-based method refers more information to calculate a depth error result, which leads to higher robustness compared to R50, thus presenting a smaller standard deviation.
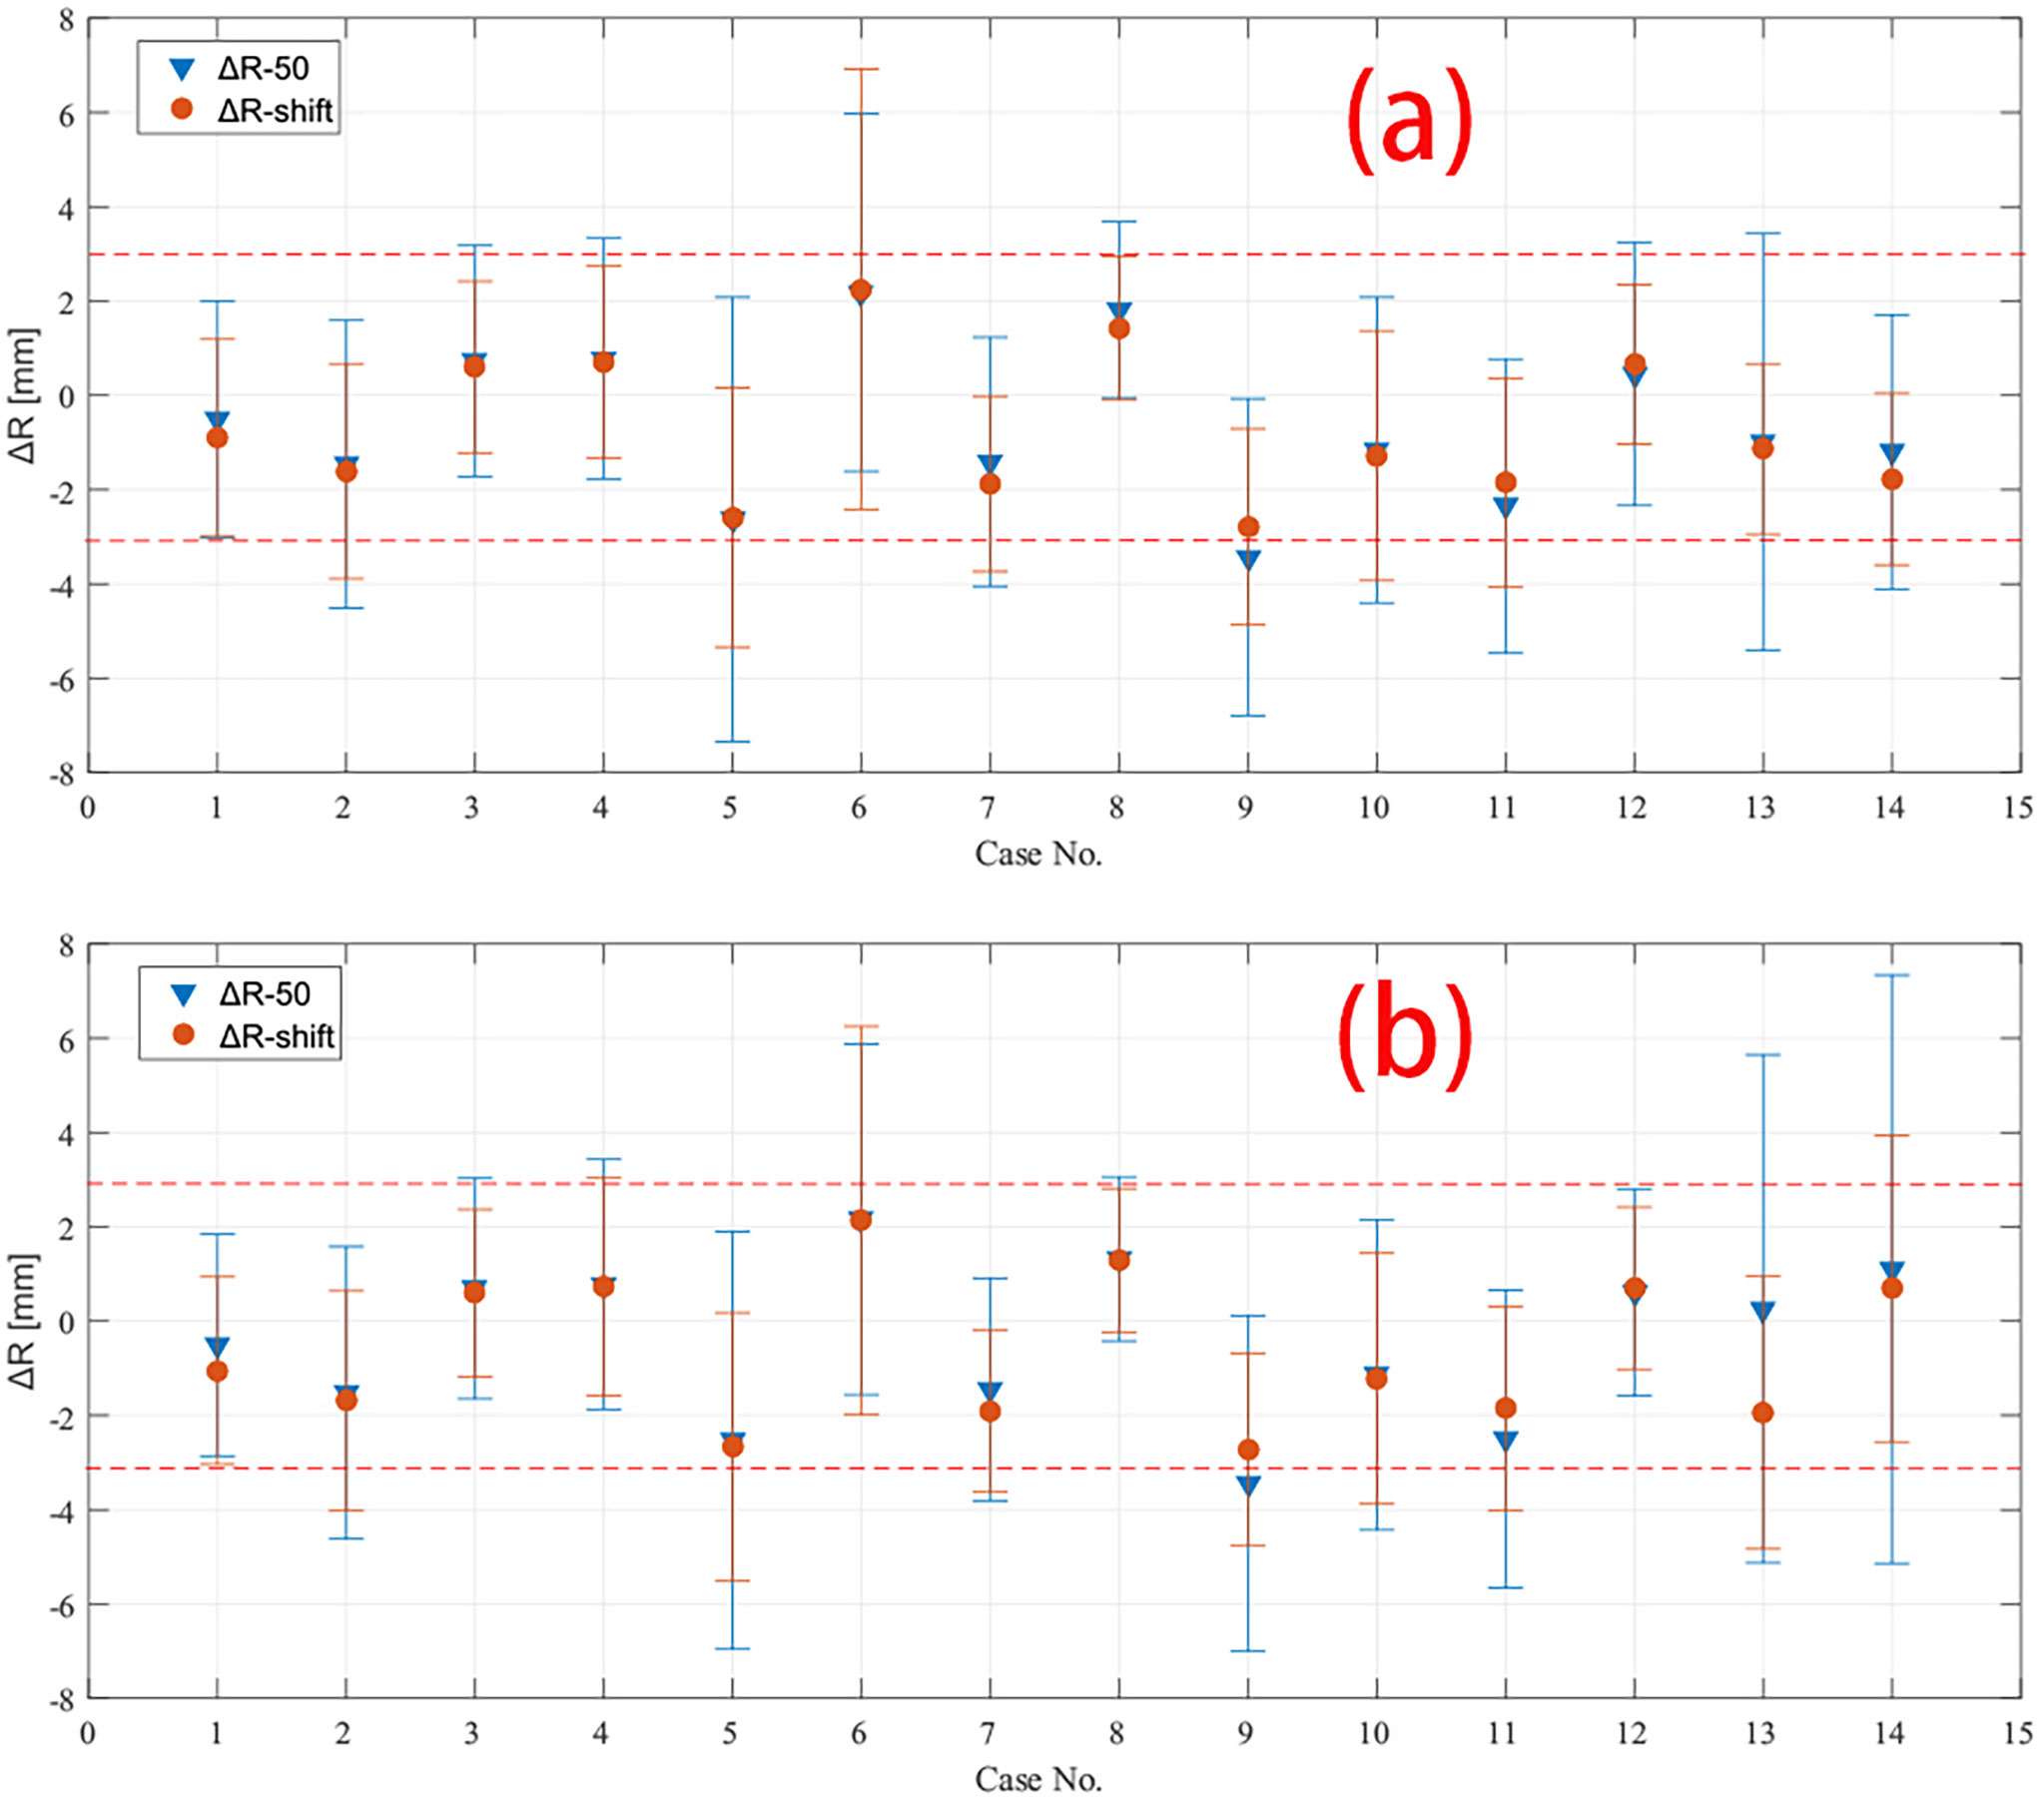
Figure 4 Depth error of all 14 cases calculated by both R50 and Rshift methods in (A) field 1 and (B) field 2. The mean and standard deviation of depth error in CTV region of all cases are plotted except case 7 and 8, which have only data in boost region to be plotted. The red dashed line marked −3 mm and 3 mm in the plot.
Besides a global result analysis in Figure 4, a detailed result of a case is shown in Figure 5. The CTV and boost ROI is projected on the BEV plane whose edge circles an area, as shown in Figures 5A–D. Inside the boost region, we can see several positive ΔR pixels, and in Table 1, we can see that the mean value of ΔR of case 10 in the boost region is a positive number. In addition, the result of the Rshift method (Figures 5B, D) shows a smoother ΔR distribution than the R50 method (Figures 5A, C). The ΔR distribution in the boost region is also plotted as a histogram in Figures 5E, F, which indicates that R50 and Rshift methods give similar mean depth errors but different distribution widths.
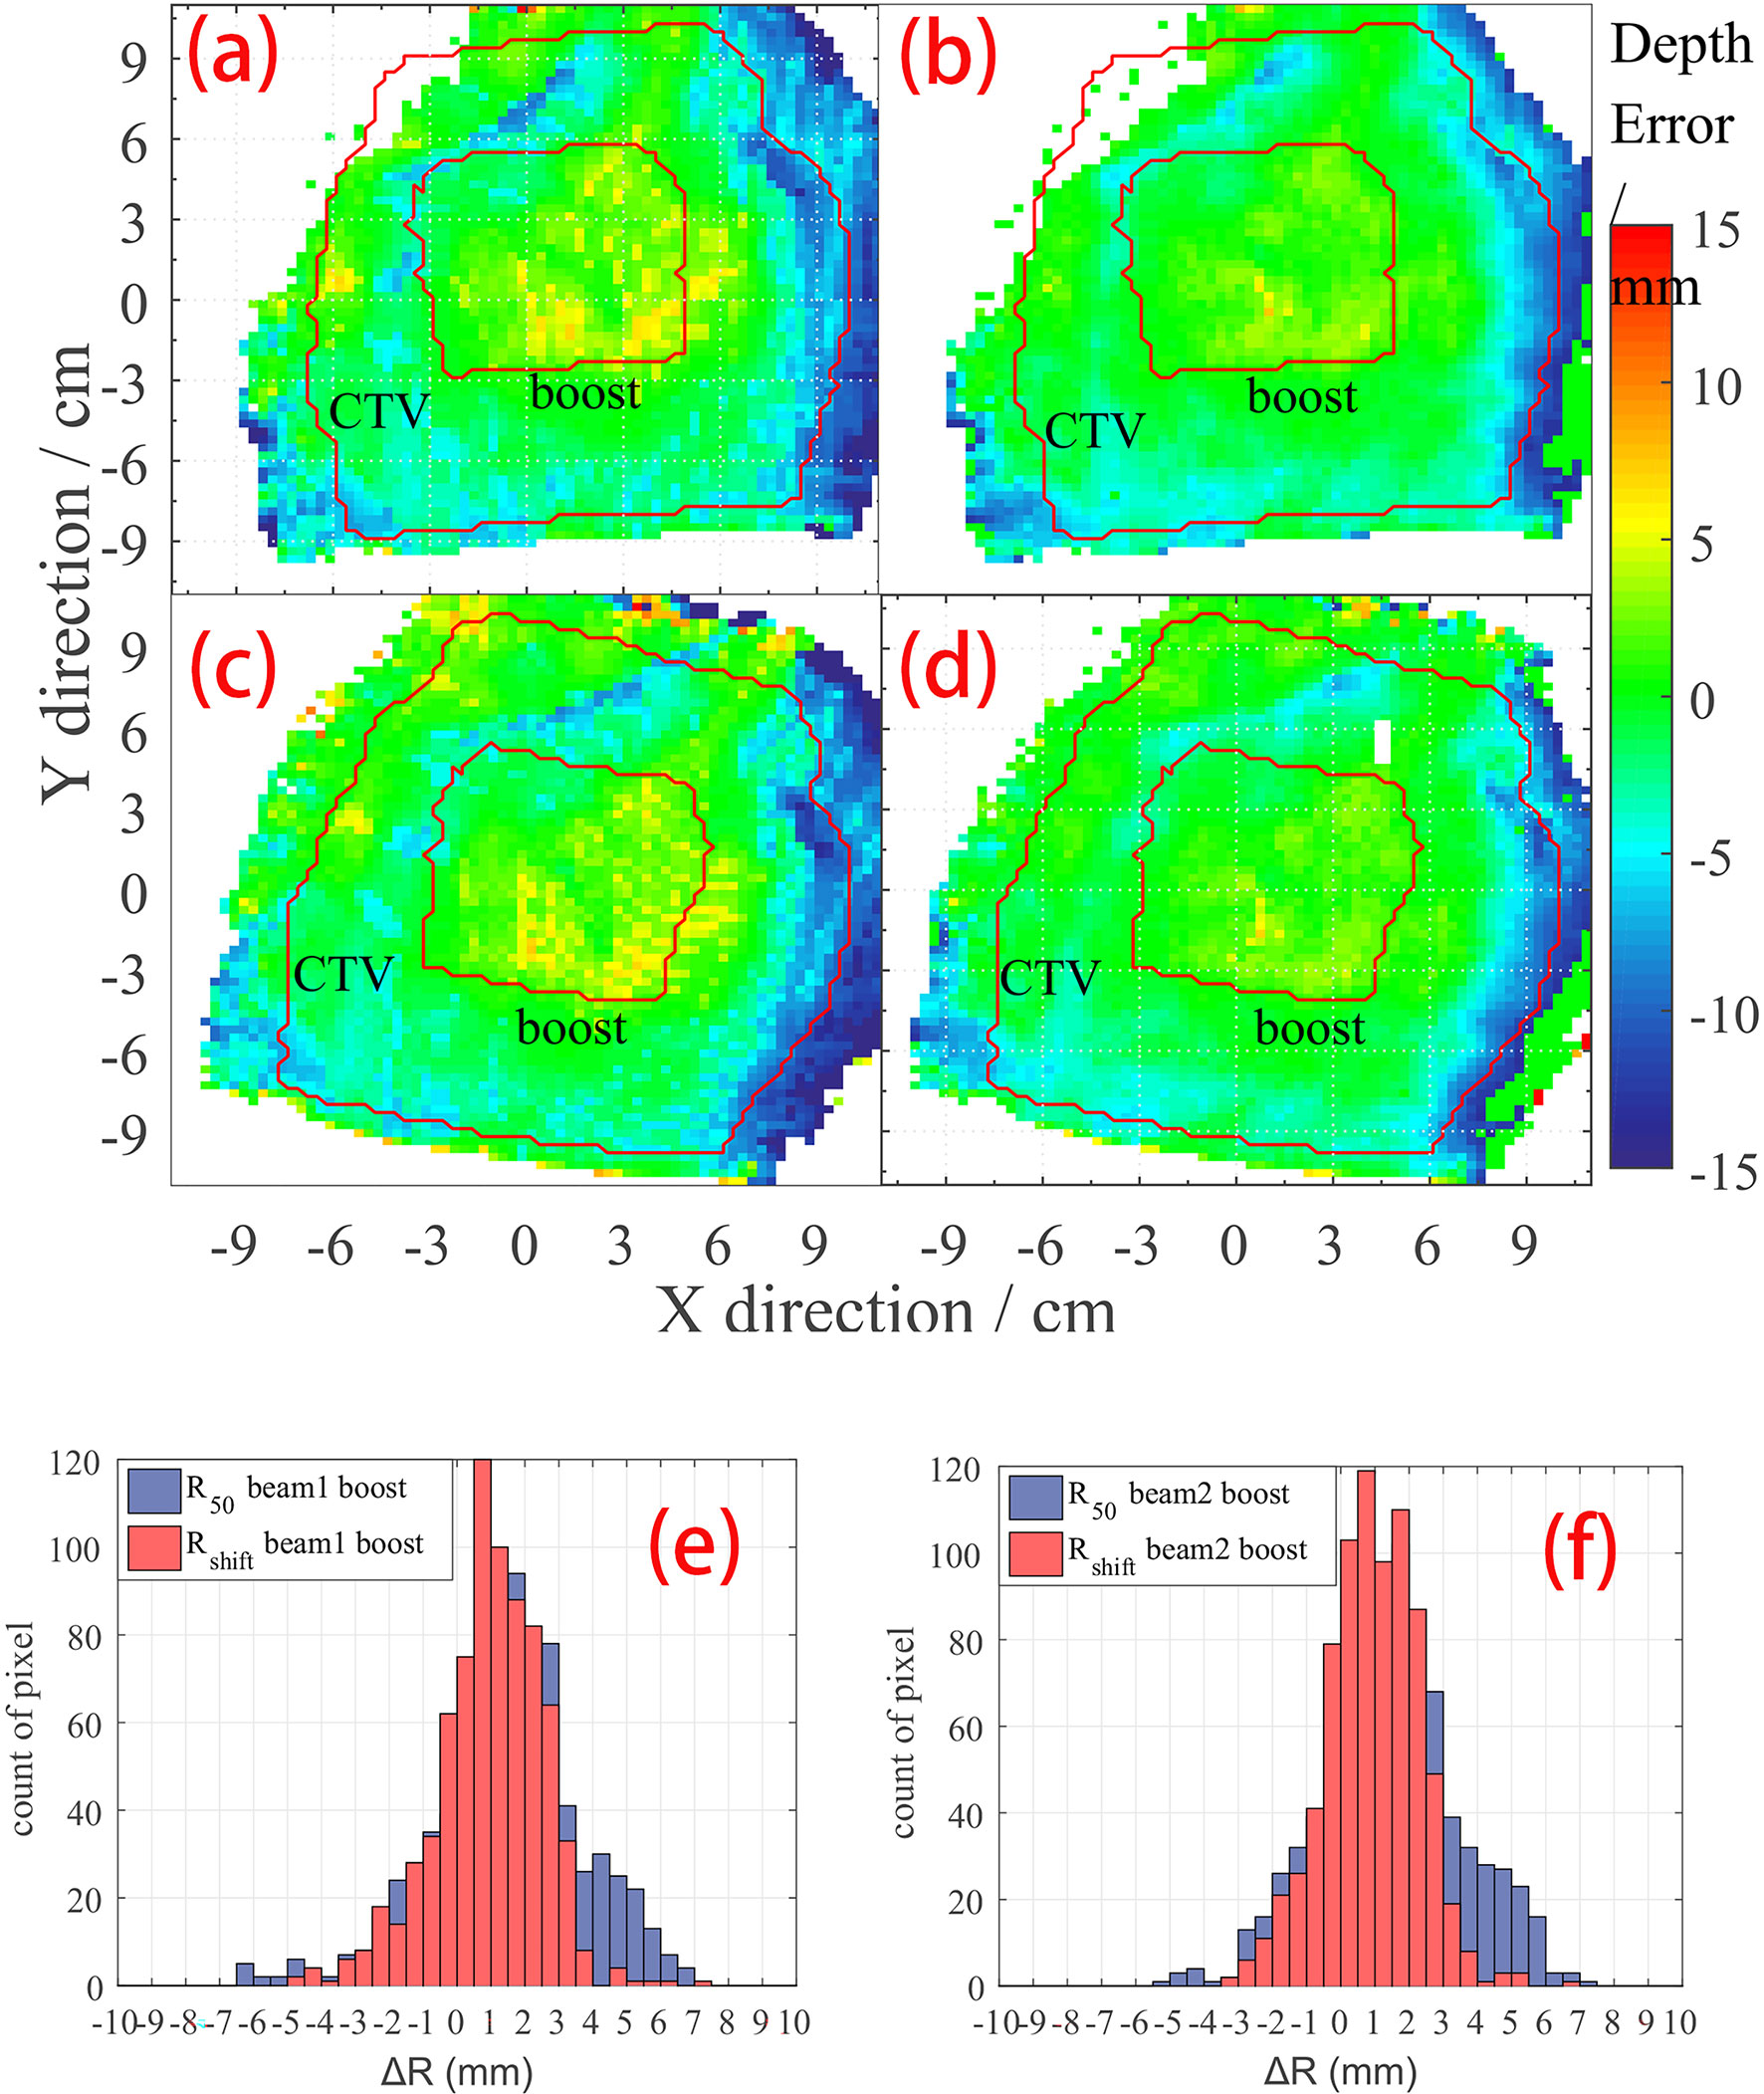
Figure 5 ΔR detail result of case no. 10. The CTV and boost areas are marked within the red curve. (A) R50 depth error map on beam 1; (B) Rshift depth error map on beam 1; (C) R50 depth error map on beam 2; (D) Rshift depth error map on beam 2. Histogram of depth error statistic on boost region on (E) beam 1 view, and (F) beam 2 view of case no. 10.
Discussion
Zmin and Zmax in Rshift Integration
In our calculations with the Rshift method (Section R50 Method: Point-Based), the integration range [zmin, zmax] in Eq. (1) is simply specified as the range from the peak position to 20% of the peak value on the distal tail of the curve. Herein, the dose delivery is limited within the breast area with a high carbon component and low biological washout rate. Therefore, the PET image shows a smooth single peak curve if we score the data along the beam direction. Under this condition, we do not need to define a complex method to find out a specific zmin and zmax for Eq. (1). Frey provides a method (20) to locate zmin and zmax that can optimize the curve shape of f(δ) to achieve a more reasonable depth error result. In our study, however, the anatomical structure is not complex, which provides good stability to the result, so that zmin and zmax need no further optimization.
“Off-line” PET and “In-beam” PET
“Off-line” PET is applied in this work. The “off-line” PET scanner with a full ring detector system has been widely used in nuclear medicine clinical application. Mature device and reconstruction algorithm reduces the cost of use. However, the long transport time makes the contribution of short-lived isotopes undetectable; also, the co-registration between plan-CT and PET-CT may introduce additional geometrical error.
“In-beam” PET, on the other hand, can acquire the induced PET signal in time and thus collect the activity contributed by short-life isotopes. Higher signal intensity gives higher image accuracy and thus better comparison results in data analyzing. However, the in-beam PET requires a complex PET scanner installed inside the treatment room, and it is hard to construct a full ring to avoid blocking the beam path. A PET scanner with an incomplete ring will introduce more noise to data reconstruction and will need a more accurate reconstruction algorithm.
The breast cancer cases in this work have a relative higher yield of long-life isotope (like carbon-11); thus, “off-line” PET is applicable in this work.
Conclusions
PET could be used in depth error verification after proton therapy. Point-based and segment-based methods show no significant difference in the mean depth error result, which is within [−3, 3] mm. The segment-based methods have higher robustness with smaller standard deviation, while the point-based method has a relatively larger standard deviation. Both point-based and segment-based methods are suitable in the data analysis of our breast cancer cases, while the point-based method is more appropriate because of the low cost in the calculation.
Data Availability Statement
The original contributions presented in the study are included in the article/supplementary material. Further inquiries can be directed to the corresponding authors.
Ethics Statement
The studies involving human participants were reviewed and approved by the Ethics Committee of Shanghai Proton and Heavy Ion Center. The patients/participants provided their written informed consent to participate in this study. Written informed consent was obtained from the individual(s) for the publication of any potentially identifiable images or data included in this article.
Author Contributions
JZ was responsible for writing the original draft. YL was responsible for writing the original draft and review. YXS and WW were responsible for methodology. ZH was responsible for data curation. JC was responsible for conceptualization. RZ was responsible for supervision. YS was responsible for funding acquisition. All authors contributed to the article and approved the submitted version.
Funding
This project was supported by the Shanghai Municipal Health Commission (Grant No. 202040279), the Pudong New Area Science and Technology Development Foundation (No. PKJ 2020-Y56), and the Natural Science Foundation of Shanghai (21ZR1460300).
Conflict of Interest
The authors declare that the research was conducted in the absence of any commercial or financial relationships that could be construed as a potential conflict of interest.
The reviewer WH declared a past co-authorship with the authors to the handling editor.
Publisher’s Note
All claims expressed in this article are solely those of the authors and do not necessarily represent those of their affiliated organizations, or those of the publisher, the editors and the reviewers. Any product that may be evaluated in this article, or claim that may be made by its manufacturer, is not guaranteed or endorsed by the publisher.
References
1. Kraan AC. Range Verification Methods in Particle Therapy: Underlying Physics and Monte Carlo Modeling. Front Oncol (2015) 5:150. doi: 10.3389/fonc.2015.00150
2. Bauer J, Unholtz D, Kurz C, Parodi K. An Experimental Approach to Improve the Monte Carlo Modelling of Offline PET/CT-Imaging of Positron Emitters Induced by Scanned Proton Beams. Phys Med Biol (2013) 58:5193–213. doi: 10.1088/0031-9155/58/15/5193
3. Knopf A, Parodi K, Paganetti H, Cascio E, Bonab A, Bortfeld T. Quantitative Assessment of the Physical Potential of Proton Beam Range Verification With PET/Ct. Phys In Med And Biol (2008) 53:4137–51. doi: 10.1088/0031-9155/53/15/009
4. Nishio T, Sato T, Kitamura H, Murakami K, Ogino T. Distributions of β+ Decayed Nuclei Generated in the CH2 and H2O Targets by the Target Nuclear Fragment Reaction Using Therapeutic MONO and SOBP Proton Beam. Med Phys (2005) 32:1070–82. doi: 10.1118/1.1879692
5. Ferrero V, Bisogni MG, Camarlinghi N, Fiorina E, Giraudo G, Morrocchi M, et al. Double-Field Hadrontherapy Treatment Monitoring With the INSIDE In-Beam PET Scanner: Proof of Concept. IEEE Trans Radiat Plasma Med Sci (2018) 2:588–93. doi: 10.1109/TRPMS.2018.2870478
6. Sebastian PN, Bauer J, Welzel T, Rief H, Jäkel O, Haberer T, et al. Clinical Implementation and Range Evaluation of In Vivo PET Dosimetry for Particle Irradiation in Patients With Primary Glioma. Radiother Oncol (2015) 115:179–185. doi: 10.1016/j.radonc.2015.03.022
7. Parodi K, Harald P, Shih HA, Michaud S, Loeffler JS, DeLaney TF, et al. Patient Study of In Vivo Verification of Beam Delivery and Range, Using Positron Emission Tomography and Computed Tomography Imaging After Proton Therapy. Int J Of Radiat Oncol Biol Phys (2007) 68:920–34. doi: 10.1016/j.ijrobp.2007.01.063
8. Knopf A-C, Parodi K, Paganetti H, Bortfeld T, Daartz J, Engelsman M, et al. Accuracy of Proton Beam Range Verification Using Post-Treatment Positron Emission Tomography/Computed Tomography as Function of Treatment Site. Int J Radiat Oncol Biol Phys (2011) 79:297–304. doi: 10.1016/j.ijrobp.2010.02.017
9. Ferrero V, Fiorina E, Morrocchi M, Pennazio F, Baroni G, Battistoni G, et al. Online Proton Therapy Monitoring: Clinical Test of a Silicon-Photodetector-Based in-Beam PET. Sci Rep (2018) 8:4100. doi: 10.1038/s41598-018-22325-6
10. Knopf A, Parodi K, Bortfeld T, Shih HA, Paganetti H. Systematic Analysis of Biological and Physical Limitations of Proton Beam Range Verification With Offline PET/CT Scans. Phys Med Biol (2009) 54:4477. doi: 10.1088/0031-9155/54/14/008
11. Min CH, Zhu X, Winey BA, Grogg K, Testa M, Fakhri GE, et al. Clinical Application of In-Room Positron Emission Tomography for In Vivo Treatment Monitoring in Proton Radiation Therapy. Int J Radiat Oncol Biol Phys (2013) 86:183 – 189. doi: 10.1016/j.ijrobp.2012.12.010
12. Min CH, Zhu X, Grogg K, Fakhri GE, Winey B, Paganetti H. A Recommendation on How to Analyze In-Room PET for In Vivo Proton Range Verification Using a Distal PET Surface Method. Technol Cancer Res Treat (2014) 14:320–5. doi: 10.1177/1533034614547457
13. Parodi K, Bortfeld T. A Filtering Approach Based on Gaussian–powerlaw Convolutions for Local PET Verification of Proton Radiotherapy. Phys Med Biol (2006) 51:1991. doi: 10.1088/0031-9155/51/8/003
14. Frey K, Bauer J, Unholtz D, Kurz C, Kraemer M, Bortfeld T, et al. TPSPET-A TPS-Based Approach for In Vivo Dose Verification With PET in Proton Therapy. Phys In Med And Biol (2014) 59:1–21. doi: 10.1088/0031-9155/59/1/1
15. Mizuno H, Tomitani T, Kanazawa M, Kitagawa A, Pawelke J, Iseki Y, et al. Washout Measurement of Radioisotope Implanted by Radioactive Beams in the Rabbit. Phys Med Biol (2003) 48:2269–81. doi: 10.1088/0031-9155/48/15/302
16. Jakoby BW, Bercier Y, Conti M, Casey ME, Bendriem B, Townsend DW. Physical and Clinical Performance of the mCT Time-of-Flight PET/CT Scanner. Phys In Med And Biol (2011) 56:2375–89. doi: 10.1088/0031-9155/56/8/004
17. Shepp LA, Vardi Y. Maximum Likelihood Reconstruction for Emission Tomography. IEEE Trans Med Imaging (1982) 1:113. doi: 10.1109/TMI.1982.4307558
18. Hudson HM, Larkin RS. Accelerated Image Reconstruction Using Ordered Subsets of Projection Data. IEEE Trans Med Imaging (1994) 13:601–9. doi: 10.1109/42.363108
19. Zhang J, Lu Y, Hsi W, Zhang J, Sheng Y, Shi L, et al. Evaluation of Proton Therapy Accuracy Using a PMMA Phantom and PET Prediction Module. Front Oncol (2018) 8:523. doi: 10.3389/fonc.2018.00523
20. Frey K, Unholtz D, Bauer J, Debus J, Min CH, Bortfeld T, et al. Automation and Uncertainty Analysis of a Method for in-Vivo Range Verification in Particle Therapy. Phys Med Biol (2014) 59:5903–19. doi: 10.1088/0031-9155/59/19/5903
21. Chen W, Bauer J, Kurz C, Tessonnier T, Handrack J, Haberer T, et al. A Dedicated Software Application for Treatment Verification With Off-Line PET/CT Imaging at the Heidelberg Ion Beam Therapy Center. J Physics: Conf Ser (2017) 777:12–21. doi: 10.1088/1742-6596/777/1/012021
Keywords: proton therapy, breast cancer, positron emission tomography, depth verification, methods comparison
Citation: Zhang J, Lu Y, Sheng Y, Wang W, Hong Z, Sun Y, Zhou R and Cheng J (2021) A Comparative Study of Two In Vivo PET Verification Methods in Clinical Cases. Front. Oncol. 11:617787. doi: 10.3389/fonc.2021.617787
Received: 15 October 2020; Accepted: 16 August 2021;
Published: 03 September 2021.
Edited by:
Beate Timmermann, Essen University Hospital, GermanyReviewed by:
Piergiorgio Cerello, National Institute of Nuclear Physics, ItalyWen Chien Hsi, Baptist Hospital of Miami, United States
Copyright © 2021 Zhang, Lu, Sheng, Wang, Hong, Sun, Zhou and Cheng. This is an open-access article distributed under the terms of the Creative Commons Attribution License (CC BY). The use, distribution or reproduction in other forums is permitted, provided the original author(s) and the copyright owner(s) are credited and that the original publication in this journal is cited, in accordance with accepted academic practice. No use, distribution or reproduction is permitted which does not comply with these terms.
*Correspondence: Jingyi Cheng, amNoZW5nMTNAZnVkYW4uZWR1LmNu
†These authors have contributed equally to this work