 Mu-xing Li
 Dian-rong Xiu
- Department of General Surgery, Peking University Third Hospital, Beijing, China
Introduction: Macrophage phenotype switch plays a vital role in the progression of malignancies. We aimed to build a prognostic signature by exploring the expression pattern of macrophage phenotypic switch related genes (MRGs) in the Cancer Genome Atlas (TCGA)—pancreatic adenocarcinoma (PAAD), Genotype-Tissue Expression (GTEx)-Pancreas, and Gene Expression Omnibus (GEO) databases.
Methods: We identified the differentially expressed genes between the PAAD and normal tissues. We used single factor Cox proportional risk regression analysis, Least Absolute Shrinkage and Selection Operator (LASSO) analysis, and multivariate Cox proportional hazard regression analysis to establish the prognosis risk score by the MRGs. The relationships between the risk score and immune landscape, “key driver” mutations and clinicopathological factors were also analyzed. Gene-set enrichment analysis (GSEA) analysis was also performed.
Results: We detected 198 differentially expressed MRGs. The risk score was constructed based on 9 genes (KIF23, BIN1, LAPTM4A, ERAP2, ATP8B2, FAM118A, RGS16, ELMO1, RAPGEFL1). The median overall survival time of patients in the low-risk group was significantly longer than that of patients in the high-risk group (P < 0.001). The prognostic value of the risk score was validated in GSE62452 dataset. The prognostic performance of nomogram based on risk score was superior to that of TNM stage. And GSEA analysis also showed that the risk score was closely related with P53 signaling pathway, pancreatic cancer and T cell receptor signaling pathway. qRT-PCR assay showed that the expressions of the 9 MRGs in PDAC cell lines were higher than those in human pancreatic ductal epithelium cell line.
Conclusions: The nine gene risk score could be used as an independent prognostic index for PAAD patients. Further studies validating the prognostic value of the risk score are warranted.
Introduction
Pancreatic ductal adenocarcinoma (PDAC), with an estimated 5-year overall survival rate less than 10%, is the fourth leading cause of cancer-related mortality in the world (1). And its incidence is still increasing these years due to lifestyle change and improved medical detection technology. Majority of pancreatic cancer patients were usually at advanced stages at their initial diagnosis. The lack of effective systematic therapies and useful prognostic indexes deteriorates the dismal prognosis of pancreatic cancer patients (2).
With the development of high-throughput technologies, molecular characterization may shed light on newer therapeutic targets (3). Therefore, it is essential to identify molecular prognostic factors of pancreatic cancer which aid in rational stratification of patients according to the clinical prognosis as well as in providing potentially therapeutic targets (4).
It has long been held that the dismal therapeutic effects in pancreatic cancer can largely be attributed to the complex tumor microenvironment (TME). Macrophages are one of the most abundant immune cells in PDAC tumor microenvironment (5). According to their polarization states, macrophages are roughly categorized into two types: classically activated type 1 (M1 macrophages), and alternatively activated type 2 (M2 macrophages) (6). M1 macrophages, characterized by the expression of the inducible-type nitric oxide synthase (iNOS), are pro-inflammatory and develop in response to lipopolysaccharides (LPS) or interferon-γ (IFN-γ). M2 macrophages, or anti-inflammatory macrophages, develop in response to interleukin (IL)-4, IL-13 or glucocorticoids, and are characterized by the secretion of anti-inflammatory mediators, including transforming growth factor-β1 (TGF-β1) and IL-10 to promote extracellular matrix remodeling and angiogenesis (7). M2 macrophages exert pro-tumor functions, whereas M1 macrophages exert anti-tumor functions (8). The macrophage phenotypic switch related gene (MRGs) may provide us with in-depth information on the prognosis of PAAD patients (9).
In the present study, we aimed to build a prognostic model via thorough investigation of the cancer genome atlas (TCGA) database, Genotype-Tissue Expression (GTEx) database and Gene Expression Omnibus (GEO) database. We hoped that our prognostic risk score could aid in the prognostic prediction as well as the treatment strategy design.
Methods
Data Collection
We collected the transcriptome profiles of pancreatic adenocarcinoma (PAAD) available in the TCGA database (https://portal.gdc.cancer.gov/) and Genotype-Tissue Expression (GTEx) GTEx-Pancreas datasets (https://xenabrowser.net/) on July 5th, 2020. Our study included the expression profile of 171 normal samples and 177 PAAD samples. The clinicopathological information including gender, age, tumor grade, T classification, N classification, M classification, TNM stage, follow-up time, and survival status of the patients from TCGA-PAAD was also retrieved (10). We excluded samples with follow-up time shorter than 30 days and samples with missing clinicopathological information. For validation, gene expression data and clinical data of 70 PAAD patients in GSE62452 was downloaded from Gene Expression Omnibus (GEO) database (https://www.ncbi.nlm.nih.gov/geo/). The flow of the study was shown in Figure S1.
Gene Set Selection
Two macrophage phenotype switch related gene sets (GSE5099_CLASSICAL_M1_VS_ALTERNATIVE_M2_MACROPHAGE_UP, GSE5099_CLASSICAL_M1_VS_ALTERNATIVE_M2_MACROPHAGE_DN) (11) were selected from the Molecular Signatures Database v7.1 (MSigDB) (12) (https://www.gsea-msigdb.org/gsea/msigdb/index.jsp). No overlapped genes were detected and a total of 382 genes were retrieved (Table S1). The expression data of the 382 MRGs was extracted. Since the data was retrieved from public datasets and we followed the respective publishing guidelines, no ethics approval was needed.
Screening of Differentially Expressed MRGs
We collected the mean expression data of 382 MRGs comprising 177 PAAD and 171 non-tumor samples. The mean expression values were then normalized by log2 transformation. The differentially expressed MRGs between tumor and normal samples were identified using the Wilcoxon signed-rank test in R (version 4.0.2, https://www.r-project.org/) with a threshold of |log(foldchange)| > 1 and a false discovery rate (FDR) < 0.05.
Identification of the Prognostic Signatures
We built the prognostic signatures in three steps: 1) we conducted univariate Cox regression analysis of the MRGs by “survival” in R. Genes with P < 0.05 were chosen for Lasso Cox regression analysis. 2) The Lasso Cox regression analysis (13) which was implemented with “glmnet” and “survival” packages in R was utilized to remove highly correlated genes and to prevent over-fitting. 3) Risk scores were calculated as the sum of each gene’s expression levels multiplying the regression coefficient in the multivariate Cox regression model. Patients were dichotomized into high-risk group and low-risk group by median value of risk score. The Kaplan-Meier method was utilized to compare the survival outcome between high-risk group and low-risk group. Time dependent receiver operating characteristic (ROC) curves by R package “survivalROC” (14) was also used to determine the efficacy of the prognostic model.
We developed a prognostic nomogram predicting OS based on the Cox proportional hazard regression model by the “rms” package in R. A concordance index (C-index) was calculated to evaluate the performance of the nomogram.
Immune Phenotypes
Using R package “GSVA,” single-sample gene set enrichment analysis (ssGSEA) was conducted to quantify the activity or enrichment levels of immune cells, functions, or pathways (15, 16). The comparison of immune cell distribution between patients at high-risk group and patients at low-risk group was performed.
Besides, the relationships between the MRGs based risk score and several immune checkpoints, including PD-1, PD-L1, CTLA-4, TIM-3, and LAG-3, were analyzed.
Mutation of the Four Key Drivers
The mutations of the four most prominent key drivers in pancreatic cancer progression, namely KRAS, TP53, CDKN2A, and SMAD4 (17), were downloaded. And the relationships between them and MRGs based risk score were gauged.
Gene Set Enrichment Analyses
Gene set enrichment analysis (GSEA) (12) was performed in javaGSEA v. 4.1.0 based on the Molecular Signatures Database v. 7.1. C2 (curated gene sets), C5 (GO gene sets), and C6 (oncogenic signatures) were searched to identify enriched KEGG pathways, biological processes, cellular components, molecular functions, and dysregulated oncogenic signatures associated with the high-risk group (12). |NES| > 1 and FDR < 0.05 were considered statistically significant.
Cell Lines and Culture
Human pancreatic ductal epithelium cell line HPDE6-C7 was obtained from Institute of Biochemistry and Cell Biology, Chinese Academy of Sciences (Shanghai, China). PDAC cell lines (MIA PaCa-2 and Capan-1) were acquired from the American Type Culture Collection (ATCC, Manassas, VA, USA). HPDE6-C7 was cultured in Dulbecco’s modified Eagle’s medium (DMEM) (Invitrogen, Carlsbad, CA, USA) added with 10% fetal bovine serum (FBS) (Invitrogen). MIA PaCa-2 was cultured in DMEM added with 10% FBS and 2.5% horse serum. Capan-1 was cultured in Iscove’s modified Dulbecco’s medium added with 20% FBS. All cells were cultured in a humidified 5% CO2 incubator at a temperature of 37°C.
Quantitative Real-Time Polymerase Chain Reaction
Total RNA was extracted from cells using the TRIzol reagent (Invitrogen). After quantification using NanoDrop 2000c instrument (Thermo Fisher, Waltham, MA, USA), the RNA was reverse transcribed into first-strand cDNA using the M-MLV Reverse Transcriptase (Invitrogen). qRT-PCR was carried out on StepOne Plus Real-Time PCR System (Applied Biosystems, Foster City, CA, USA) using TB Green® Premix Ex Taq™ (Tli RNaseH Plus), ROX plus (TaKaRa, Dalian, China). GAPDH was used as an endogenous control. The quantification of RNA level expression was calculated using the 2−ΔΔct method. The primer sequences used were as follows: for KIF23, 5’-AGTCAGCGAGAGCTAAGACAC-3’ (sense), 5’-GGTTGAGTCTGTAGCCCTCAG-3’ (antisense); for BIN1, 5’-TGAGCAGTGCGTCCAGAATTT-3’ (sense), 5’-CGATCTTGTTTGCCTCATCCC-3’ (antisense); for LAPTM4A, 5’-ATGGTGTCCATGAGTTTCAAGC-3’ (sense), 5’-CCACAGTCAGCAAAATTGCCA-3’ (antisense); for ERAP2, 5’-CACTAATGGGGAACGATTTCCTT-3’ (sense), 5’-CTGACCAAGACTTCGATCTTCTC-3’ (antisense); for ATP8B2, 5’-CGGGCTAATGACCGAGAATAC-3’ (sense), 5’-CTGCTCAAAGAGGTTGACAGG-3’ (antisense); for FAM118A, 5’-GTCGCCCATGATCTGATCCG-3’ (sense), 5’-CTCCAGGTCGTCAAACACCTC-3’ (antisense); for RGS16, 5’-ATCAGAGCTGGGCTGCGATA-3’ (sense), 5’-CAGGTCGAACGACTCTCTCC-3’ (antisense); for ELMO1, 5’-GGAGCAGGTTATGAGAGCACT-3’ (sense), 5’-GGGCGGGACTGGAAATCTTC-3’ (antisense); for RAPGEFL1, 5’-AGGGGCTGCTTCAAGAGGA-3’ (sense), 5’-CCCTGGTAAAGGGACTCGT-3’ (antisense).
Statistical Analysis
All statistical analyses were conducted using R software (version 4.0.2), GraphPad Prism 7 (San Diego, CA, USA), and SPSS 20.0 (Chicago, IL, USA). The median OS was compared using the Kaplan-Meier method with log-rank test. The distributions of clinicopathological parameters between the high-risk and low-risk groups were compared using chi-square tests, T test, or one-way analysis. Two-sided P value less than 0.05 was considered as statistically significant.
Results
Identification of Differentially Expressed MRGs
In total, 198 differentially expressed MRGs meeting the criteria as |log(foldchange)| > 1 and FDR < 0.05 by the pooled analysis of TCGA-PAAD and GTEx-pancreas databases were obtained (Figure 1A, Table S2).
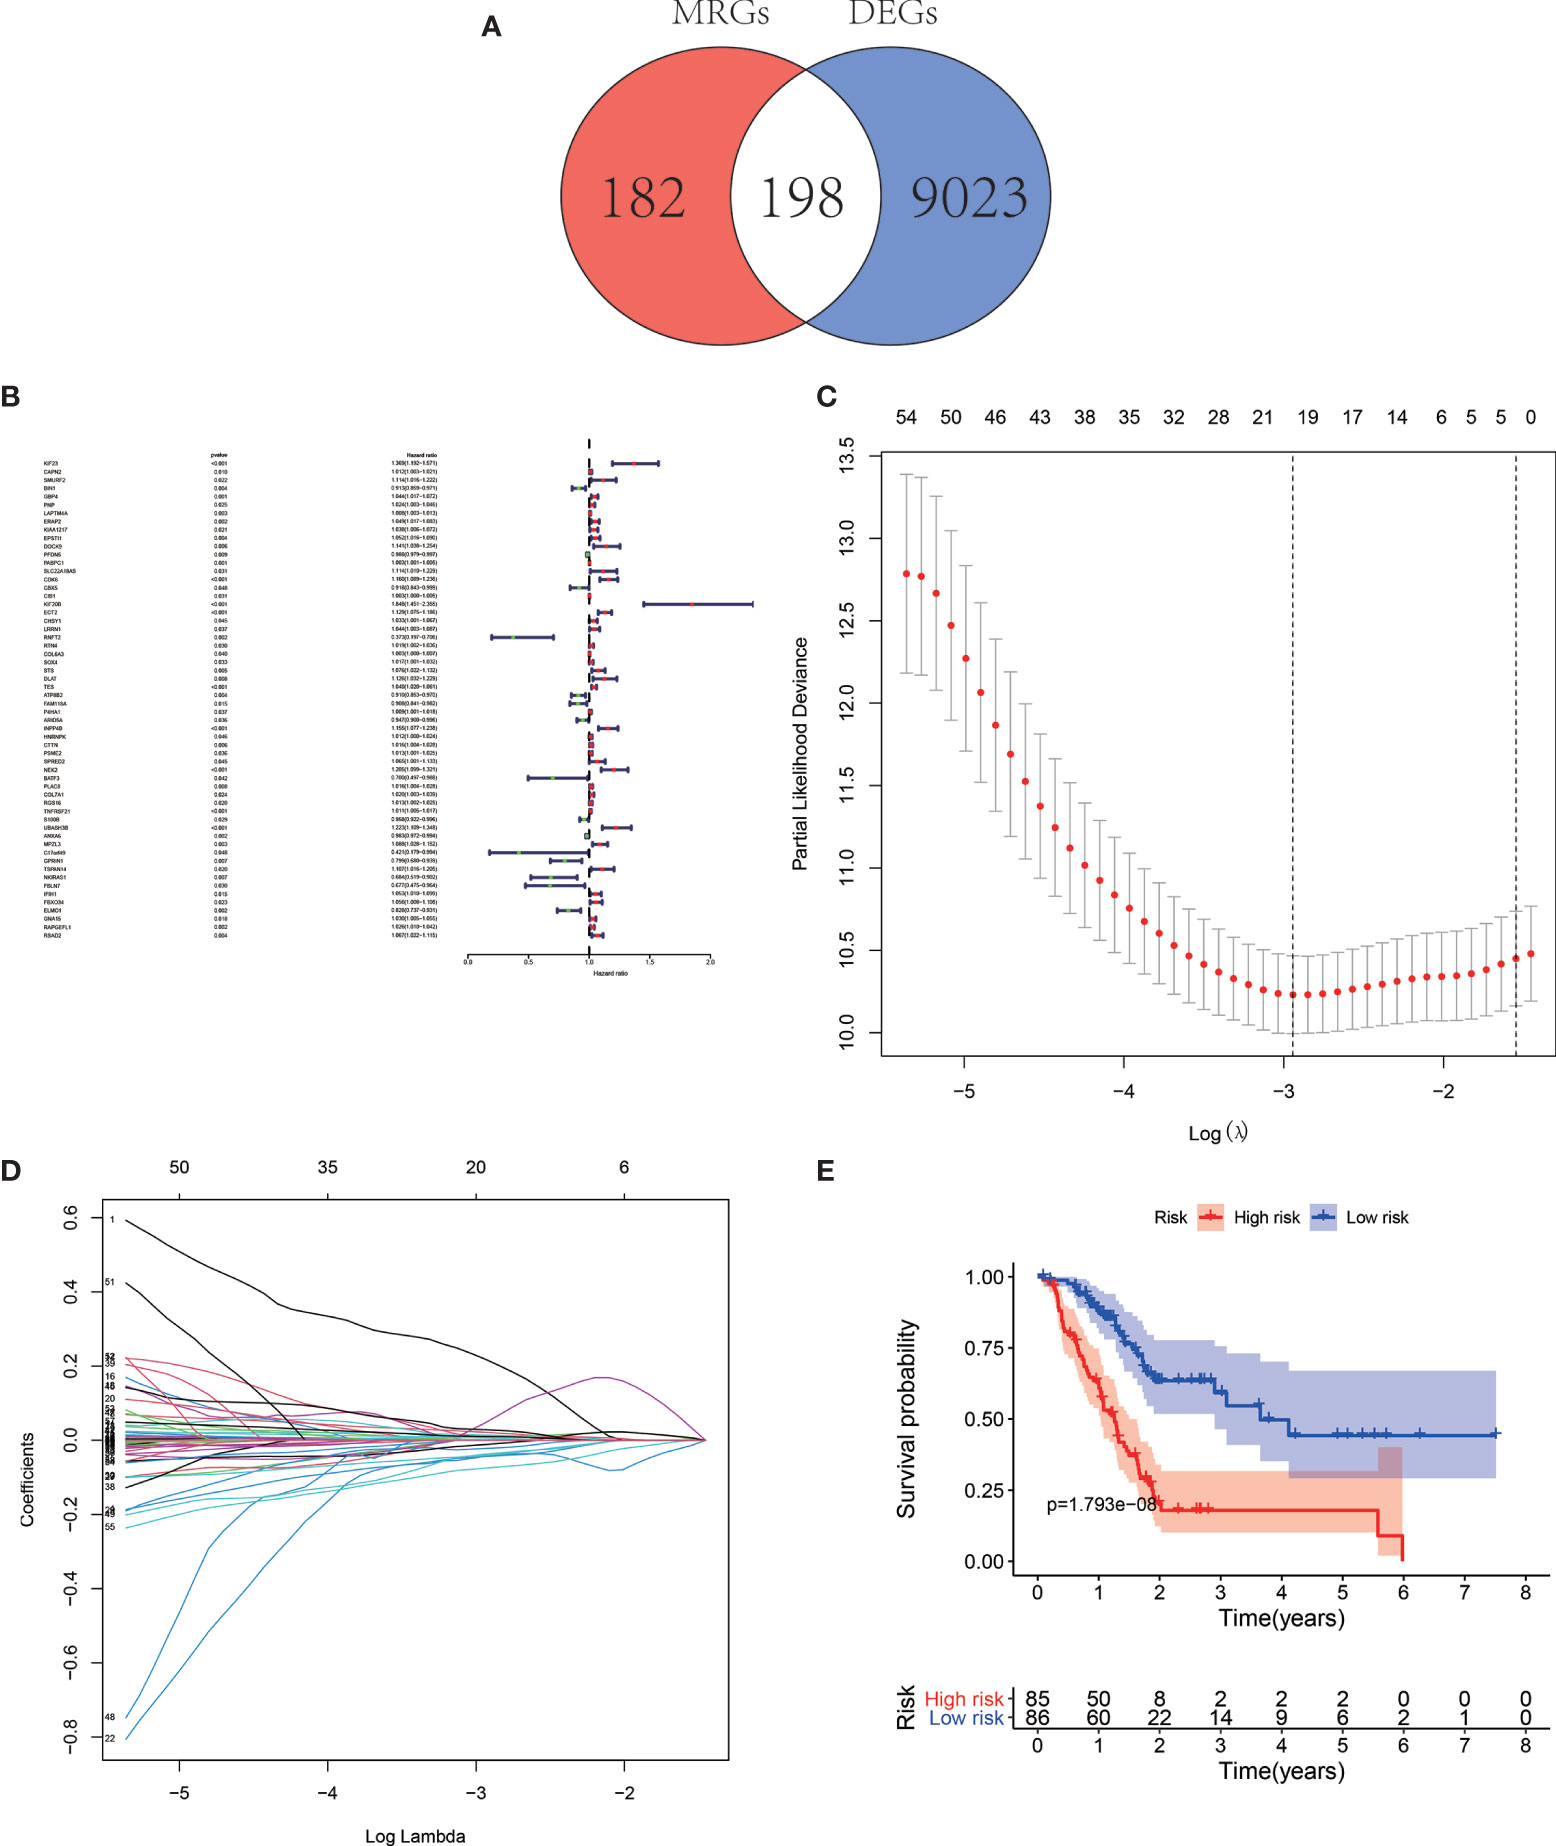
Figure 1 Venn map illustrating the identification of the differentially expressed MRGs (A). Forest map of MRGs related to pancreatic adenocarcinoma (PAAD) survival by univariate Cox regression analysis (B). Least Absolute Shrinkage and Selection Operator (LASSO) coefficient spectrum of the nine MRGs selected by the univariate Cox regression. Generate a coefficient distribution map for a logarithmic (λ) sequence (C). Selecting the best parameters for PAAD in the LASSO model (λ) (D). Kaplan–Meier survival analysis of TCGA-PAAD patients stratified by the median value of risk score (E).
Survival−Related MRGs and the Prognostic Signature
The univariate Cox regression analysis and identified 59 MRGs that were significantly related to overall survival in TCGA-PAAD cohort (Figure 1B). The Lasso regression analysis excluded 40 genes that may be highly correlated with other genes (Figures 1C, D). The rest 19 genes (KIF23, BIN1, GBP4, LAPTM4A, ERAP2, SLC22A18AS, CDK6, KIF20B, RNFT2, TES, ATP8B2, FAM118A, ARID5A, RGS16, TNFRSF21, UBASH3B, GPRIN1, ELMO1, RAPGEFL1) were then submitted to a multivariate Cox proportional hazards model, resulting in 9 candidate genes (KIF23, BIN1, LAPTM4A, ERAP2, ATP8B2, FAM118A, RGS16, ELMO1, RAPGEFL1) as significant predictors of prognosis (Table 1). The formula for the risk score of every PAAD patient was constructed: risk score = (expression value of KIF23 * 0.394) − (expression value of BIN1 * 0.098) + (expression value of LAPTM4A * 0.005) + (expression value of ERAP2 * 0.051) − (expression value of ATP8B2 * 0.082) − (expression value of FAM118A * 0.081) + (expression value of RGS16 * 0.014) − (expression value of ELOM1 * 0.112) + (expression value of RAPGEFL1 * 0.017).
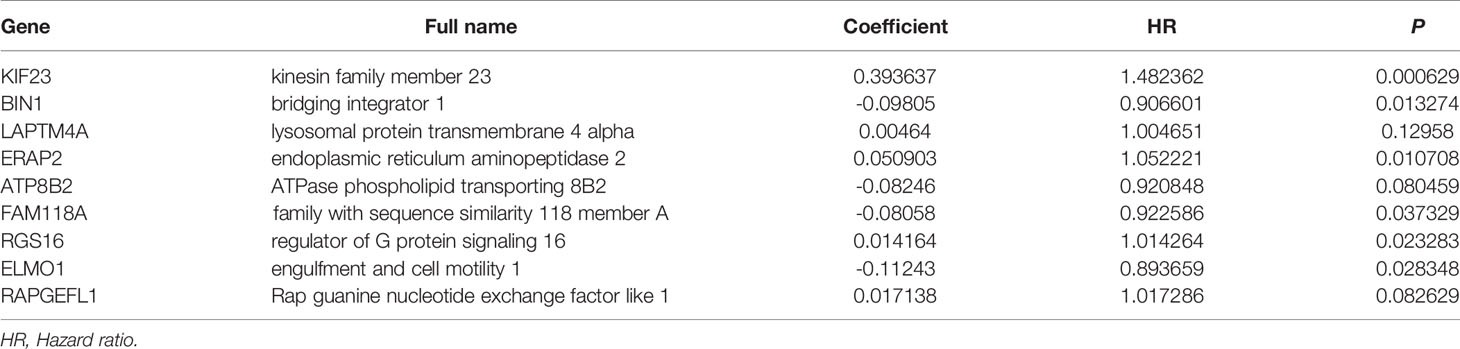
Table 1 The 9 MRGs in the prognostic risk score by the LASSO multivariate Cox proportional hazards model.
The median overall survival time of patients in the high-risk group was significantly lower than that in the low-risk group (Figure 1E, P < 0.001). Expression profile of the included 9 MRGs (Figure 2A), distribution of patients (Figure 2B), individual survival status (Figure 2C) stratified by risk score were shown in Figure 2. Risk score remained to be an independent prognostic indicator in multivariate analysis (HR=3.129, 95% CI = 1.950–5.022, P < 0.001, Table 2, Figures 3A, B). Then we assessed the prediction efficiency of the risk score by drawing the time dependent ROC curve, which revealed that the risk score could predict the 1-year overall survival (AUC=0.765, Figure 3C), 3-year overall survival (AUC =0.793, Figure 3D), and 5-year overall survival (AUC =0.776, Figure 3E) for PAAD patients effectively. And the AUC of risk score was larger than those of the other enrolled clinocopathological factors.
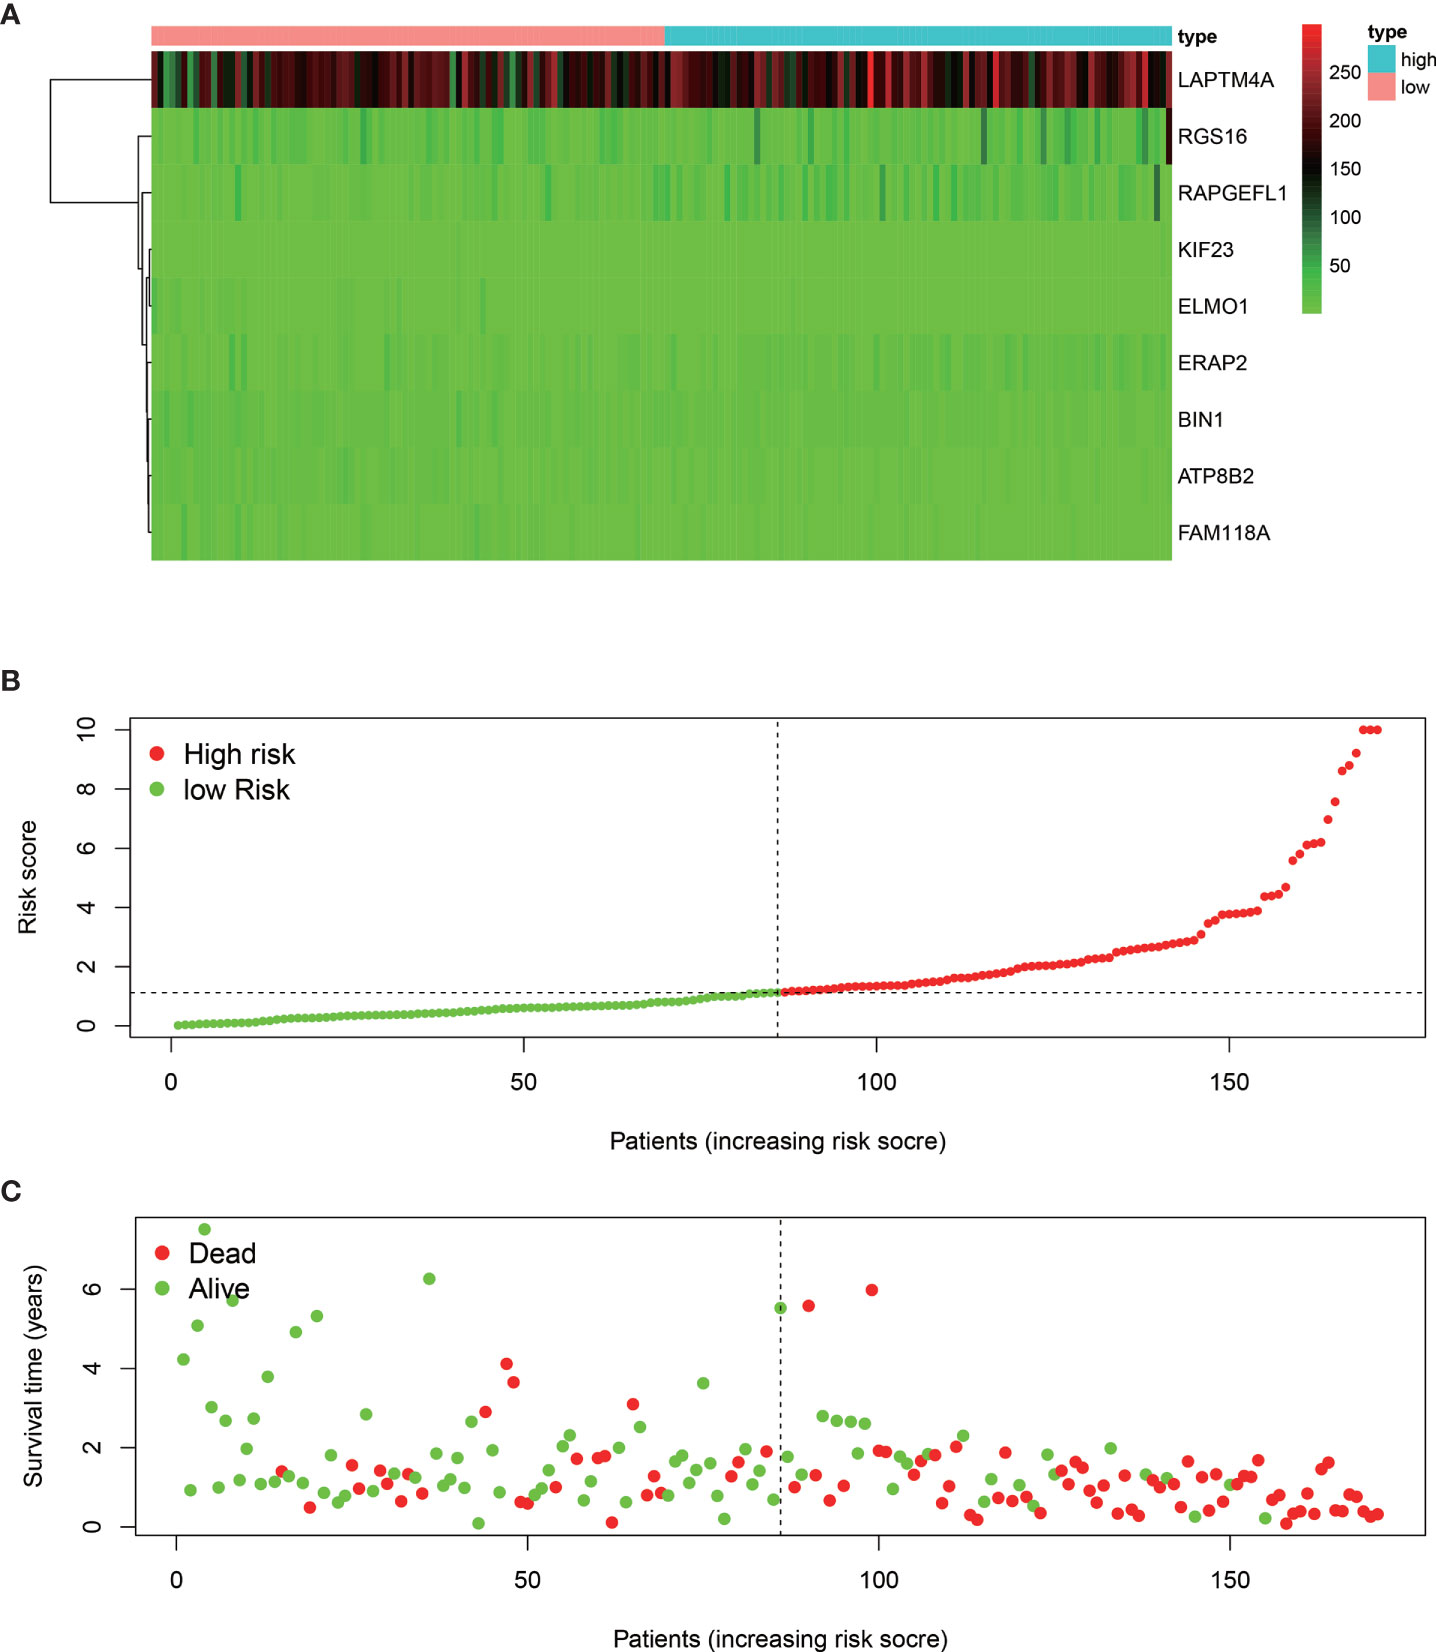
Figure 2 Heat map of the nine MRGs expression profiles stratified by the risk score (A). Distribution of the patients along with the increasing of risk score (B). Distribution of patients’ survival status (C) stratified by risk score. The black dotted line is the cut-off value (median value) for dividing patients into low-risk and high-risk groups.
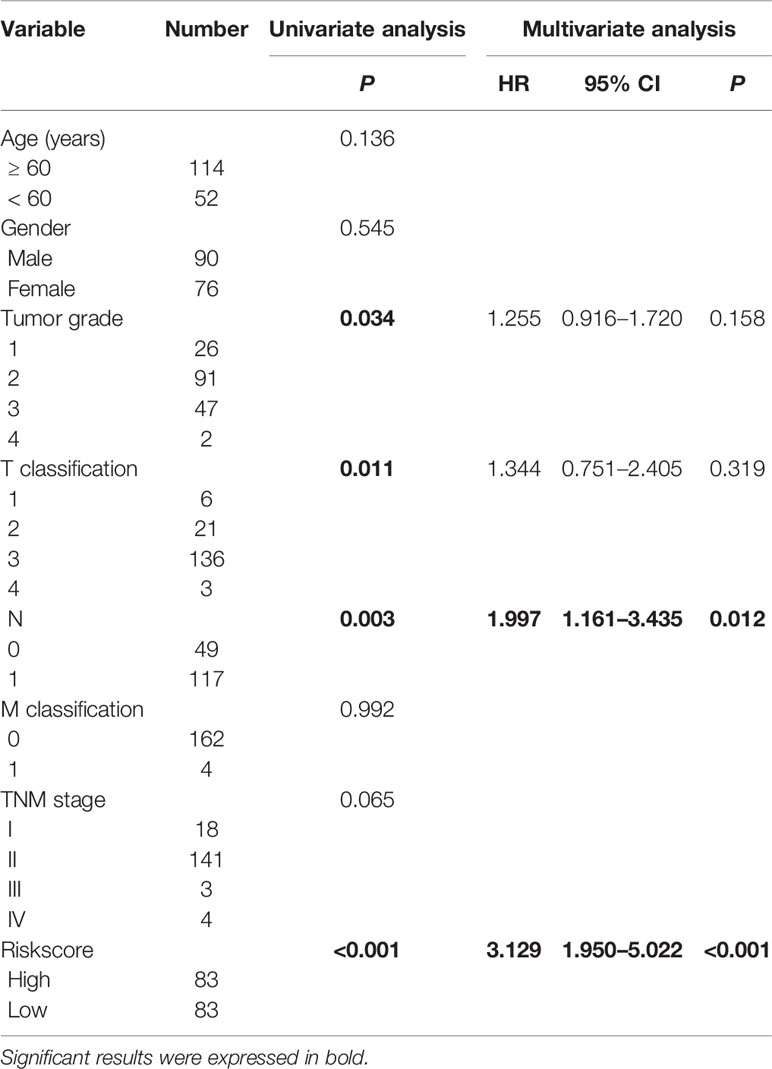
Table 2 Univariate and multivariate analysis of the overall survival in The Cancer Genome Atlas-pancreatic adenocarcinoma (TCGA-PAAD) patients.
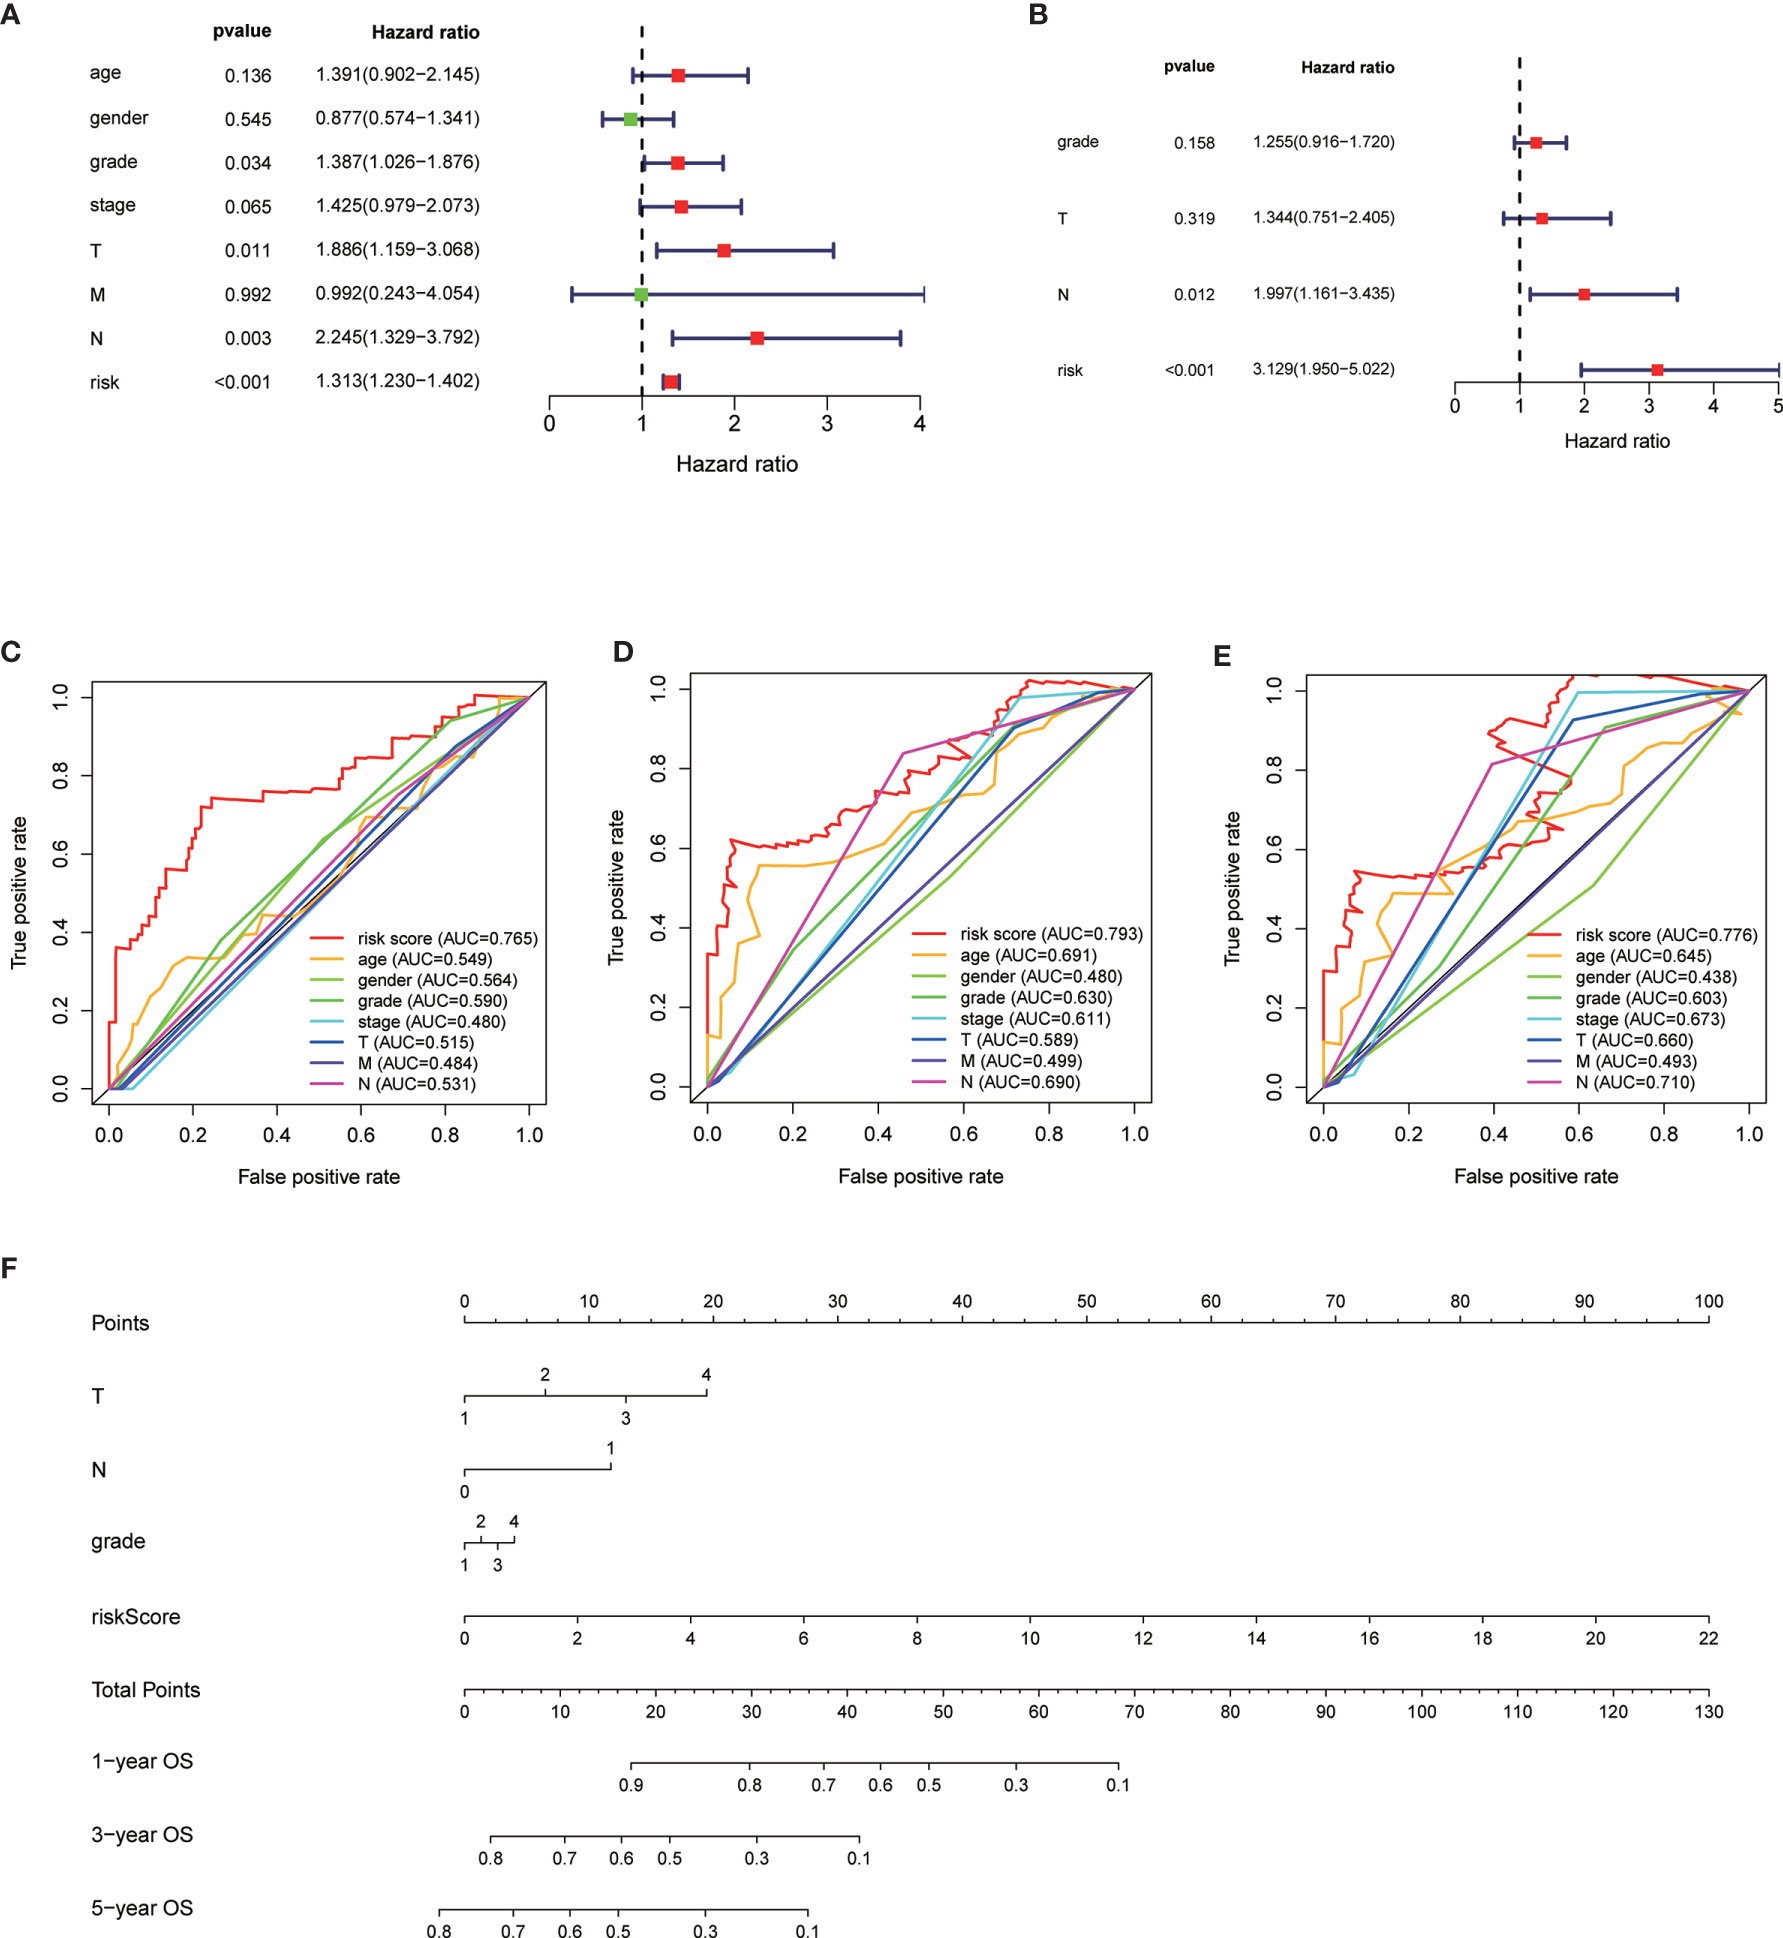
Figure 3 Univariate analysis of risk score and other clinicopathological factors predicting the overall survival (A). Multivariate analysis of risk score and other clinicopathological factors predicting the overall survival (B). Time dependent receiver operating characteristic (ROC) curve of risk score and other clinicopathological factors predicting the 1-year overall survival (C), 3-year overall survival (D), and 5-year overall survival (E) in The Cancer Genome Atlas (TCGA)-pancreatic adenocarcinoma (PAAD) cohort. The prognostic nomogram based on the risk score predicting the OS (F).
Validation of the Risk Signature
We verified the robustness of our MRG based risk score with the patients from GSE62452 dataset. We calculated the risk score for patients and divided them into high-risk group and low-risk group in test dataset with the same formula derived from the training cohort as the TCGA-PAAD database. Patients in low-risk group had obviously better overall survival (P < 0.001, Figure 4A). After adjusting for clinicopathological features, risk score remained to be an independent prognostic indicator in multivariate analysis (HR=2.385, 95% CI = 1.209-4.707, P = 0.012, Table 3). Then we assessed the prediction efficiency of the risk signature by drawing the time dependent ROC curve, which revealed that the risk score could predict the 1-year overall survival rate (AUC = 0.617, Figure 4B), 3-year overall survival rate (AUC = 0.878, Figure 4C), and 5-year overall survival rate (AUC = 0.761, Figure 4D) for GSE62452 dataset effectively.
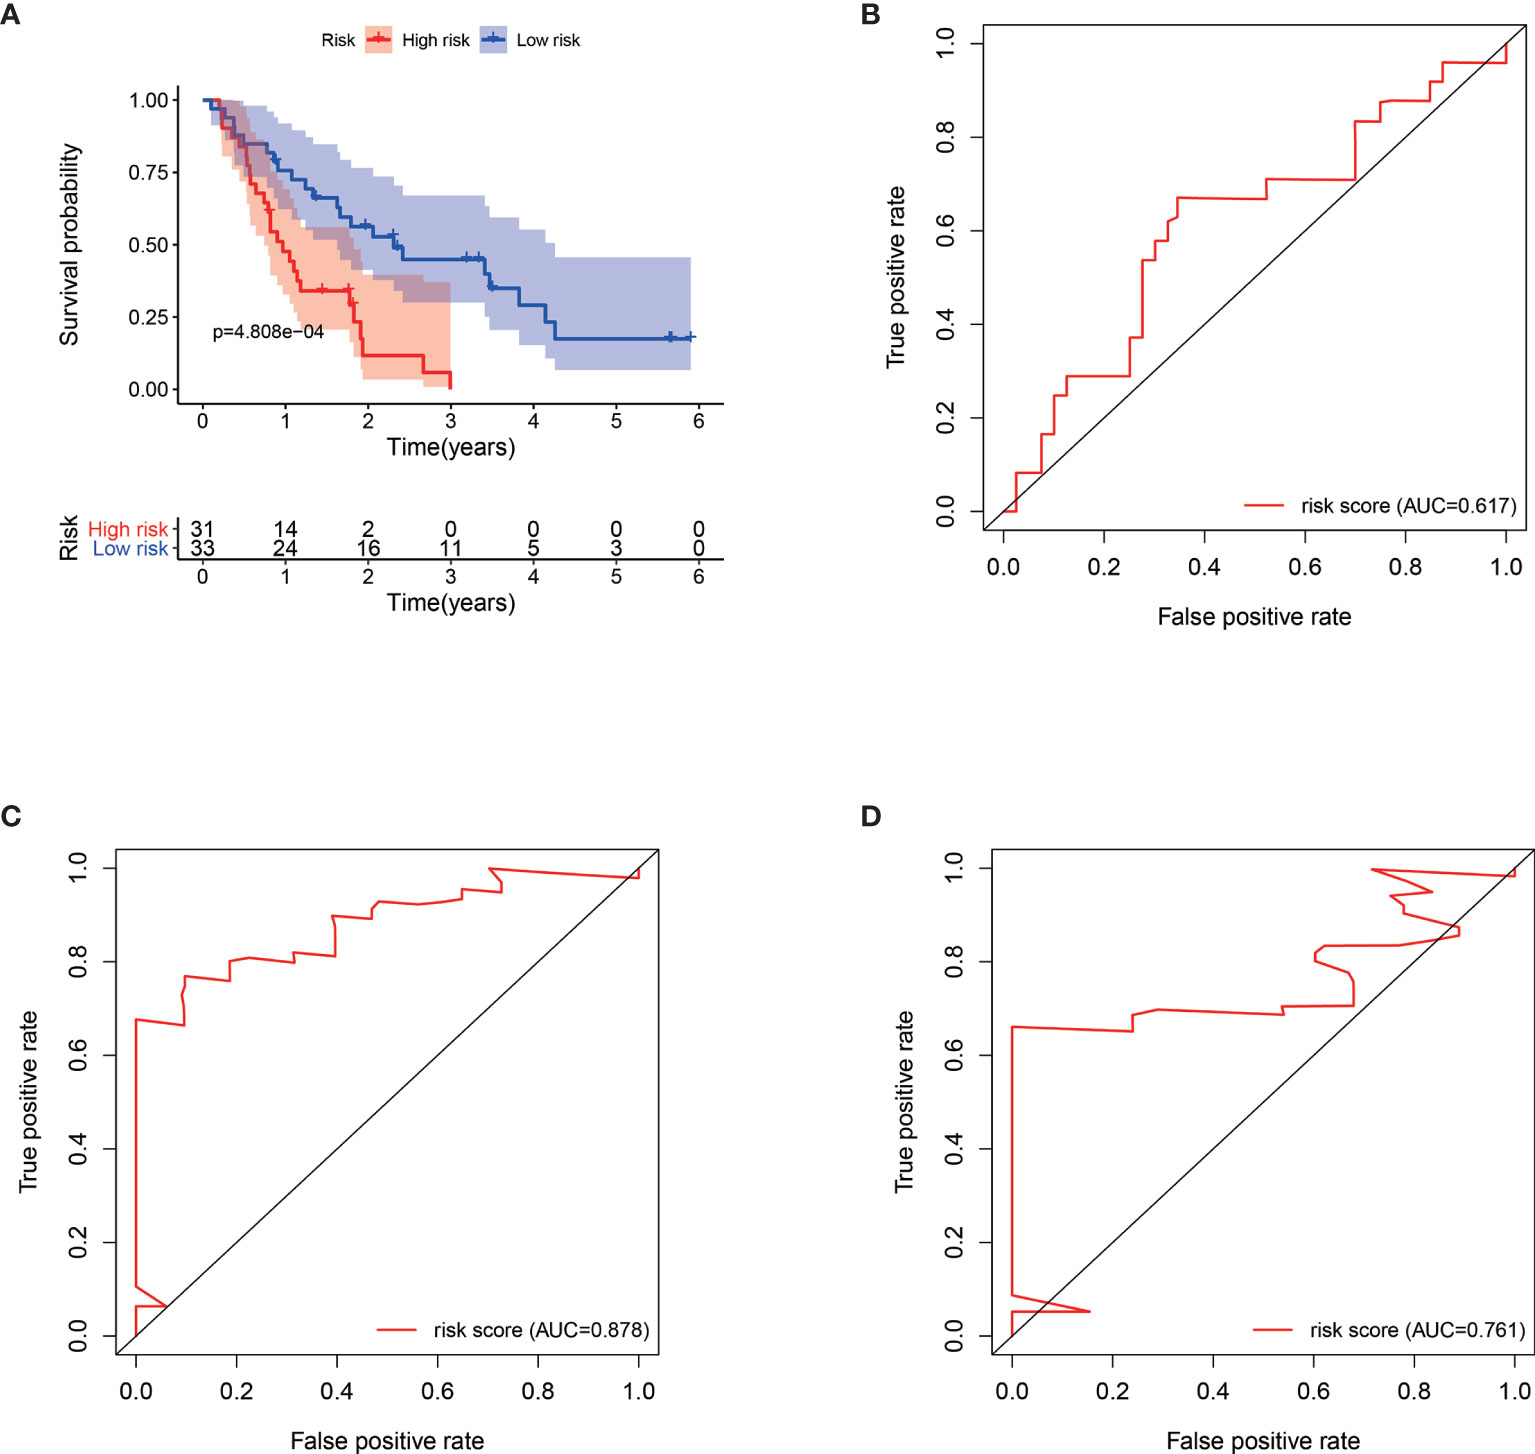
Figure 4 Kaplan–Meier survival analysis of GSE62452 patients stratified by the median value of risk score (A). Time dependent receiver operating characteristic (ROC) curve of risk score predicting the 1-year overall survival (B), 3-year overall survival (C), and 5-year overall survival (D) in GSE62452 patients.
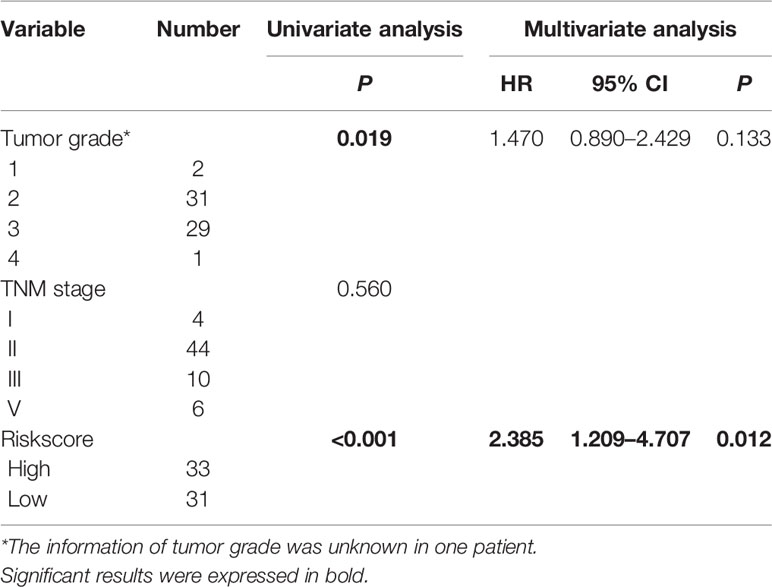
Table 3 Univariate and multivariate analysis of the overall survival in GSE62452 patients.
Construction of the Nomogram
The 166 patients with complete clinical information from the TCGA-PAAD dataset were used to establish a prognostic nomogram based on the stepwise Cox regression model (Figure 3F). The MRGs based risk score, T classification, and N classification were finally included into the stepwise Cox regression model for the nomogram. The C-index of the nomogram was 0.723, which was higher than that of TNM stage itself as 0.535. Thus, the nomogram was regarded to be superior to the TNM stage in terms of predicting overall survival of PAAD.
Relationship Between MRGs Risk Score and Immune Landscape
Patients with high risk score had significantly higher level of APC co-inhibition (Cor=0.231, P = 0.002, Figure 5A), MHC class I (Cor=0.190, P=0.013, Figure 5B), parainflammation (Cor=0.167, P=0.029, Figure 5C), and type I IFN response (Cor=0.188, P=0.014, Figure 5D), but significantly lower level of B cell (Cor = −0.180, P = 0.019, Figure 5E), pDCs (Cor = −0.185, P = 0.015, Figure 5F), TIL (Cor = −0.166, P = 0.030, Figure 5G), and type II IFN response (Cor = −0.270, P < 0.001, Figure 5H).
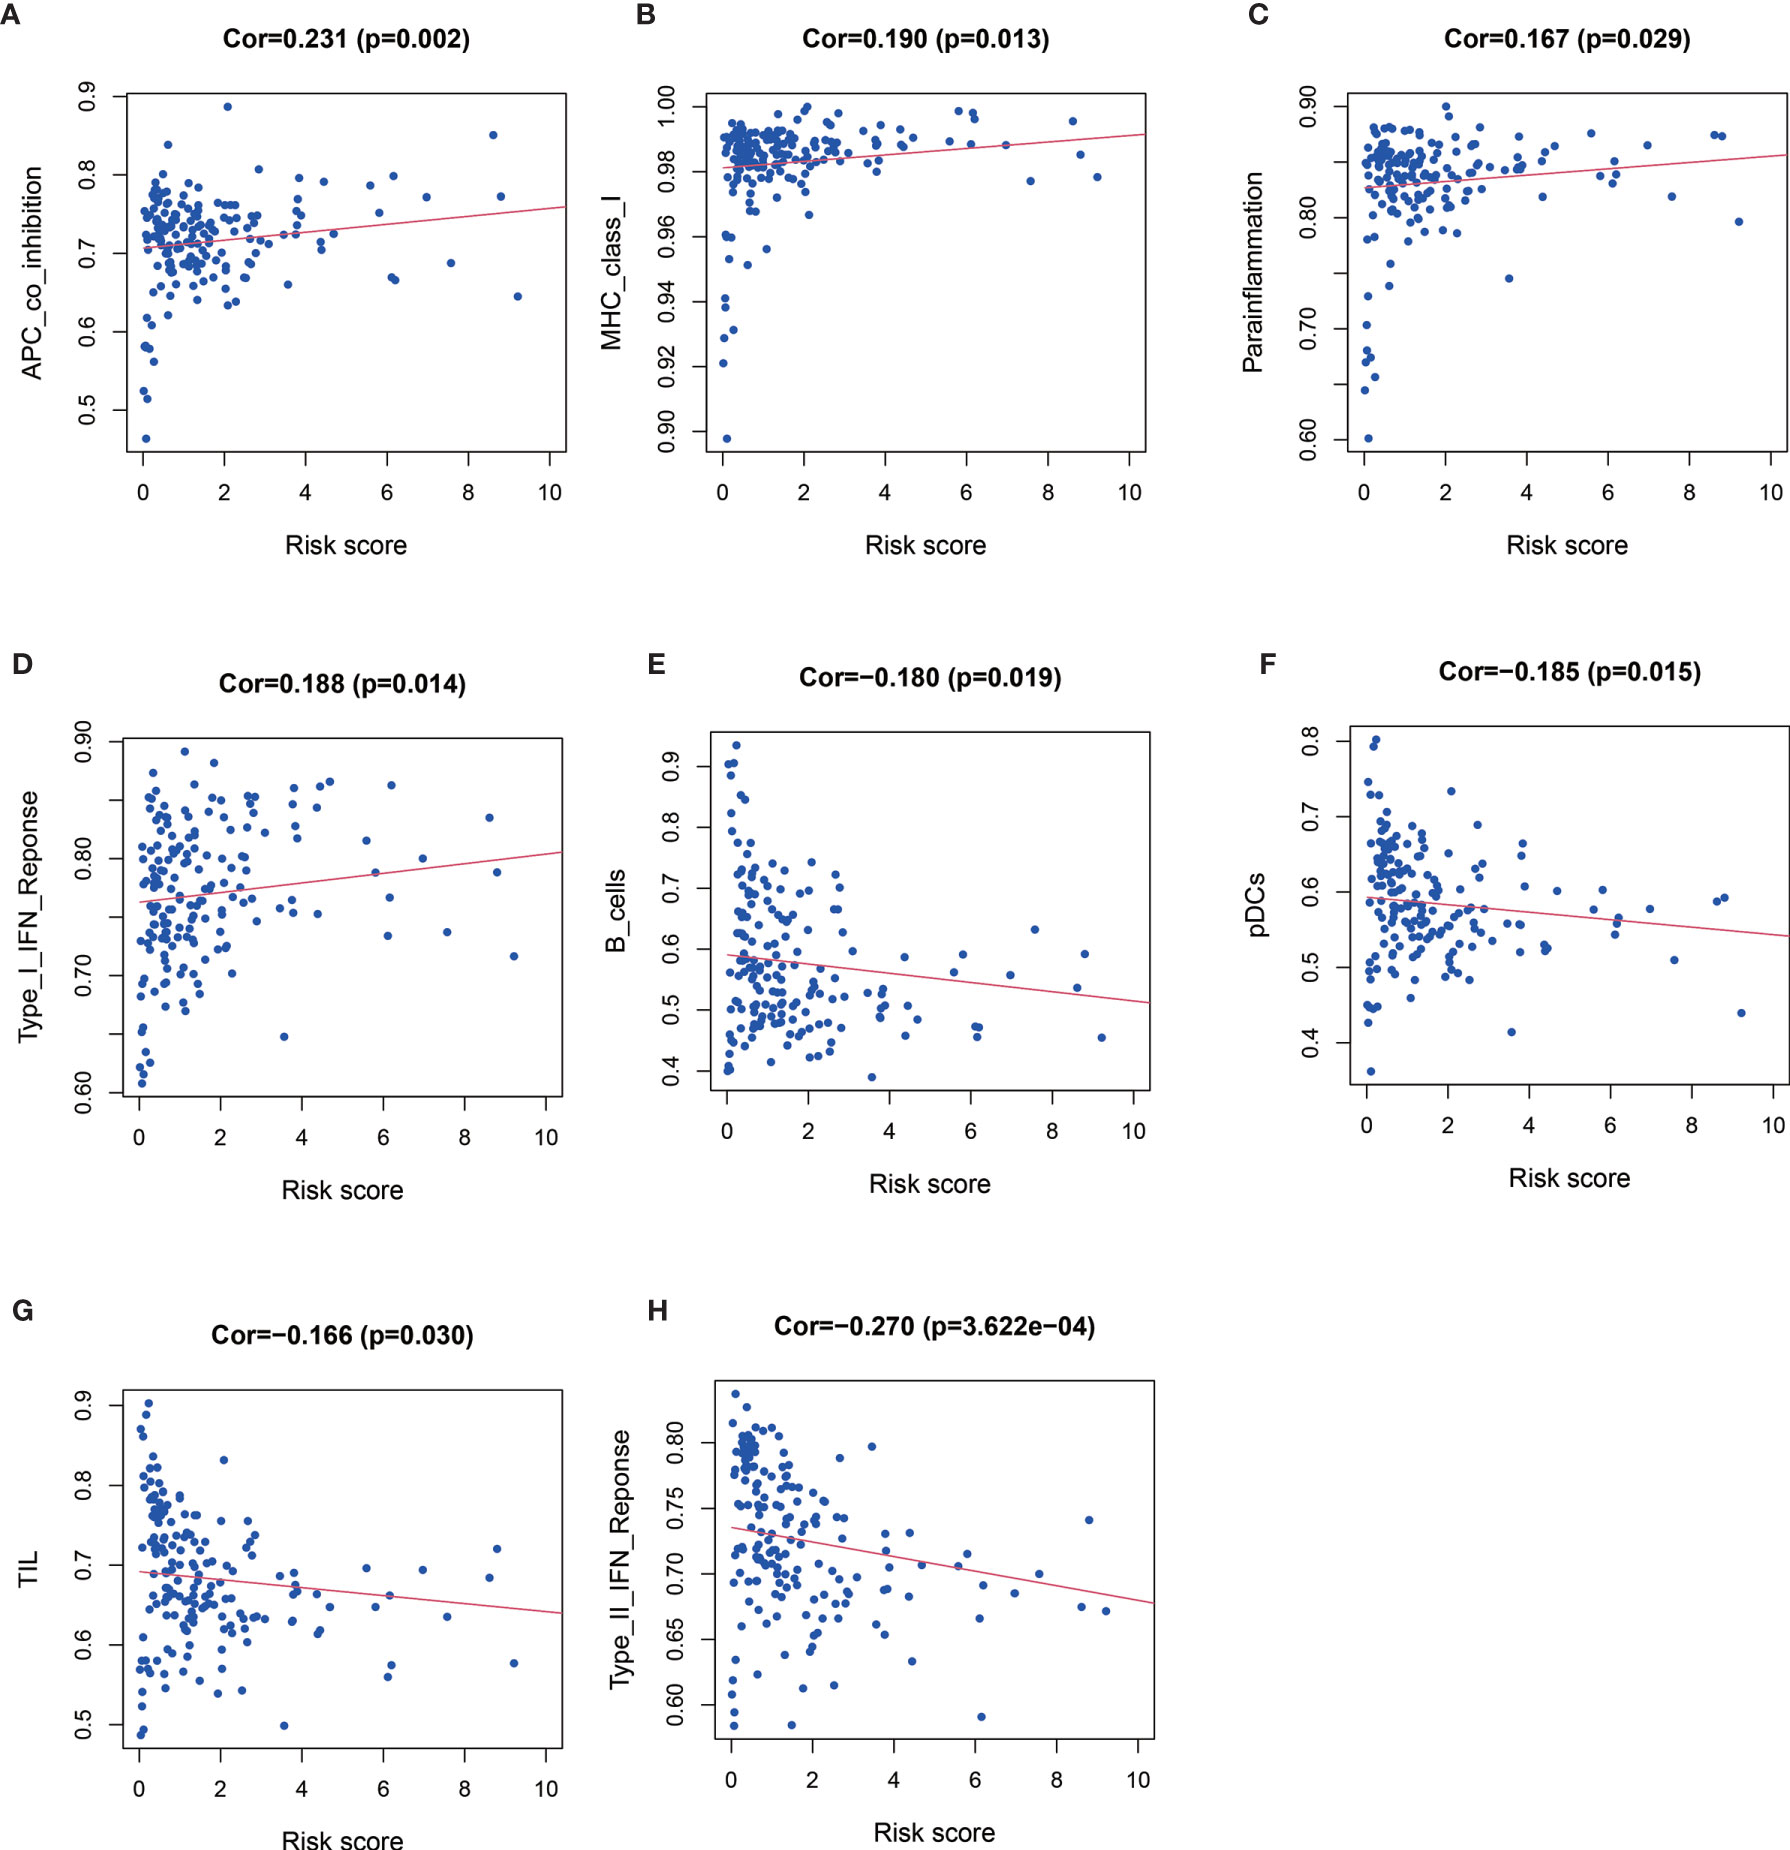
Figure 5 Relationships between risk score and APC co-inhibition (A), major histocompatibility complex (MHC) class I (B), parainflammation (C) and type I IFN response (D), B cell (E), pDCs (F), TIL (Figure G), and type II IFN response (H).
Relationship between expression level of co-inhibitory immune checkpoints (PD-1, PD-L1, CTLA-4, TIM-3, LAG-3, CD8A) and MRGs based risk score were also assessed. Patients with high risk score had significantly higher level of CD274 (Cor=0.285, P < 0.001, Figure 6A), IDO1 (Cor=0.418, P < 0.001, Figure 6C), but significantly lower level of CD8A (Cor = −0.176, P = 0.022, Figure 6B).
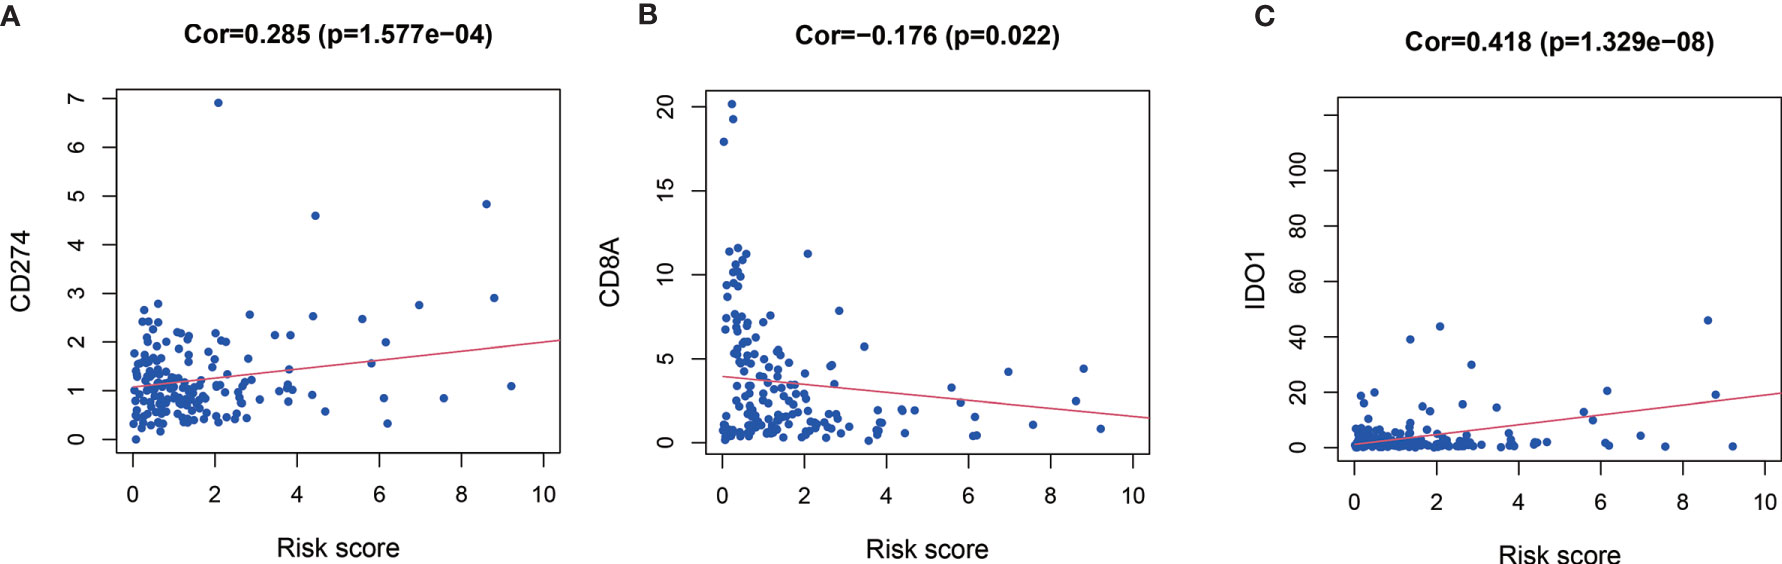
Figure 6 Relationships between risk score and CD274 (PD-L1) (A), CD8A (B), and IDO1 (C).
Relationship Between MRGs Risk Score and “Key Driver” Mutations
Via the analysis of the relationship between the mutations of the four “key drivers” of pancreatic cancer and risk score, we found that patients with higher risk score were enriched for KRAS mutations (P<0.001, Figure 7A) and TP53 mutations (P < 0.001, Figure 7B).
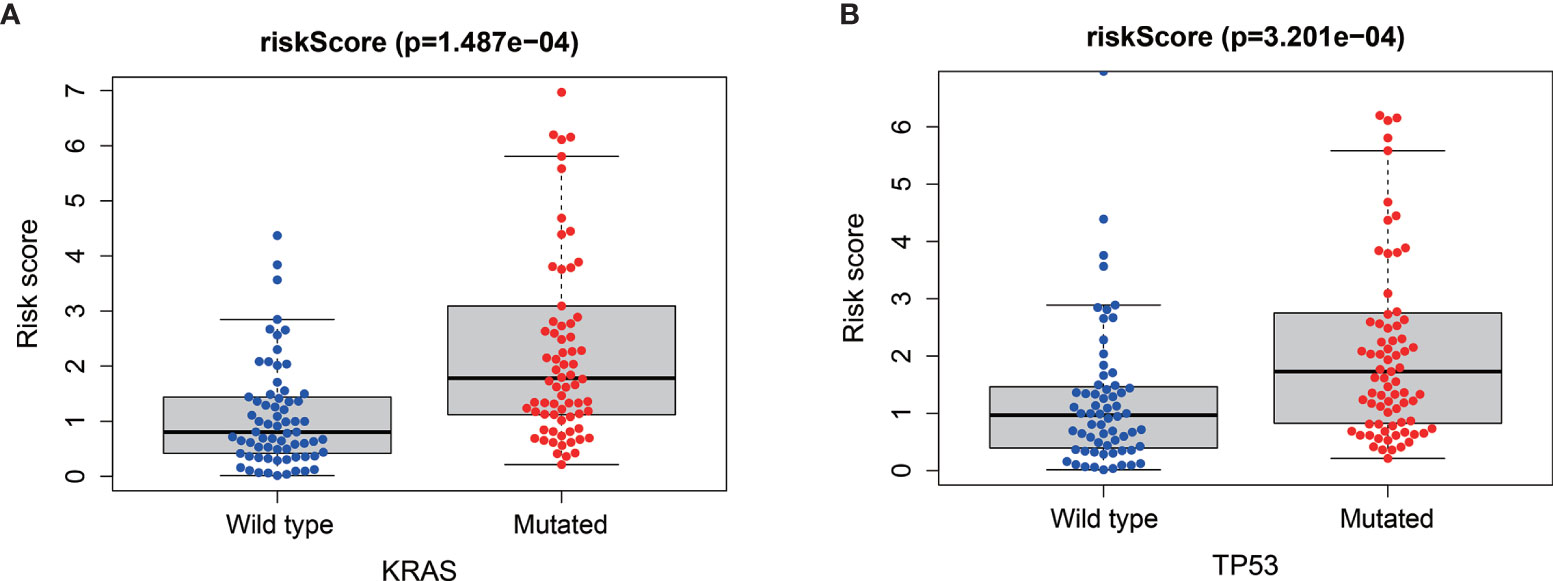
Figure 7 Relationships between risk score and KRAS mutation (A) and TP53 mutation (B).
Relationship Between MRGs Risk Score and Clinicopathological Features
Relationship between MRGs prognostic index and clinicopathological features were subsequently analyzed (Figure 8). Significant higher risk scores were in patients with higher tumor grade (P < 0.001). In addition, the expression level of BIN1 was significantly related with advanced M (P < 0.001). The expression level of ELMO1 was significantly related with higher tumor grade (P = 0.008). The expression level of ERAP2 was significantly related with advanced N (P = 0.027). The expression level of KIF23 was significantly related with higher tumor grade (P < 0.001). The expression level of LPTM4A was significantly related with younger age (P=0.038) and higher tumor grade (P=0.024). The expression level of RGS16 was significantly related with higher tumor grade (P=0.015).
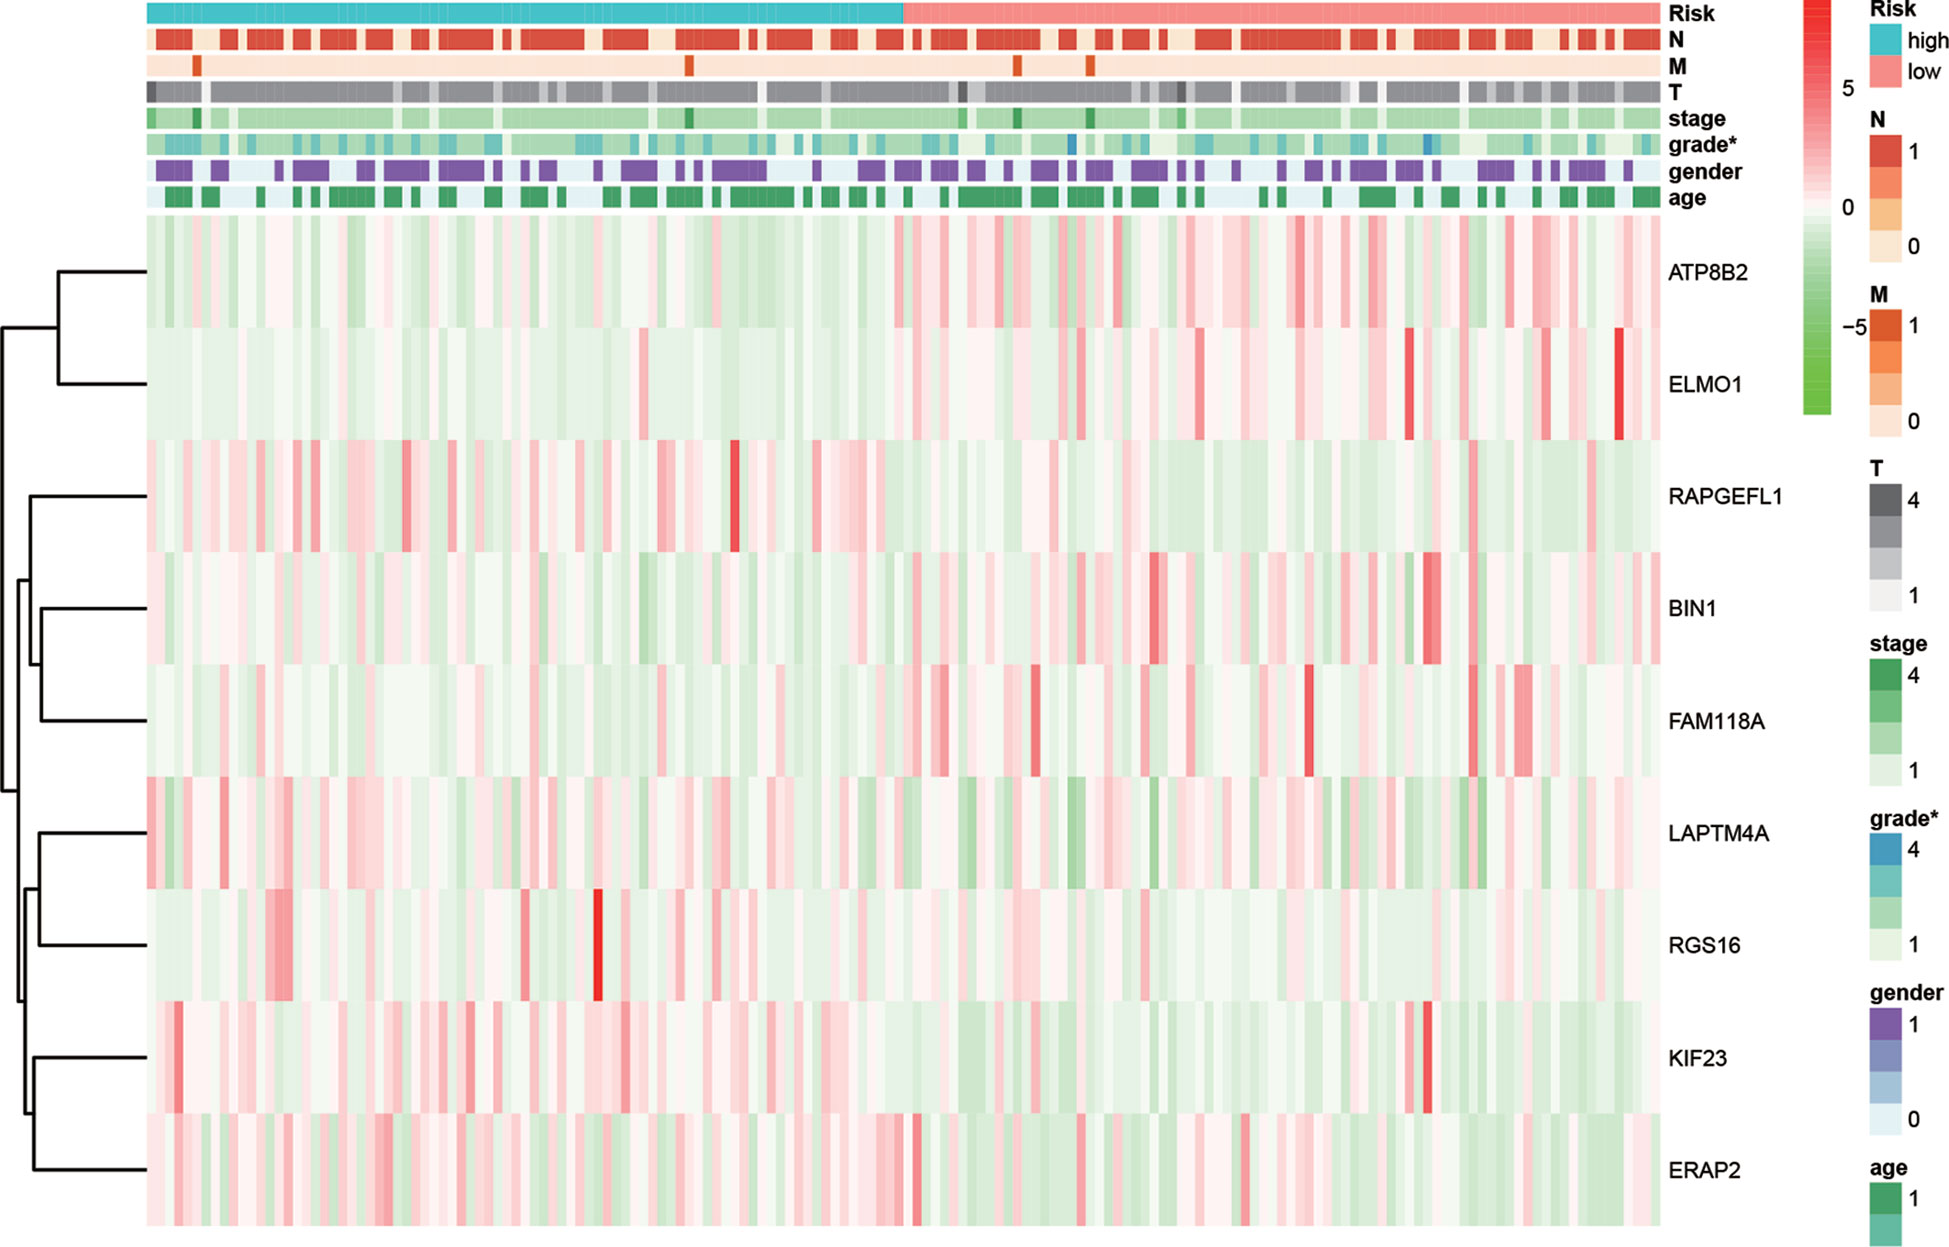
Figure 8 Relationships between risk score and the enrolled MRGs expression, survival outcome, and clinicopathological factors.
Gene Set Enrichment Analysis
GSEA compared the high- and low risk groups stratified by the risk score (Figure 9). KEGG pathways enriched in the high-risk group included KEGG P53 signaling pathway, KEGG cell cycle, KEGG base excision repair, KEGG pancreatic cancer, and KEGG mismatch repair. KEGG pathways enriched in the low-risk group included KEGG glycine serine and threonine metabolism, KEGG chemokine signaling pathway, KEGG complement and coagulation cascades, KEGG cytokine cytokine receptor interaction, and KEGG T cell receptor signaling pathway.
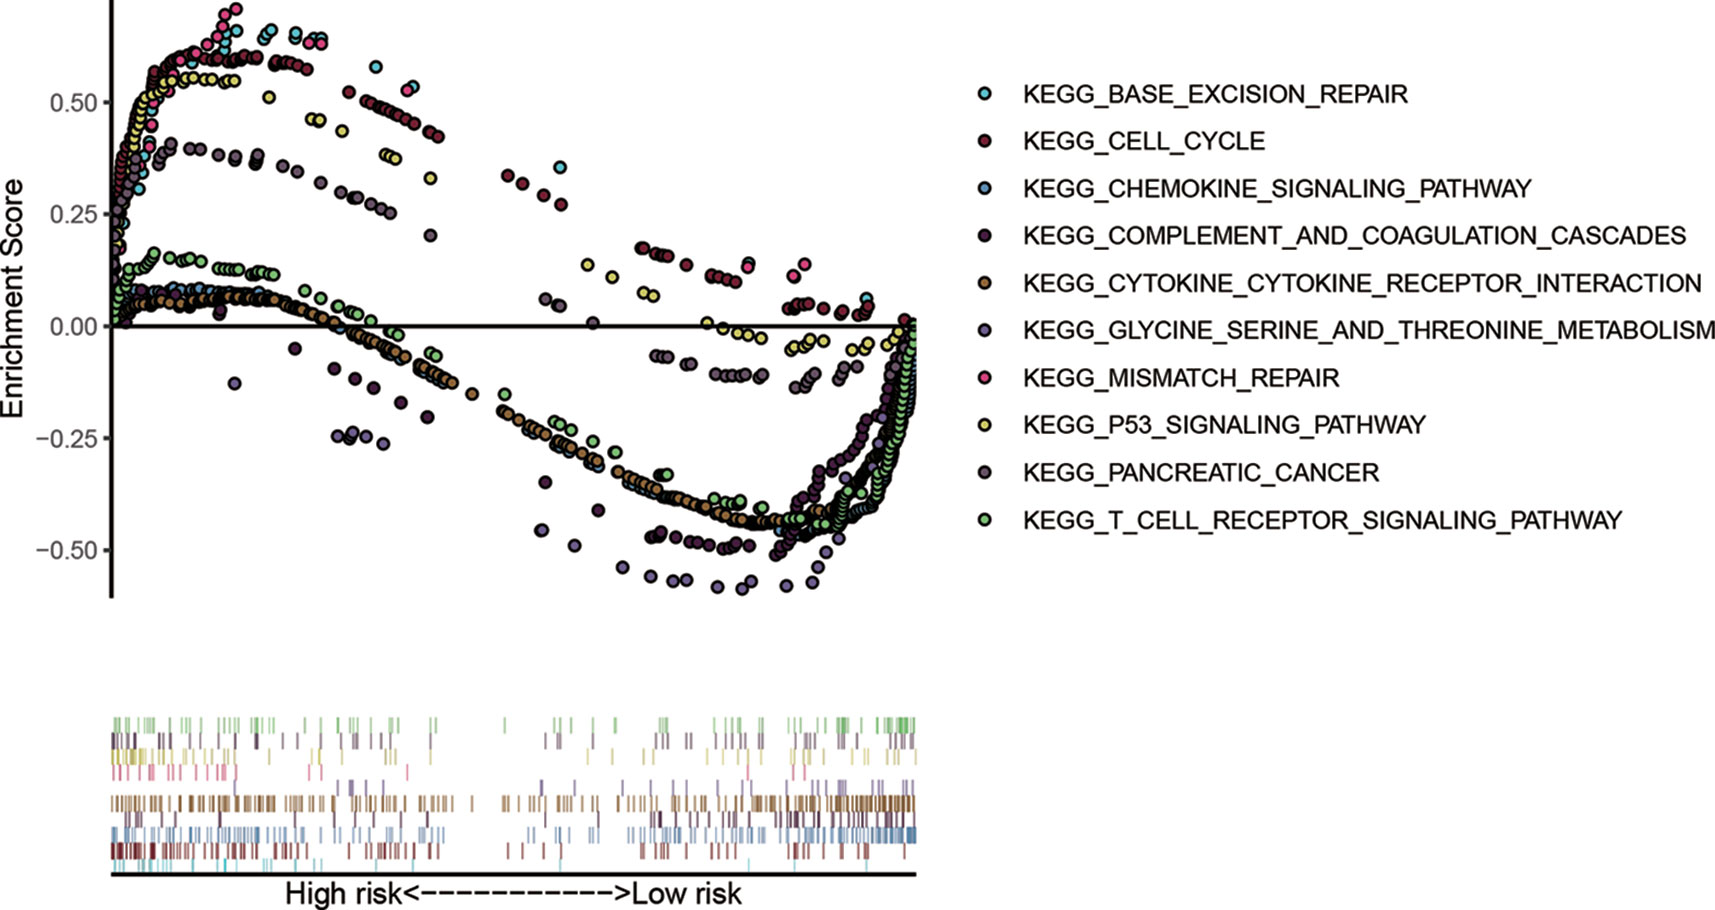
Figure 9 Gene-set enrichment analysis (GSEA) compared the high- and low risk groups stratified by the median value of risk score.
Expressions of the Nine MRGs in PDAC Cell Lines
The mRNA expressions of the nine MRGs (KIF23, BIN1, LAPTM4A, ERAP2, ATP8B2, FAM118A, RGS16, ELMO1, RAPGEFL1) in pancreatic ductal epithelium cell line (HPDE6-C7) and PDAC cell lines (MIA PaCa-2 and Capan-1) were assessed. Transcriptional expressions of the 9 MRGs were significantly higher in PDAC cell lines than those in HPDE6-C7 (Figure 10).
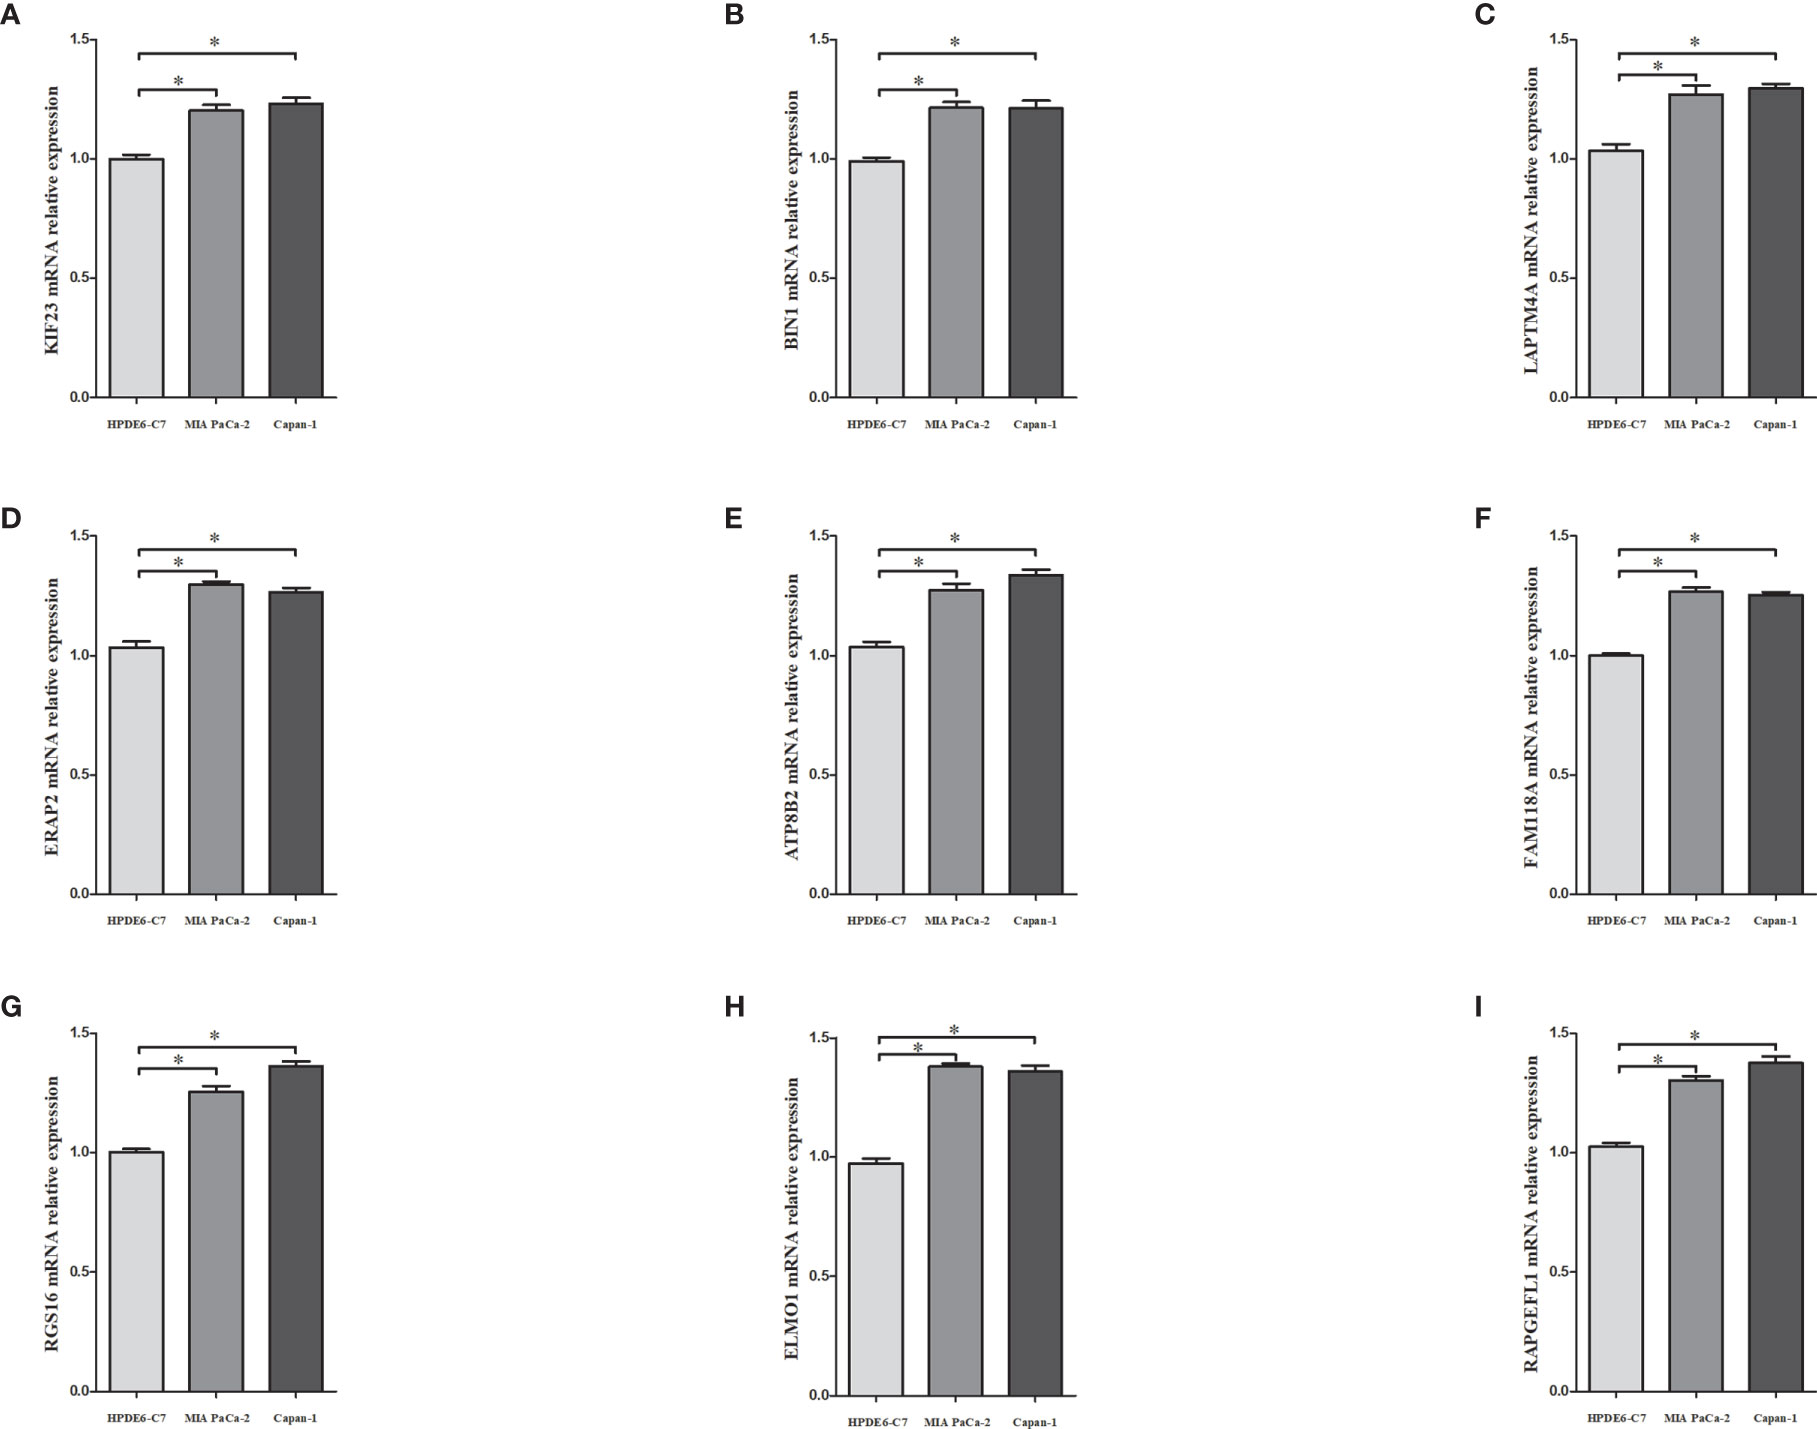
Figure 10 The mRNA expressions of KIF23 (A), BIN1 (B), LAPTM4A (C), ERAP2 (D), ATP8B2 (E), FAM118A (F), RGS16 (G), ELMO1 (H), RAPGEFL1 (I) in pancreatic ductal epithelium cell line (HPDE6-C7) and PDAC cell lines (MIA PaCa-2 and capan-1). * denoted that P<0.05.
Discussion
The present study, to the best of our knowledge, was the first study constructing a prognostic index based on MRGs via analyzing the TCGA, GTEx, and GEO datasets. We identified nine prognostic MRGs. We evaluated the prognostic value of the nine-gene signature and constructed a nomogram. Our results suggested the promising value of tumor-associated macrophage in pancreatic cancer.
Due to its simplicity and practicality, TNM staging system remains to be the most widely used cancer staging system. It acts as the base for the prognosis prediction and the selection of therapeutic options (18). Meanwhile, diverse clinical outcomes may be observed in patients at the same TNM stage. Along with the development of precision medicine, it is increasingly recognized that the molecular biomarkers provide important prognostic information and clinical implication. With the development of large-scale gene sequence databases, some molecular prognostic features have been proposed. In the 8th AJCC staging manual for breast cancer (19), the gene panel have been introduced into the staging system, which partly reflects the increasing recognization of the value of molecular prognostic factors.
Immune dysregulation is pivotal in cancer progression. To date, researches on the immune dysregulation have largely focused on the T cell compartment (20, 21). Other immune subsets including macrophages, which constitute the largest portion of immune cells in TME, may also contribute to the cancer progression (22). In our study, we discovered that high risk score was associated with increased parainflammation and APC co inhibition. Parainflammation, which was initially described by Pribluda et al., referred to the moderately increased inflammatory cytokines which might promote the proliferation, angiogenesis, invasion, and migration. Parainflammation is thus considered as a promotion factor in carcinogenesis (23, 24). Further, increased APC co-inhibition, along with the increase of MRGs based risk score, partly reflects the defected neoantigen recognition, presentation, and anti tumor effects. Meanwhile, positive relationship between risk score and MHC class I indicates increased recognition by cytotoxic T cells (25). The effects may be compensated by the complicated immune network involving parainflammation and APC co-inhibition. The negative relationship between MRGs risk signature and B cells also suggests defected immune response. Of note, the positive relationship between risk score and type I interferon (IFN) response while the negative relationship between risk score and type II IFN response are intriguing. We speculated that the complicated biological function of the two types of IFN responses might accelerate the tumor development (26, 27) in patients with higher MRGs based risk score, which called for more researches in the future.
Immune checkpoints play a crucial role in carcinogenesis by promoting tumor immunosuppressive effects (28). Tumors can protect themselves from being attacked by stimulating immune checkpoint targets. In our study, immune checkpoints expressing in the tumor tissues as PD-L1 were upregulated in the group with higher MRGs based risk score. PD-L1, also known as CD274, is one of the ligands that binds to programmed death-1 (PD-1) on T cells and attenuates the immune response by downregulating the activity of antitumor T cells. In the PDAC microenvironment, PD-L1 is highly expressed in cancer cells, facilitating immune escape and cancer progression (29). Blockade of PD-L1 has gained survival benefits in various cancers including the NSCLC, myeloma, and kidney cancer. However, a previous study indicated that targeting PD-L1 for PDAC therapy was unsuccessful, as the response rate was < 3.1% (28, 29). It was suggested that the macrophage phenotypic switch might compensate the effects by blocking of PD-L1 (30, 31). The positive relationship between MRGs risk score and IDO1 also referred to defected anti-tumor immune response (32). The decreased CD8A expression indicated defected CD8 T cell infiltration and cytolytic effects (33). Our results further revealed the potential influence of macrophage phenotypic switch on immune checkpoints and immune escape.
There are four major driver genes for pancreatic cancer, including KRAS, CDKN2A, TP53, and SMAD4 (17). KRAS mutations occurred in the early stage of pancreatic cancer. As a classic tumor suppressor gene, TP53 has mutation in many tumor types. In our study, we found that the mutation rates of KRAS and TP53 in the high-risk group was significantly higher than that in the low-risk group, which suggested that macrophage phenotype switch might be related to somatic mutations (34). Besides, Bishehsari et al. reported that KRAS mutations induced a protumorigenic phenotype in macrophages (35). These findings were consistent with our results.
The strength of our study came as it shifted from the T cell compartment to the macrophage compartment. We explored the relationship between the 9 MRGs risk score and immune landscape, “key driver” mutations and so on. And some basic experiments were performed. Admittedly, there were some limitations in this study. As a retrospective study, though we validated the nine MRGs risk score using training/testing sets from the public databases, it was limited by the selection bias. Secondly, the external validation of our risk signature in GEO datasets strengthened the robustness of our results. We should remind that more external validation was needed. Thirdly, we tested the expression of the MRGs in the cell line experiments. The biological processes and molecular mechanisms of the nine MRGs should be in depth evaluated in more in-vivo and in-vitro studies.
Conclusions
Our study suggested that nine macrophage phenotypic switch related gene signature had satisfactory prognostic ability. The nine-gene signature may provide us with a novel metric for prognosis prediction and more potential treatment targets for pancreatic cancer.
Data Availability Statement
The datasets presented in this study can be found in online repositories. The names of the repository/repositories and accession number(s) can be found in the article/Supplementary Material.
Author Contributions
M-xL and H-yW conceived and performed the study. C-hY, Z-lM, BJ, and LL guided the analysis. LZ polished the manuscript. D-rX guided the research process. All authors contributed to the article and approved the submitted version.
Funding
This study was supported by Key Clinical Projects of Peking University Third Hospital (No. BYSY2018025) and by the Capital Characteristic Clinical Application Research and Achievement Promotion Project (No. Z171100001017121).
Conflict of Interest
The authors declare that the research was conducted in the absence of any commercial or financial relationships that could be construed as a potential conflict of interest.
Supplementary Material
The Supplementary Material for this article can be found online at: https://www.frontiersin.org/articles/10.3389/fonc.2021.619517/full#supplementary-material
Supplementary Table 1 | The MRGs from Molecular Signatures Database v7.1 (MSigDB).
Supplementary Table 2 | The differentially expressed MRGs by the pooled analysis of TCGA-PAAD and GTEx-pancreas.
Supplementary Figure 1 | The flowchart of the study.
Abbreviations
MRGs, macrophage phenotypic switch related genes; TCGA, The Cancer Genome Atlas; PAAD, pancreatic adenocarcinoma; GTEx, Genotype-Tissue Expression; GEO, Gene Expression Omnibus database; KEGG, Kyoto encyclopedia of Genes and Genomes; GSEA, gene-set enrichment analysis; TNM, tumor-node-metastasis; AJCC, American Joint Committee on Cancer; qRT-PCR, quantitative real-time polymerase chain reaction.
References
1. Siegel RL, Miller KD, Jemal A. Cancer statistics, 2020. CA: Cancer J Clin (2020) 70(1):7–30. doi: 10.3322/caac.21590
2. Mizrahi JD, Surana R, Valle JW, Shroff RT. Pancreatic cancer. Lancet (2020) 395(10242):2008–20. doi: 10.1016/S0140-6736(20)30974-0
3. Ben-Aharon I, Elkabets M, Pelossof R, Yu KH, Iacubuzio-Donahue CA, Leach SD, et al. Genomic Landscape of Pancreatic Adenocarcinoma in Younger versus Older Patients: Does Age Matter? Clin Cancer Res an Off J Am Assoc Cancer Res (2019) 25(7):2185–93. doi: 10.1158/1078-0432.CCR-18-3042
4. Li MX, Bi XY, Huang Z, Zhao JJ, Han Y, Li ZY, et al. Prognostic Role of Phospho-STAT3 in Patients with Cancers of the Digestive System: A Systematic Review and Meta-Analysis. PloS One (2015) 10(5):e0127356. doi: 10.1371/journal.pone.0127356
5. Zeng D, Ye Z, Wu J, Zhou R, Fan X, Wang G, et al. Macrophage correlates with immunophenotype and predicts anti-PD-L1 response of urothelial cancer. Theranostics (2020) 10(15):7002–14. doi: 10.7150/thno.46176
6. Luangxay T, Osako T, Yonekura R, Sugiura Y, Kikuchi M, Gomi N, et al. Giant cell tumor of soft tissue of the breast: Case report with H3F3A mutation analysis and review of the literature. Pathol Res Pract (2020) 216(2):152750. doi: 10.1016/j.prp.2019.152750
7. Larionova I, Kazakova E, Patysheva M, Kzhyshkowska J. Transcriptional, Epigenetic and Metabolic Programming of Tumor-Associated Macrophages. Cancers (2020) 12(6), 1411. doi: 10.3390/cancers12061411
8. Genard G, Lucas S, Michiels C. Reprogramming of Tumor-Associated Macrophages with Anticancer Therapies: Radiotherapy versus Chemo- and Immunotherapies. Front Immunol (2017) 8:828. doi: 10.3389/fimmu.2017.00828
9. Cruz AF, Rohban R, Esni F. Macrophages in the pancreas: Villains by circumstances, not necessarily by actions. Immun Inflammation Dis (2020) 8(4):807–24. doi: 10.1002/iid3.345
10. He Y, Liu H, Wang S, Chen Y. Prognostic nomogram predicts overall survival in pulmonary large cell neuroendocrine carcinoma. PloS One (2019) 14(9):e0223275. doi: 10.1371/journal.pone.0223275
11. Martinez FO, Gordon S, Locati M, Mantovani A. Transcriptional profiling of the human monocyte-to-macrophage differentiation and polarization: new molecules and patterns of gene expression. J Immunol (2006) 177(10):7303–11. doi: 10.4049/jimmunol.177.10.7303
12. Subramanian A, Tamayo P, Mootha VK, Mukherjee S, Ebert BL, Gillette MA, et al. Gene set enrichment analysis: a knowledge-based approach for interpreting genome-wide expression profiles. Proc Natl Acad Sci United States America (2005) 102(43):15545–50. doi: 10.1073/pnas.0506580102
13. Sauerbrei W, Royston P, Binder H. Selection of important variables and determination of functional form for continuous predictors in multivariable model building. Stat Med (2007) 26(30):5512–28. doi: 10.1002/sim.3148
14. Heagerty PJ, Lumley T, Pepe MS. Time-dependent ROC curves for censored survival data and a diagnostic marker. Biometrics (2000) 56(2):337–44. doi: 10.1111/j.0006-341x.2000.00337.x
15. Bindea G, Mlecnik B, Tosolini M, Kirilovsky A, Waldner M, Obenauf AC, et al. Spatiotemporal dynamics of intratumoral immune cells reveal the immune landscape in human cancer. Immunity (2013) 39(4):782–95. doi: 10.1016/j.immuni.2013.10.003
16. Zhuang H, Zhang C, Hou B. FAM83H overexpression predicts worse prognosis and correlates with less CD8(+) T cells infiltration and Ras-PI3K-Akt-mTOR signaling pathway in pancreatic cancer. Clin Trans Oncol Off Publ Fed Spanish Oncol Soc Natl Cancer Inst Mexico (2020) 22(12):2244–52. doi: 10.1007/s12094-020-02365-z
17. Bailey P, Chang DK, Nones K, Johns AL, Patch AM, Gingras MC, et al. Genomic analyses identify molecular subtypes of pancreatic cancer. Nature (2016) 531(7592):47–52. doi: 10.1038/nature16965
18. Villanueva A. Hepatocellular Carcinoma. New Engl J Med (2019) 380(15):1450–62. doi: 10.1056/NEJMra1713263
19. Plichta JK, Ren Y, Thomas SM, Greenup RA, Fayanju OM, Rosenberger LH, et al. Implications for Breast Cancer Restaging Based on the 8th Edition AJCC Staging Manual. Ann Surg (2020) 271(1):169–76. doi: 10.1097/SLA.0000000000003071
20. Bear AS, Vonderheide RH, O’Hara MH. Challenges and Opportunities for Pancreatic Cancer Immunotherapy. Cancer Cell (2020). 38(6):788–802. doi: 10.1016/j.ccell.2020.08.004
21. Zhou Q, Tao X, Xia S, Guo F, Pan C, Xiang H, et al. T Lymphocytes: A Promising Immunotherapeutic Target for Pancreatitis and Pancreatic Cancer? Front Oncol (2020) 10:382:382. doi: 10.3389/fonc.2020.00382
22. Jayasingam SD, Citartan M, Thang TH, Mat Zin AA, Ang KC, Ch’ng ES. Evaluating the Polarization of Tumor-Associated Macrophages Into M1 and M2 Phenotypes in Human Cancer Tissue: Technicalities and Challenges in Routine Clinical Practice. Front Oncol (2019) 9:1512. doi: 10.3389/fonc.2019.01512
23. Aran D, Lasry A, Zinger A, Biton M, Pikarsky E, Hellman A, et al. Widespread parainflammation in human cancer. Genome Biol (2016) 17(1):145. doi: 10.1186/s13059-016-0995-z
24. Pribluda A, Elyada E, Wiener Z, Hamza H, Goldstein RE, Biton M, et al. A senescence-inflammatory switch from cancer-inhibitory to cancer-promoting mechanism. Cancer Cell (2013) 24(2):242–56. doi: 10.1016/j.ccr.2013.06.005
25. Heather JM, Myers PT, Shi F, Aziz-Zanjani MO, Mahoney KE, Perez M, et al. Murine xenograft bioreactors for human immunopeptidome discovery. Sci Rep (2019) 9(1):18558. doi: 10.1038/s41598-019-54700-2
26. Zhang M, Ding G, Zhou L, Shen T, Xu X, Zhao T, et al. Interferon Gamma Inhibits CXCL8-Induced Proliferation and Migration of Pancreatic Cancer BxPC-3 Cell Line via a RhoGDI2/Rac1/NF-kappaB Signaling Pathway. J Interferon Cytokine Res Off J Int Soc Interferon Cytokine Res (2018) 38(9):413–22. doi: 10.1089/jir.2018.0070
27. Metzger P, Kirchleitner SV, Kluge M, Koenig LM, Horth C, Rambuscheck CA, et al. Correction to: Immunostimulatory RNA leads to functional reprogramming of myeloid-derived suppressor cells in pancreatic cancer. J Immunother Cancer (2019) 7(1):349. doi: 10.1186/s40425-019-0830-7
28. Eso Y, Seno H. Current status of treatment with immune checkpoint inhibitors for gastrointestinal, hepatobiliary, and pancreatic cancers. Ther Adv Gastroenterol (2020) 13:1756284820948773. doi: 10.1177/1756284820948773
29. Lu SW, Pan HC, Hsu YH, Chang KC, Wu LW, Chen WY, et al. IL-20 antagonist suppresses PD-L1 expression and prolongs survival in pancreatic cancer models. Nat Commun (2020) 11(1):4611. doi: 10.1038/s41467-020-18244-8
30. Jiang Z, Hsu JL, Li Y, Hortobagyi GN, Hung MC. Cancer Cell Metabolism Bolsters Immunotherapy Resistance by Promoting an Immunosuppressive Tumor Microenvironment. Front Oncol (2020) 10:1197:1197. doi: 10.3389/fonc.2020.01197
31. Tsukamoto M, Imai K, Ishimoto T, Komohara Y, Yamashita YI, Nakagawa S, et al. PD-L1 expression enhancement by infiltrating macrophage-derived tumor necrosis factor-alpha leads to poor pancreatic cancer prognosis. Cancer Sci (2019) 110(1):310–20. doi: 10.1111/cas.13874
32. Huang J, Chen P, Liu K, Liu J, Zhou B, Wu R, et al. CDK1/2/5 inhibition overcomes IFNG-mediated adaptive immune resistance in pancreatic cancer. Gut (2020). doi: 10.1136/gutjnl-2019-320441
33. Janakiram NB, Mohammed A, Bryant T, Ritchie R, Stratton N, Jackson L, et al. Loss of natural killer T cells promotes pancreatic cancer in LSL-Kras(G12D/+) mice. Immunology (2017) 152(1):36–51. doi: 10.1111/imm.12746
34. Yue P, Zhu C, Gao Y, Li Y, Wang Q, Zhang K, et al. Development of an autophagy-related signature in pancreatic adenocarcinoma. Biomed Pharmacother = Biomed Pharmacother (2020) 126:110080. doi: 10.1016/j.biopha.2020.110080
Keywords: macrophage phenotype switch, pancreatic ductal adenocarcinoma, prognostic index, TCGA, GEO, GTEx
Citation: Li M-x, Wang H-y, Yuan C-h, Ma Z-l, Jiang B, Li L, Zhang L and Xiu D-r (2021) Establishment of a Macrophage Phenotypic Switch Related Prognostic Signature in Patients With Pancreatic Cancer. Front. Oncol. 11:619517. doi: 10.3389/fonc.2021.619517
Received: 20 October 2020; Accepted: 21 January 2021;
Published: 03 March 2021.
Edited by:
Guoliang Qiao, Massachusetts General Hospital and Harvard Medical School, United StatesReviewed by:
Xiao Li, Nanjing Medical University, ChinaQiuran Xu, Zhejiang Provincial People’s Hospital, China
Copyright © 2021 Li, Wang, Yuan, Ma, Jiang, Li, Zhang and Xiu. This is an open-access article distributed under the terms of the Creative Commons Attribution License (CC BY). The use, distribution or reproduction in other forums is permitted, provided the original author(s) and the copyright owner(s) are credited and that the original publication in this journal is cited, in accordance with accepted academic practice. No use, distribution or reproduction is permitted which does not comply with these terms.
*Correspondence: Dian-rong Xiu, eGl1ZGlhbnJvbmc3MzIwQDEyNi5jb20=