- 1Department of Clinical Research Center, Dazhou Central Hospital, Dazhou, China
- 2Department of Radiology, Dazhou Central Hospital, Dazhou, China
- 3Department of Clinical Laboratory, Dazhou Central Hospital, Dazhou, China
- 4Department of Ophthalmology, Medical Research Center, Beijing Chaoyang Hospital, Capital Medical University, Beijing, China
- 5Department of Clinical Laboratory, Beijing Chaoyang Hospital, Capital Medical University, Beijing, China
- 6Hubei Key Laboratory of Agricultural Bioinformatics, College of Informatics, Huazhong Agricultural University, Wuhan, China
- 7School of Medical and Life Sciences, Chengdu University of Traditional Chinese Medicine, Chengdu, China
Objectives: To evaluate whether incorporating the radiomics, genomics, and clinical features allows prediction of metastasis in colorectal cancer (CRC) and to develop a preoperative nomogram for predicting metastasis.
Methods: We retrospectively analyzed radiomics features of computed tomography (CT) images in 134 patients (62 in the primary cohort, 28 in the validation cohort, and 44 in the independent-test cohort) clinicopathologically diagnosed with CRC at Dazhou Central Hospital from February 2018 to October 2019. Tumor tissues were collected from all patients for RNA sequencing, and clinical data were obtained from medical records. A total of 854 radiomics features were extracted from enhanced venous-phase CT of CRC. Least absolute shrinkage and selection operator regression analysis was utilized for data dimension reduction, feature screen, and radiomics signature development. Multivariable logistic regression analysis was performed to build a multiscale predicting model incorporating the radiomics, genomics, and clinical features. The receiver operating characteristic curve, calibration curve, and decision curve were conducted to evaluate the performance of the nomogram.
Results: The radiomics signature based on 16 selected radiomics features showed good performance in metastasis assessment in both primary [area under the curve (AUC) = 0.945, 95% confidence interval (CI) 0.892–0.998] and validation cohorts (AUC = 0.754, 95% CI 0.570–0.938). The multiscale nomogram model contained radiomics features signatures, four-gene expression related to cell cycle pathway, and CA 19-9 level. The multiscale model showed good discrimination performance in the primary cohort (AUC = 0.981, 95% CI 0.953–1.000), the validation cohort (AUC = 0.822, 95% CI 0.635–1.000), and the independent-test cohort (AUC = 0.752, 95% CI 0.608–0.896) and good calibration. Decision curve analysis confirmed the clinical application value of the multiscale model.
Conclusion: This study presented a multiscale model that incorporated the radiological eigenvalues, genomics features, and CA 19-9, which could be conveniently utilized to facilitate the individualized preoperatively assessing metastasis in CRC patients.
Introduction
Colorectal cancer (CRC) is a common malignant tumor, for which the incidence of men is usually higher than women. In 2012, more than 690,000 people died of CRC worldwide (1). At present, the main treatment of CRC is surgical resection, supplemented by chemotherapy or radiotherapy. However, more than 20% of patients are still life-threatening because of disease metastasis (2). Accurate prediction of tumor metastasis is of great significance for the individualized treatment and prognosis of patients with CRC (3). Computed tomography (CT), a non-invasive imaging tool, has been used for screening and preoperative evaluation of various cancers (4–7). In CRC patients, the venous phase of enhanced CT scan shows a stronger resolution and good response to the size and scope of tumors (8). However, CT has limited specificity in the differential diagnosis of distal metastasis, metastatic lymph nodes, and lesions with smaller diameter (9, 10). Therefore, we need to find more specific method to distinguish CRC metastasis.
Quantitative high-throughput analysis of a large number of image data obtains radiomics eigenvalues, which allows for more in-depth mining of CT data (11, 12). Radiological eigenvalues can be used as predictive biomarkers to diagnose, treat, and evaluate the disease. Several investigators have shown that the radiomics is closely related to tumor stages and grades (13, 14), and the combined analysis of a set of biomarkers is more practical than single indicators (15). CA-19-9, known as a tumor marker, has been reported to be significantly increased in gastrointestinal cancers (16, 17). It is also used to combine with other clinical indicators evaluating the metastasis of CRC (18). A study has reported that combined radiomics signatures and clinical risk factors such as carcinoembryonic antigen (CEA) are valuable to evaluate the lymph node metastasis in CRC patients (19). Although these features obtained by radiomics that are combined with clinical indicators have been used as useful predictors to predict indeterminate pulmonary nodules and lymph node metastasis in CRC (19, 20), these biomarkers often focus on one or a few aspects of the progression in CRC. Few studies have combined more accurate predictors from different dimensions such as genomics, which may provide more available risk assessment information. In recent years, genomics plays an important role in the diagnosis and treatment of cancers (21). Some studies have explored the metastasis and precise treatment of CRC through genomics analysis (22, 23). The abnormal cell cycle is a typical characteristic of tumor (24). CDKN2A, TP53, ATM, and MYC play an important role in cell cycle, which regulates the cell growth and proliferation (25, 26). However, an optimal approach, combined with more dimensions, is needed to improve the prediction model performance.
Therefore, the aim of this study was to develop and validate a multiscale model by combining radiomics signatures, genomics features, and clinical risk factors for evaluation of preoperative metastasis in CRC patients.
Materials and Methods
Patients
The study was approved by the ethics committee of Dazhou Central Hospital (IRB00000003-17003) and obtained informed consent from patients. The study retrospectively reviewed 267 patients clinicopathologically diagnosed with CRC from February 2018 to March 2019 as primary and validation cohorts and reviewed 116 patients from April 2019 to October 2019 as independent-test cohort. The participants underwent surgical resection for therapeutic purposes. Finally, 90 patients were included in primary and validation cohorts. Independent-test cohort included 44 CRC patients. All CRC tissue samples were obtained intraoperatively for RNA sequencing and stored in liquid nitrogen. The clinical stage of tumors was according to tumor–node–metastasis staging system [American Joint Committee on Cancer, 8th edition, staging system]. The metastasis was defined as patients with pathologically diagnosed CRC metastasis after surgery or within 3 months after surgery.
The 90 participants were randomly divided into a primary cohort and a validation cohort at a ratio of ~7:3. In total, the primary cohort comprised 62 patients (38 males and 24 females, 24 metastasis and 38 non-metastasis patients). There were 28 patients in the validation cohort (16 males and 12 female, 11 metastasis, and 17 non-metastasis patients). In the independent-test cohort, there were 25 metastasis and 19 non-metastasis patients (29 males and 15 females). Clinical data, including age, gender, preoperative histological grade, and CA 19-9, were obtained from medical records.
Serum CA 19-9 levels of the patients were detected by CA 19-9 test kit (Roche Diagnostics Corp., Switzerland) with cobas e601 system at the initial hospitalization. The recommended normal range of CA 19-9 is 0–27 ng/mL. The flowchart of the study is shown in Figures 1A,B. Inclusion criteria for the study were as follows: (1) patients with baseline and 2-weeks complete enhanced CT examinations; (2) CT images were obtained with 1-mm thickness; (3) the patient diagnosed with CRC by pathology; and (4) age 18–75 years. Exclusion criteria were as follows: (1) patients with inflammatory diseases, including infection, ischemic heart disease, collagen disease, intestinal perforation, or obstruction; (2) patients with familial adenomatous polyposis or hereditary nonpolyposis colon cancer; and (3) patients, lacking CT images or with poor image quality, could not extract radiomics features.
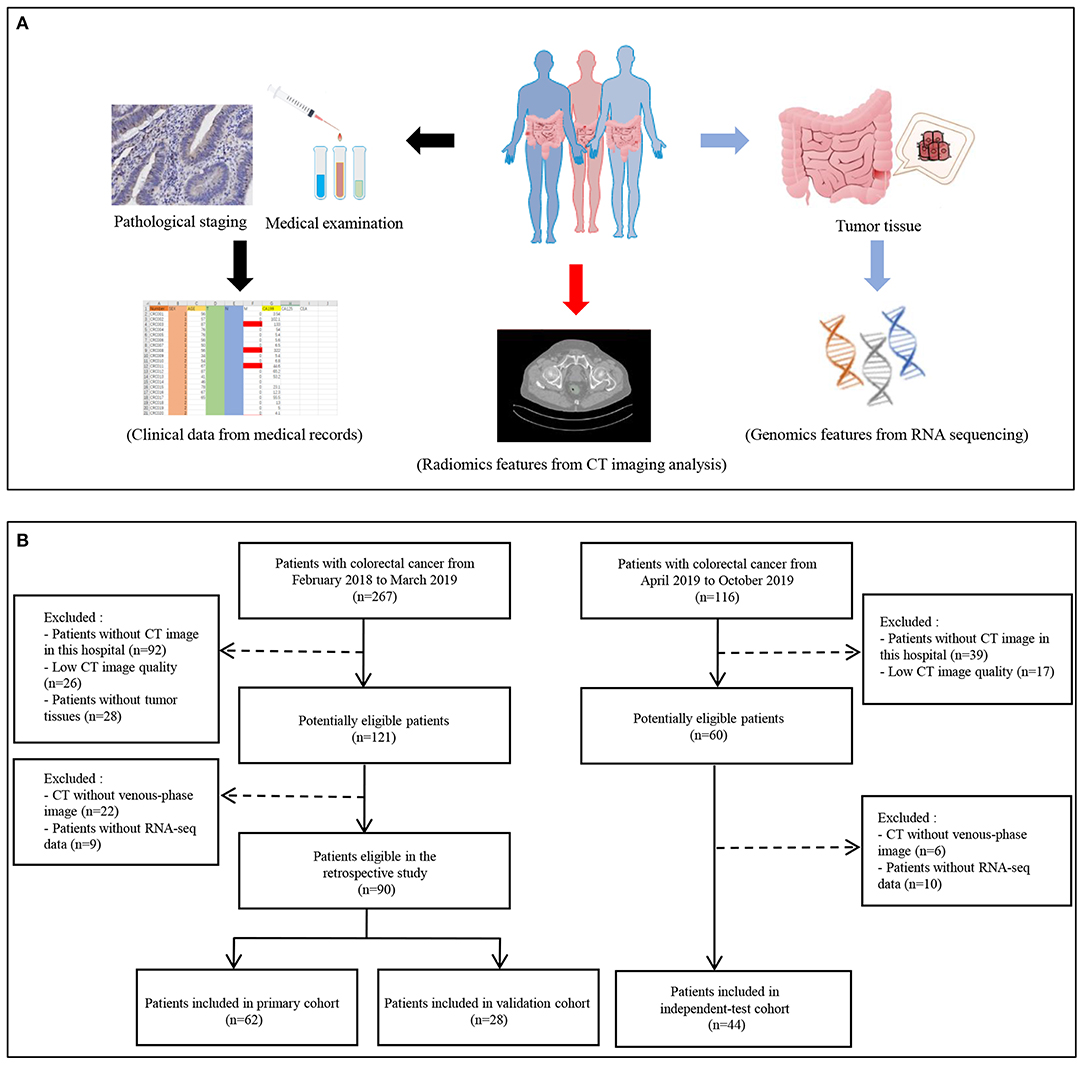
Figure 1. Flowchart of study. (A) The data collection pipeline in this study. (B) Flowchart of patients' inclusion.
CT Image Acquisition and Analysis
The imaging ensemble data acquisition was performed on the abdominal CT enhanced scan using Siemens Definition AS 64-row CT. The acquisition parameters were as follows: 100 kV, CAREDose4D, 0.5-s rotation time, detector collimation: 128 × 0.6 mm, field of view 380 × 380 mm, matrix: 512 × 512; after routine CT plain scan, 60–80 mL iodophor contrast agent (320 mg/mL) was used at a speed of 2–3 mL/s and with a high-pressure syringe (Ulrich, Germany), and then 40 mL of normal saline was injected, after 23 s. Arterial scan, 60-s postvenous scan, delayed the scan after 120 s; delayed prolonged scan time according to the lesion, contrast-enhanced CT reconstruction with thickness 1 mm. Then, the CT image of the portal vein (thickness 1.0 mm) DICOM data was retrieved from CD Viewer (INFINITT, Seoul, South Korea). Two professional data readers used the 3D Slicer software (version 4.10.2) to delineate the tumor tissue under the guidance of a clinical imaging specialist for building a three-dimensional tumor tissue (27, 28). Finally, the eigenvalue results were derived from the SlicerRadiomics plug-in.
Radiomics Signature Extraction
The primary cohort was used to establish the prediction models. The 10-fold cross-validation least absolute shrinkage and selection operator (LASSO) was used for selecting the most valuable radiomics features via minimum criteria. The radiomics score was calculated for each participant by a linear combination of screened features weighted by their respective LASSO coefficients.
Genomics Feature Selection
Total RNA of tumor tissues collected from CRC patients was extracted by TRIZOL reagent (Takara Biomedical Technology, Beijing, China). Eligible total RNA was purified and fragmented for further sequencing library construction. Qualified sequencing libraries were sequenced by Illumina with sequencing strategy PE150. Clean reads were used for subsequent analysis. The differentially expressed genes between metastasis and non-metastasis groups were analyzed by DEseq2 package in R software. Protein–protein interaction network (https://string-db.org/) was applied to analyze the potential interaction.
Construction and Performance of the Multiscale Nomogram
The prediction model was developed based on the selected radiomics features by using multivariable logistic regression analysis. The model was converted into prediction nomogram for providing clinicians with an easy-to-use tool to facilitate the individual probability of CRC preoperative metastasis. The predictive performance of the multivariate nomogram was assessed in the primary cohort and then verified in the validation cohort and independent-test cohort. The receiver operating characteristic curve (ROC) analysis was used as a performance indicator. In order to estimate the clinical usefulness of the prediction nomogram, the decision curve was conducted by calculating the net benefits for a range of threshold probabilities.
Statistical Analysis
Statistical analysis was performed using R software [version R 3.6.1 for Windows (x64)] and IBM SPSS (version 20.0). The appropriate package and function to complete the corresponding statistical test were loaded. The “pROC” package (version 1.15.3) was used to plot ROC curves. The “glmnet” package (version 2.0–18) was used to finish the LASSO model. The “rms” package (version 5.1–3.1) was performed for calibration curve. The “rmda” package (version 1.6) was performed for decision curve. At inspection level, P < 0.05 is considered statistically significant. The differences of the basic clinical information between metastasis and non-metastasis groups were performed by t-test or χ2 test.
Results
Clinical Phenotype Data
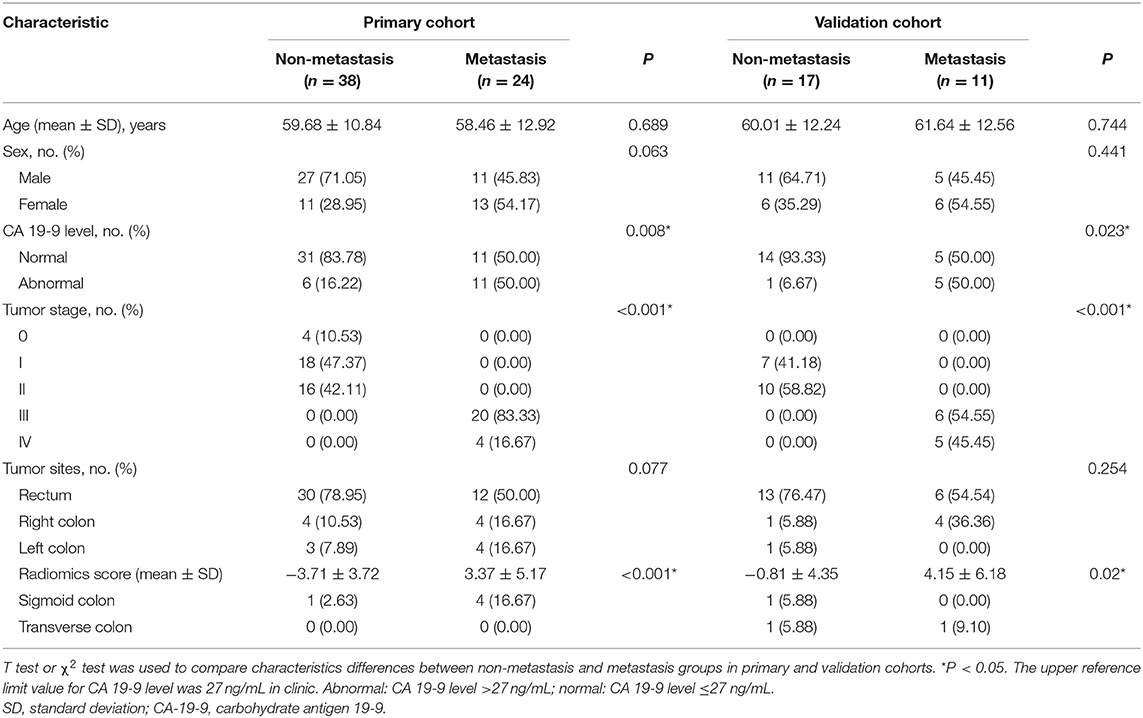
The characteristics of patients in the primary cohort, validation cohort, and independent-test cohort are shown in Table 1, Supplementary Tables 1, 2. There was no difference in clinical data between the primary and validation cohorts (Supplementary Table 1). CA 19-9 showed a significant difference between metastasis and non-metastasis groups in the primary cohort (P < 0.05), which was then confirmed in the validation cohort (P < 0.05) (Table 1).
Radiomics Signature Building
Using the LASSO regression model, 854 texture features were reduced to 16 potential predictors (ratio 53:1; Figures 2A,B). The radiology eigenvalues were calculated by radiomics score calculation formula (Supplementary File 1). The radiomics score was significantly different between metastasis and non-metastasis in the primary and validation cohorts (P < 0.05) (Table 1, Figure 2C). The area under curve (AUC) of the radiomics model reached 0.945 [95% confidence interval (CI) 0.892–0.998] in the primary cohort and 0.754 (95% CI 0.570–0.938) in the validation cohort, respectively (Figure 2D). Typical cases of non-metastasis and metastasis are presented in Supplementary Figure 2.
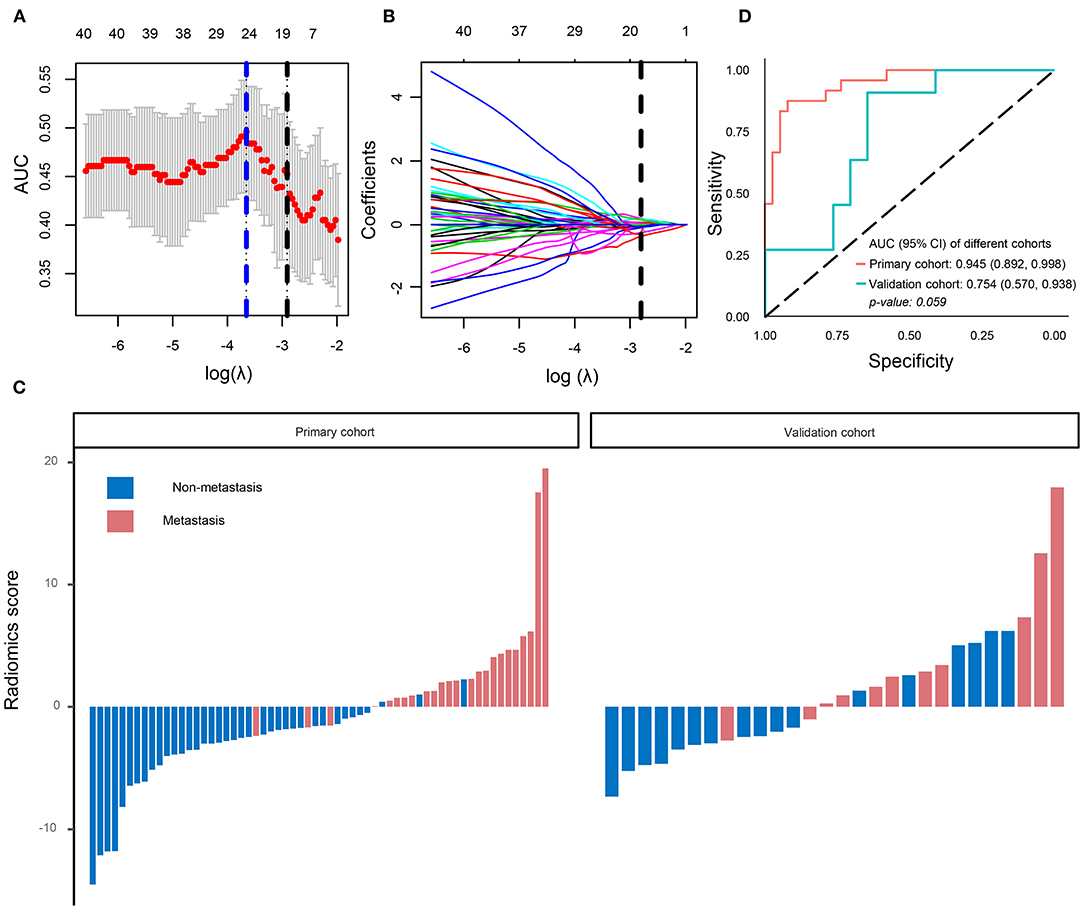
Figure 2. Radiomics signatures selection and model performance. (A) Tuning parameter (λ) was selected in the LASSO model by 10-fold cross-validation via minimum criteria. The area under the receiver operating characteristic curve was plotted versus log(λ). A log (λ) = −2.91 was chosen. (B) LASSO coefficient profiles of the 854 texture features. A coefficient profile plot was produced against the log (λ) sequence. Vertical line was plotted at the optimal λ value, which resulted in 16 non-zero coefficients. (C) The radiomics score for each patient in the primary (AUC) cohort (n = 62) and validation cohort (n = 28). (D) ROC curve of radiomics model in the primary cohort and validation cohort. LASSO, least absolute shrinkage and selection operator.
Development and Validation of the Multiscale Model
In order to improve the performance of the model, we combined multidimensional data. Genomics features and clinical risk factors were screened for the construction of the multiscale radiogenomics model. The analysis of RNA sequencing results revealed that the cell cycle pathway was significantly different between the metastasis group and the non-metastasis group (Figures 3A,B). The four cell cycle–related genes (CDKN2A, TP53, ATM, and MYC) were identified by protein–protein interaction network. Among them, CDKN2A was notably increased in the metastasis group (Figure 3C). Previous studies have shown that CA 19-9 is a commonly used tumor marker in clinical practice (18). Remarkably, the multiscale model, combined radiomics with four cell cycle–related genes and clinical risk factor CA 19-9, had better discriminative capacity than the radiomics model. The AUC of the multiscale model reached 0.981 (95% CI 0.953–1.000) and 0.822 (95% CI 0.635–1.000) in the primary and validation cohorts, respectively (Figure 4A). In addition, as shown in Table 2, the multiscale model had better accuracy for assessing CRC preoperative metastasis (sensitivity: 94.4%, specificity: 94.7%, positive predictive value: 97.1%, negative predictive value: 90.0%). To further validate the generalization of multiscale model, we applied the model in an independent-test cohort. The AUC achieved 0.752 (95% CI 0.608–0.896) in the independent-test cohort (Figure 4B), which suggested that the model had good robustness and generalization.
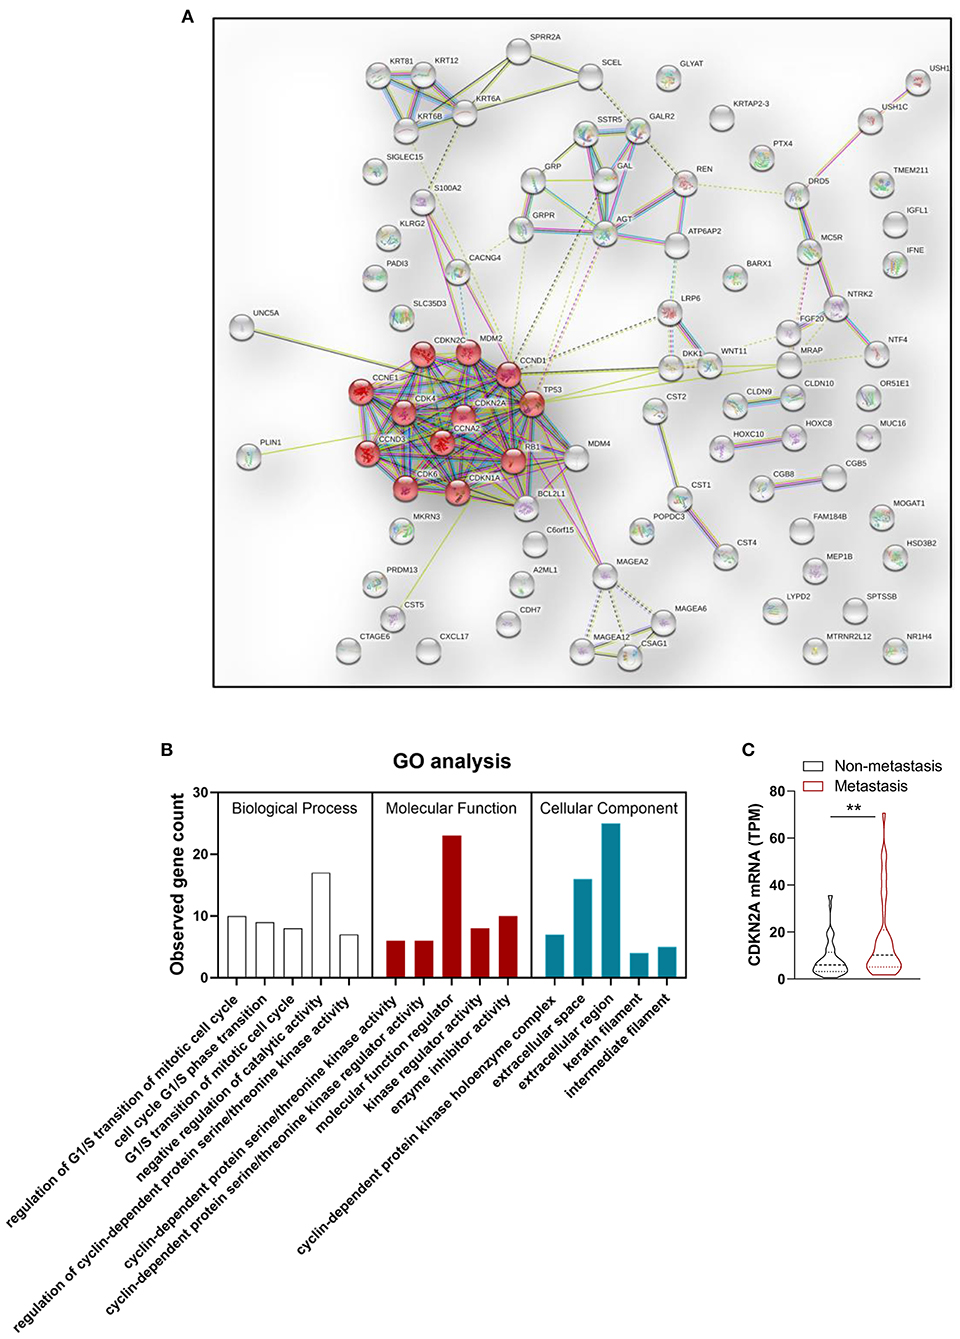
Figure 3. Genomics features selection. (A) Protein–protein interaction (PPI) network and (B) Gene Ontology (GO) enrichment analysis of differentially expressed genes between metastasis group and non-metastasis group. Red node represents proteins enriched in cell cycle pathway. (C) Statistical analysis of CDKN2A mRNA expression level in metastasis group and non-metastasis group. n = 90. **P < 0.01.
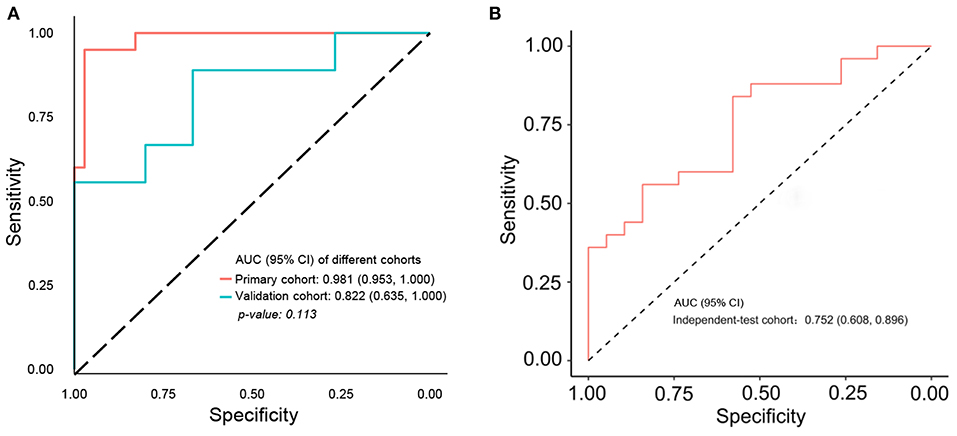
Figure 4. ROC curve of multiscale radiogenomics model. (A) ROC curve of multiscale radiogenomics model in the primary cohort and validation cohorts. (B) ROC curve of multiscale radiogenomics model in the independent-test cohort.

Table 2. Performance of the radiomics model and multiscale radiogenomics model in primary and validation cohorts.
Clinical Use
Next, we further constructed the multiscale nomogram for clinical use, based on radiomics feature, genomics characteristics, and CA 19-9 (Figure 5A). Good calibration was observed for the probability of CRC metastasis (Figure 5B). The decision curve analyses of the radiomics model and the multiscale model are shown in Figure 5C. The decision curve illustrated that both models had relatively good performance for clinical application. Importantly, the multiscale model indicated higher benefit than the radiomics model, which suggested that the multiscale model was a reliable clinical utility for assessment of preoperative metastasis in CRC patients.
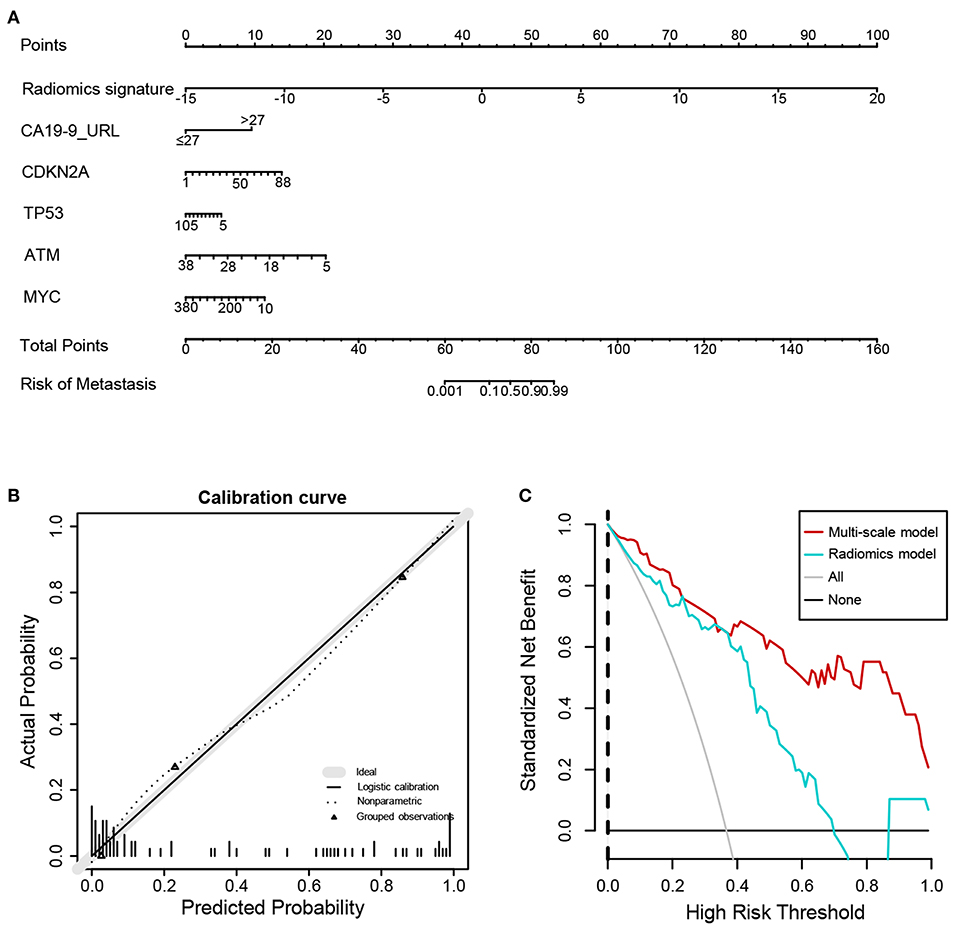
Figure 5. Nomogram, calibration curve, and decision curve derived from the multiscale radiogenomics model. (A) Nomogram developed with the radiomics score, genomics, and CA-19-9. (B) Calibration curve analysis for the multiscale radiogenomics model. The y axis represents the actual probability of metastasis. The x axis represents the predicted probability of metastasis. (C) Decision curve analysis for the multiscale radiogenomics model.
Discussion
In this study, we established and validated a multiscale model for individualized preoperative metastasis assessment in patients with CRC. The multiscale nomogram incorporated radiomics features, genomics signatures, and clinical risk factor. The convenient multiscale nomogram facilitated the individualized evaluation of CRC preoperative metastasis.
Metastasis is the leading cause of reduced 5-years survival rate for patients with CRC (2). Accurate evaluation of metastasis is critical for optimizing the CRC treatment strategies. Currently, the discrimination of CRC metastasis based on the visual judgment of clinicians remains challenging. Quantitative high-throughput radiomics analysis provides many high-dimensional imaging characteristics based on medical imaging, and the main applications are diagnosis, treatment planning, and evaluations in the field of oncology (29). Previous studies have demonstrated that radiomics is used successfully in the prediction of lymph node metastasis and of outcomes (19, 30). Moreover, the combined analysis using multiple markers performs better than individual analysis in clinical practice (19, 31, 32). Meanwhile, risk stratification and clinical decision-making are better to assess the disease risk by polygenic risk score (33). Exploring the genomics of cancer patients might help to optimize therapeutic strategies. Previous study has proposed that the gene expression could be evaluated by radiomics features in CRC (34). However, the potential associations between radiomics, gene expression, and clinical risk remain unclear.
In this study, the regions of interest on enhanced venous-phase CT were delineated to screen for metastasis-related image features. Eight hundred fifty-four radiomics features, extracted from enhanced venous-phase CT, were reduced to 16 potential predictors by LASSO. The AUCs of the radiomics model were 0.945 (95% CI 0.892–0.998) and 0.754 (95% CI 0.570–0.938) in the primary and validation cohorts, respectively. To enhance the performance of the model, we combined gene expression and clinical risk factors. The 90 CRC tissues were analyzed by RNA sequencing, and we selected four genes (CDKN2A, TP53, ATM, and MYC) closely related to the cell cycle based on the RNA sequencing analysis. Existing studies have shown that CDKN2A, TP53, ATM, and MYC play an important role in progression and metastasis of CRC diseases (35–38). Our study indicated that these four genes were identified as genomics risk features for assessment of CRC metastatic status. Previous studies have shown that CA 19-9 could be used as an important indicator for the prognosis of patients with CRC (39). Moreover, it has been demonstrated that CA 19-9 could be used to monitor the disease development in the metastatic CRC patients without of CEA elevation (40). Therefore, CA 19-9 was kept as a predictor during the process of model establishment. In this study, we combined genomics features and CA 19-9 with radiomics signatures to develop a multiscale model for evaluating the metastasis of CRC. The AUC of the multiscale model [0.981 (95% CI 0.953–1.000) and 0.822 (95% CI 0.635–1.000) in the primary and validation cohorts, respectively] was higher than the radiomics model, indicating that the multiscale model had a better performance. These results give us some hints, that is, while focusing on radiomics, the convergence of multiple omics will be more valuable for disease prediction and diagnosis.
We utilized a nomogram as an individualized tool for CRC preoperative metastasis detection and evaluated whether the multiscale nomogram on the basis of decisions could benefit patients. Decision curve analysis was performed for estimating the clinical consequences of the multiscale nomogram based on threshold probability. The decision curves indicated that the threshold probability ranged from 0 to 100%, implying that applying the multiscale nomogram to assess CRC metastatic status adds more net benefit than the “treat-all” or “treat-none” scheme. As expected, the net benefit of the multiscale model was better than the radiomics model, suggesting that the multiscale model could preferably assist both clinicians and patients to evaluate the risk of CRC preoperative metastasis.
There are several limitations to our study that deserve recognition. First, this is a single-center study with limited generalizability. Second, the sample size of the study is relatively small. Third, the research period and follow-up time were not long enough; some metastasis may be omitted. A large sample of patients from multiple centers should be studied to improve the robustness and reproducibility of our developed multiscale model.
In conclusion, this study presented a multiscale model that incorporated the radiological eigenvalues, genomics features, and CA 19-9, which could be conveniently utilized to facilitate the individualized evaluation of CRC preoperative metastasis.
Data Availability Statement
The original contributions presented in the study are pubicly available. This data can be found here: https://bigd.big.ac.cn/gsa-human under accession number HRA000235.
Ethics Statement
The studies involving human participants were reviewed and approved by the ethics committee of Dazhou Central Hospital. The patients/participants provided their written informed consent to participate in this study.
Author Contributions
FZ, H-YZ, and JingW participated in the study design and manuscript preparation. QL, JL, LX, and JiaW performed radiomics features extraction. QL, JL, LX, ZZ, JF, XH, and YC performed the samples and clinical data acquisition. QL, JL, JiaW, and FZ analyzed the data. QL, ZZ, FZ, and H-YZ revised the manuscript. All authors contributed to the article and approved the submitted version.
Funding
This study was supported by the National Natural Science Foundation of China (81902861 and 32000485), the Scientific Research Fund of Sichuan health and Health Committee (No. 18PJ361), and the Scientific Research Fund of Technology Bureau in Sichuan Province (Nos. 2018138 and 2018JY0324).
Conflict of Interest
The authors declare that the research was conducted in the absence of any commercial or financial relationships that could be construed as a potential conflict of interest.
Supplementary Material
The Supplementary Material for this article can be found online at: https://www.frontiersin.org/articles/10.3389/fonc.2021.620945/full#supplementary-material
Supplementary Figure 1. Typical cases of non-metastasis and metastasis.
Supplementary Table 1. Characteristics comparison between primary and validation cohorts.
Supplementary Table 2. Characteristic of independent-test cohort.
Abbreviations
CRC, colorectal cancer; CT, computed tomography; CA 19-9, carbohydrate antigen 19-9; AUC, area under curve; ROC, receiver operating characteristic curve; LASSO, least absolute shrinkage and selection operator; CI, confidence interval; PPV, positive predictive value; NPV, negative predictive value.
References
1. Torre LA, Bray F, Siegel RL, Ferlay J, Lortet-Tieulent J, Jemal A. Global cancer statistics, 2012. CA Cancer J Clin. (2015) 65:87–108. doi: 10.3322/caac.21262
2. Siegel RL, Miller KD, Jemal A. Cancer statistics, 2019. CA Cancer J Clin. (2019) 69:7–34. doi: 10.3322/caac.21551
3. Engstrom PF, Arnoletti JP, Benson AB 3rd, Chen YJ, Choti MA, Cooper HS, et al. NCCN clinical practice guidelines in oncology: colon cancer. J Natl Compr Canc Netw. (2009) 7:778–831. doi: 10.6004/jnccn.2009.0056
4. Deck MD, Messina AV, Sackett JF. Computed tomography in metastatic disease of the brain. Radiology. (1976) 119:115–20. doi: 10.1148/119.1.115
5. McWilliams A, Tammemagi MC, Mayo JR, Roberts H, Liu G, Soghrati K, et al. Probability of cancer in pulmonary nodules detected on first screening CT. N Engl J Med. (2013) 369:910–9. doi: 10.1056/NEJMc1312411
6. Inouye SK, Sox HC, Jr. Standard and computed tomography in the evaluation of neoplasms of the chest. A comparative efficacy assessment. Ann Intern Med. (1986) 105:906–24. doi: 10.7326/0003-4819-105-6-906
7. Byrom J, Widjaja E, Redman CW, Jones PW, Tebby S. Can pre-operative computed tomography predict resectability of ovarian carcinoma at primary laparotomy? BJOG. (2002) 109:369–75. doi: 10.1111/j.1471-0528.2002.01216.x
8. Mainenti PP, Cirillo LC, Camera L, Persico F, Cantalupo T, Pace L, et al. Accuracy of single phase contrast enhanced multidetector CT colonography in the preoperative staging of colo-rectal cancer. Eur J Radiol. (2006) 60:453–9. doi: 10.1016/j.ejrad.2006.08.001
9. Rappeport ED, Loft A. Liver metastases from colorectal cancer: imaging with superparamagnetic iron oxide (SPIO)-enhanced MR imaging, computed tomography and positron emission tomography. Abdom Imaging. (2007) 32:624–34. doi: 10.1007/s00261-007-9297-y
10. Dighe S, Purkayastha S, Swift I, Tekkis PP, Darzi A, A'Hern R, et al. Diagnostic precision of CT in local staging of colon cancers: a meta-analysis. Clin Radiol. (2010) 65:708–19. doi: 10.1016/j.crad.2010.01.024
11. Aerts HJ, Velazquez ER, Leijenaar RT, Parmar C, Grossmann P, Carvalho S, et al. Decoding tumour phenotype by noninvasive imaging using a quantitative radiomics approach. Nat Commun. (2014) 5:4006. doi: 10.1038/ncomms5644
12. Gillies RJ, Kinahan PE, Hricak H. Radiomics: images are more than pictures, they are Data. Radiology. (2016) 278:563–77. doi: 10.1148/radiol.2015151169
13. Zhang Y, Moore GR, Laule C, Bjarnason TA, Kozlowski P, Traboulsee A, et al. Pathological correlates of magnetic resonance imaging texture heterogeneity in multiple sclerosis. Ann Neurol. (2013) 74:91–9. doi: 10.1002/ana.23867
14. Yoon HJ, Kim Y, Kim BS. Intratumoral metabolic heterogeneity predicts invasive components in breast ductal carcinoma in situ. Eur Radiol. (2015) 25:3648–58. doi: 10.1007/s00330-015-3761-9
15. Birkhahn M, Mitra AP, Cote RJ. Molecular markers for bladder cancer: the road to a multimarker approach. Expert Rev Anticancer Ther. (2007) 7:1717–27. doi: 10.1586/14737140.7.12.1717
16. Shi B, Wang L, Yan C, Chen D, Liu M, Li P. Nonlinear heart rate variability biomarkers for gastric cancer severity: a pilot study. Sci Rep. (2019) 9:13833. doi: 10.1038/s41598-019-50358-y
17. Feng B, Zheng MH, Zheng YF, Lu AG, Li JW, Wang ML, et al. Normal and modified urinary nucleosides represent novel biomarkers for colorectal cancer diagnosis and surgery monitoring. J Gastroenterol Hepatol. (2005) 20:1913–9. doi: 10.1111/j.1440-1746.2005.03888.x
18. Vukobrat-Bijedic Z, Husic-Selimovic A, Sofic A, Bijedic N, Bjelogrlic I, Gogov B, et al. Cancer antigens (CEA and CA 19-9) as markers of advanced stage of colorectal carcinoma. Med Arch. (2013) 67:397–401. doi: 10.5455/medarh.2013.67.397-401
19. Huang YQ, Liang CH, He L, Tian J, Liang CS, Chen X, et al. Development and validation of a radiomics nomogram for preoperative prediction of lymph node metastasis in colorectal cancer. J Clin Oncol. (2016) 34:2157–64. doi: 10.1200/JCO.2015.65.9128
20. Hu T, Wang S, Huang L, Wang J, Shi D, Li Y, et al. A clinical-radiomics nomogram for the preoperative prediction of lung metastasis in colorectal cancer patients with indeterminate pulmonary nodules. Eur Radiol. (2019) 29:439–49. doi: 10.1007/s00330-018-5539-3
21. Lawrence MS, Stojanov P, Mermel CH, Robinson JT, Garraway LA, Golub TR, et al. Discovery and saturation analysis of cancer genes across 21 tumour types. Nature. (2014) 505:495–501. doi: 10.1038/nature12912
22. Kyrochristos ID, Roukos DH. Comprehensive intra-individual genomic and transcriptional heterogeneity: evidence-based colorectal cancer precision medicine. Cancer Treat Rev. (2019) 80:101894. doi: 10.1016/j.ctrv.2019.101894
23. Oga T, Yamashita Y, Soda M, Kojima S, Ueno T, Kawazu M, et al. Genomic profiles of colorectal carcinoma with liver metastases and newly identified fusion genes. Cancer Sci. (2019) 110:2973–81. doi: 10.1111/cas.14127
24. Malumbres M, Barbacid M. Cell cycle, CDKs and cancer: a changing paradigm. Nat Rev Cancer. (2009) 9:153–66. doi: 10.1038/nrc2602
25. Bertoli C, Skotheim JM, de Bruin RA. Control of cell cycle transcription during G1 and S phases. Nat Rev Mol Cell Biol. (2013) 14:518–28. doi: 10.1038/nrm3629
26. Aarts M, Linardopoulos S, Turner NC. Tumour selective targeting of cell cycle kinases for cancer treatment. Curr Opin Pharmacol. (2013) 13:529–35. doi: 10.1016/j.coph.2013.03.012
27. Bruns N. [3D Slicer: universal 3D visualization software]. Unfallchirurg. (2019) 122:662–3. doi: 10.1007/s00113-019-0654-4
28. Fedorov A, Beichel R, Kalpathy-Cramer J, Finet J, Fillion-Robin J-C, Pujol S, et al. 3D Slicer as an image computing platform for the Quantitative Imaging Network. Magn Reson Imaging. (2012) 30:1323–41. doi: 10.1016/j.mri.2012.05.001
29. Liu Z, Wang S, Dong D, Wei J, Fang C, Zhou X, et al. The applications of radiomics in precision diagnosis and treatment of oncology: opportunities and challenges. Theranostics. (2019) 9:1303–22. doi: 10.7150/thno.30309
30. Dohan A, Gallix B, Guiu B, Le Malicot K, Reinhold C, Soyer P, et al. Early evaluation using a radiomic signature of unresectable hepatic metastases to predict outcome in patients with colorectal cancer treated with FOLFIRI and bevacizumab. Gut. (2020) 69:531–9. doi: 10.1136/gutjnl-2018-316407
31. Huang Y, Liu Z, He L, Chen X, Pan D, Ma Z, et al. Radiomics signature: a potential biomarker for the prediction of disease-free survival in early-Stage (I or II) non-small cell lung cancer. Radiology. (2016) 281:947–57. doi: 10.1148/radiol.2016152234
32. Zhang JX, Song W, Chen ZH, Wei JH, Liao YJ, Lei J, et al. Prognostic and predictive value of a microRNA signature in stage II colon cancer: a microRNA expression analysis. Lancet Oncol. (2013) 14:1295–306. doi: 10.1016/S1470-2045(13)70491-1
33. Zeggini E, Gloyn AL, Barton AC, Wain LV. Translational genomics and precision medicine: Moving from the lab to the clinic. Science. (2019) 365:1409–13. doi: 10.1126/science.aax4588
34. Chu Y, Li J, Zeng Z, Huang B, Zhao J, Liu Q, et al. A novel model based on cxcl8-derived radiomics for prognosis prediction in colorectal cancer. Front Oncol. (2020) 10:575422. doi: 10.3389/fonc.2020.575422
35. Park HE, Kim JH, Cho NY, Lee HS, Kang GH. Intratumoral Fusobacterium nucleatum abundance correlates with macrophage infiltration and CDKN2A methylation in microsatellite-unstable colorectal carcinoma. Virchows Arch. (2017) 471:329–36. doi: 10.1007/s00428-017-2171-6
36. Iacopetta B. TP53 mutation in colorectal cancer. Hum Mutat. (2003) 21:271–6. doi: 10.1002/humu.10175
37. Randon G, Fuca G, Rossini D, Raimondi A, Pagani F, Perrone F, et al. Prognostic impact of ATM mutations in patients with metastatic colorectal cancer. Sci Rep. (2019) 9:2858. doi: 10.1038/s41598-019-39525-3
38. Satoh K, Yachida S, Sugimoto M, Oshima M, Nakagawa T, Akamoto S, et al. Global metabolic reprogramming of colorectal cancer occurs at adenoma stage and is induced by MYC. Proc Natl Acad Sci USA. (2017) 114:E7697–06. doi: 10.1073/pnas.1710366114
39. Stiksma J, Grootendorst DC, van der Linden PW. CA 19-9 as a marker in addition to CEA to monitor colorectal cancer. Clin Colorectal Cancer. (2014) 13:239–44. doi: 10.1016/j.clcc.2014.09.004
Keywords: colorectal cancer, metastasis, radiomics, genomics, carbohydrate antigen 19-9
Citation: Liu Q, Li J, Xu L, Wang J, Zeng Z, Fu J, Huang X, Chu Y, Wang J, Zhang H-Y and Zeng F (2021) Individualized Prediction of Colorectal Cancer Metastasis Using a Radiogenomics Approach. Front. Oncol. 11:620945. doi: 10.3389/fonc.2021.620945
Received: 24 October 2020; Accepted: 15 February 2021;
Published: 28 April 2021.
Edited by:
Peng Mi, Sichuan University, ChinaReviewed by:
Jiyuan Zhou, Guangzhou Medical University, ChinaGang Li, Peking University First Hospital, China
Copyright © 2021 Liu, Li, Xu, Wang, Zeng, Fu, Huang, Chu, Wang, Zhang and Zeng. This is an open-access article distributed under the terms of the Creative Commons Attribution License (CC BY). The use, distribution or reproduction in other forums is permitted, provided the original author(s) and the copyright owner(s) are credited and that the original publication in this journal is cited, in accordance with accepted academic practice. No use, distribution or reproduction is permitted which does not comply with these terms.
*Correspondence: Fanxin Zeng, emVuZ2Z4QHBrdS5lZHUuY24=; Hong-Yu Zhang, emh5NjMwQG1haWwuaHphdS5lZHUuY24=; Jing Wang, a3ljNjYzNkAxMjYuY29t
†These authors have contributed equally to this work
 Qin Liu1†
 Jie Li
 Jiasi Wang
 Xuan Huang
 Jing Wang
 Hong-Yu Zhang
 Fanxin Zeng