 Lang Xiong1†
 Haolin Chen2,3,4†
 Xiaofeng Tang5†Biyun Chen1
 Xinhua Jiang1
 Lizhi Liu1Yanqiu Feng2,3,4
 Longzhong Liu5*
 Li Li1*
- 1Department of Medical Imaging, Collaborative Innovation Center for Cancer Medicine, State Key Laboratory of Oncology in South China, Sun Yat-Sen University Cancer Center, Guangzhou, China
- 2School of Biomedical Engineering, Southern Medical University, Guangzhou, China
- 3Guangdong Provincial Key Laboratory of Medical Image Processing, Southern Medical University, Guangzhou, China
- 4Guangdong-Hong Kong-Macao Greater Bay Area Center for Brain Science and Brain-Inspired Intelligence, Southern Medical University, Guangzhou, China
- 5Department of Ultrasound, Collaborative Innovation Center for Cancer Medicine, State Key Laboratory of Oncology in South China, Sun Yat-Sen University Cancer Center, Guangzhou, China
Background: Accurate prediction of recurrence is crucial for personalized treatment in breast cancer, and whether the radiomics features of ultrasound (US) could be used to predict recurrence of breast cancer is still uncertain. Here, we developed a radiomics signature based on preoperative US to predict disease-free survival (DFS) in patients with invasive breast cancer and assess its additional value to the clinicopathological predictors for individualized DFS prediction.
Methods: We identified 620 patients with invasive breast cancer and randomly divided them into the training (n = 372) and validation (n = 248) cohorts. A radiomics signature was constructed using least absolute shrinkage and selection operator (LASSO) Cox regression in the training cohort and validated in the validation cohort. Univariate and multivariate Cox proportional hazards model and Kaplan–Meier survival analysis were used to determine the association of the radiomics signature and clinicopathological variables with DFS. To evaluate the additional value of the radiomics signature for DFS prediction, a radiomics nomogram combining the radiomics signature and clinicopathological predictors was constructed and assessed in terms of discrimination, calibration, reclassification, and clinical usefulness.
Results: The radiomics signature was significantly associated with DFS, independent of the clinicopathological predictors. The radiomics nomogram performed better than the clinicopathological nomogram (C-index, 0.796 vs. 0.761) and provided better calibration and positive net reclassification improvement (0.147, P = 0.035) in the validation cohort. Decision curve analysis also demonstrated that the radiomics nomogram was clinically useful.
Conclusion: US radiomics signature is a potential imaging biomarker for risk stratification of DFS in invasive breast cancer, and US-based radiomics nomogram improved accuracy of DFS prediction.
Introduction
Recurrence remains the principal cause of breast cancer-related death, which seriously endanger the health of women (1, 2). More intensive therapy seems to improve prognosis for patients at high risk of recurrence (3). For predicting breast cancer recurrence, many prognostic models have been developed based on the clinicopathological factors like tumor size, nodal status, and Ki-67 expression, but the performance of most models declined for some independent populations (4). Gene tests have been reported to predict patient outcome (5), but they are difficult to be widely used in clinically due to the high price and complex operation. More convenient and appropriate methods to enhance recurrence prediction for breast cancer is the need of the hour.
Radiomics holds promise in predicting breast cancer recurrence due to its high-dimensional features extracted from medical images (6), which are not only related to the multigene assay recurrence scores of breast cancer but also associated to the recurrence survival (7–9). However, most previous studies about radiomics and breast cancer survival conducted thus far were based on magnetic resonance imaging (MRI). Ultrasound (US) is a safe, inexpensive, and widely available modality. US radiomics features could distinguish benign breast tumors from malignant tumors, could predict axillary lymph node metastasis, and could assist clinicians with accurate prognosis prediction in breast cancer (10–12). Therefore, whether US radiomics features could be used to predict breast cancer recurrence is merits further investigation.
Considering the above findings, a multiple-feature-based radiomics signature extracted from preoperative US images was developed for predicting disease-free survival (DFS) of invasive breast cancer in our study and its additional value added to the clinicopathological predictor was further assessed.
Materials and Methods
Patients
This study has obtained the ethical approval from the institutional review board, the informed patient consent was waived due to the nature of retrospective analysis. From February 2014 to November 2016, 812 consecutive women of breast cancer were identified. The inclusion criteria included: (1) patients with complete clinicopathological data and follow-up information; (2) primary unilateral invasive breast cancer confirmed by histopathology; (3) US examination performed within 2 weeks preoperatively (4); patients with no anticancer therapy before US examination; and (5) patients without history of breast cancer and/or other malignancy. The exclusion criteria included: (1) patients who received preoperative neoadjuvant chemotherapy; (2) patients presenting with metastatic disease; (3) insufficient quality of images and/or only partial tumor included in the images; and (4) patients lost to follow up. Finally, we enrolled 620 patients (mean age: 49.62 years, range: 27–87 years) (Figure S1) and divided them into the training cohort (n = 372) and validation cohort (n=248) randomly.
Clinicopathological Data
Medical records were reviewed to acquire the clinical and pathological data, including: age; status of menopausal; history of risk factors for breast cancer (including family history of breast cancer and/or benign breast disease history); surgery type and adjuvant treatment (radiotherapy, chemotherapy, endocrine therapy, targeted therapy); pathologic tumor size; histologic type; TNM stage; T stage; N stage; lymphovascular invasion (LVI); invasion of nerves; associated ductal carcinoma in situ (DCIS); and status of estrogen receptor (ER), progesterone receptor (PR), human epidermal growth factor receptor 2 (HER2), and Ki-67, which were assessed by immunohistochemistry (IHC) and fluorescence in situ hybridization (FISH). ER/PR was defined as positive if nuclear staining was present in ≥1% cells (13). The HER2 status was scored as 0, 1+, 2+, or 3+. Scores 0 and 1+ were defined as negative, and score 3+ as positive. Score 2+ was considered indeterminate and was further confirmed with FISH (14). According to results of IHC and FISH, tumors were categorized into the following four subtypes: luminal A, luminal B, HER2-enriched and triple-negative (15). The targeted therapy was anti-HER2 therapy using trastuzumab. The American Joint Committee on Cancer TNM Staging Manual, 7th edition (16), was used for tumor stage.
Follow-Up
DFS was considered as the end point of the present study, which was defined as the interval time between the surgery and recurrence or breast cancer-related death, whichever came first. Recurrence means locoregional recurrence, distant metastasis, or contralateral breast cancer (17). Physical examination, histopathology, and imaging modalities such as US, computed tomography, MRI were used to demonstrated the recurrence. At the last follow-up, patients without an event and/or died of non-breast cancer related events were censored; two patients died from cardiovascular disease in this study.
Imaging Acquisition, Radiomics Analysis and Radiomics Signature Construction
Figure S2 shows the radiomics workflow. US images were collected in different machines (Table S1) and exported from the data system of our hospital. Radiologist 1 (6 years’ experience) selected one greyscale image with the largest cross-section for every breast tumor, and drew a single region-of-interest (ROI) along the tumor margin by Photoshop software (Figure S3). Then, the ROIs were validated by radiologist 2 (10 years’ experience). The radiologists did not know the results of pathology. For multifocal (MF) or multicentric (MC) disease (18), we chose the largest tumor to analysis. After the ROIs were defined, radiomics features which could be divided into four categories, including first-order statistics features, two-dimensional (2D) shape-based features, texture features, and wavelet features, were extracted using the “PyRadiomics” package in Python software (19). Then, a two-step feature selection method which comprised by Sperman correlation coefficients and Ward linkage method, and least absolute shrinkage and selection operator (LASSO) Cox method were performed (20, 21). Finally, a radiomics signature was constructed, and a radiomics score (Rad-score) was calculated at the same time. In the supplementary materials, there are more details.
The intra-observer agreement of feature extraction was evaluated by inter-class correlation coefficient (ICC). We randomly selected 95 patients and redrew ROIs by radiologist 1 one month later after the first ROI segmentation. An ICC >0.75 indicated a good reproducibility.
Validation of Radiomics Signature
In order to assess the association of the radiomics signature with DFS, patients were divided into a high risk and a low risk groups using the cutoff of the Rad-score identified by X-tile (22). We performed Kaplan–Meier survival analysis to analyze DFS between these two groups and the differences of survival curves were determined by Log-rank tests. We also assessed the association of the single selected feature with DFS by the same way. Then, distribution of Rad-score and DFS along with the selected features’ expression were assessed. Stratified analyses were performed using subgroups within the molecular subtype and categorical clinicopathological variables.
The univariate Cox proportional hazards model was used to analyze the effects of the clinicopathological variables and radiomics signature on DFS. Then, the most useful predictors were selected using multivariate Cox proportional hazards model by including clinicopathological variables in a step-wise (forward and backward) manner based on the Bayesian information criterion (BIC). Finally, the radiomics signature was integrated into a multivariable Cox proportional hazards model to evaluate its performance in DFS prediction.
All the above analyses were first performed in the training cohort, and then validated in the validation cohort, except for the stratified analyses which were performed in the whole cohort.
The Additional Value of Radiomics Signature for DFS Prediction
In order to evaluate the additional value of the radiomics signature for DFS prediction, a radiomics nomogram containing the radiomics signature and clinicopathological predictors was constructed and compared with a clinicopathological nomogram containing only the clinicopathological predictors. The performance of the nomogram was assessed in the following four aspects: (1) discrimination, it was evaluated by Harrell’s concordance index (C-index) (23); (2) calibration curves, they were generated to compare the predicted vs. actual survival; (3) reclassification, the improvement of usefulness added by the radiomics signature was quantified by net reclassification improvement (NRI) (24); (4) clinical usefulness, it was determined by decision curve analysis (DCA) (25). In addition, the goodness-of-fit of all the models were assessed by the likelihood ratio test and BIC.
Subgroup Analyses Based on Ultrasound Machines
To investigate whether different sonographic platforms affect the performance of radiomics signature for DFS prediction, we repeated Kaplan–Meier survival analysis in patients examined at GE healthcare and Mindray US systems, which were the most frequently used machines in this study.
Statistical Analysis
Python software (Python Language Reference, version 3.6.9. Available at http://www.python.org) and R statistical software (version 4.0.0; R Foundation for Statistical Computing, Vienna, Austria) were used for all the statistical analyses. Chi-squared or Fisher’s exact test and Mann–Whitney U test were used to assess differences in distributions for categorical variables and continuous variables, respectively. The “lifelines” package was used for Kaplan–Meier survival analysis, log-rank test, and Cox regression. The “rms” package was used for the nomogram construction and calibration. NRI was calculated by “survIDINRI” package. The “rmda” package was used for DCA. A bilateral P value < 0.05 was considered significant.
Results
DFS and Clinicopathological Characteristics
The median period of follow-up was 48.99 (interquartile range [IQR], 44.42–62.98) months. Events occurred in 80 patients (80/620, 12.90%), including: 40 distant metastases; 17 locoregional recurrences; 12 locoregional recurrences and distant metastases; seven contralateral breast cancer (six invasive breast cancer and one DCIS); and four breast cancer-related death. The median DFS was 22.29 (IQR, 14.52–33.84) months. The comparison of the clinicopathological characteristics in the training and validation cohorts showed no significantly differences (Table 1).
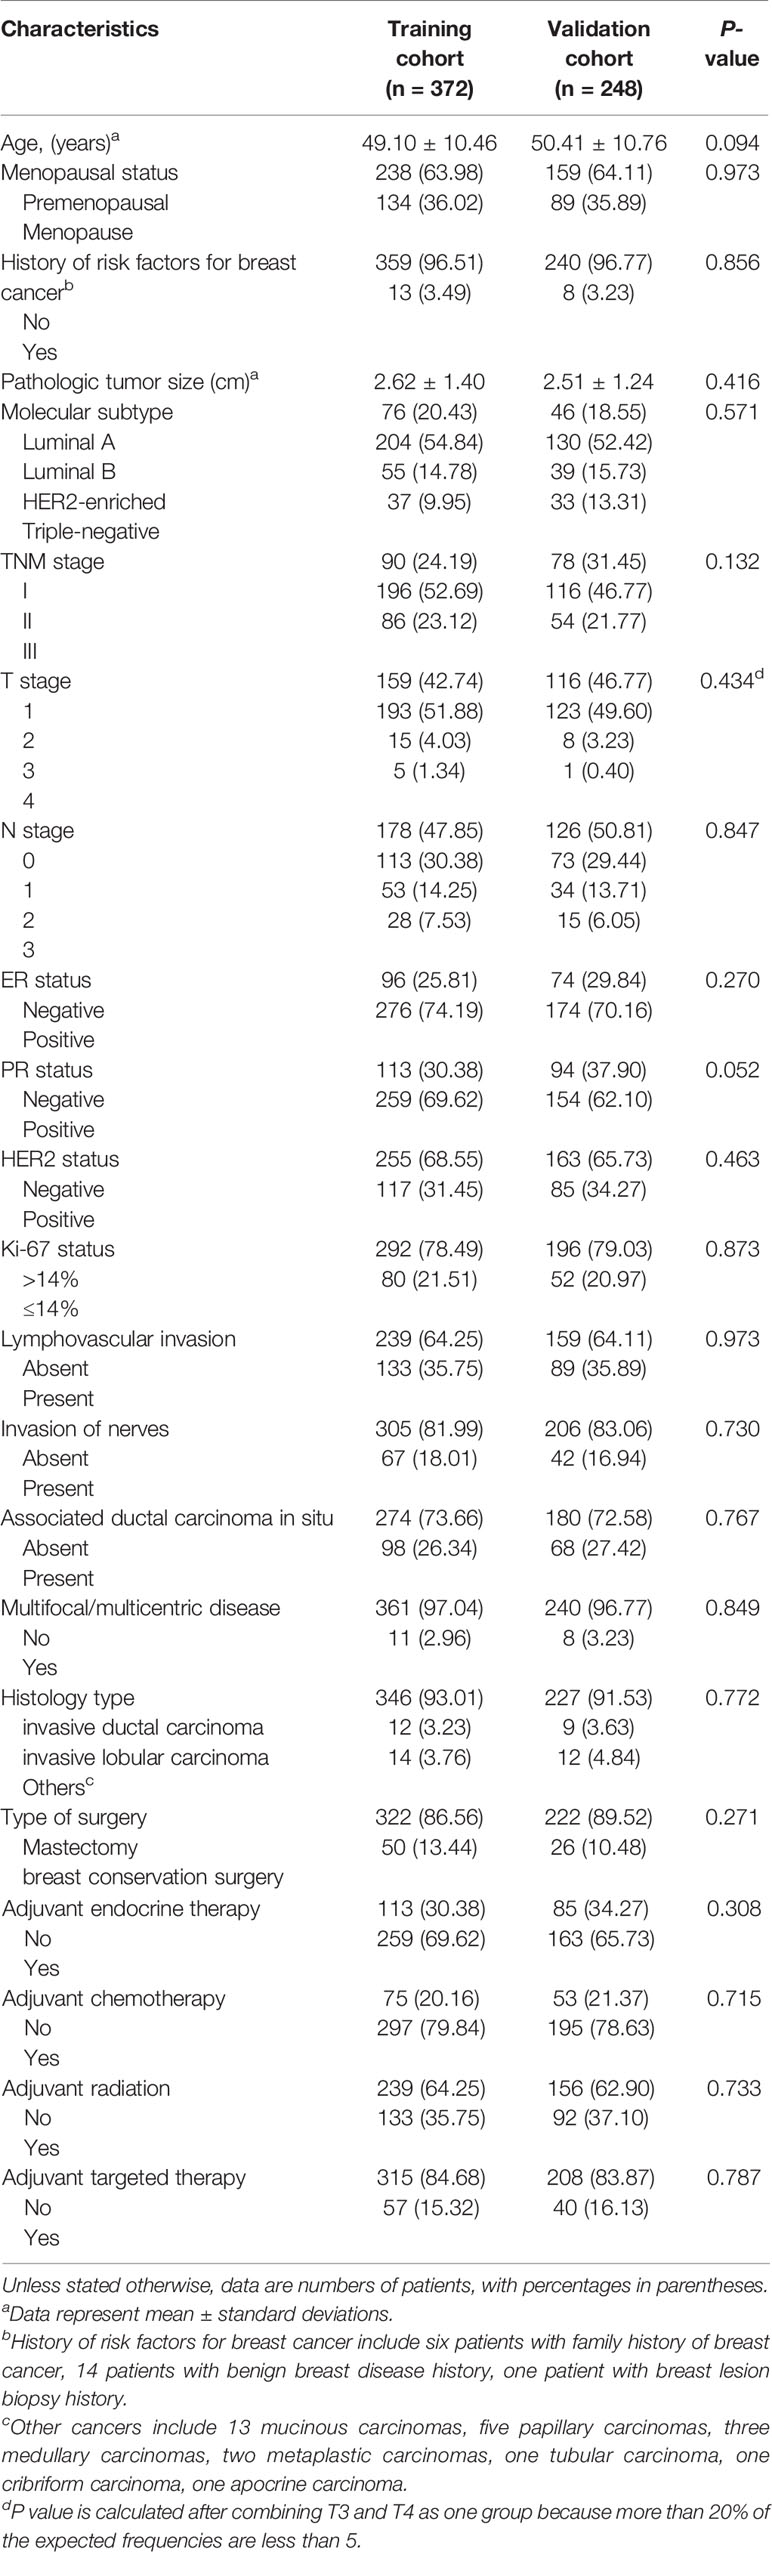
Table 1 Characteristics of patients in the training and validation cohorts.
The Radiomics Signature Construction and Validation
The mean ICC based on twice feature extraction was 0.824 (range, 0.798–0.999), which means the high intra-observer agreement for the radiomics feature extraction. Thence, all findings were based on the first feature extraction.
Totally, 14 features were selected from 1209 features to build radiomics signature in the training cohort (Table S2 and Figure S4) and only one of them could distinguish patients with different prognoses (Figures S5, S6). The radiomics signature showed moderate performance on DFS estimation both in the training (C-index, 0.714; 95% confidence interval [CI], 0.63–0.80) and validation (C-index, 0.632; 95% CI, 0.52–0.74) cohorts. Based on the cutoff (1.816) of Rad-score (Figure S7), patients with higher Rad-score (≥1.816) were divided into the high-risk group, whereas patients with lower Rad-score (<1.816) were divided into the low-risk group, and their characteristics are shown in Table 2.
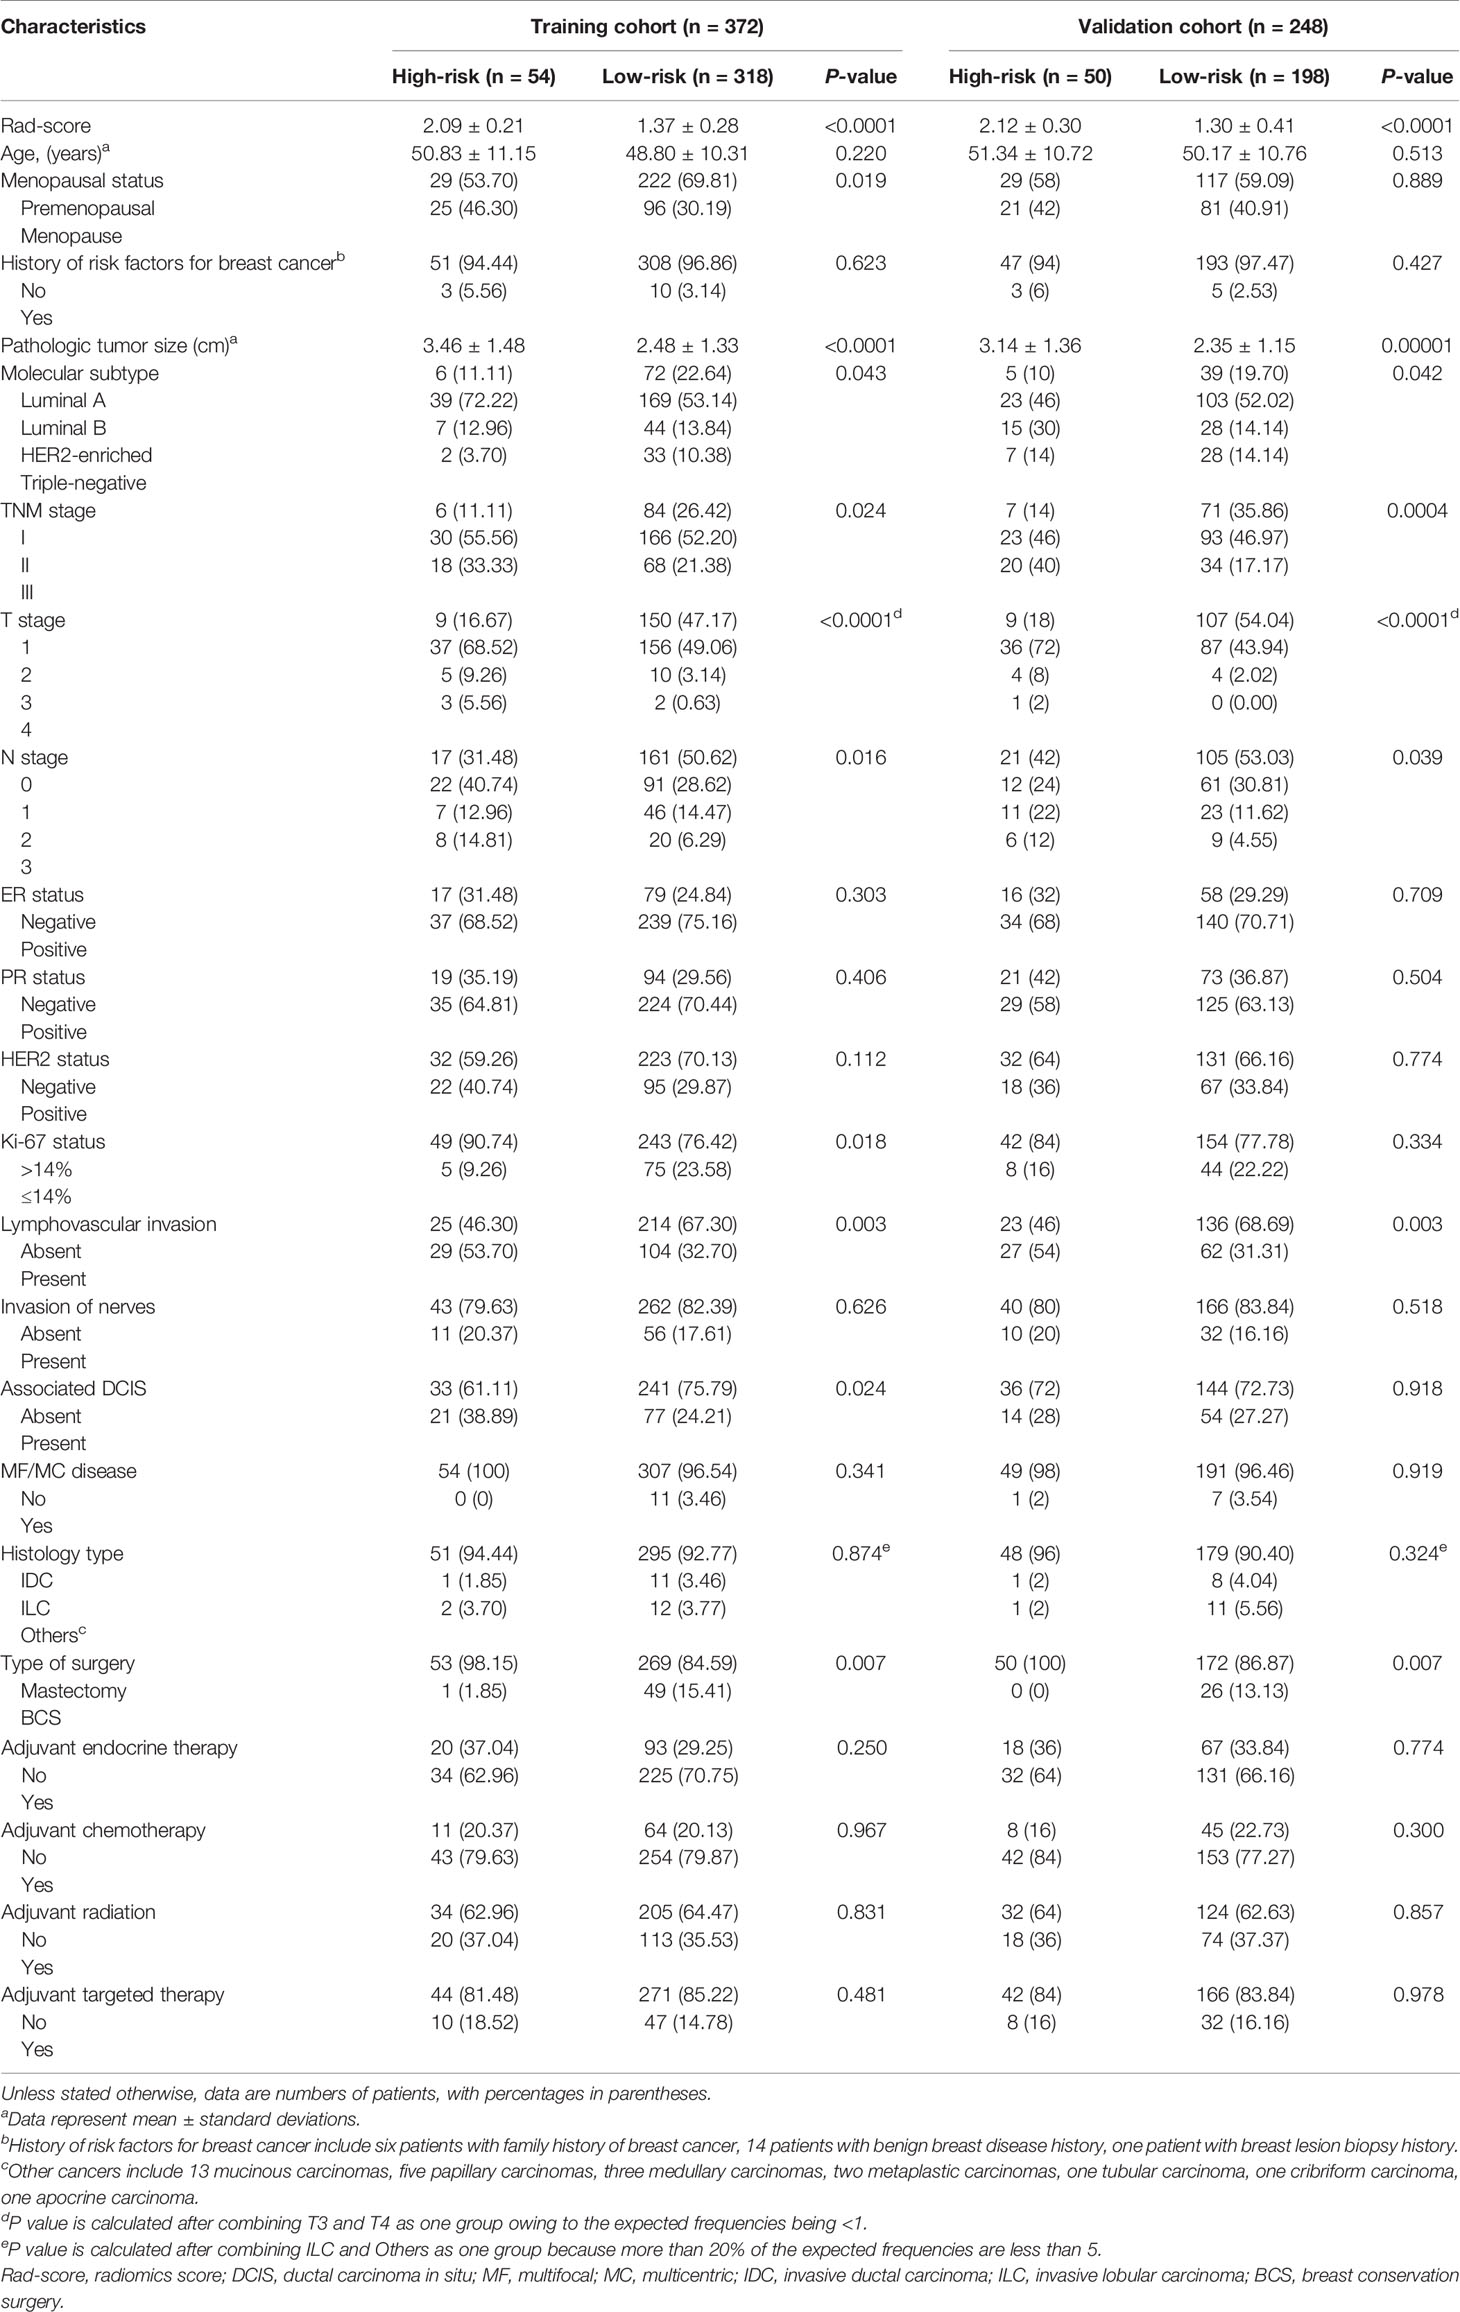
Table 2 Characteristics of patients according to the risk group based on radiomics signature in the training and validation cohorts.
The Rad-score prognostic accuracy determined by time-dependent receiver operator characteristics (ROC) curves and Kaplan–Meier survival curves are shown in Figure 1. The radiomics signature was significantly associated with DFS in the training (P < 0.0001) and validation (P = 0.003) cohorts. The 5-year DFS of the high- and low-risk groups were 61.27% and 90.10% in the training cohort and 76.60 and 87.07% in the validation cohort, respectively. The distribution of the Rad-score and DFS are shown in Figures S8–S9, patients with higher Rad-score were more likely to experience events.
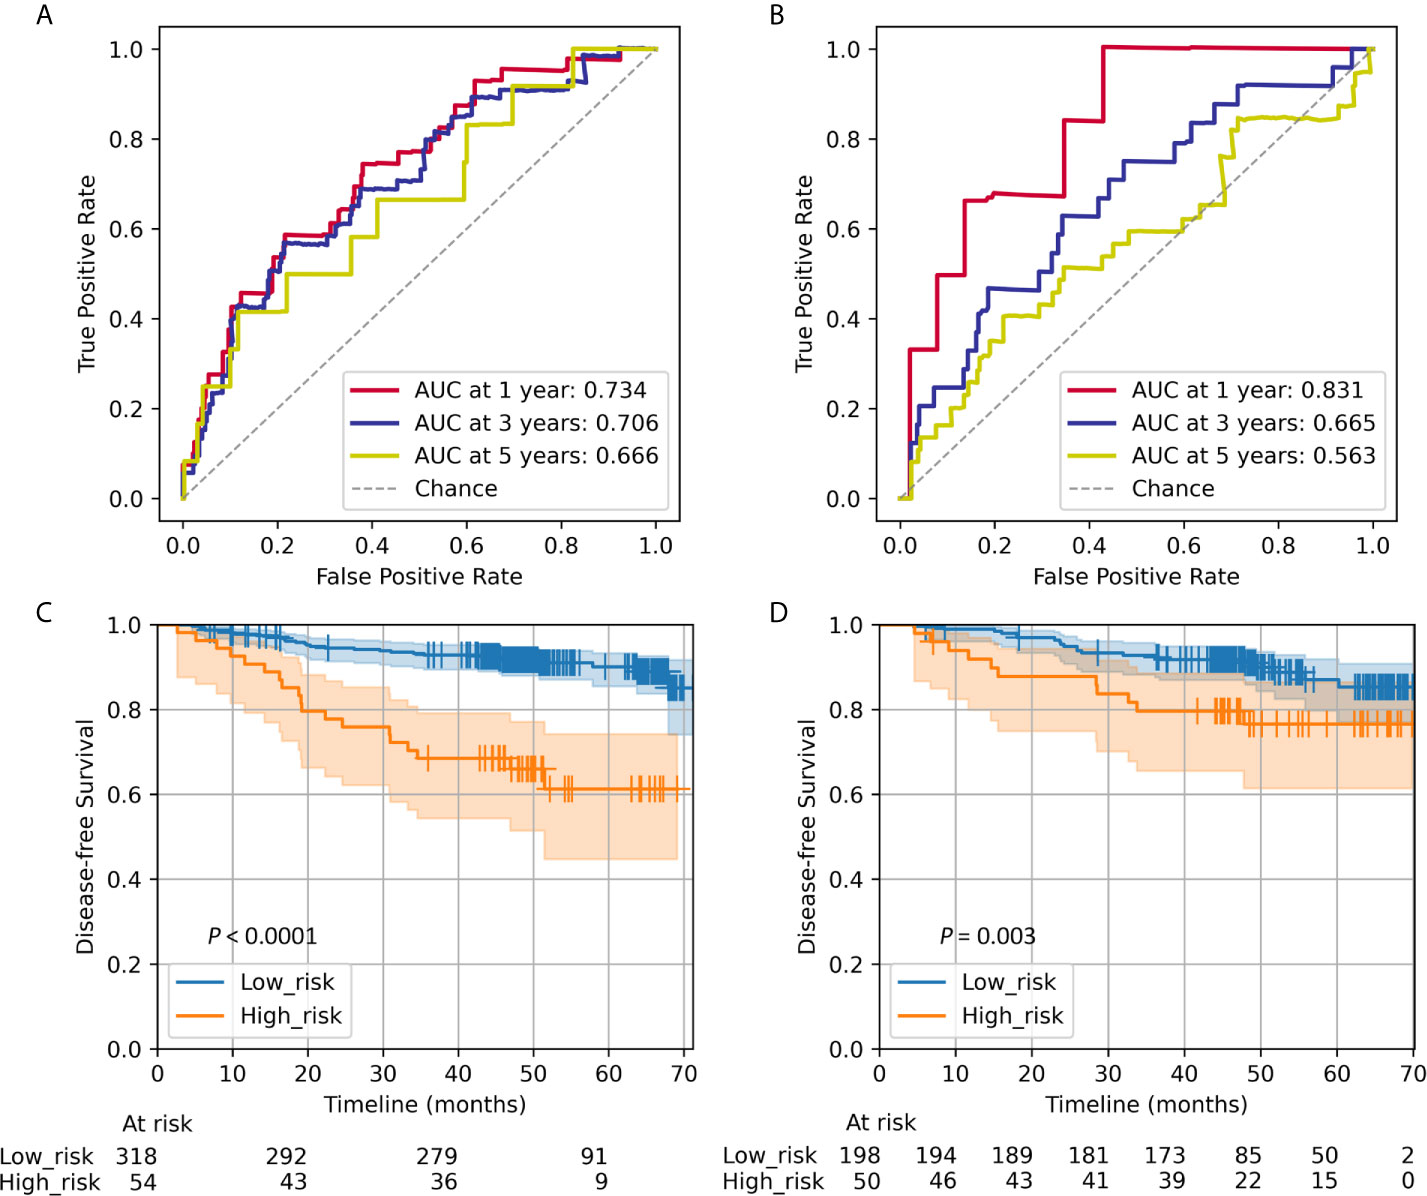
Figure 1 Radiomics score measured by time-dependent ROC curves and Kaplan–Meier survival curves in the training and validation cohorts. We used AUCs at 1, 3, and 5 years to assess prognostic accuracy in the training (A) and validation (B) cohorts. A significant association of the Rad-score with DFS was shown in the training (C) and validation (D) cohorts. We calculated P values using the log-rank test. Data are the AUC or P-value. ROC, receiver operator characteristics; AUC, area under the curve; DFS, disease-free survival.
Results of stratified analysis based on molecular subtype are shown in Figure 2. The Rad-score successfully discriminate prognoses in luminal B (P = 0.00006) and triple-negative (P = 0.00003), but failed in either luminal A (P = 0.563) or HER2-enriched (P = 0.109). The radiomics signature remained a statistically and clinically predictor in most subgroups based on clinicopathological variables (Figure S10).
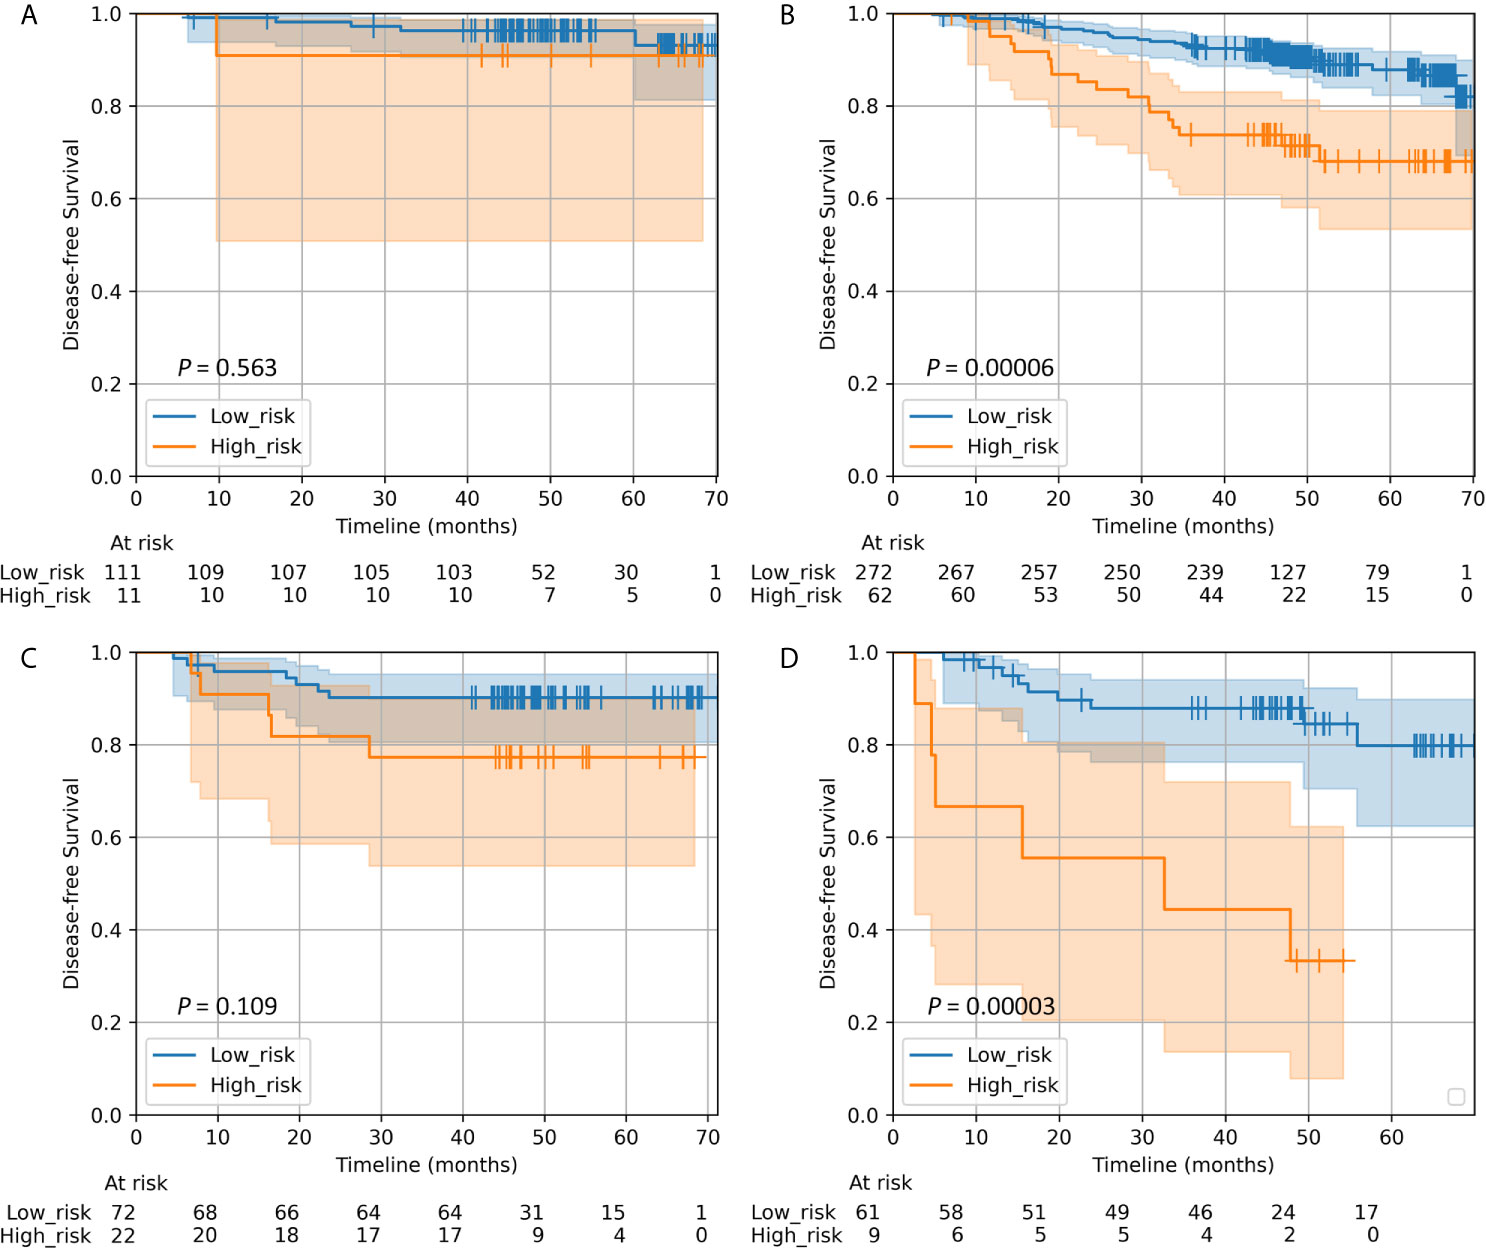
Figure 2 Kaplan–Meier survival curves of DFS according to the Rad-score classifier in subgroups within molecular subtypes of patients with invasive breast cancer in the whole cohort. (A) Luminal A (n = 122). (B) Luminal B (n = 334). (C) HER2-enriched (n = 94). (D) Triple-negative (n = 70). We calculated P values using the log-rank test. DFS, disease-free survival; Rad-score, radiomics score.
Both in the univariate (Table S3) and multivariable analyses (Table 3), the Rad-score was an independent predictor for DFS.
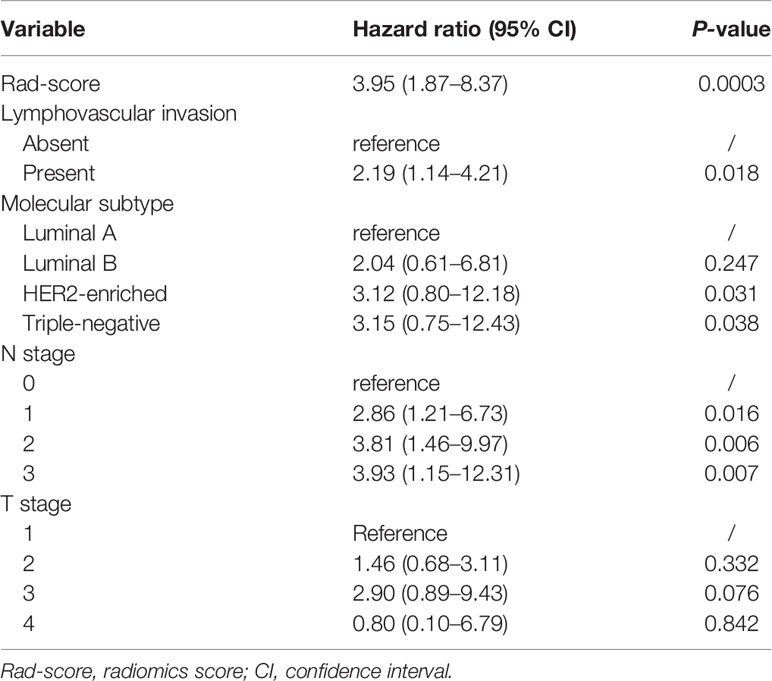
Table 3 Multivariate analysis of DFS in the training cohort.
The Additional Value of Radiomics Signature for DFS Prediction
The estimation of the radiomics nomogram achieved a better agreement with actual observation than that of the clinicopathological nomogram (Figure 3). The radiomics nomogram yielded the highest C-index (0.801 and 0.796 in the training and validation cohorts, respectively), the highest log likelihood (−241.70), and the lowest BIC (502.75) (Table 4). Including the radiomics signature to the clinicopathological nomogram resulted improvement of classification accuracy for survival outcomes, with a total NRI of 0.147 in the validation cohort for 5-year DFS estimation (Table S4). Finally, the results of DCA demonstrated that the radiomics nomogram was superior than the clinicopathological nomogram in terms of clinical usefulness both in the training and validation cohorts (Figure 4).
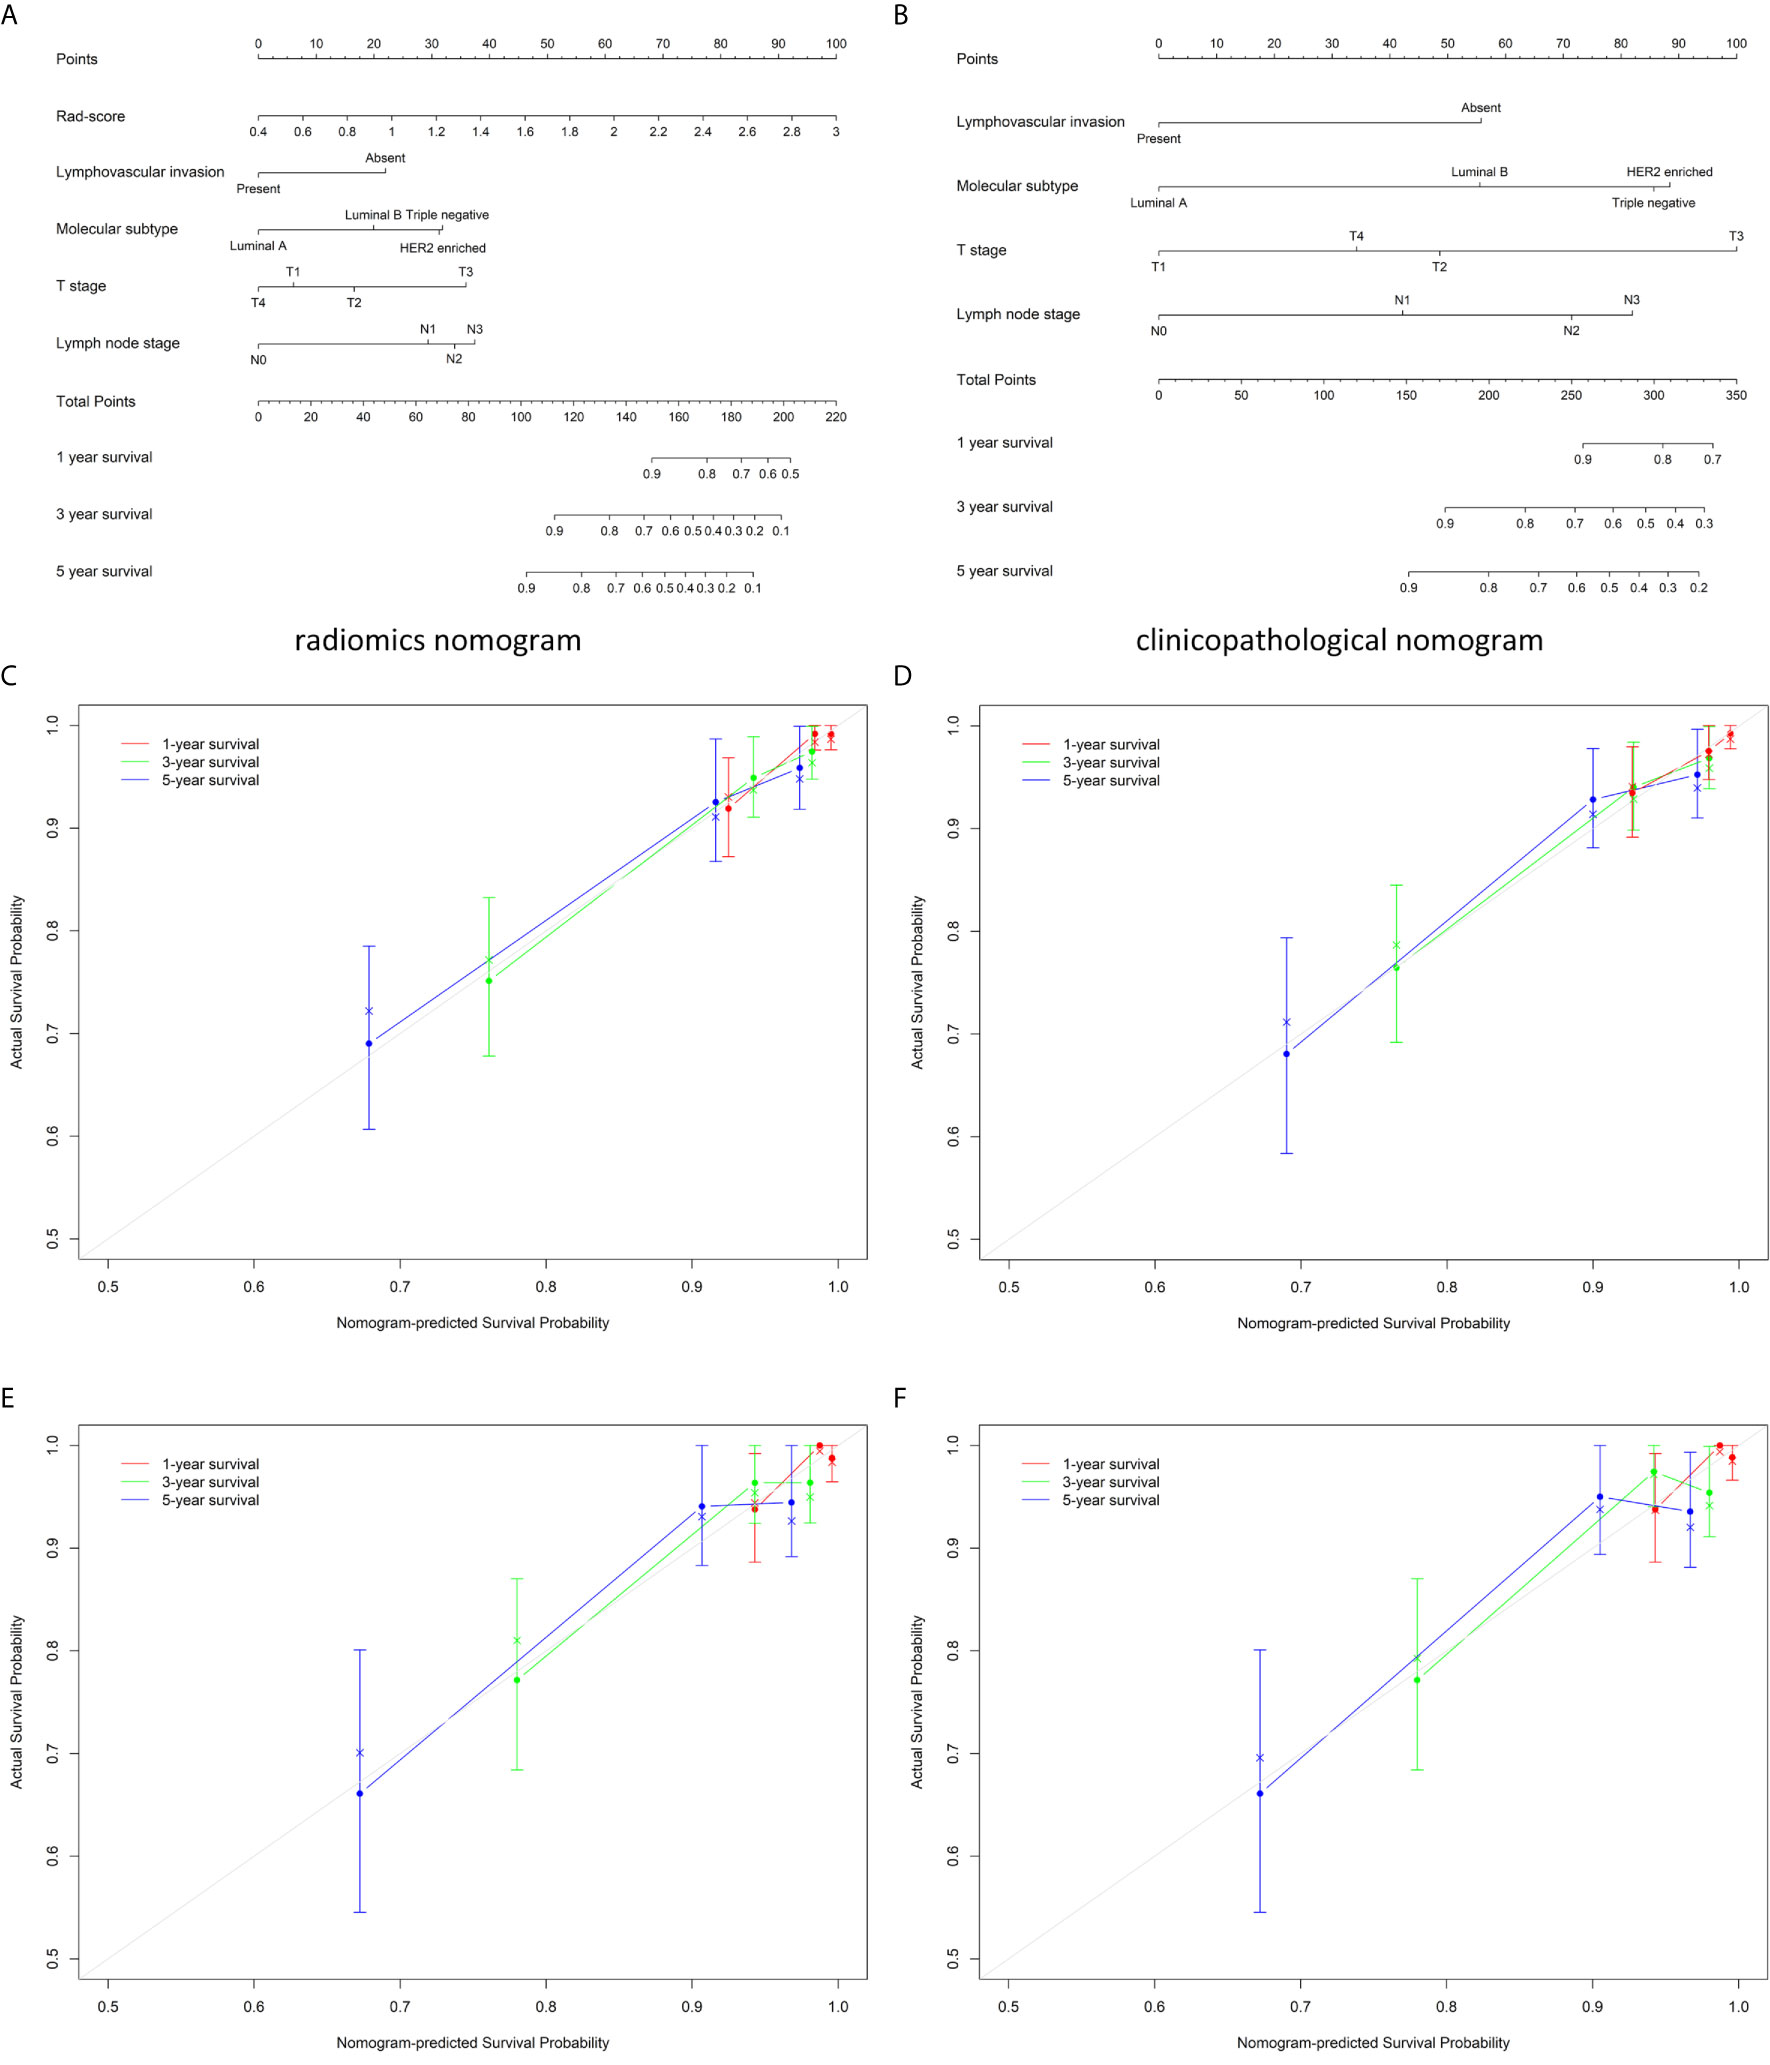
Figure 3 The developed radiomics nomogram (A) and clinicopathological nomogram (B) for DFS prediction in patients with invasive breast cancer, along with the calibration curves of these nomograms. The patient’s Rad-score is located on the Rad-score axis. To determine the number of points toward the probability of DFS the patient receives for her Rad-score, a line was drawn straight upward to the point axis, and this process was repeated for each variable. The points achieved for each of the risk factors was then summed. The final sum is located on the total point axis. To find the patient’s probability of DFS, a line was drawn straight down. Calibration curves of the radiomics nomogram in the training (C) and validation (E) cohorts, and those of the clinicopathological nomogram in the training (D) and validation (F) cohorts show the calibration of each model in terms of the agreement between the estimated and observed at 1-, 3-, and 5-year outcomes. Nomogram-estimated probability is plotted on the x-axis, and the actual survival probability is plotted on the y-axis. The diagonal gray line represents a perfect estimation by an ideal model, in which the estimated outcome perfectly corresponds to the actual outcome. The colored line represents the nomogram’s performance, a closer alignment of which with the diagonal dotted line represents a better estimation. DFS, disease-free survival; Rad-score, radiomics score.
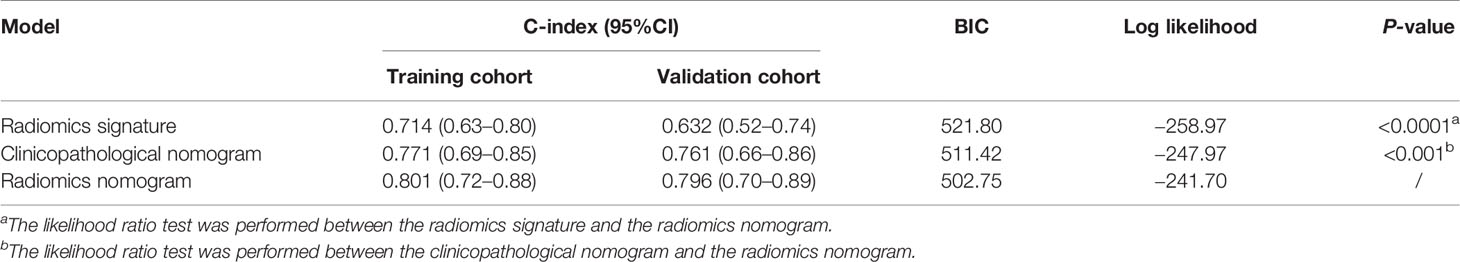
Table 4 Performance of models.
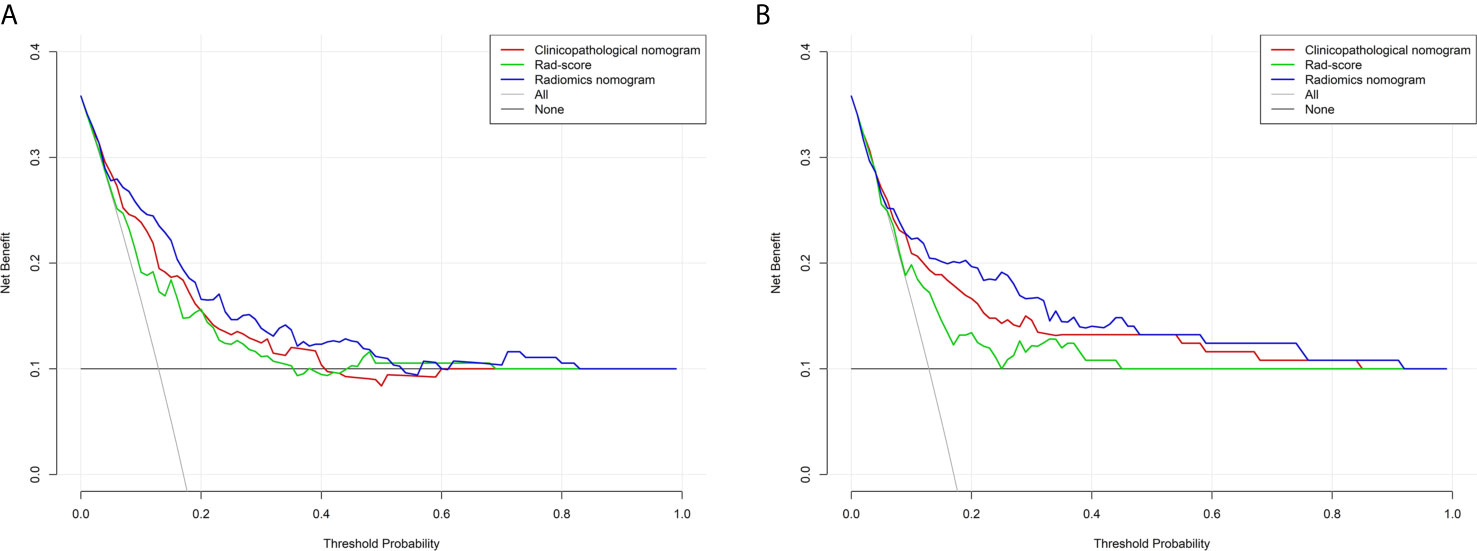
Figure 4 Decision curve analysis for each model in the training (A) and validation (B) cohorts. The y-axis measures the net benefit. The net benefit was calculated by summing the benefits (true positive results) and subtracting the harms (false positive results), weighing the latter by a factor related to the relative harm of an undetected cancer compared with the harm of unnecessary treatment. The radiomics model had the highest net benefit and simple strategies such as follow-up of all patients (gray line) or no patients (horizontal black line) across the full range of threshold probabilities at which a patient would choose to undergo imaging follow-up.
Subgroup Analyses Based on Ultrasound Machines
As shown in Figure S11, higher Rad-scores were significantly associated with worse DFS in the GE subgroup (P = 0.0001), but not in the Mindray subgroup (P = 0.055). Patients with higher Rad-scores experienced worse DFS than patients with lower Rad-scores in both the subgroups. Based on the cutoff (1.816) of the Rad-score, these patient characteristics based on risk group are shown in Table S5.
Discussion
To our knowledge, this study has developed the first US radiomics features for DFS prediction of invasive breast cancer. We showed that the US radiomics signature was an independent factor in predicting DFS and confirmed its additional value added to the clinicopathological predictors.
The present radiomics signature comprised 14 features, including two 2D shape-based features, seven texture features, and five wavelet features. On the one hand, shape-based features reflect the shape and morphology of the tumor. Being consistent with a previous study which selected surface to volume ratio (SVR) to estimate breast cancer DFS (17), we selected PerimeterSurfaceRatio feature (the 2D form of SVR) as one of the 14 features. On the other hand, texture analysis is a suitable way to assess tumor heterogeneity (26), and different texture features are defined differently to depict specific aspects of tumor textural heterogeneity and thus may provide complementary information of tumor characteristics. Most texture and wavelet features selected in the present study could describe characteristics of breast cancer in previous study (12). Thus, the multiple-feature-based radiomics signature constructed in our study could likely be an important prognostic factor with the information of tumor heterogeneity.
In the following analyses, the radiomics signature showed moderate performance on DFS prediction and successfully stratified patients into different groups according to the results of risk stratification, though there was only one selected feature could stratify the risk of DFS. These findings were similar to a previous study of lung cancer which demonstrated that no individual feature could classify patients at different risk of recurrence, except for radiomics signature (27). Therefore, the radiomics signature, taking the interactions between different features into account, could better reflect the heterogeneity of tumor and is thus related to the outcome of patient, improving the accuracy of DFS assessment.
In the subsequently univariate, multivariate, and stratified analyses, the present US radiomics signature was an independent predictor, indicating the strong association between the radiomics signature and DFS. Patients at high-risk group experienced worse DFS than those at low-risk group, implying that patients at high risk of DFS might need more intensive treatment and follow-up to improve DFS, whereas treatment for low-risk patients could be attenuated appropriately. Consequently, our results would provide valuable information for clinicians to develop personalized treatment accurately based on the specific clinicopathological factors and radiomics signature for invasive breast cancer.
The Kaplan-Meier analyses performed by molecular subtype showed that only differences of DFS in luminal B and triple-negative subgroups were statistically significant. This suggested that the ability of radiomics signature to assess DFS for invasive breast cancer vary by molecular subtype, which was similar to an earlier MRI-based study (28). This also highlighted the fact that breast cancer is a heterogeneous tumor wherein every subtype has its unique characteristics and prognosis. Perhaps a specific radiomics signature for each molecular subtype would predict DFS better in invasive breast cancer and hence, further studies are needed to confirm this speculation.
Furthermore, we confirmed the additional value of radiomics signature to the clinicopathological predictors for DFS prediction. The single predictor is not enough to assess the probability of prognosis, whereas nomogram has the ability to integrate multiple factors. We constructed a radiomics nomogram in a step-wise manner based on BIC, achieving better performance compared to the clinicopathological nomogram, with a better calibration, positive NRI and higher C-index. Finally, the radiomics nomogram performed better than the clinicopathological nomogram in term of clinical usefulness, which confirmed the additional value of the radiomics signature for personalized DFS prediction in patients with invasive breast cancer simultaneously.
Finally, we analyzed whether different sonographic platforms affect the performance of radiomics signature and radiomics signature showed significant only in the GE subgroup. We think this may be related to small sample size of the Mindray subgroup (n = 121). Small sample size generally affects the performance of radiomics study (29). Taking small sample size into consideration, radiomics signature shows significant association with DFS in the Mindray subgroup when relax the significant P value to 0.1. Furthermore, the significant clinicopathological variables (tumor size, T stage, N stage, TNM stage and LVI) showed consistent in the GE and Mindray subgroups according to risk group based on radiomics signature. However, the probability of the dependency of radiomics signature on the type of US machine could not be entirely rule out and further studies with larger data are needed to reveal the truth of this problem.
Our study has some limitations. First, we could not control the operator dependency or scanning parameters in collecting US images, which is an inevitable issue. So, we used Z-score normalization to minimize the influence of contrast and brightness variation before feature extraction for each patient. Second, radiomics signature showed dependency on the type of US machine in present study. Third, this study had a relatively short follow-up period (median follow-up, 48.99 months) and no independent validation. Thus, further studies with a longer follow-up, independent data and larger sample size are needed to resolve these issues.
In summary, the US radiomics signature is a potential imaging predictor for risk stratification of DFS, the radiomics nomogram holds promise to serve as a noninvasive tool to assist clinicians in accurately developing personalized treatment for patients with invasive breast cancer.
Data Availability Statement
The raw data supporting the conclusions of this article will be made available by the authors, without undue reservation.
Ethics Statement
This study has obtained the ethical approval from the institutional review board of Sun Yat-Sen University Cancer Center.
Author Contributions
LozL and LiL: guarantor of the article. LozL, LiL, LX, HC, and XT: conception and design. LX, HC, XT, BC, XJ, and LizL: collection and assembly of data. LX, HC, XT, and YF: data analysis and interpretation. All authors contributed to the article and approved the submitted version.
Funding
We acknowledge support from the Science and Technology Planning Project of Guangdong Province (2017B020226004), the Science and Technology Program of Guangzhou (201807010057, 201907010043), and the Health and Medical Collaborative Innovation Project of Guangzhou (201803010021), and the Youth Fund Project of Guangdong Basic and Applied Basic Research Fund Regional Joint Fund (2020A1515110939).
Conflict of Interest
The authors declare that the research was conducted in the absence of any commercial or financial relationships that could be construed as a potential conflict of interest.
Supplementary Material
The Supplementary Material for this article can be found online at: https://www.frontiersin.org/articles/10.3389/fonc.2021.621993/full#supplementary-material.
References
1. Ferlay J, Colombet M, Soerjomataram I, Mathers C, Parkin DM, Piñeros M, et al. Estimating the Global Cancer Incidence and Mortality in 2018: GLOBOCAN Sources and Methods. Int J Cancer (2019) 144:1941–53. doi: 10.1002/ijc.31937
2. Wang X, Wang N, Zhong L, Wang S, Zheng Y, Yang B, et al. Prognostic Value of Depression and Anxiety on Breast Cancer Recurrence and Mortality: A Systematic Review and Meta-Analysis of 282,203 Patients. Mol Psychiatry (2020) 25:3186–97. doi: 10.1038/s41380-020-00865-6
3. Goss PE, Ingle JN, Pritchard KI, Robert NJ, Muss H, Gralow J, et al. Extending Aromatase-Inhibitor Adjuvant Therapy to 10 Years. N Engl J Med (2016) 375:209–19. doi: 10.1056/NEJMoa1604700
4. Phung MT, Tin Tin S, Elwood JM. Prognostic Models for Breast Cancer: A Systematic Review. BMC Cancer (2019) 19:230. doi: 10.1186/s12885-019-5442-6
5. Syed YY. Oncotype DX Breast Recurrence Score®: A Review of its Use in Early-Stage Breast Cancer. Mol Diagn Ther (2020) 24:621–32. doi: 10.1007/s40291-020-00482-7
6. Reig B, Heacock L, Geras KJ, Moy L. Machine Learning in Breast MRI. J Magn Reson Imaging (2020) 52:998–1018. doi: 10.1002/jmri.26852
7. Li H, Zhu Y, Burnside ES, Drukker K, Hoadley KA, Fan C, et al. Mr Imaging Radiomics Signatures for Predicting the Risk of Breast Cancer Recurrence as Given by Research Versions of MammaPrint, Oncotype DX, and PAM50 Gene Assays. Radiology (2016) 281:382–91. doi: 10.1148/radiol.2016152110
8. Huang SY, Franc BL, Harnish RJ, Liu G, Mitra D, Copeland TP, et al. Exploration of PET and MRI Radiomic Features for Decoding Breast Cancer Phenotypes and Prognosis. NPJ Breast Cancer (2018) 16:4:24. doi: 10.1038/s41523-018-0078-2
9. Chitalia RD, Rowland J, McDonald ES, Pantalone L, Cohen EA, Gastounioti A, et al. Imaging Phenotypes of Breast Cancer Heterogeneity in Preoperative Breast Dynamic Contrast Enhanced Magnetic Resonance Imaging (Dce-Mri) Scans Predict 10-Year Recurrence. Clin Cancer Res (2020) 26:862–9. doi: 10.1158/1078-0432.CCR-18-4067
10. Youk JH, Kwak JY, Lee E, Son EJ, Kim JA. Grayscale Ultrasound Radiomic Features and Shear-Wave Elastography Radiomic Features in Benign and Malignant Breast Masses. Ultraschall Med (2020) 41:390–6. doi: 10.1055/a-0917-6825
11. Yu FH, Wang JX, Ye XH, Deng J, Hang J, Yang B. Ultrasound-Based Radiomics Nomogram: A Potential Biomarker to Predict Axillary Lymph Node Metastasis in Early-Stage Invasive Breast Cancer. Eur J Radiol (2019) 119:108658. doi: 10.1016/j.ejrad.2019.108658
12. Guo Y, Hu Y, Qiao M, Wang Y, Yu J, Li J, et al. Radiomics Analysis on Ultrasound for Prediction of Biologic Behavior in Breast Invasive Ductal Carcinoma. Clin Breast Cancer (2018) 18:e335–44. doi: 10.1016/j.clbc.2017.08.002
13. Hammond ME, Hayes DF, Dowcohortt M, Allred DC, Hagerty KL, Badve S, et al. American Society of Clinical Oncology/College of American Pathologists Guideline Recommendations for Immunohistochemical Testing of Estrogen and Progesterone Receptors in Breast Cancer (Unabridged Version). Arch Pathol Lab Med (2010) 134:e48–72. doi: 10.1043/1543-2165-134.7.e48
14. Wolff AC, Hammond ME, Hicks DG, Dowcohortt M, McShane LM, Allison KH, et al. Recommendations for Human Epidermal Growth Factor Receptor 2 Testing in Breast Cancer: American Society of Clinical Oncology/College of American Pathologists Clinical Practice Guideline Update. Arch Pathol Lab Med (2014) 138:241–56. doi: 10.5858/arpa.2013-0953-SA
15. Goldhirsch A, Wood WC, Coates AS, Gelber RD, Thürlimann B, Senn HJ. Panel Members. Strategies for Subtypes–Dealing With the Diversity of Breast Cancer: Highlights of the St. Gallen International Expert Consensus on the Primary Therapy of Early Breast Cancer 2011. Ann Oncol (2011) 22:1736–47. doi: 10.1093/annonc/mdr304
16. Edge SB, Compton CC. The American Joint Committee on Cancer: The 7th Edition of the AJCC Cancer Staging Manual and the Future of TNM. Ann Surg Oncol (2010) 17:1471–4. doi: 10.1245/s10434-010-0985-4
17. Park H, Lim Y, Ko ES, Cho HH, Lee JE, Han BK, et al. Radiomics Signature on Magnetic Resonance Imaging: Association With Disease-Free Survival in Patients With Invasive Breast Cancer. Clin Cancer Res (2018) 24:4705–14. doi: 10.1158/1078-0432.CCR-17-3783
18. Lynch SP, Lei X, Hsu L, Meric-Bernstam F, Buchholz TA, Zhang H, et al. Breast Cancer Multifocality and Multicentricity and Locoregional Recurrence. Oncologist (2013) 18:1167–73. doi: 10.1634/theoncologist.2013-0167
19. van Griethuysen JJM, Fedorov A, Parmar C, Hosny A, Aucoin N, Narayan V, et al. Computational Radiomics System to Decode the Radiographic Phenotype. Cancer Res (2017) 77:e104–7. doi: 10.1158/0008-5472.CAN-17-0339
20. Tibshirani R. The Lasso Method for Variable Selection in the Cox Model. Stat Med (1997) 16:385–95. doi: 10.1002/(sici)1097-0258(19970228)16:4<385::aid-sim380>3.0.co;2-3
21. Gui J, Li H. Penalized Cox Regression Analysis in the High-Dimensional and Low-Sample Size Settings, With Applications to Microarray Gene Expression Data. Bioinformatics (2005) 21:3001–8. doi: 10.1093/bioinformatics/bti422
22. Camp RL, Dolled-Filhart M, Rimm DL. X-Tile: A New Bio-Informatics Tool for Biomarker Assessment and Outcome-Based Cut-Point Optimization. Clin Cancer Res (2004) 10:7252–9. doi: 10.1158/1078-0432.CCR-04-0713
23. Gonen M, Heller G. Concordance Probability and Discriminatory Power in Proportional Hazards Regression. Biometrika (2005) 92:965–70. doi: 10.1093/biomet/92.4.965
24. Pencina MJ, D’Agostino RB, Steyerberg EW. Extensions of Net Reclassification Improvement Calculations to Measure Usefulness of New Biomarkers. Stat Med (2011) 30:11–21. doi: 10.1002/sim.4085
25. Vickers AJ, Elkin EB. Decision Curve Analysis: A Novel Method for Evaluating Prediction Models. Med Decis Making (2006) 26:565–74. doi: 10.1177/0272989X06295361
26. Davnall F, Yip CS, Ljungqvist G, Selmi M, Ng F, Sanghera B, et al. Assessment of Tumor Heterogeneity: An Emerging Imaging Tool for Clinical Practice? Insights Imaging (2012) 3:573–89. doi: 10.1007/s13244-012-0196-6
27. Huang Y, Liu Z, He L, Chen X, Pan D, Ma Z, et al. Radiomics Signature: A Potential Biomarker for the Prediction of Disease-Free Survival in Early-Stage (I or II) non-Small Cell Lung Cancer. Radiology (2016) 281:947–57. doi: 10.1148/radiol.2016152234
28. Drukker K, Li H, Antropova N, Edwards A, Papaioannou J, Giger ML. Most-Enhancing Tumor Volume by MRI Radiomics Predicts Recurrence-Free Survival “Early on” in Neoadjuvant Treatment of Breast Cancer. Cancer Imaging (2018) 18:12. doi: 10.1186/s40644-018-0145-9
Keywords: breast cancer, radiomics, ultrasound, disease-free survival, nomogram
Citation: Xiong L, Chen H, Tang X, Chen B, Jiang X, Liu L, Feng Y, Liu L and Li L (2021) Ultrasound-Based Radiomics Analysis for Predicting Disease-Free Survival of Invasive Breast Cancer. Front. Oncol. 11:621993. doi: 10.3389/fonc.2021.621993
Received: 27 October 2020; Accepted: 06 April 2021;
Published: 29 April 2021.
Edited by:
Shengtao Zhou, Sichuan University, ChinaReviewed by:
Isabella Castellano, University of Turin, ItalyFa Zhang, Institute of Computing Technology, Chinese Academy of Sciences (CAS), China
Copyright © 2021 Xiong, Chen, Tang, Chen, Jiang, Liu, Feng, Liu and Li. This is an open-access article distributed under the terms of the Creative Commons Attribution License (CC BY). The use, distribution or reproduction in other forums is permitted, provided the original author(s) and the copyright owner(s) are credited and that the original publication in this journal is cited, in accordance with accepted academic practice. No use, distribution or reproduction is permitted which does not comply with these terms.
*Correspondence: Longzhong Liu, bGl1bHpoQHN5c3VjYy5vcmcuY24=; Li Li, bGkyQG1haWwuc3lzdS5lZHUuY24=
†These authors have contributed equally to this work