 Zaoqu Liu1,2,3†
 Yuyuan Zhang1†
 Qin Dang4†Kunpeng Wu1
 Dechao Jiao1Zhen Li1*
 Zhenqiang Sun4*
 Xinwei Han1,2,3*
- 1Department of Interventional Radiology, The First Affiliated Hospital of Zhengzhou University, Zhengzhou, China
- 2Interventional Institute of Zhengzhou University, Zhengzhou, China
- 3Interventional Treatment and Clinical Research Center of Henan Province, Zhengzhou, China
- 4Department of Colorectal Surgery, The First Affiliated Hospital of Zhengzhou University, Zhengzhou, China
Genomic alterations constitute crucial elements of colorectal cancer (CRC). However, a comprehensive understanding of CRC genomic alterations from a global perspective is lacking. In this study, a total of 2,778 patients in 15 public datasets were enrolled. Tissues and clinical information of 30 patients were also collected. We successfully identified two distinct mutation signature clusters (MSC) featured by massive mutations and dominant somatic copy number alterations (SCNA), respectively. MSC-1 was associated with defective DNA mismatch repair, exhibiting more frequent mutations such as ATM, BRAF, and SMAD4. The mutational co-occurrences of BRAF-HMCN and DNAH17-MDN1 as well as the methylation silence event of MLH-1 were only found in MSC-1. MSC-2 was linked to the carcinogenic process of age and tobacco chewing habit, exhibiting dominant SCNA such as MYC (8q24.21) and PTEN (10q23.31) deletion as well as CCND3 (6p21.1) and ERBB2 (17q12) amplification. MSC-1 displayed higher immunogenicity and immune infiltration. MSC-2 had better prognosis and significant stromal activation. Based on the two subtypes, we identified and validated the expression relationship of FAM83A and IDO1 as a robust biomarker for prognosis and distant metastasis of CRC in 15 independent cohorts and qRT-PCR data from 30 samples. These results advance precise treatment and clinical management in CRC.
Introduction
Colorectal cancer (CRC) is the fourth most prevalent cancer and the second most lethal cancer globally (1). Although considerable improvements in surgical techniques and chemoradiotherapy have extended overall survival (OS) for many patients, the mortality of CRC remains high (2). Recently, immunotherapy has made tremendous progress and achieved clinical success in CRC, but only a small proportion of patients benefit (3). Hence, it is imperative to improve individualized treatment and clinical management in CRC.
For decades, the TNM and Dukes classification schemes have been valuable for assessing the prognosis of, and selecting treatment for, CRC patients (4). However, accumulating evidence indicates that CRC patients with the same stage present diverse biological behaviors and clinical outcomes because of high heterogeneity (5). Thus, these conventional criteria fail to meet the needs of precision treatment in CRC. With advances in the molecular biological understanding of CRC, the CRC Subtyping Consortium proposed four consensus molecular subtypes (CMSs) in 2015 (6). The CMS classification can help guide clinical treatment and evaluate prognosis. For example, CMS4, characterized by epithelial–mesenchymal transition (EMT) and primary resistance to anti-EGFR therapy, has a poor prognosis relative to other subtypes, whereas CMS3, linked to metabolic reprogramming and altered cellular metabolism, displays favorable survival (6, 7). Of note, the CMS classification only considers a fraction of genomic variations, such as BRAF, TP53, and KRAS mutations, HNF4A amplification, and homozygous deletion of PTEN, but there is a wide range of genomic variations in CRC (6–13); thus, the genomic variations considered in the CMS classification system cannot fully explain the molecular heterogeneity of CRC, and the CMS classification system might ignore a large number of potential therapeutic targets and genomic drivers. Thus, it is necessary to systematically explore the heterogeneity of CRC based on global genomic variations and further provide references for optimizing targeted treatment of CRC patients.
Currently, 30 mutational signatures, which can be attributed to specific causes of DNA lesions, such as defective DNA repair and exogenous or endogenous mutagen exposure, have been summarized by previous research (14). Regrettably, the mutational signatures of CRC have not been dissected in detail until now. In addition, CRC possesses an extremely high number of genomic variations (7), some of which play a vital role in predicting prognosis and guiding treatment. A previous study demonstrated that colon cancer patients harboring the same BRAFV600E oncogenic lesion generally displayed a low median survival (15). A randomized, phase III trial indicated that patients with wild-type RAS were sensitive to anti-EGFR therapy; conversely, patients with KRAS mutations displayed resistance to anti-EGFR therapy (16). In addition, CRC patients with the LMNA–NTRK1 gene fusion were sensitive to the TRKA kinase inhibitor entrectinib (17). In addition to these genomic variations that have been proven to be predominantly associated with prognosis and targeted therapies in CRC, there are still many genomic variations that might have clinical significance waiting to be discovered.
In this research, we systematically extracted eight mutational signatures of CRC. Based on these mutational signatures, we performed consensus clustering to recognize heterogeneous molecular subtypes and better understand the genomic characteristics of CRC. Ultimately, we identified two distinct mutational signature clusters (MSCs). The two subtypes displayed significant difference in the genomic variation, methylation profile, prognosis, immune landscape, and microsatellite instability (MSI) status. In addition, based on the two subtypes, we identified and validated the relationship between FAM83A and IDO1 expression as a promising biomarker for predicting prognosis and distant metastasis in CRC patients in 15 independent public datasets and qRT-PCR data from 30 samples. These results deepen the understanding of the heterogeneity of CRC and will facilitate the individualized treatment and clinical management of patients with CRC.
Materials and Methods
Data Sources and Processing
Mutation (derived from VarScan 2), somatic copy number alteration (SCNA), HumanMethylation450 array, and RNA-seq count data of CRC were obtained from The Cancer Genome Atlas (TCGA) portal. We also retrieved 14 expression microarrays datasets (GSE17536, GSE17537, GSE103479, GSE29621, GSE38832, GSE39084, GSE39852, GSE71187, GSE72970, GSE87211, GSE27854, GSE21510, GSE18105, and GSE71222) from the Gene Expression Omnibus (GEO) database. For 11 microarray datasets derived from the Affymetrix Human Genome U133 Plus 2.0 Array, the “CEL” raw data were obtained and further processed via a robust multiarray averaging algorithm (RMA) implemented in the affy R package. RMA was used to perform background adjustment, quantile normalization, and final summarization of oligonucleotides per transcript using the median polish algorithm. For the three other microarray datasets, we directly retrieved the normalized matrix files. The corresponding clinical information was also downloaded, and the details are listed in Supplementary Table 1. Ultimately, a total of 2,778 patients' data were collected, of whom 2,294 patients had survival information and 1,144 patients had metastasis information.
Deciphering Mutational Signatures in Colorectal Cancer
The masked somatic mutational profiles of 535 CRC patients were obtained from TCGA datasets. The trinucleotideMatrix function of the maftools package (18) was employed to extract the 5′ and 3′ bases immediately flanking the mutated site and to then generate a 96 × 535 mutation subtype frequency matrix. Subsequently, we applied the NMF package to extract the mutational signature, and the optimal rank was determined by the cophenetic coefficient and the residual sum of squares (RSS). De novo mutational signatures were then compared with curated signatures in COSMIC (19) using cosine similarity analysis (20) (https://cancer.sanger.ac.uk/cosmic/signatures_v2). The APOBEC enrichment analysis described by Roberts et al. (21) was further performed with the Maftools package.
Consensus Clustering
Based on the extracted mutational signatures, consensus clustering was utilized to determine the membership of CRC patients within possible clusters using the ConsensusClusterPlus R package (22). The subsample is 80% of the samples at each iteration, and each subsample was partitioned up to k (max K = 9) groups by k-means algorithm upon the Euclidean distance. This process was repeated 1,000. The optimal number of clusters was determined by cumulative distribution function (CDF) and proportion of ambiguous clustering (PAC) analyses (23). In addition, the Nbclust (24) package, which provides 26 indices in determining the number of clusters, was also used to assess the best clustering scheme.
Mutation and Somatic Copy Number Alteration Analysis
The MutSigCV 1.4 software (25) was employed to identify the significantly mutated genes (SMGs) for the two MSC subtypes of CRC. Genes with q < 0.05 and mutation frequencies > 10% were defined as mutation drivers. The GISTIC2.0 software was employed to identify significantly altered segments. Fragments with q < 0.05 and alteration frequency > 25% were considered SCNA drivers. The load of loss or gain was quantified as the total number of all genes with SCNA at the focal and arm levels. Mutations and SCNAs in MMR genes, including MLH1, MLH3, MSH2, MSH3, MSH4, MSH5, MSH6, PMS1, and PMS2, were also explored in the two MSC subtypes.
Identification of Methylation-Driven Genes
We downloaded the HumanMethylation450 array data from the TCGA-CRC cohort and employed the IlluminaHumanMethylation450kanno.ilmn12.hg19 package for annotation. To identify the methylation-driven genes (MDGs) in CRC, we employed two methods to dissect the methylation profiling data. One method was MethylMix, which is based on the beta distribution and was designed to recognize gene expression that is significantly related to methylation events (26). The other method was derived from the study of Charoentong et al. (27) and can be used to identify epigenetically silenced genes according to the absolute expression difference between the methylation and unmethylation groups. The MDGs were ultimately determined by the intersection of the two methods. In addition, if one MDG had a dominant difference in both the mRNA expression and DNA methylation profile between the two MSC subtypes (p < 0.05), we then labeled it a subtype-specific MDG (ssMDG).
Functional Annotation and Immune-Related Indicator Assessment
We performed gene set enrichment analysis (GSEA) between the two MSC subtypes, and the biological function terms with FDR < 0.05 were considered significant. Fifty hallmark pathways were also retrieved from the Molecular Signature Database (MSigDB v7.1). Based on the hallmark gene sets, we utilized the gene set variation analysis (GSVA) algorithm to transform the gene expression matrix into a pathway enrichment score matrix. The limma R package was applied to further reveal the discrepant pathways between the two MSC subtypes, with thresholds of FDR < 0.05 and |log2FC| > 0.2. The abundances of eight immune cell and two non-immune cell populations were assessed via the MCP-counter R package. In addition, we also calculated or retrieved data for 17 immunogenicity indicators from previous research: non-silent mutation rate, MSI score, single nucleotide variant (SNV) neoantigens, insertion and deletion (indel) neoantigens, cancer testis antigen (CTA) score, aneuploidy score (AS), intratumor heterogeneity (ITH) score, number or fraction of segments altered, homologous repair deficiency (HRD) score, loss of heterozygosity (LOH) score, B-cell receptor (BCR) or T-cell receptor (TCR) diversity score, and cytolytic activity (CYT) (28–30). The antigen processing and presenting machinery score (APS), used to measure antigen presentation capacity, was further calculated according to a previous report (31). For details on the immune-related indicators, please refer to Supplementary Table 2. Moreover, multiomics events of 75 immunomodulator molecules were further analyzed (Supplementary Table 3), including somatic mutations, SCNAs, and DNA methylation (28). The FDR was calculated with the Benjamini–Hochberg multiple correction method.
Identification of Reliable Gene Pair Markers for Prognosis and Distant Metastasis
We aimed to identify the relationship between the mRNA expression of two genes with prognostic significance and utility for predicting distant metastasis to facilitate clinical management. To ensure the robustness and stability of our results, 11 independent CRC cohorts with complete prognostic information encompassing (TCGA-CRC, GSE17536, GSE17537, GSE103479, GSE29621, GSE38832, GSE39084, GSE39852, GSE71187, GSE72970, and GSE87211) were employed to identify promising prognostic markers, and seven independent CRC cohorts with distant metastasis information (TCGA-CRC, GSE39084, GSE29621, GSE27854, GSE21510, GSE18105, and GSE71222) were utilized to further explore the ability of the identified prognostic markers to predict metastasis (Supplementary Table 1). The pipeline was as follows: (1) The edgeR package, with criteria |log2FC| > 1 and FDR < 0.05, was applied to identify differentially expressed genes (DEGs) between the MSC subtypes in the TCGA-CRC cohort. (2) Based on the identified subtype-specific DEGs, we converted the mRNA expression matrix into a two-gene expression relationship matrix. For one gene pair A|B, if the expression of A was greater than that of B, the pair was labeled “A>B”; conversely, if the expression of B was greater than that of A, the pair was labeled “B>A.” If the expression of A was equal to B, the sample was discarded. If the proportion of samples with “A>B” or “B>A” was > 90% in the corresponding cohort, the gene pair was discarded. (3) Univariate Cox regression analysis was implemented to screen the gene pairs with significant prognostic value (FDR < 0.05) in each cohort. If one gene pair had an FDR < 0.05 in more than five cohorts, then it was defined as a consensus prognosis gene pair signature (CPGPS). (4) We further explored the ability of each CPGPS to predict metastasis in seven independent cohorts with metastasis information.
Human Colorectal Cancer Specimens
The use of the human cancer tissues in this study was approved by the Ethics Committee of The First Affiliated Hospital of Zhengzhou University on December 19, 2019, and the TRN is 2019-KW-423. A total of 30 paired CRC tissues and matched adjacent non-tumor tissues were obtained from patients after receipt of surgical resection at The First Affiliated Hospital of Zhengzhou University. None of the patients received any preoperative chemotherapy or radiotherapy. Written informed consent was obtained from all patients. The inclusion criteria were as follows: no preoperative chemotherapy, radiotherapy, or targeted therapy; no other types of tumors; and no autoimmune diseases. The specimens obtained during surgery were immediately snap frozen in liquid nitrogen and stored at −80°C until RNA extraction. Clinical staging of the specimens was based on the NCCN (2019) guidelines. For details on the patients, please refer to Supplementary Table 4.
RNA Preparation and Quantitative Real-Time PCR
Total RNA was isolated from CRC tissues and paired adjacent non-tumor tissues with RNAiso Plus reagent (Takara, Dalian, China) according to the manufacturer's instructions. RNA quality was evaluated using a NanoDrop One C (Waltham, MA, USA), and RNA integrity was assessed using agarose gel electrophoresis. An aliquot of 1 μg of total RNA was reverse transcribed into complementary DNA (cDNA) according to the manufacturer's protocol using a High-Capacity cDNA Reverse Transcription kit (TaKaRa BIO, Japan). Quantitative real-time PCR (qRT-PCR) was performed using SYBR Assay I Low ROX (Eurogentec, USA) and SYBR® Green PCR Master Mix (Yeason, Shanghai, China) to detect expression. The data were normalized to the expression of GAPDH. The sequences of the primers were as follows:
GAPDH forward (5′- to 3′-): GGAGCGAGATCCCTCCAAAAT
GAPDH reverse (5′- to 3′-): GGCTGTTGTCATACTTCTCATGG
FAM83A forward (5′- to 3′-): CAGATCTCTGACAGTCACCTCAAG
FAM83A reverse (5′- to 3′-): CTGCCTGACTTGGCACAGTA
IDO1 forward (5′- to 3′-): ATATGCCACCAGCTCACAGG
IDO1 reverse (5′- to 3′-): AGCTTTCACACAGGCGTCAT.
Statistical Analysis
Correlations between two continuous variables were assessed via Spearman's correlation coefficients. Fisher's exact test or Pearson's chi-squared test was applied to compare categorical variables. Continuous variables were compared between two groups through the Wilcoxon rank-sum test or T-test. The Wilcoxon signed rank test was utilized to compare the gene expression differences between the paired CRC tissues and matched adjacent non-tumor tissues in the qRT-PCR assay. Kaplan–Meier and Cox regression analyses were performed with the survival R package. All P-values were two-sided, with p < 0.05 considered to indicate statistical significance. All data processing, statistical analysis, and plotting were conducted in R 3.6.4 software.
Results
Extraction of Mutational Signatures in Colorectal Cancer
A total of 192,905 mutations were detected in 535 samples, with a median of 91 mutations per sample, including SNVs and small indels. SNVs were the main mutation type, and C>T mutations displayed the highest frequency, followed by C>A and T>C mutations. Among the top 10 most frequently mutated genes, APC had the highest number of deletion mutations (236), and TTN had the highest number of missense mutations (646) (Supplementary Figure 1). To gain insights into the potential mutation generation processes occurring in patients with CRC, we deconvoluted the mutational signatures via the NMF algorithm (Supplementary Figure 2A). Subsequently, eight mutational signatures were extracted from the CRC genomic data and annotated with the COSMIC signature nomenclature based on cosine similarity (Supplementary Figure 2B). Therefore, the extracted mutational signatures were ultimately called cosmic signatures 1, 6, 10, 15, 20, 28, 29, and 30 (Figure 1A). Clocklike signature 1 is thought to be connected with the age-related accumulation of spontaneous deamination of 5-methylcytosine. Signatures 6, 15, and 20 are all associated with defective DNA MMR. Signature 10 features altered the activity of the error-prone polymerase POLE and is often found in six cancer types, including CRC. Signature 29 exhibits transcriptional strand bias for C>A mutations due to tobacco chewing habits. Signatures 28 and 30 have been observed in a subset of stomach and breast cancers with unknown etiology (19).
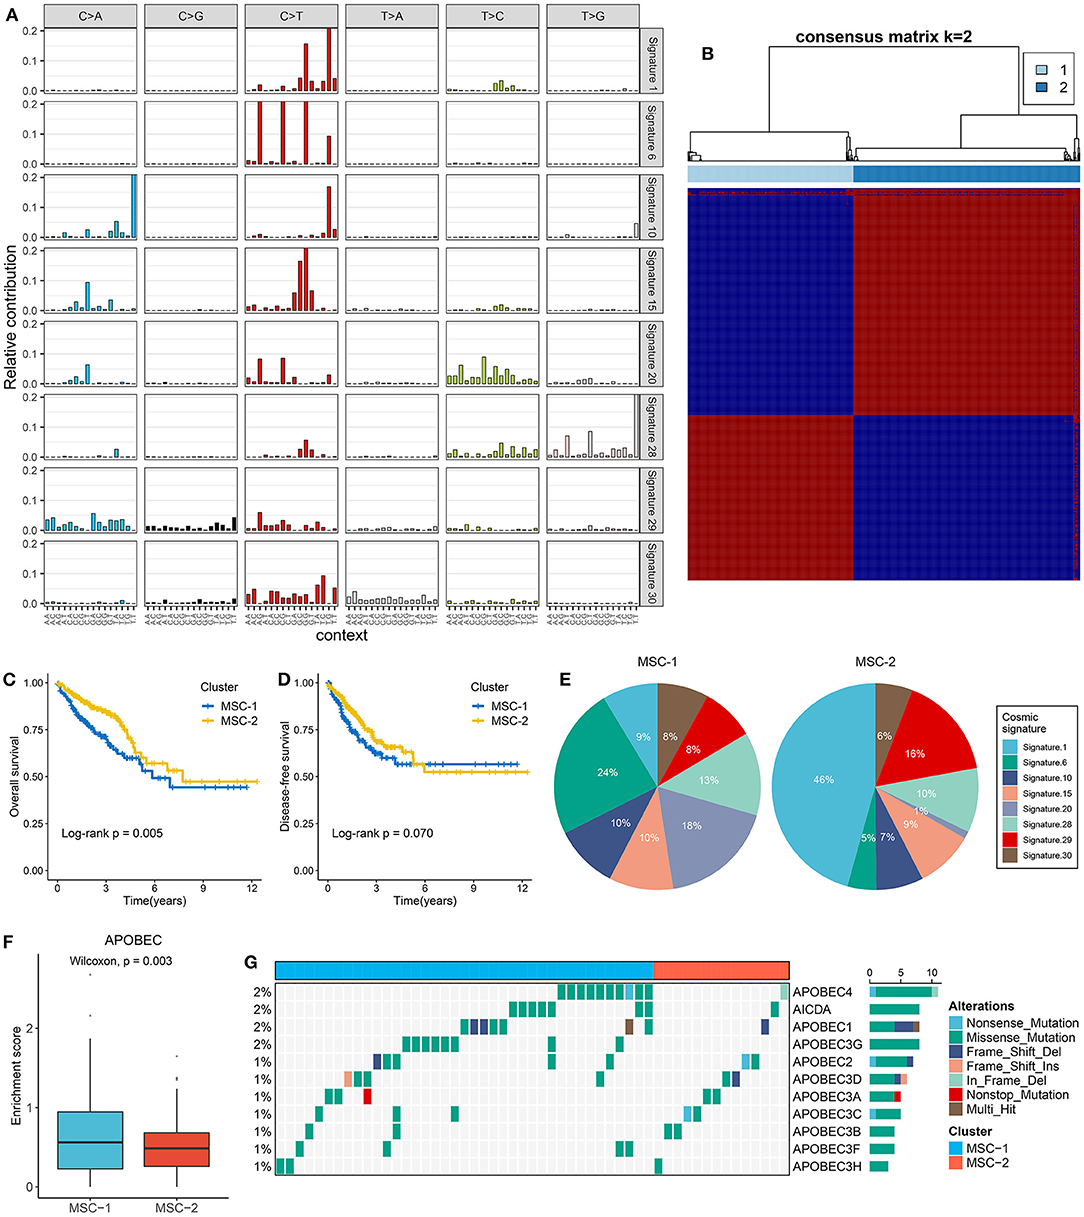
Figure 1. The extraction of mutation signatures and generation of the mutation signature relevant subtypes in CRC. (A) Eight mutation signatures were deciphered (mutation signature 1, 6, 10, 15, 20, 28, 29, and 30) based on NMF algorithm and COSMIC signatures. (B) The consensus score matrix of all samples when k = 2. A higher consensus score between two samples indicates they are more likely to be grouped into the same cluster in different iterations. The rows and columns of heatmap are both samples, and the cell value of the heatmap is the consensus score between two samples. (C,D) Kaplan–Meier analysis for OS (C) and DFS (D) between MSC-1 and MSC-2. (E) Pie charts show the relative proportion of eight categories of mutation patterns in MSC-1 and MSC-2, respectively. (F) The difference of APOBEC enrichment score between MSC-1 and MSC-2. (G) Mutational oncoplot of 11 APOBEC associated genes in two subtypes.
Generation of the Mutational Signature-Related Subtypes
Mutational signatures were deciphered from CRC genome data, and consensus clustering analysis revealed that two was the optimal number of subtypes (Figure 1B). The CDF curve, PAC value, and Nbclust results further confirmed the stability and reliability of the cluster results (Supplementary Figures 2C–E). We annotated the two subtypes as mutational signature clusters (MSCs) 1 and 2. The Kaplan–Meier survival analysis suggested that MSC-2 was significantly associated with favorable OS (log-rank p = 0.005) (Figure 1C). There was no significant difference in disease-free survival (DFS) between the two subtypes, possibly due to the large amount of follow-up data censored after 5 years (log-rank p = 0.070) (Figure 1D). We further compared the differences in DFS between the two subtypes within 5 years and found that MSC-2 was significantly associated with better DFS (log-rank p = 0.028) (Supplementary Figure 2F). Of note, MSC-1 (n = 226) predominantly featured signatures 6, 15, 20, and 28. Signatures 6, 15, and 20 are linked to defective DNA MMR. MSC-2 (n = 309) was characterized by signatures 1 and 29, which are associated with age and tobacco chewing habits (Figure 1E, Supplementary Figure 2G). We also observed that the APOBEC signature enrichment score was significantly higher (p = 0.003) in MSC-1, which indicated that MSC-1 had a higher occurrence of the C>T transition in TpCpW motifs than did MSC-2 (Figure 1F). A previous study demonstrated that mutations in the APOBEC family might contribute to a high tumor mutation burden (TMB) (32). Therefore, we further explored mutations in the APOBEC family and found rare mutations in CRC patients. Of note, MSC-1 had a higher frequency of mutations than MSC-2, in line with the enrichment score of APOBEC mutations found in MSC-1 compared with MSC-2 (p = 0.003) (Figure 1G); this finding might explain the high mutation rate in MSC-1.
Somatic Mutation Landscape of the Two Subtypes
The TMB in MSC-1 cells was significantly higher than that in MSC-2 cells (p < 0.001) (Supplementary Figure 3A). A higher TMB may tend to occur in patients with defective DNA MMR-related mutational signatures (7). We further determined 28 mutation-driven genes with MutSigCV q < 0.05 and mutation frequencies > 10% in CRC (Supplementary Table 5, Figure 2A). Out of these 28 genes, 18 genes have been reported in at least one CRC-associated study, such as APC, TP53, KRAS, SYNE1, PIKSCA, FBXW7, etc. (33–39). In addition, 10 novel drivers were identified: DNAH11, USHA2, HMCN1, HYDIN, MDN1, DST, VPS13B, DNAH8, EYS, and NBEA. We also determined the prognostic role of these genes. Mutation of EYS prolonged DFS, and mutation of USH2A suggested unfavorable OS (Figures 2B,C). In the two MSC subtypes, 22 out of the 28 drivers exhibited significant mutation differences (Figure 2D). Consistent with the high TMB in MSC-1, the mutation frequency of most drivers, such as ATM, SOX-9, and PRKDC, was also higher in MSC-1 than in MSC-2. Of note, APC and KRAS, genes that are mutated early in colon adenoma–carcinoma progression (40), were dominantly mutated in MSC-2, which implies that familial adenomatous polyposis (FAP) may be one of the main causes of MSC-2. Further analyses revealed predominant commutations of KRAS and SYNE1, TP53 and SYNE1, and APC and USH2A (Supplementary Figure 3B). Interestingly, we found some specific commutations, such as BRAF-HMCN and DNAH17-MDN1, that appeared only in MSC-1, which suggested that these commutations could be employed to distinguish different subtypes (BRAF-HMCN: p < 0.001; DNAH17-MDN1: p < 0.001) (Figures 2E,F). In addition, for the first time, we determined the prognostic value of some commutations: commutation of APC-TP53 demonstrated favorable DFS (Supplementary Figure 3C) and commutations of APC-KRAS, KRAS-TP53, and KRAS-SYNE1 were significantly associated with poor DFS (Figures 2G–I). Furthermore, the literature has confirmed that CRC patients with defective mismatch repair (MMR) can develop hypermutation and MSI (41). Hence, we investigated the mutation status of nine known MMR genes, and the results showed that MSC-1 had the most mutations in MRR genes (Supplementary Figure 3D), and the proportion of cases with MMR gene mutations was relatively high in MSC-1 compared with MSC-2 (26 vs. 7%; p < 0.001) (Figure 2J); these results were in line with the specific mutational signatures in MSC-1, such as signatures 6, 15, and 20.
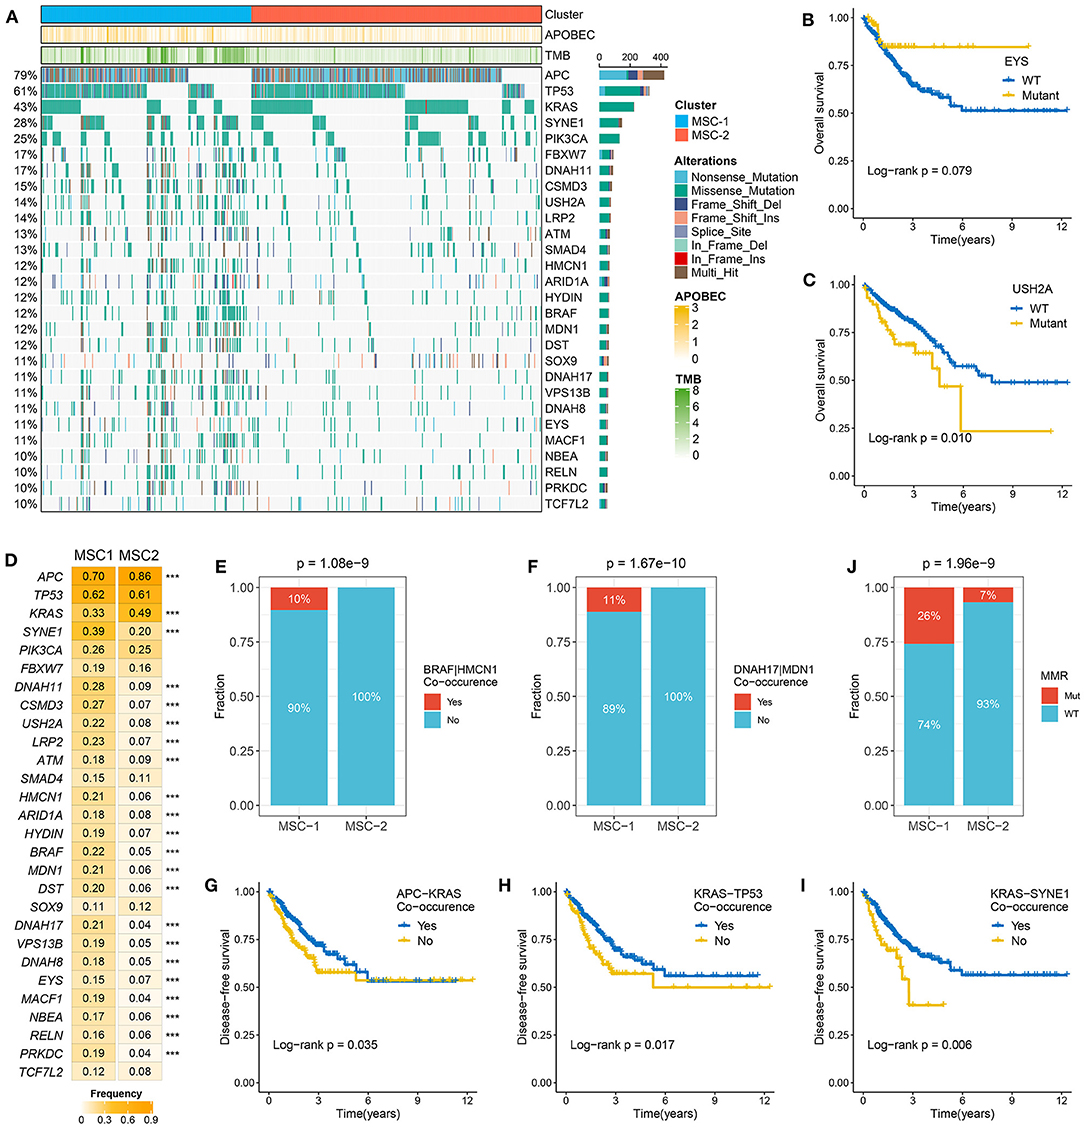
Figure 2. The mutation driven genes in colorectal cancer (CRC). (A) Mutational oncoplot of mutation driven genes in MSC-1 and MSC-2. Rows are genes and columns are tumor samples. (B,C) Kaplan–Meier survival analysis of EYS (B) and USH2A mutations (C). (D) The mutation frequency of mutational drivers in two subtypes, ***P < 0.001. (E,F) The relative proportion of BRAF-HMCN (E) and DNAH17-MDN1 (F) co-occurrences in two subtypes. (J) The relative proportion of patients with the MMR genes mutations in two subtypes. (G–I) Kaplan–Meier survival analysis of APC–KRAS (G), KRAS–TP53 (H), and KRAS–SYNE1 (I) co-occurrence.
Somatic Copy Number Alterations Investigation of the Two Subtypes
At the arm level, both the gain and loss loads were significantly higher in MSC-2 than in MSC-1 (p < 0.05). Although there was no statistical significance in the focal level load between the two subtypes, slight trends for higher loads were shown in MSC-2 than in MSC-1 (Supplementary Figure 4A). In contrast to MSC-1, which was characterized by a high mutation load, MSC-2 might predominantly contain alterations in copy number. By employing the GISTIC algorithm, we ultimately identified 39 driver segments encompassing 14 amplification segments and 25 deletion segments (Supplementary Tables 6, 7, Supplementary Figure 4B). We further compared the alteration frequencies of the 39 segments between the two subtypes and found that MSC-1 had a generally low frequency compared with MSC-2, in accordance with the CNA load (Figure 3A). We also found a multitude of oncogenes and tumor suppressor genes in these driver segments that might play an essential role in the tumorigenesis and progression of CRC, such as MYC (8q24.21), CCND3 (6p21.1), ERBB2 (17q12), PTEN (10q23.31), SMAD4 (18q21.2), and APC (5q22.2) (Figure 3B). Although MSC-2 generally had frequent SCNA events involving these genes, high proportions of amplifications or deletions still occurred in MSC-1, involving genes such as MYC, FTK3, and MCC as well as NOTCH and TGF-beta pathway-associated genes. Interestingly, we found oncogenes with only amplification and tumor suppressor genes with only deletion. Thus, the gene expression differences between gain and no-gain mutations, and loss and no-loss mutations were further explored, and we found that oncogenes with gain, such as ERBB2, MYC, and MLST8, were more prone to overexpression, and the expression of tumor suppressor genes with loss was predominantly lower than that of tumor suppressor genes with no-loss, such as APC, SMAD4, and PTEN (p < 0.001) (Figure 3C, Supplementary Figure 4C). These results suggest that CNA status plays a master regulatory role in the aberrant expression of oncogenes and tumor suppressor genes in CRC. Further survival analysis demonstrated the prognostic significance of these genes (Supplementary Figures 4D,E). We report for the first time that gain of MLST8 and MAP2K2 prolonged OS (Figure 3D, Supplementary Figure 4F), gain of CCND3 indicated worse DFS (Figure 3E), and loss of CTNN6, DKK1, APC, MCC, or SMAD4 was associated with unfavorable DFS (Supplementary Figure 4F). Moreover, we also investigated the CNA of MMR genes and found that the fraction of patients with MMR gene deletions was higher in MSC-2 than in MSC-1 (62 vs. 53%; p = 0.042) (Figures 3F,G). Importantly, some MMR genes, such as MLH3, MSH4, MSH3, and MLH1, displayed high loss frequencies, which might diminish the expression of MMR genes and give rise to MSI in CRC.
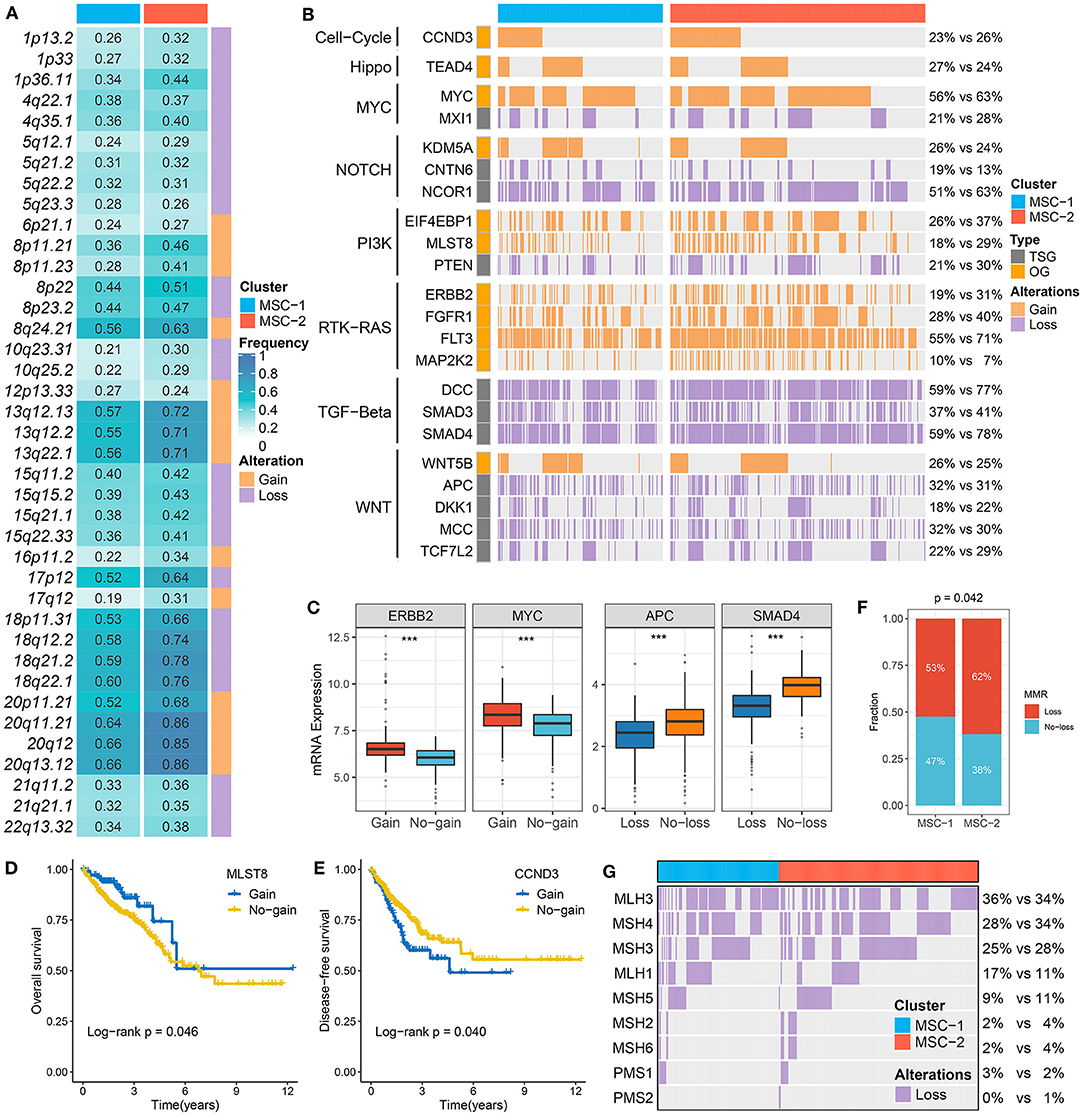
Figure 3. The driven segments identified from GISTIC algorithm in CRC. (A) The amplification (orange) and deletion (purple) frequency of 39 driven segments in two subtypes. (B) The distribution of CNA relevant oncogenes and tumor suppressive genes in two subtypes. (C) The expression difference of ERRB2 and MYC between the gain and no-gain groups, as well as APC and SMAD4 between the loss and no-loss groups. ***P < 0.001. (D,E) Kaplan–Meier survival analysis of MLST (D) and CCND3 (E) gain. (F) The relative proportion of patients with the MMR genes deletions in two subtypes. (G) Oncoplot for the deletion of nine MMR-related genes in two subtypes.
Methylation-Driven Genes
To identify MDGs in CRC, the MethyMix package and the Wheeler criterion were employed. The MethyMix algorithm identified 608 genes with expression significantly related to methylation events, and the Wheeler criterion identified 147 epigenetically silenced genes (Supplementary Table 8). Ultimately, we identified a total of 69 MDGs by the intersection of the two methods. Further univariate Cox regression analysis uncovered the prognostic significance of these MSGs (Supplementary Table 9). High methylation of TBX1, GREB1L, and CNNM1 was significantly associated with unfavorable OS (Figures 4A–C). Further investigation revealed that the high methylation of TBX18, GREB1L, and CNNM1 was still associated with adverse prognosis in MSC-1, while there was no significant correlation between the high methylation of CTNNB1 and OS in MSC-2 (Supplementary Figure 5A). In addition, we defined ssMDGs, and 13 ssMDGs had significantly different expression and methylation between the two MSC subtypes (Supplementary Figures 5B,C). For these ssMDGs, we observed a significant negative correlation between the expression and methylation levels (Figure 4D). MSC-2 featured more hypermethylation of AQP5 and ZNF304 than MSC-1. Interestingly, AQP5 is a potential epigenetic driver of tumor development (42). The other 11 ssMDGs, such as ADAM32, SLC35D3, and TMEM150C, were specific for MSC-1. Of note, MLH1 was also a specific ssMDG of MSC-1. As illustrated, the methylation level of MLH-1 in MSC-1 was much higher than that in MSC-2, and the expression level was lower in MSC-1 than in MSC-2 (Supplementary Figures 5B,C). A previous report demonstrated that the hypermethylation of MLH-1 was a potential mechanism contributing to MSI in CRC (43). We thus divided CRC patients into methylated cases and unmethylated cases based on a threshold of beta = 0.3 and found that all methylated cases were in MSC-1 (22 vs. 0%; p < 0.001) (Figure 4E), which explains the specificity of the MSI-associated mutational signature for MSC-1 to some extent.
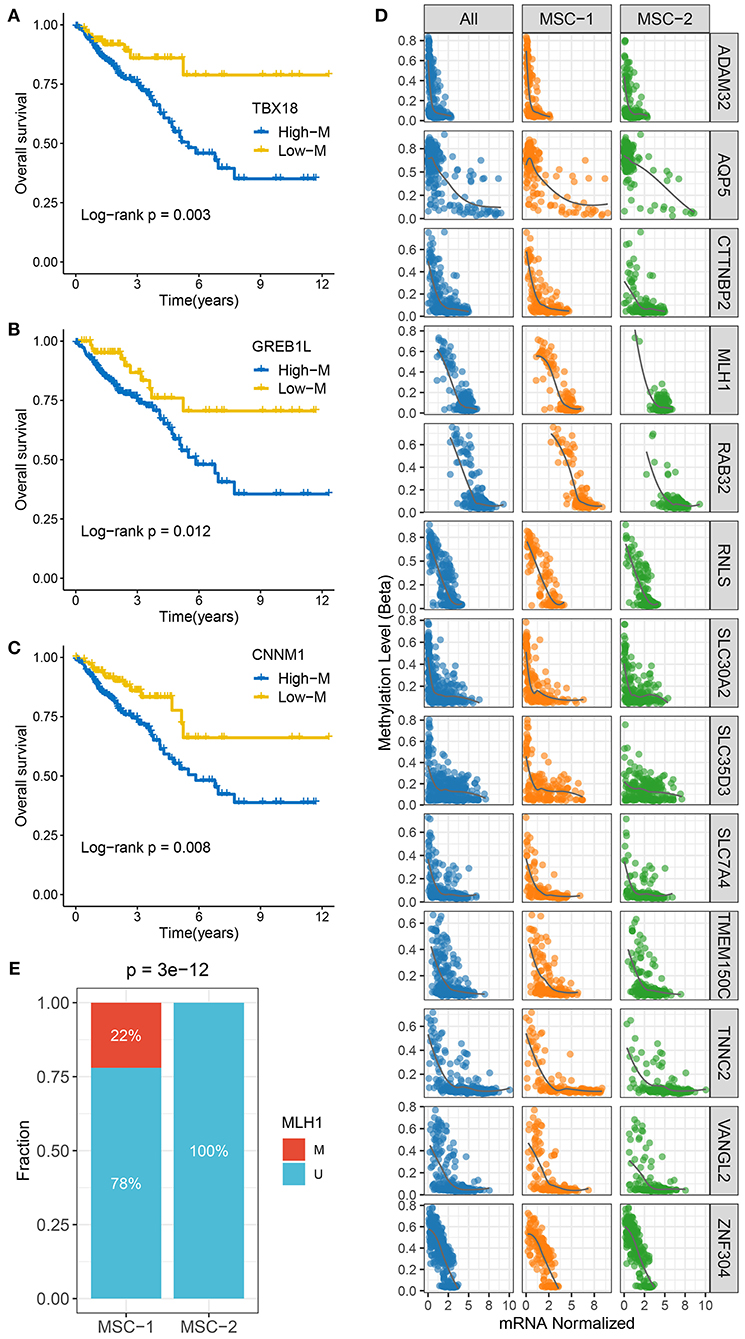
Figure 4. The methylation driven genes in CRC. (A–C) Kaplan–Meier survival analysis of TBX18 (A), GREB1L (B), and CNNM1 (C) methylation. (D) The correlation analysis between the methylation and mRNA expression levels of 13 ssMDGs. (E) The relative proportion of patients with the MMR genes methylation events between two subtypes.
Functional Status, Immune Cell Infiltration, and Immunogenicity Assessment
We performed biological process and KEGG pathway enrichment analyses through the GSEA approach. The MSC-1 subtype was tightly associated with immune-related pathways such as adaptive immune response, antigen processing and presentation, response to interferon-gamma, and Th1 and Th2 cell differentiation (Figures 5A,C). The MSC-2 subtype was significantly enriched in reactive stroma-related pathways such as epidermis or mesenchymal morphogenesis, mesenchymal cell proliferation, transforming growth factor beta (TGF-β) signaling, and Wnt signaling (Figures 5B,D). Further GSVA hallmark pathway assessment suggested a similar result to the above results and elucidated that MSC-1 showed predominant immune activation, such as activation of the canonical T-cell excitation molecule interferon-gamma, and MSC-2 showed obvious activation of stromal factors, such as TGF-β (Figure 5E). In addition, we also evaluated the difference in eight immune cell and two non-immune cell subpopulations between the two subtypes (Figure 5F). Consistently, cytotoxic immune cells, such as T-cells, CD8+ T-cells, cytotoxic lymphocytes, and natural killer cells, were found in higher proportions in MSC-1 than in MSC-2, while MSC-2 had higher proportions of fibroblasts. The leukocyte and stromal fraction data retrieved from Thorsson et al. (28) also demonstrated a dominant role of the MSC-1 subtype in immune activation and a dominant role of the MSC-2 subtype in stromal activation (Figures 5G,H).
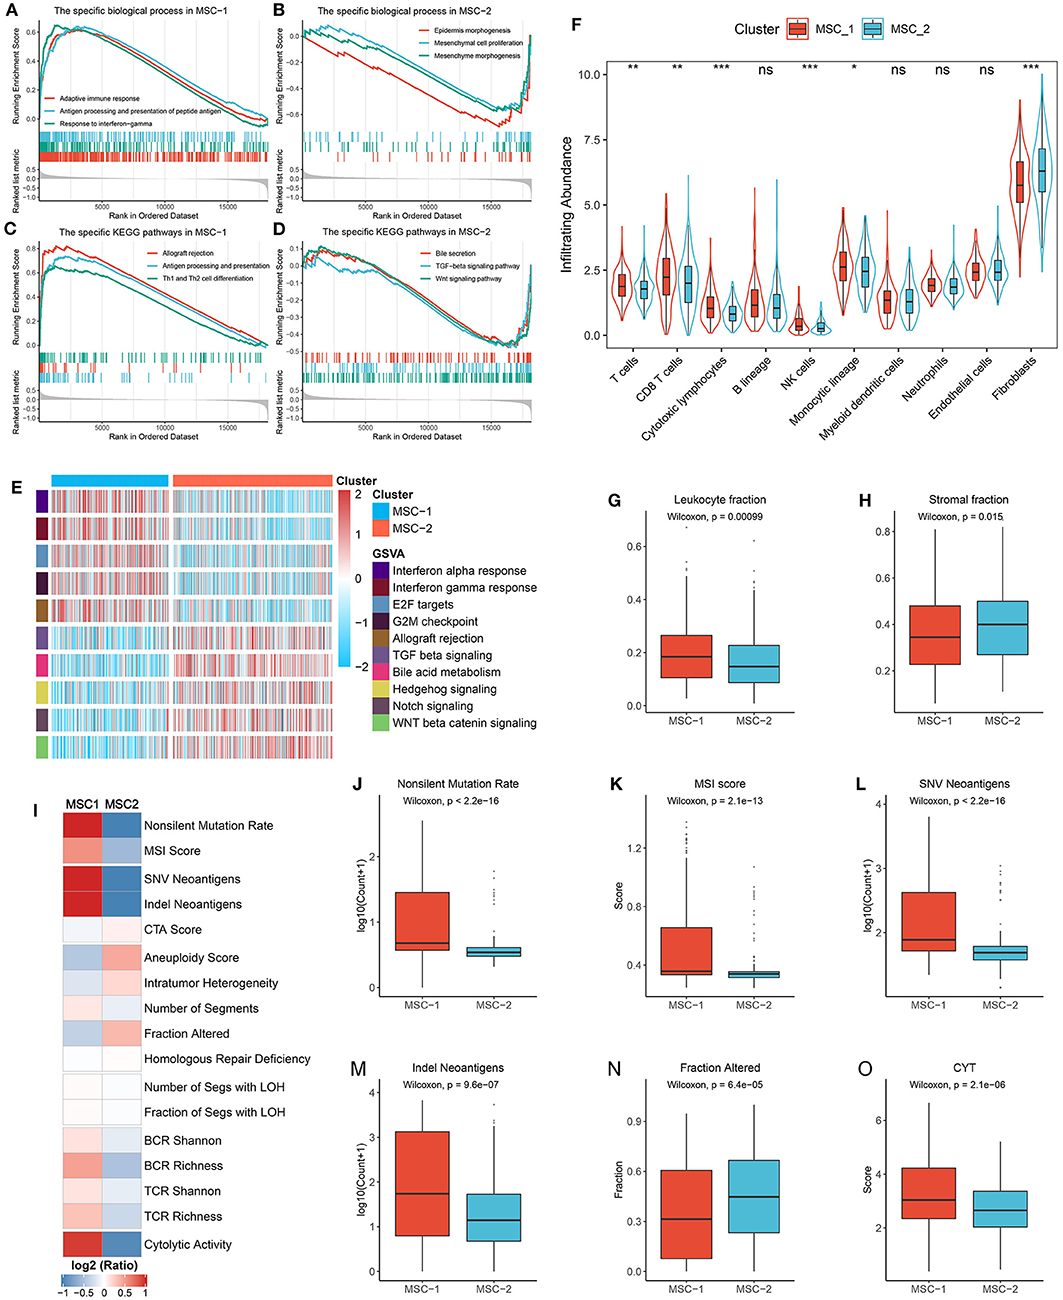
Figure 5. Functional status, immune cell infiltration, and immunogenicity assessment. (A,B) The biological process significantly enriched in MSC-1 (A) and MSC-2 (B). (C,D) The KEGG pathways significantly enriched in MSC-1 (C) and MSC-2 (D). (E) The specific Hallmark pathways in MSC-1 and MSC-2. (F) The infiltration abundance of eight immune cells and two non-immune cells populations in MSC-1 and MSC-2. ns, P > 0.05; *P < 0.05; **P < 0.01; ***P < 0.001. (G,H) The distribution of leukocyte (G) and stomal (H) fraction in MSC-1 and MSC-2. (I) The comparison of 17 immunogenicity associated indicators between two subtypes, the cell represented by the mean value of corresponding cluster divided by the overall mean value. (J–O) The distribution of non-silent mutation rate (J), MSI score (K), SNV neoantigens (L), Indel neoantigens (M), fraction of segments alteration (N), and cytolytic activity (CYT) (O) in MSC-1 and MSC-2.
Furthermore, 17 indicators were employed to deconvolute the immunogenicity features of the two subtypes (Supplementary Table 2, Figure 5I). In line with the specific mutational signatures in MSC-1 (that is, signatures 6, 10, and 15), the non-silent mutation rate and MSI score were higher in MSC-1 than in MSC-2 (Figures 5J,K). In addition, SNV and indels neoantigens were also more prone to occur in MSC-1 than in MSC-2 (Figures 5L,M), but there were no significant differences in terms of CTA score (Supplementary Figure 6A). Conversely, the CNV-relevant indicators, such as AS, ITH, number or fraction of altered segments, HRD, and LOH, were slightly higher in MSC-2 than in MSC-1, although most of the differences did not reach statistical significance (Figure 5N, Supplementary Figures 6B–G). These results imply that the immunogenicity of the two subtypes might be derived from their different genome alterations. In addition, the BCR/TCR diversity and CYT, which may reflect a robust antitumor response and cytolytic activity, were also higher in MSC-1 than in MSC-2 (Supplementary Figures 6H–K, Figure 5O). Overall, although there was heterogeneity between the two subtypes in different aspects of immunogenicity, MSC-1 still displayed stronger immunogenicity than MSC-2, and this increased immunogenicity might arise from the predominant mutation pattern. In addition, this stronger immunogenicity further conferred superior immune activation in MSC-1.
The Expression and Regulation of Immune Checkpoint Molecules
We next explored the expression and regulation differences of 75 immune checkpoint molecules (ICMs) between the two MSC subtypes at the multiomics level (Supplementary Table 3). Obviously, the expression of ICMs was generally high in MSC-1 (Figure 6A, Supplementary Figures 7A,B). In addition, MHC molecules displayed relatively low expression in MHC-2 (Figure 6B). We further calculated the antigen processing and presenting machinery score (APS) via the ssGSEA algorithm and observed that MSC-2 also presented a lower APS than MSC-1 (Figure 6C). This suggested that antigen presentation capacity might be impaired. In line with the immune activation status, MSC-1 demonstrated higher expression of stimulatory ICMs such as CCL5, CD40, and ITGB2 than MSC-2 (Supplementary Figure 7A). In addition, inhibitory ICMs such as IDO1, PDCD1, CTLA4, and CD274 were also predominantly expressed in MSC-1, which implied that the overexpression of inhibitory ICMs might be a mechanism for immune escape in MSC-1 (Supplementary Figure 7B).
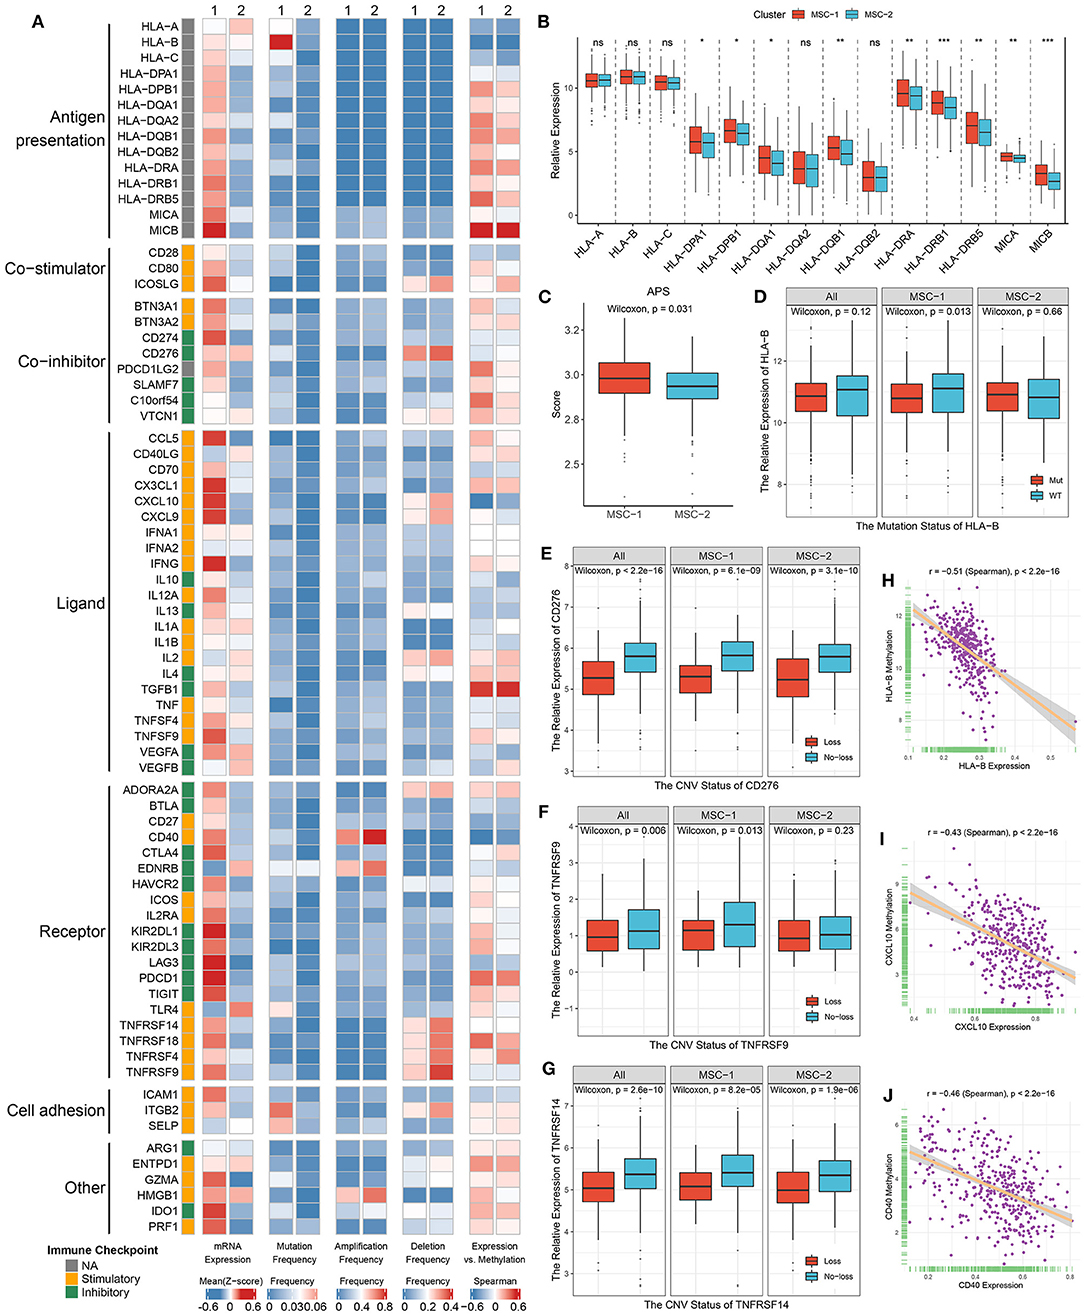
Figure 6. Multi-omics analysis of 75 immunomodulators in the TCGA-CRC cohort. (A) From left to right: mRNA expression (z-score), mutation frequency, amplification frequency, deletion frequency, and expression vs. methylation (gene expression correlation with DNA-methylation beta value) of 75 immunomodulators in MSC-1 and MSC-2. (B) The expression difference of MHC molecules between two subtypes. ns, P > 0.05; *P < 0.05; **P < 0.01; ***P < 0.001. (C) The distribution of APS score in MSC-1 and MSC-2. (D–G) The expression difference of HLA-B (D) between the mutant and wild groups, as well as CD276 (E), TNFRSF9 (F), and TNFRSF14 (G) between loss and no-loss groups. (H–J) The correlation analysis between the methylation and mRNA expression levels of HLA-B (H), CXCL10 (I), and CD40 (J).
Furthermore, we integrated the mutation, SCNA, and methylation profiles to decipher the regulation of ICMs. Notably, although mutation of ICMs was generally rare (Figure 6A), it still induced some effects on the expression of ICMs; for example, mutation of HLA-B and ITGB2 induced significantly lower expression in only MSC-1, but a slightly increased expression was observed in MSC-2 (Figure 6D, Supplementary Figure 7C). In contrast, SCNAs of ICMs were relatively prevalent (Figure 6A). CD40 had the highest amplification frequency, but there was no significant expression difference between the gain and no-gain groups (Supplementary Figure 7D). Consistent with their deletion status, the expression of CD276, ICOSLG, TNFRSF9, TNFRSF14, and TNRSF18 was relatively low in the loss group compared with the no-loss group (Figures 6E–G, Supplementary Figures 7E,F). In addition, hypermethylation also played a critical regulatory role for a number of ICMs, such as HLA-B, CXCL10, and CD40, and we observed that their expression was significantly negatively correlated with the methylation profile (HLA-B: r = −0.51; CXCL10: r = −0.43; CD40: r = −0.46; all p < 0.001) (Figures 6H–J).
Identification of Reliable Gene Pair Markers for Predicting Prognosis and Distant Metastasis
A total of 108 DEGs were identified between the two MSC subtypes (Figure 7A, Supplementary Table 11). We further transformed the gene expression matrix into a two-gene expression relationship matrix. By using the pipeline to determine the consensus prognosis gene pair signature (CPGPS), we ultimately determined three gene pairs with dominant prognostic significance in at least five cohorts: FAM83A|IDO1, FABP4|KLK12, and FABP4|GBP5 (Figures 7B,C, Supplementary Figure 7A). Of note, the gene pairs with a single relationship ratio in >90% of cases in the corresponding cohort were discarded. Ultimately, FAM83A|IDO1 was removed based on the GSE103479 and GSE87211 cohorts, FABP4|KLK12 was removed based on the GSE103479, GSE87211, GSE18105, GSE21510, GSE27854, and GSE71222 cohorts, and FABP4|GBP5 was removed based on the TCGA-CRC, GSE103479, GSE72970, GSE87211, GSE18105, GSE21510, GSE27854, and GSE71222 cohorts. The expression relationship of FAM83A and IDO1 was significantly associated with prognosis in 7/9 cohorts (Figures 7B,D–L), and FAM83A > IDO1 at the mRNA level was a poor prognostic factor. Although the FAM83A|high group had an adverse prognosis, there was no significance in the GSE17537 and GSE72970 cohorts, which might be due to their relatively small sample sizes (Figures 7F,L). The gene pair FABP4|KLK12 was also a prognostic marker that exhibited significance in 6/9 cohorts. FABP4 > KLK12 was predominantly associated with unfavorable prognosis (Figures 7C,M–U). In addition, patients with FABP4 > GBP5 were more likely to have a poor prognosis than patients without this expression relationship in 5/7 cohorts (Supplementary Figures 8A–H). Further multivariate Cox analysis revealed that FAM83A|IDO1 was an independent prognostic factor in most cohorts (7/9) (Supplementary Table 11). Conversely, the two gene pairs FABP4|KLK12 and FABP4|GBP5 did not perform well.
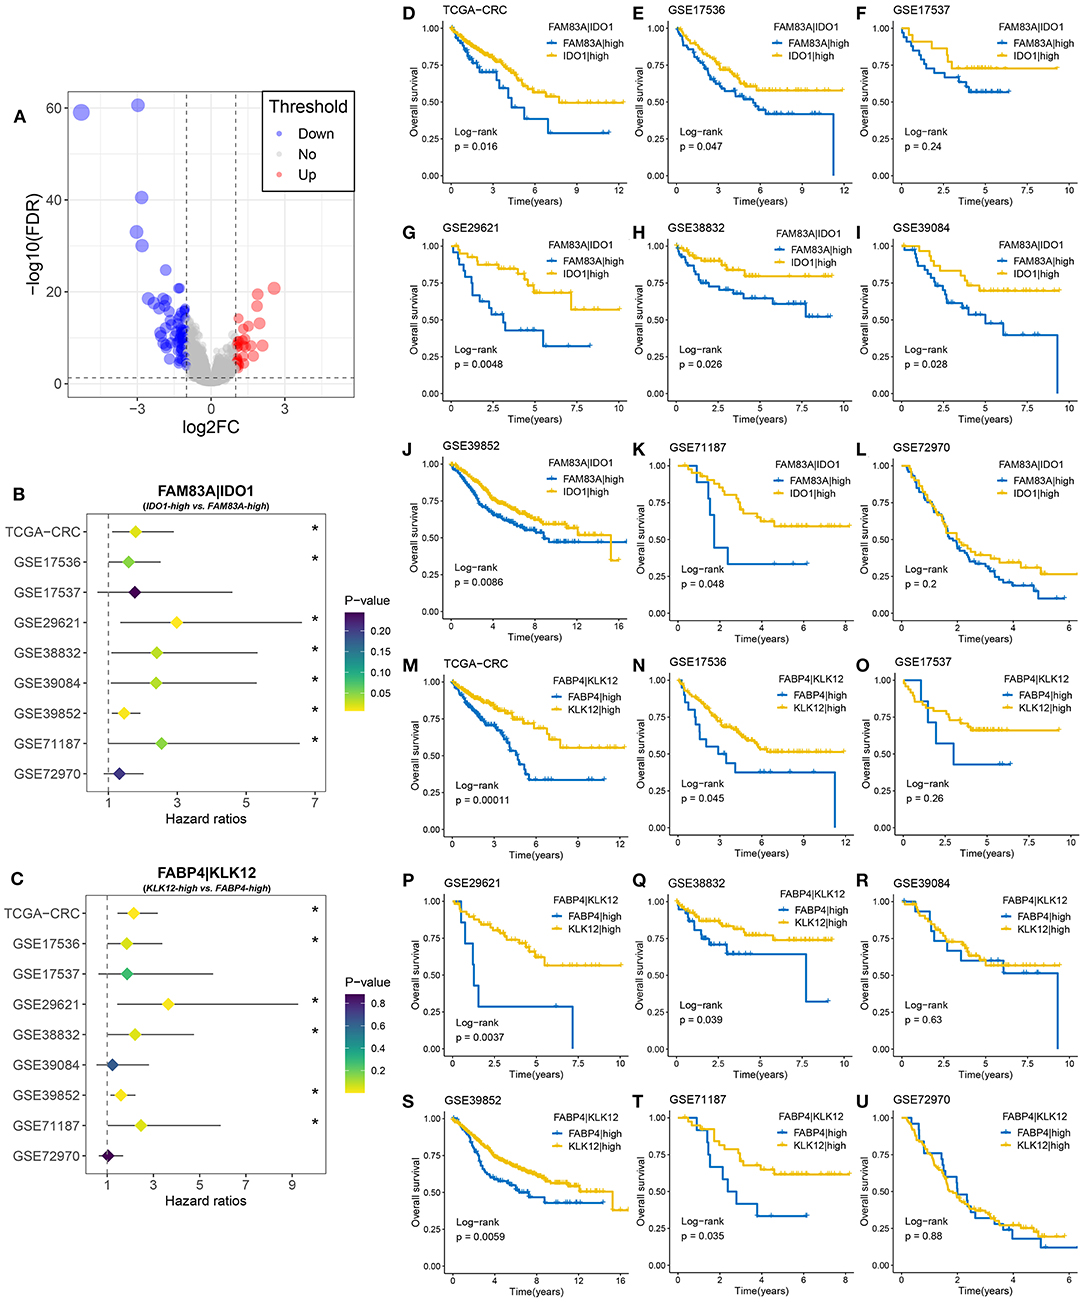
Figure 7. Identification of gene pairs with the ability to predict prognosis of CRC patients. (A) Volcano plot of differentially expressed genes (DEGs) between MSC-1 and MSC-2. The abscissa is log2FC, and the ordinate is –log10 (FDR). The red and blue points in the plot represent DEGs with statistical significance (FDR < 0.05 and |log2FC| > 1). (B) Forest plot of IDO1|high vs. FAM83A|high groups in nine cohorts. (C) Forest plot of KLK12|high vs. FABP4|high groups in nine cohorts. (D–L) Kaplan–Meier survival analysis for FAM83A|IDO1 in the TCGA-CRC (D), GSE17536 (E), GSE17537 (F), GSE29621 (G), GSE38832 (H), GSE39084 (I), GSE39852 (J), GSE71187 (K), and GSE72970 (L) cohorts. (M–U) Kaplan–Meier survival analysis for FABP4|KLK12 in the TCGA-CRC (M), GSE17536 (N), GSE17537 (O), GSE29621 (P), GSE38832 (Q), GSE39084 (R), GSE39852 (S), GSE71187 (T), and GSE72970 (U) cohorts. *P < 0.05.
We then determined the predictive role of the three gene pairs in CRC metastasis. Interestingly, the rate of distant metastasis was significantly different between the FAM83A|high and IDO1|high groups in all cohorts (TCGA-CRC: 29 vs. 15%, p = 0.007; GSE29621: 46 vs. 17%, p = 0.031; GSE39084: 44 vs. 16%, p = 0.028; GSE18105: 49 vs. 23%, p = 0.021; GSE21510: 47 vs. 25%, p = 0.026; GSE27854: 45 vs. 18%, p = 0.006; and GSE71222: 24 vs. 8%, p = 0.012) (Figures 8A–G). Due to the overrepresented single relationship of the gene pair, FABP4|KLK12 and FABP4|GBP5 were retained in three and two cohorts with metastasis information, respectively. Although statistical significance was not reached in most cohorts, the proportion of patients with metastasis varied between the FABP4|high and KLK12|high groups, and the FABP4|high and GBP5|high groups. For example, the FABP4|high group had a higher metastasis rate than the KLK12|high group (TCGA-CRC: 24 vs. 12%, p = 0.001; GSE29621: 57 vs. 25%, p = 0.173; and GSE39084: 31 vs. 31%, p = 1.000) (Figures 8H–J), and more metastatic cases were in the FABP4|high group than in the GBP5|high group (GSE29621: 44 vs. 23%, p = 0.199; and GSE39084: 44 vs. 27%, p = 0.278) (Figures 8K,L). Therefore, the predictive performance of FABP4|KLK12 and FABP4|GBP5 was much weaker than that of FAM83A|IDO1. Taken together, these data suggest that the expression relationships of FAM83A and IDO1 are a very promising biomarker for predicting the prognosis and distant metastasis of CRC patients.
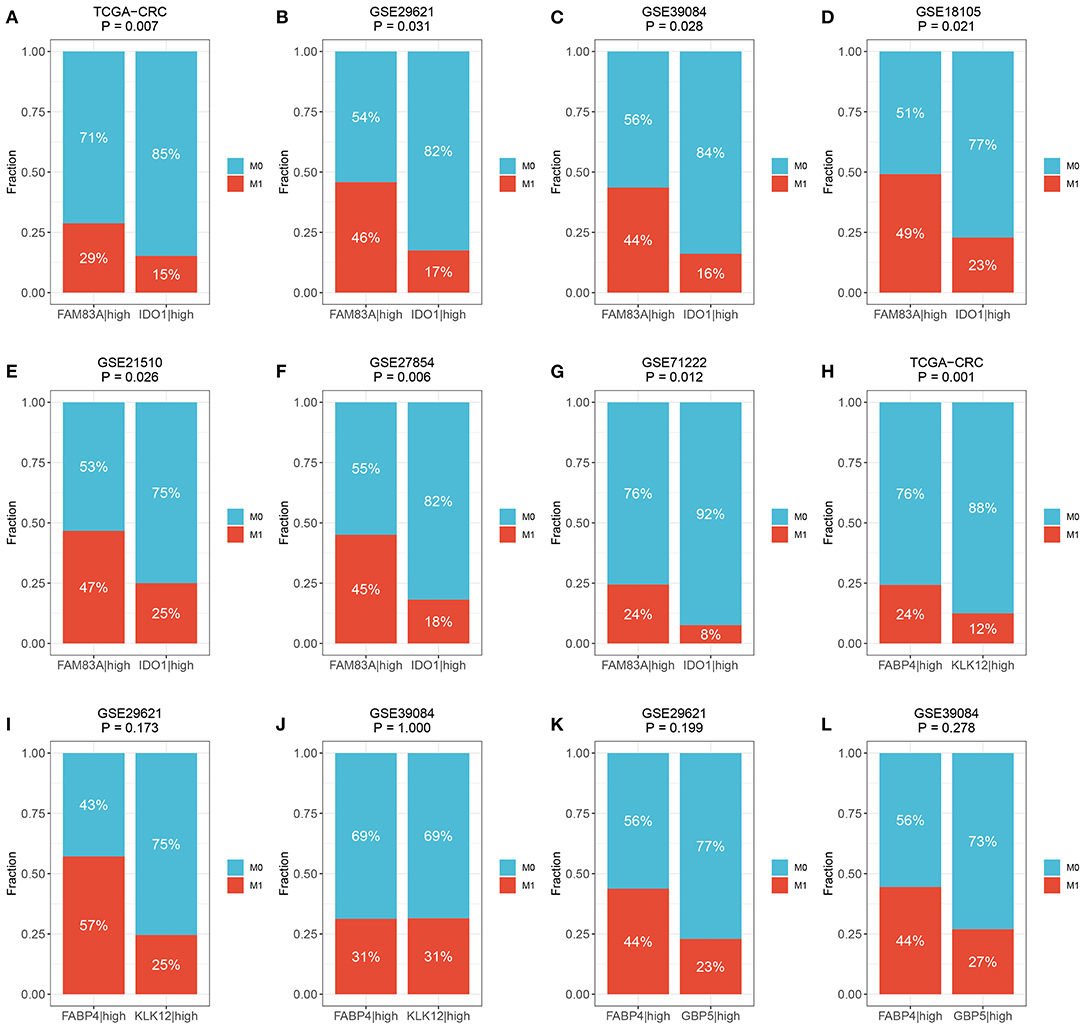
Figure 8. The predictive ability of three prognostic relevant gene pairs for distant metastasis. (A–G) The relative proportion of patients with distant metastasis between FAM83A|high and IDO1|high groups in the TCGA-CRC (A), GSE29621 (B), GSE39084 (C), GSE18105 (D), GSE27854 (F), and GSE71222 (G) cohorts. (H–J) The relative proportion of patients with distant metastasis between FABP4|high and KLK12|high groups in the TCGA-CRC (H), GSE29621 (I), and GSE39084 (J) cohorts. (K,L) The relative proportion of patients with distant metastasis between FABP4|high and GBP5|high groups in GSE29621 (K) and GSE39084 (L) cohorts. M0, no metastasis; M1, metastasis.
Verification of the Role of FAM83A|IDO1 in Predicting Prognosis and Metastasis Using qRT-PCR
qRT-PCR assays were performed in 30 paired CRC tissues and matched adjacent non-tumor tissues (Supplementary Table 4). We observed that FAM83A was overexpressed in tumor tissues relative to adjacent non-tumor tissues, and the expression of IDO1 showed the opposite relationship (p < 0.001) (Figures 9A,B). The role of FAM83A|IDO1 in predicting prognosis and metastasis was further explored by qRT-PCR. The clinical outcome details (including survival status and metastasis status) of 30 CRC patients are shown in Figure 9C. There was no correlation between the expression of FAM83A and IDO1. In line with the previous results, when the expression of FAM83A was higher than that of IDO1, patients had worse OS and DFS (log-rank p < 0.001) (Figures 9D,E), as well as a stronger tendency for distant metastasis (71 vs. 13%, p = 0.007) (Figure 9F).
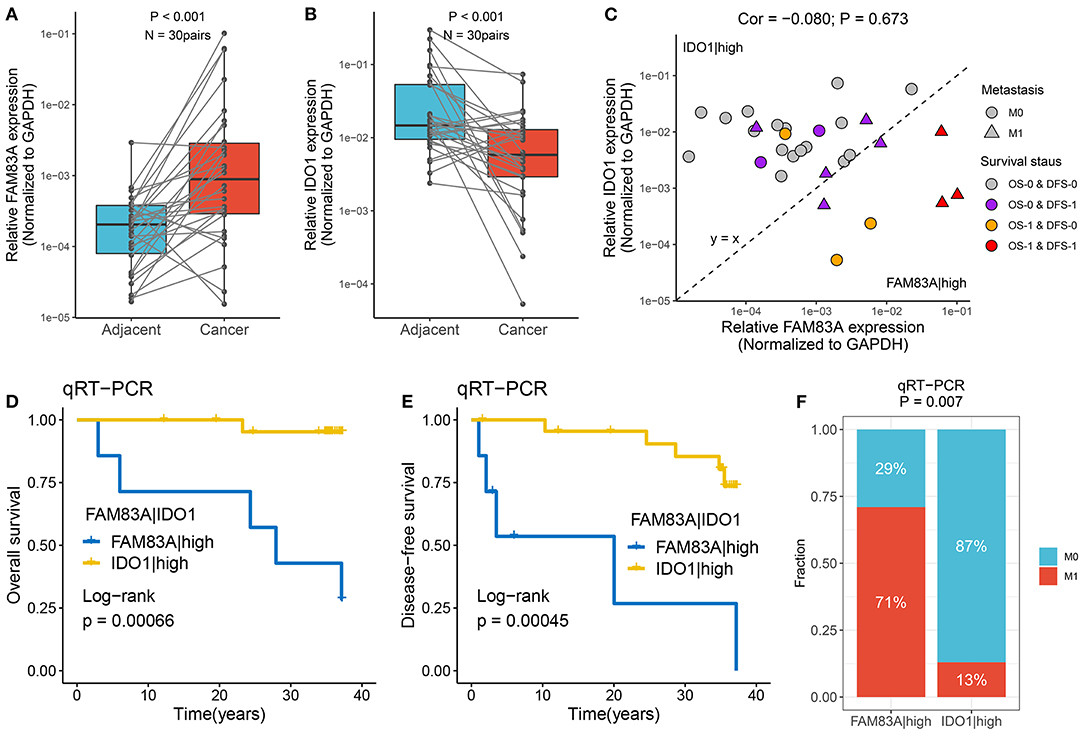
Figure 9. Verified the role of FAM83A|IDO1 in prognosis and metastasis using qRT-PCR. (A,B) The expression difference of FAM83A (A) and IDO1 (B) between two subtypes. (C) The mRNA expression of FAM83A and IDO1 as well as the clinical outcomes in our cohort. The abscissa is the expression of FAM83A, and the ordinate is the expression of IDO1. Under the line y = x, FAM83A > IDO1, while above it, FAM83A < IDO1. M0, no metastasis; M1, metastasis. OS-0, alive; OS-1, death or censoring; DFS-0, disease free; DFS-1, disease or censoring. (D,E) Kaplan–Meier analysis of OS (D) and DFS (E) for FAM83A|IDO1 in our cohort. (F) The relative proportion of patients with distant metastasis between FAM83A|high and IDO1|high groups in our cohort.
Discussion
Elegant efforts have demonstrated that multifarious genomic alterations are critical to the prognosis and targeted therapy of CRC (44–48). We sought to better delineate the molecular diversity of CRC by determining mutational signatures that reflect different mutational processes, such as spontaneous deamination of 5-methylcytosine (signature 1), defective DNA MMR (signatures 6, 15, and 20), recurrent POLE somatic mutations (signature 10), and tobacco chewing habits (signature 29). Based on these signatures, we identified two heterogeneous subtypes, MSC-1 and MSC-2. The two subtypes exhibited tremendous differences in genomic alterations including mutation, SCNA, and DNA methylation. The distinct tumor microenvironment (TME) statuses and immune escape mechanisms of the two subtypes reinforced their molecular variability. We also observed significant clinical differences between the subtypes in terms of OS and DFS. In addition, to facilitate clinical application, we employed a gene pair pipeline to determine a prognostic and distant metastasis biomarker, FAM83A|IDO1, and further validated it in 15 independent datasets and qRT-PCR data from 30 samples.
MSC-1, a mutation-dominant subtype characterized by signatures 6, 15, and 20, was linked to defective DNA MMR. In line with this, MSC-1 harbored mutations in many drivers, such as ATM, BRAF, and HMCN1, which play vital roles in the tumorigenesis and development of many cancers (49). Previous studies have indicated that ATM is involved in cell cycle regulation and DNA damage recognition and repair and might increase cell resistance to cisplatin (50). Approximately 10% of patients with metastatic CRC possess the BRAF V600 mutation, which is related to poor prognosis (51). Interestingly, specific commutations, including BRAF-HMCN and DNAH17-MDN1, appeared only in MSC-1, which suggested that these specific commutations could be promisingly employed to distinguish different subtypes. In addition, a multitude of methylation drivers, such as ADAM32, MLH-1, and CTTNBP2, were significantly epigenetically silenced in MSC-1. Interestingly, methylation silencing of MLH-1, which has been reported to contribute to oncogenesis in CRC by activating the serrated neoplasia pathway, appeared in only MSC-1 (52). We speculate that activation of the serrated neoplasia pathway in combination with BRAF mutation might be important in MSC-1 tumorigenesis.
MSC-2, a CNA-dominant subtype characterized by signatures 1 and 29, was related to spontaneous deamination of 5-methylcytosine and tobacco chewing habits. MSC-2 displayed loss of MYC (8q24.21), SMAD4 (18q21.2), and PTEN (10q23.31) as well as gain of CCND3 (6p21.1) and ERBB2 (17q12). The oncogene ERBB2 has been shown to be amplified or overexpressed in multiple cancers, including colon cancers (53, 54). As reported, ERBB2 amplification is an emerging therapeutic target and may also be a negative predictor of response to anti-EGFR therapy in CRC (55). Another promising candidate is SMAD4, a tumor suppressor that is the central node in TGF-β signaling (56). Studies have demonstrated that the loss of SMAD4 is associated with poor prognosis and predisposition to chemoresistance, such as resistance to 5-fluorouracil, leucovorin, and irinotecan (57). Of note, although MSC-2 demonstrated lower TMB than MSC-1, the frequency of mutations in the drivers APC and KRAS, which occur early in the progression from colorectal adenoma to malignant carcinoma, were highest in MSC-2 (52). As reported, ~85% of CRC cases are thought to evolve from conventional adenomas with the acquisition of mutations in APC, SMAD4, TP53, KRAS, or PI3KCA, resulting in Wnt-β-catenin and TGF-β pathway activation; this process is referred to as the adenoma-to-carcinoma sequence. The above analysis suggests that the conventional adenoma-to-carcinoma sequence may be an important process of oncogenesis in MSC-2.
In the present study, we also assessed the differences in immune cell proportions, stromal cell infiltration, and immune escape mechanisms between the two subtypes. Consistent with the high mutation load in MSC-1, there was also infiltration of numerous innate and adaptive immune cells in the TME, which was linked to the immune inflammation status. The TME results were also supported by the finding of activation of immune-related pathways, including pathways related to the adaptive immune response, antigen processing and presentation of peptide antigens, and the response to interferon-gamma. In CRC, immune checkpoint inhibitors have been proven effective in heavily mutated tumors with MMR defects or high levels of MSI (3), which implies that patients in MSC-1 may benefit more from immunotherapy than patients in MSC-2. Although accompanied by both MSI and immune activation, MSC-1 exhibited unfavorable OS and DFS. High levels of immunosuppressive molecules in the TME may trigger immune resistance and escape mechanisms in MSC-1. Compared with MSC-1, MSC-2 was characterized by more fibroblasts and a lack of adaptive immune cells, accompanied by stromal-associated pathway activation, such as activation of pathway related to epidermis or mesenchymal morphogenesis, mesenchymal cell proliferation, TGF-β signaling, and Wnt signaling. Combined with this weaker immunogenicity, the insufficient immune cell infiltration in MSC-2 contributes to immune escape, suggesting that patients with the MSC-2 subtype might exhibit an unfavorable response to immunotherapy. Therefore, comprehensive analysis of molecular and immune microenvironment variability might contribute to optimizing the treatment and clinical management of CRC patients.
In addition, we comprehensively revealed many prognosis-relevant genomic events. In this study, we observed that mutation of EYS, as well as gain of MLST8 and MAP2K2, could prolong OS, while mutation of USH2, loss of DKK1, APC, MCC, and SMAD4, and methylation of TBX1 were linked to unfavorable prognosis. In addition, the prognostic value of some commutations was revealed for the first time. Commutation of APC-TP53 demonstrated favorable DFS, and commutation of APC-KRAS, KRAS-TP53, and KRAS-SYNE1 was significantly associated with poor DFS. Importantly, to facilitate clinical application, we identified three gene pairs with prognostic significance, FAM83A|IDO1, FABP4|KLK12, and FABP4|GBP5. FAM83A|IDO1 was best at predicting prognosis in 11 public datasets and our own cohort, and it was an independent prognostic factor for CRC. FAM83A|IDO1 also exhibited excellent performance in assessing the distant metastasis status in seven public datasets and our own cohort. Patients with FAM83A|high disease had a higher risk of metastasis than patients with IDO1|high disease. Traditionally, the batch effects of different platforms and the different cutoff values severely limit the clinical translation and application of biomarkers. In this study, we only focused on the mathematical relationship between the mRNA expression of two genes, which completely ignores the batch effects among different platforms and does not require definition of a cutoff value; it is just a binary relationship. Therefore, the relationship between FAM83A and IDO1 mRNA expression is a promising biomarker for predicting prognosis and metastasis in clinical applications.
Our study also has a few limitations. First, it analyzed multidimensional data of genomic alterations in CRC but lacked microscopic experimental verification. Second, the identification of the relationship between FAM83A and IDO1 mRNA expression as a biomarker focused on the mathematical relationship between two genes, but the biological relationship was not studied.
We described a novel molecular classification method for categorizing CRC into two clusters, suggesting intertumoral molecular variability. The two subtypes displayed distinct genomic drivers, prognoses, functional statuses, immune microenvironments, and MSI statuses, and targeting these differences might advance precise treatment and clinical management in CRC. Promisingly, we also identified and validated a robust and promising biomarker for predicting the prognosis and metastasis of CRC patients.
Data Availability Statement
The raw data supporting the conclusions of this article will be made available by the authors, without undue reservation.
Ethics Statement
The studies involving human participants were reviewed and approved by the human cancer tissues used in this study were approved by Ethnics Committee of The First Affiliated Hospital of Zhengzhou University in December 19, 2019, and the TRN is 2019-KW-423. The patients/participants provided their written informed consent to participate in this study.
Author Contributions
ZLiu made the conceptualization. ZS, QD, and XH were involved in the methodology. ZLiu, DJ, ZLi, and XH provided the resources. ZLiu and QD analyzed the data. ZLiu, YZ, and KW prepared the original draft and reviewed and edited the manuscript. KW supervised the study. All authors contributed to the article and approved the submitted version.
Funding
This work was supported by the National Natural Science Foundation of China (Grant no. U1904143).
Conflict of Interest
The authors declare that the research was conducted in the absence of any commercial or financial relationships that could be construed as a potential conflict of interest.
Supplementary Material
The Supplementary Material for this article can be found online at: https://www.frontiersin.org/articles/10.3389/fonc.2021.632430/full#supplementary-material
Supplementary Figure 1. Somatic mutation landscape in the TCGA-CRC cohort.
Supplementary Figure 2. The extraction of mutation signatures and generation of the mutation signature relevant subtypes in CRC. (A) Combining the cophenetic correlation coefficients and RSS curve, it was decided that rank = 8 was optimal in NMF clustering analysis. (B) The correlation analysis of de novo mutational signatures and curated signatures in COSMIC using cosine similarity. The rows are de novo mutational signatures and the columns are curated signatures in COSMIC. (C) The cumulative distribution functions (CDF) of consensus matrix for each k (k = 2~9, indicated by colors). (D) Proportion of ambiguous clustering (PAC) score, a low value of PAC implies a flat middle segment, allowing conjecture of the optimal k (k = 2) by the lowest PAC. (E) Recommended number of clusters using 26 criteria of Nbclust package. (F) Kaplan–Meier analysis for DFS between MSC-1 and MSC-2 within 5 years. (G) The relative proportion of eight mutation signatures between MSC-1 and MSC-2.
Supplementary Figure 3. The mutation drivers and MMR genes in CRC. (A) The distribution of tumor mutation burden (TMB) between two subtypes. (B) The mutation co-occurrence and exclusive relationships of 28 candidate driven genes. Co-occurrence, green; Exclusion, brown. (C) Kaplan-Meier survival analysis of APC-TP53 co-occurrence. (D) Mutational oncoplot of nine MMR genes between two subtypes.
Supplementary Figure 4. The driven segments identified from GISTIC algorithm in CRC. (A) The distribution of gain and loss load in arm-level and focal-level. (B) Oncoplot for the CNA of 39 driver segments in two subtypes, including 14 amplification segments (orange) and 25 deletion segments (purple). (C) The expression difference of CNA relevant oncogenes and tumor suppressive genes between gain (red) and no-gain (blue) groups or between loss (dark blue) and no-loss (orange) groups. ns, P > 0.05; *P < 0.05; ***P < 0.001. (D,E) Univariate Cox regression analysis of 16 CNA relevant oncogenes and tumor suppressive genes for OS (D) and DFS (E). (F) Kaplan-Meier survival analysis of MAP2K2 gain, as well as CNTN6, DKK1, APC, MCC, and SMAD4 loss.
Supplementary Figure 5. The methylation driven genes in CRC. (A) Kaplan–Meier survival analysis of TBX18, GREB1L, and CNNM1 methylation in MSC-1 and MSC-2, respectively. (B) The expression difference of 13 ssMDGs between two subtypes. (C) The methylation difference of 13 ssMDGs between two subtypes. ns, P > 0.05; *P < 0.05; **P < 0.01; ***P < 0.001.
Supplementary Figure 6. The difference of 10 immunogenicity relevant indicators between two subtypes. (A–K) The distribution of 10 immunogenicity relevant indicators in two subtypes, including CTA score (A), aneuploidy score (B), intratumor heterogeneity (C), number of segments (D), HRD (E), number of segments with LOH (F), fraction of segments with LOH (G), BCR Shannon (H), BCR richness (I), TCR Shannon (J), and TCR richness (K).
Supplementary Figure 7. The expression and regulation of immune checkpoint molecules (ICMs) in MSC-1 and MSC-2. (A) The expression difference of 37 stimulatory ICMs in two subtypes. (B) The expression difference of 23 inhibitory ICMs in two subtypes. ns, P > 0.05; *P < 0.05; **P < 0.01; ***P < 0.001. (C) The expression difference of ITGB2 between the mutation and wild groups. (D) The expression difference of CD40 between the gain and no-gain groups. (E,F) The expression difference of ITGB2 (E) and TNFRSF18 (F) between the loss and no-loss groups.
Supplementary Figure 8. The prognostic value of FABP4|GBP5 in seven cohorts. (A) Forest plot of GBP5-high vs. FABP4-high groups in seven cohorts. (B–H) Kaplan-Meier survival analysis of FABP4-high and GBP5-high in the GSE17536 (B), GSE17537 (C), GSE29621 (D), GSE38832 (E), GSE39084 (F), GSE39852 (G), and GSE71187 cohorts (H). *P < 0.05.
Supplementary Table 1. Basic information of datasets included in this study.
Supplementary Table 2. The details of indicators for the assessment of immunogenicity and antigen presentation capacity.
Supplementary Table 3. The details of 75 immunomodulator molecules.
Supplementary Table 4. The qRT-PCR results and prognosis information of 30 CRC patients in our cohorts.
Supplementary Table 5. The details of 28 mutation drivers.
Supplementary Table 6. The significant focal copy number amplification of CRC in the TCGA cohort.
Supplementary Table 7. The significant focal copy number deletion of CRC in the TCGA cohort.
Supplementary Table 8. The details of methylation driven genes (MDGs).
Supplementary Table 9. The univariate Cox regression of 69 methylation driven genes.
Supplementary Table 10. The results of differential expression analysis. *Differentially expressed genes (DEGs) are marked in red.
Supplementary Table 11. The multivariate Cox regression results of nine cohorts. *The gene pairs with P < 0.05 are marked in red.
References
1. Bray F, Ferlay J, Soerjomataram I, Siegel RL, Torre LA, Jemal A. Global cancer statistics 2018: GLOBOCAN estimates of incidence and mortality worldwide for 36 cancers in 185 countries. CA Cancer J Clin. (2018) 68:394–424. doi: 10.3322/caac.21492
2. Casado-Saenz E, Feliu J, Gomez-España MA, Sanchez-Gastaldo A, Garcia-Carbonero R. SEOM clinical guidelines for the treatment of advanced colorectal cancer 2013. Clin Transl Oncol. (2013) 15:996–1003. doi: 10.1007/s12094-013-1082-5
3. Le DT, Durham JN, Smith KN, Wang H, Bartlett BR, Aulakh LK, et al. Mismatch repair deficiency predicts response of solid tumors to PD-1 blockade. Science. (2017) 357:409–13. doi: 10.1126/science.aan6733
4. Piñeros M, Parkin DM, Ward K, Chokunonga E, Ervik M, Farrugia H, et al. Essential TNM: a registry tool to reduce gaps in cancer staging information. Lancet Oncol. (2019) 20:e103–11. doi: 10.1016/S1470-2045(18)30897-0
5. Zhang B, Wang J, Wang X, Zhu J, Liu Q, Shi Z, et al. Proteogenomic characterization of human colon and rectal cancer. Nature. (2014) 513:382–7. doi: 10.1038/nature13438
6. Guinney J, Dienstmann R, Wang X, de Reyniès A, Schlicker A, Soneson C, et al. The consensus molecular subtypes of colorectal cancer. Nat Med. (2015) 21:1350–6. doi: 10.1038/nm.3967
7. Dienstmann R, Vermeulen L, Guinney J, Kopetz S, Tejpar S, Tabernero J. Consensus molecular subtypes and the evolution of precision medicine in colorectal cancer. Nat Rev Cancer. (2017) 17:79–92. doi: 10.1038/nrc.2016.126
8. Aguilera O, Serna-Blasco R. Targeting KRAS Mutant CMS3 Subtype by Metabolic Inhibitors. Adv Exp Med Biol. (2018) 1110:23–34. doi: 10.1007/978-3-030-02771-1_3
9. Lal N, White BS, Goussous G, Pickles O, Mason MJ, Beggs AD, et al. KRAS mutation and consensus molecular subtypes 2 and 3 are independently associated with reduced immune infiltration and reactivity in colorectal cancer. Clin Cancer Res. (2018) 24:224–33. doi: 10.1158/1078-0432.CCR-17-1090
10. Linnekamp JF, Hooff SRV, Prasetyanti PR, Kandimalla R, Buikhuisen JY, Fessler E, et al. Consensus molecular subtypes of colorectal cancer are recapitulated in in vitro and in vivo models. Cell Death Differ. (2018) 25:616–33. doi: 10.1038/s41418-017-0011-5
11. Smeby J, Sveen A, Bergsland CH, Eilertsen IA, Danielsen SA, Eide PW, et al. Exploratory analyses of consensus molecular subtype-dependent associations of TP53 mutations with immunomodulation and prognosis in colorectal cancer. ESMO Open. (2019) 4:e000523. doi: 10.1136/esmoopen-2019-000523
12. Smeby J, Sveen A, Merok MA, Danielsen SA, Eilertsen IA, Guren MG, et al. CMS-dependent prognostic impact of KRAS and BRAFV600E mutations in primary colorectal cancer. Ann Oncol. (2018) 29:1227–34. doi: 10.1093/annonc/mdy085
13. Willauer AN, Liu Y, Pereira AAL, Lam M, Morris JS, Raghav KPS, et al. Clinical and molecular characterization of early-onset colorectal cancer. Cancer. (2019) 125:2002–10. doi: 10.1002/cncr.31994
14. Alexandrov LB, Jones PH, Wedge DC, Sale JE, Campbell PJ, Nik-Zainal S, et al. Clock-like mutational processes in human somatic cells. Nat Genet. (2015) 47:1402–7. doi: 10.1038/ng.3441
15. Prahallad A, Sun C, Huang S, Di Nicolantonio F, Salazar R, Zecchin D, et al. Unresponsiveness of colon cancer to BRAF(V600E) inhibition through feedback activation of EGFR. Nature. (2012) 483:100–3. doi: 10.1038/nature10868
16. Douillard JY, Siena S, Cassidy J, Tabernero J, Burkes R, Barugel M, et al. Randomized, phase III trial of panitumumab with infusional fluorouracil, leucovorin, and oxaliplatin (FOLFOX4) versus FOLFOX4 alone as first-line treatment in patients with previously untreated metastatic colorectal cancer: the PRIME study. J Clin Oncol. (2010) 28:4697–705. doi: 10.1200/JCO.2009.27.4860
17. Sartore-Bianchi A, Ardini E, Bosotti R, Amatu A, Valtorta E, Somaschini A, et al. Sensitivity to entrectinib associated with a novel LMNA-NTRK1 gene fusion in metastatic colorectal cancer. J Natl Cancer Inst. (2016) 108:djv306. doi: 10.1093/jnci/djv306
18. Mayakonda A, Lin DC, Assenov Y, Plass C, Koeffler HP. Maftools: efficient and comprehensive analysis of somatic variants in cancer. Genome Res. (2018) 28:1747–56. doi: 10.1101/gr.239244.118
19. Alexandrov LB, Nik-Zainal S, Wedge DC, Aparicio SA, Behjati S, Biankin AV, et al. Signatures of mutational processes in human cancer. Nature. (2013) 500:415–21. doi: 10.1038/nature12477
20. Kandoth C, McLellan MD, Vandin F, Ye K, Niu B, Lu C, et al. Mutational landscape and significance across 12 major cancer types. (2013) 502:333–9. doi: 10.1038/nature12634
21. Roberts SA, Lawrence MS, Klimczak LJ, Grimm SA, Fargo D, Stojanov P, et al. An APOBEC cytidine deaminase mutagenesis pattern is widespread in human cancers. Nat Genet. (2013) 45:970–6. doi: 10.1038/ng.2702
22. Wilkerson MD, Hayes DN. ConsensusClusterPlus: a class discovery tool with confidence assessments and item tracking. Bioinformatics. (2010) 26:1572–3. doi: 10.1093/bioinformatics/btq170
23. Şenbabaoglu Y, Michailidis G, Li JZ. Critical limitations of consensus clustering in class discovery. (2014) 4:1–13. doi: 10.1038/srep06207
24. Malika C, Ghazzali N, Boiteau V, Niknafs AJJSS. NbClust: an R package for determining the relevant number of clusters in a data Set. J Stat Softw. (2014) 61:1–36. doi: 10.18637/jss.v061.i06
25. Lawrence MS, Stojanov P, Polak P, Kryukov GV, Cibulskis K, Sivachenko A, et al. Mutational heterogeneity in cancer and the search for new cancer-associated genes. Nature. (2013) 499:214–8. doi: 10.1038/nature12213
26. Cedoz PL, Prunello M, Brennan K, Gevaert O. MethylMix 2.0: an R package for identifying DNA methylation genes. Bioinformatics. (2018) 34:3044–6. doi: 10.1093/bioinformatics/bty156
27. Charoentong P, Finotello F, Angelova M, Mayer C, Efremova M, Rieder D, et al. Pan-cancer immunogenomic analyses reveal genotype-immunophenotype relationships and predictors of response to checkpoint blockade. Cell Rep. (2017) 18:248–62. doi: 10.1016/j.celrep.2016.12.019
28. Thorsson V, Gibbs DL, Brown SD, Wolf D, Bortone DS, Ou Yang TH, et al. The immune landscape of cancer. Immunity. (2018) 48:812–30.e14. doi: 10.1016/j.immuni.2018.03.023
29. Aran D, Sirota M, Butte AJ. Systematic pan-cancer analysis of tumour purity. Nat Commun. (2015) 6:8971. doi: 10.1038/ncomms9971
30. Rooney MS, Shukla SA, Wu CJ, Getz G, Hacohen N. Molecular and genetic properties of tumors associated with local immune cytolytic activity. Cell. (2015) 160:48–61. doi: 10.1016/j.cell.2014.12.033
31. Wang S, He Z, Wang X, Li H, Liu XS. Antigen presentation and tumor immunogenicity in cancer immunotherapy response prediction. Elife. (2019) 8:e49020. doi: 10.7554/eLife.49020
32. Middlebrooks CD, Banday AR, Matsuda K, Udquim KI, Onabajo OO, Paquin A, et al. Association of germline variants in the APOBEC3 region with cancer risk and enrichment with APOBEC-signature mutations in tumors. Nat Genet. (2016) 48:1330–8. doi: 10.1038/ng.3670
33. Chang CC, Lin HH, Lin JK, Lin CC, Lan YT, Wang HS, et al. FBXW7 mutation analysis and its correlation with clinicopathological features and prognosis in colorectal cancer patients. Int J Biol Markers. (2015) 30:e88–95. doi: 10.5301/jbm.5000125
34. Chang YS, Lee CC, Ke TW, Chang CM, Chao DS, Huang HY, et al. Molecular characterization of colorectal cancer using whole-exome sequencing in a Taiwanese population. Cancer Med. (2019) 8:3738–47. doi: 10.1002/cam4.2282
35. Fedirko V, Mandle HB, Zhu W, Hughes DJ, Siddiq A, Ferrari P, et al. Vitamin D-related genes, blood vitamin D levels and colorectal cancer risk in western european populations. Nutrients. (2019) 11:1954. doi: 10.3390/nu11081954
36. Huang D, Sun W, Zhou Y, Li P, Chen F, Chen H, et al. Mutations of key driver genes in colorectal cancer progression and metastasis. Cancer Metastasis Rev. (2018) 37:173–87. doi: 10.1007/s10555-017-9726-5
37. Tanskanen T, Gylfe AE, Katainen R, Taipale M, Renkonen-Sinisalo L, Järvinen H, et al. Systematic search for rare variants in Finnish early-onset colorectal cancer patients. Cancer Genet. (2015) 208:35–40. doi: 10.1016/j.cancergen.2014.12.004
38. Tokunaga R, Xiu J, Goldberg RM, Philip PA, Seeber A, Battaglin F, et al. The impact of ARID1A mutation on molecular characteristics in colorectal cancer. Eur J Cancer. (2020) 140:119–29. doi: 10.1016/j.ejca.2020.09.006
39. Wolff RK, Hoffman MD, Wolff EC, Herrick JS, Sakoda LC, Samowitz WS, et al. Mutation analysis of adenomas and carcinomas of the colon: early and late drivers. Genes Chromosomes Cancer. (2018) 57:366–76. doi: 10.1002/gcc.22539
40. Vogelstein B, Papadopoulos N, Velculescu VE, Zhou S, Diaz LA Jr, Kinzler KW. Cancer genome landscapes. Science. (2013) 339:1546–58. doi: 10.1126/science.1235122
41. Cancer Genome Atlas Network. Comprehensive molecular characterization of human colon and rectal cancer. Nature. (2012) 487:330–7. doi: 10.1038/nature11252
42. Kiely M, Tse LA, Koka H, Wang D, Lee P, Wang F, et al. Age-related DNA methylation in paired normal and tumour breast tissue in Chinese breast cancer patients. Epigenetics. (2020) 24:1–15. doi: 10.1080/15592294.2020.1819661
43. Vilar E, Gruber SB. Microsatellite instability in colorectal cancer-the stable evidence. Nat Rev Clin Oncol. (2010) 7:153–62. doi: 10.1038/nrclinonc.2009.237
44. Van Cutsem E, Köhne CH, Hitre E, Zaluski J, Chang Chien CR, Makhson A, et al. Cetuximab and chemotherapy as initial treatment for metastatic colorectal cancer. N Engl J Med. (2009) 360:1408–17. doi: 10.1056/NEJMoa0805019
45. Liu H, Gu X, Wang G, Huang Y, Ju S, Huang J, et al. Copy number variations primed lncRNAs deregulation contribute to poor prognosis in colorectal cancer. Aging. (2019) 11:6089–108. doi: 10.18632/aging.102168
46. Ganesh K, Stadler ZK, Cercek A, Mendelsohn RB, Shia J, Segal NH, et al. Immunotherapy in colorectal cancer: rationale, challenges and potential. Nat Rev Gastroenterol Hepatol. (2019) 16:361–75. doi: 10.1038/s41575-019-0126-x
47. Feng Q, Liang L, Ren L, Chen J, Wei Y, Chang W, et al. A specific KRAS codon 13 mutation is an independent predictor for colorectal cancer metachronous distant metastases. Am J Cancer Res. (2015) 5:674–88. doi: 10.1158/2156-6976.am2015-674
48. Douillard JY, Oliner KS, Siena S, Tabernero J, Burkes R, Barugel M, et al. Panitumumab-FOLFOX4 treatment and RAS mutations in colorectal cancer. N Engl J Med. (2013) 369:1023–34. doi: 10.1056/NEJMoa1305275
49. Martínez-Jiménez F, Muiños F, Sentís I, Deu-Pons J, Reyes-Salazar I, Arnedo-Pac C, et al. A compendium of mutational cancer driver genes. Nat Rev Cancer. (2020) 20:555–72. doi: 10.1038/s41568-020-0290-x
50. Manic G, Obrist F, Sistigu A, Vitale I. Trial watch: targeting ATM-CHK2 and ATR-CHK1 pathways for anticancer therapy. Mol Cell Oncol. (2015) 2:e1012976. doi: 10.1080/23723556.2015.1012976
51. Kopetz S, Grothey A, Yaeger R, Van Cutsem E, Desai J, Yoshino T, et al. Encorafenib, binimetinib, and cetuximab in BRAF V600E-mutated colorectal cancer. N Engl J Med. (2019) 381:1632–43. doi: 10.1056/NEJMoa1908075
53. Ursini-Siegel J, Schade B, Cardiff RD, Muller WJ. Insights from transgenic mouse models of ERBB2-induced breast cancer. Nat Rev Cancer. (2007) 7:389–97. doi: 10.1038/nrc2127
54. Wang DS, Liu ZX, Lu YX, Bao H, Wu X, Zeng ZL, et al. Liquid biopsies to track trastuzumab resistance in metastatic HER2-positive gastric cancer. Gut. (2019) 68:1152–61. doi: 10.1136/gutjnl-2018-316522
55. Bertotti A, Migliardi G, Galimi F, Sassi F, Torti D, Isella C, et al. A molecularly annotated platform of patient-derived xenografts (“xenopatients”) identifies HER2 as an effective therapeutic target in cetuximab-resistant colorectal cancer. Cancer Discov. (2011) 1:508–23. doi: 10.1158/2159-8290.CD-11-0109
56. Heldin CH, Miyazono K, ten Dijke P. TGF-beta signalling from cell membrane to nucleus through SMAD proteins. Nature. (1997) 390:465–71. doi: 10.1038/37284
Keywords: genomic alteration, mutational signature, molecular subtype, colorectal cancer, prognosis, metastasis
Citation: Liu Z, Zhang Y, Dang Q, Wu K, Jiao D, Li Z, Sun Z and Han X (2021) Genomic Alteration Characterization in Colorectal Cancer Identifies a Prognostic and Metastasis Biomarker: FAM83A|IDO1. Front. Oncol. 11:632430. doi: 10.3389/fonc.2021.632430
Received: 23 November 2020; Accepted: 15 February 2021;
Published: 20 April 2021.
Edited by:
Gong Zhang, Jinan University, ChinaReviewed by:
Ming Dong, Chinese Academy of Sciences (CAS), ChinaWanting Liu, Jinan University, China
Copyright © 2021 Liu, Zhang, Dang, Wu, Jiao, Li, Sun and Han. This is an open-access article distributed under the terms of the Creative Commons Attribution License (CC BY). The use, distribution or reproduction in other forums is permitted, provided the original author(s) and the copyright owner(s) are credited and that the original publication in this journal is cited, in accordance with accepted academic practice. No use, distribution or reproduction is permitted which does not comply with these terms.
*Correspondence: Xinwei Han, ZmNjaGFueHdAenp1LmVkdS5jbg==; Zhenqiang Sun, enFzdW44MkBjc3UuZWR1LmNu; Zhen Li, bHpseWN0NjIwQDE2My5jb20=
†These authors have contributed equally to this work and share first authorship