 Yuyun Xu
 Zhenyu Shu
 Ge Song2
 Yijun Liu
 Peipei Pang
 Xuehua Wen
- 1Department of Radiology, Zhejiang Provincial People’s Hospital, Affiliated People’s Hospital of Hangzhou Medical College, Hangzhou, China
- 2Department of Radiology, Zhejiang Cancer Hospital, Hangzhou, China
- 3Department of Pharmaceuticals Diagnosis, GE Healthcare, Hangzhou, China
- 4Institute of Artificial Intelligence and Remote Imaging, Hangzhou Medical College, Hangzhou, China
Objective: This study aimed to develop and validate an integrated prediction model based on clinicoradiological data and computed tomography (CT)-radiomics for differentiating between benign and malignant parotid gland (PG) tumors via multicentre cohorts.
Materials and Methods: A cohort of 87 PG tumor patients from hospital #1 who were diagnosed between January 2017 and January 2020 were used for prediction model training. A total of 378 radiomic features were extracted from a single tumor region of interest (ROI) of each patient on each phase of CT images. Imaging features were extracted from plain CT and contrast-enhanced CT (CECT) images. After dimensionality reduction, a radiomics signature was constructed. A combination model was constructed by incorporating the rad-score and CT radiological features. An independent group of 38 patients from hospital #2 was used to validate the prediction models. The model performances were evaluated by receiver operating characteristic (ROC) curve analysis, and decision curve analysis (DCA) was used to evaluate the clinical effectiveness of the models. The radiomics signature model was constructed and the rad-score was calculated based on selected imaging features from plain CT and CECT images.
Results: Analysis of variance and multivariable logistic regression analysis showed that location, lymph node metastases, and rad-score were independent predictors of tumor malignant status. The ROC curves showed that the accuracy of the support vector machine (SVM)-based prediction model, radiomics signature, location and lymph node status in the training set was 0.854, 0.772, 0.679, and 0.632, respectively; specificity was 0.869, 0.878, 0.734, and 0.773; and sensitivity was 0.731, 0.808, 0.723, and 0.742. In the test set, the accuracy was 0.835, 0.771, 0.653, and 0.608, respectively; the specificity was 0.741, 0.889, 0.852, and 0.812; and the sensitivity was 0.818, 0.790, 0.731, and 0.716.
Conclusions: The combination model based on the radiomics signature and CT radiological features is capable of evaluating the malignancy of PG tumors and can help clinicians guide clinical tumor management.
Introduction
Background
Parotid gland (PG) tumors are rare and account for approximately 1%–3% of all head and neck tumors (1). Parotid tumors are a clinically, morphologically, radiologically diverse group of neoplasms that may present significant diagnostic and management challenges. Radical tumor resection with lymph node dissection remains the mainstay treatment for malignant parotid tumors, followed by adjuvant chemotherapy and radiotherapy (2). Knowledge of the clinical information and imaging characteristics before surgery would be of outstanding importance for evaluating these tumors, tailoring treatment decisions and optimizing individualized surgical plans. Additionally, for malignancies, preoperative knowledge of the tumor type would also be of paramount importance.
Currently, multiple imaging techniques are available to study the parotid region, such as ultrasound, computed tomography (CT), and magnetic resonance imaging (MRI). Although CT is not a first-line method for parotid gland tumor evaluation, it can be used to help clinicians evaluate PG tumors to confirm the presence of a parotid mass, assess the extent of tumor especially in the deep lobe, and detect enlarged lymph nodes, to facilitate the determination of benign or malignant nature of the tumor for appropriate treatment. However, CT involves radiation, and various neoplasms may have similar imaging features on CT (3, 4). Furthermore, contrast-enhanced CT may cause contrast-induced adverse reactions, though it is generally considered safe, with an overall prevalence of adverse reactions around 0.7%, among which most of the events (more than 80%) are mild (5). Ultrasound is a cheap and effective tool for delineating cystic versus solid tumors, tumor borders, and cervical lymph nodes; however, it poorly visualizes the deep lobe and is dependent on operator expertise. MRI has sufficiently high resolution to detect and evaluate parotid tumors noninvasively. As a functional MRI technique, DWI can be used to explore the diffusion changes in composition of tissues, which is helpful for parotid tumor detection and differential diagnosis (6). Nevertheless, its disadvantages include limited availability for patients with metal prostheses, high cost and long waiting times. Fine-needle aspiration biopsy (FNAB) is an accurate method for identifying the nature of these tumors; however, FNAB is invasive and may cause hemorrhage, facial nerve injury, and acute sialadenitis at the needle puncture site (7, 8). In addition, there are significant variations in the performance of FNAB within different practice settings which is associated with inadequate diagnoses and missed malignancies, with a sensitivity for detecting malignancy between 70% and 80% and non-diagnostic rates average at 14%–18% (9).Thus, challenges remain in non-invasively and accurately distinguishing benign from malignant lesions on pre-operative CT images.
Radiomics is new method of mining objective and quantitative features such as the shape, intensity, and energy of regions of interest from medical images (e.g., gray-level co-occurrence matrix (GLCM) and run length matrix (RLM) features), describing the relationships between image voxels far beyond the traditional visual features we can obtain and thus reflecting the underlying genetic and biological variability of the analyzed tissue, which can promote accurate diagnosis and individualize cancer treatment (10). Recent studies describe the use of radiomic analysis for head and neck tumors (11), glioblastoma (12), breast cancer (13), rectal cancer (14), hepatocellular carcinoma (15), etc. These studies demonstrated that radiomic features are closely associated with the histopathological types, grading and prognosis of tumors and can help solve many clinical problems and optimize patient treatment. A previous study (16) used energy spectrum CT, which is not commonly used, in the tissue classification of benign parotid tumors and demonstrated good discrimination ability.
However, as mentioned above, it is difficult to distinguish benign from malignant PG tumors with conventional CT images, but considering the novelty of radiomics and the powerful performance of tumor differential diagnosis in other field, we hypothesize that radiomics analysis based on conventional CT images can be used to distinguish between benign and malignant PG tumors. The purpose of this study is to utilize conventional CT images to extract PG tumor-related radiomic features and combine them with conventional radiological features to build a classification model for distinguishing benign and malignant PG tumors.
Material and Methods
This retrospective study was approved by Ethics Committee of Zhejiang Provincial People’s Hospital. All patients’ informed consents were waived for the retrospective nature of this study.
The research method was carried out in accordance with the relevant guidelines and regulations. Patients’ clinical and image data were obtained from routine clinical records and the picture archiving and communication systems (PACS) of the hospital.
Patient Population
A retrospective review of clinical and radiological databases was performed from January 1, 2017, to January 30, 2020, in hospital #1 and from Jan 1, 2019, to January 30, 2020, in hospital #2. The inclusion criteria were as follows: (1) patients with PG-related symptoms or masses; (2) confirmation of the PG tumor by surgery and postoperative pathological diagnosis; and (3) non-contrast computed tomography (NCCT) and contrast enhanced computed tomography (CECT) images of the head and neck containing the PG obtained within 2 weeks before the operation. The exclusion criteria were as follows: (1) CECT images with obvious artifacts, such as artifacts from false teeth, motion artifacts, etc.; (2) fine needle aspiration performed before imaging of the PG; or (3) patients with parotid lesions less than 1.0 cm in diameter. Medical records from 208 patients were initially analyzed, and 125 patients were finally included in this study (see Figure 1 for details). In order to know whether there is selection bias, a comparison between the included and excluded dataset were performed.
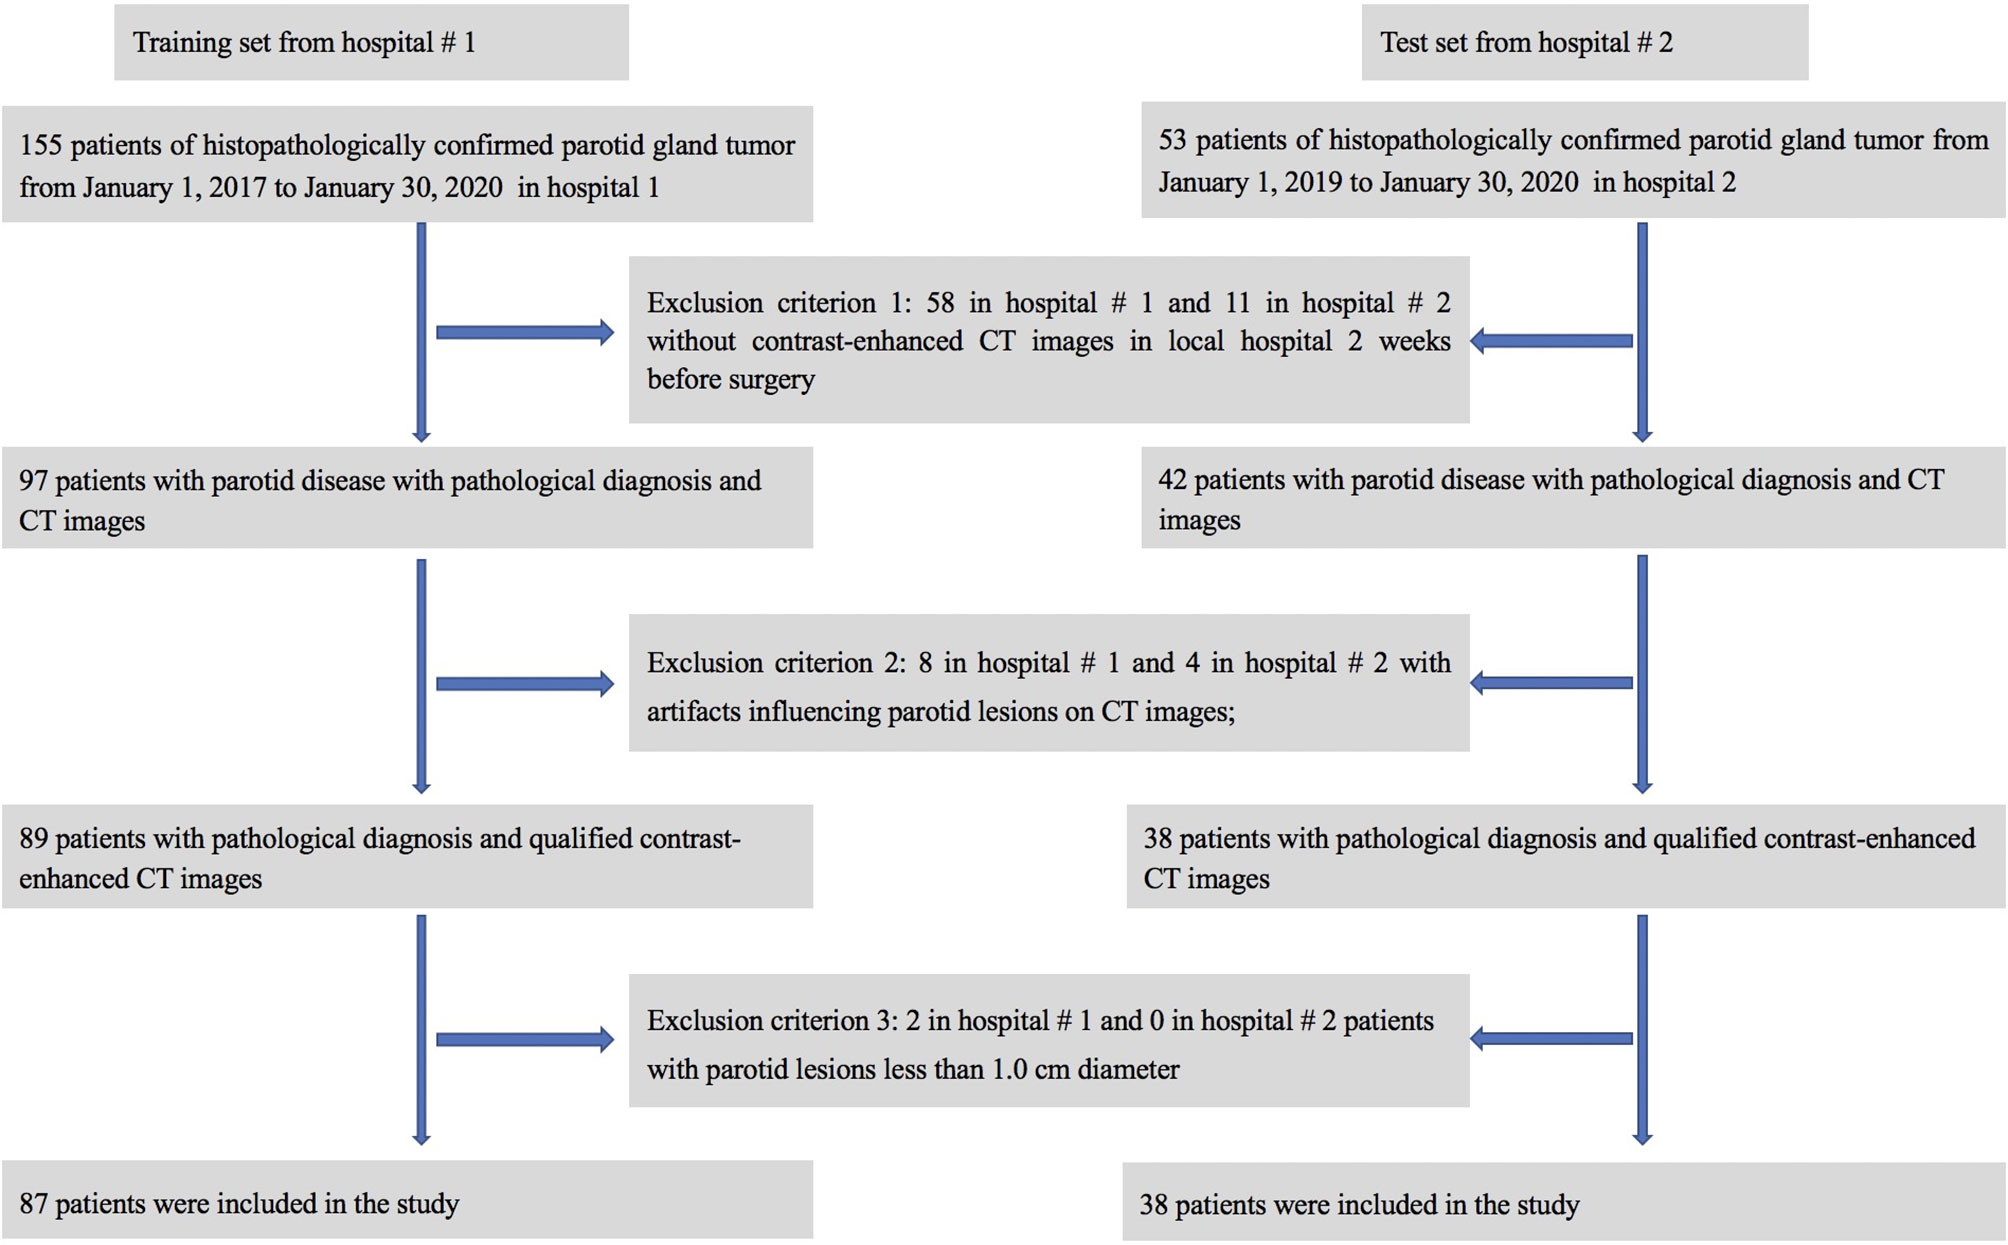
Figure 1 Flow chart for patient selection in this study.
CT scans were performed with a multi-slice CT scanner (Siemens 40) or a 64 multidetector scanners (LightSpeed VCT; GE Healthcare, Waukesha, WI, USA) with the following parameters: tube voltage of 120 kVp; tube current of 150 mA; section thickness of 3 mm; and section interval of 3 mm. The scanning ranged from the base of the skull to the inlet of the thorax. The CECT images were obtained after an intravenous injection of 80–100 ml of nonionic iodinated iopamidol containing 370 mg iodine per ml (Isovue 370, Bracco Healthcare, Princeton, NJ) at 3–4 ml/s. Arterial-phase CECT images were obtained 35 seconds after contrast material injection.
Clinical and Radiological Data Analysis
Clinical parameters, including age, sex, disease duration, and smoking status, were collected from the hospital medical record system. All original CT images were reviewed and assessed by two experienced head and neck radiologists who were blinded to the clinical data, including tumor location (in the deep or shallow parotid), maximum diameter, distribution (single or bilateral), shape (round or not), capsule (with or without), regularity (regular or irregular), margin (clear or unclear), density (hypo-, iso-, or hyperdense), enhancement (enhanced or non-enhanced), cystic degeneration (with or without), lymph node metastasis (with or without), hemorrhage (with or without), calcification (with or without), and enhancement type (slight-moderate or obvious). The definition of some radiological features can be found in the Supplementary Material. Discordant interobserver interpretations were resolved by consensus. If there were multiple lesions in the parotid gland, the largest lesion with confirmed pathology was chosen for the analysis.
Image Preprocessing
All NCCT and CECT images were stored in Digital Imaging and Communications in Medicine (DICOM) format and imported to ITK-SNAP software for three-dimensional manual segmentation of the region of interest (ROI). The ROI of each case was manually drawn on the CECT images by two independent head & neck radiologists (Radiologist X with 11 years of experience and Radiologist W with 6 years of experience) who were blinded to the clinical information, carefully avoiding the vessels, bones and lymph nodes. All ROIs were then replicated to the NCCT images, and manual correction was also performed to adjust small deviations in delineating the ROI boundaries. All ROIs from the NCCT and CECT images were uploaded into AK analysis software (Artificial Intelligence Kit V3.0.0. R, GE Healthcare) for feature extraction. To eliminate the potential impact of different imaging parameters on the extracted features, we preprocessed the segmented images, including resampling the images to 1×1 ×1 mm3 voxel size, intensity normalizing, and standardizing the gray levels to range from 1 to 32 (17).
Radiomics Feature Selection
The preprocessed images were used to extract the radiomics features, including the histogram, Haralick, FormFactor, gray level co-occurrence matrix (GLCM), run length matrix (RLM) and gray level size zone matrix (GLZSM) features. In this study, a joint feature set was obtained from both the NCCT and CECT images. The most robust features of the two separate ROI datasets from the two radiologists were used to ensure the reproducibility and repeatability of the radiomics features (18). Spearman’s rank test was utilized to evaluate the correlation coefficients between the features of the datasets segmented by Radiologist X and Radiologist W. Any features that had correlation coefficients greater than 0.8 were defined as “robust” features (19). A large quantity of features with a limited sample size may hinder the predictive ability of the model, especially in a high-dimensional feature space, owing to the “curse of dimensions” (20); therefore, the dimensions of the extracted features were reduced to address this issue. Analysis of variance was first performed on the extracted features to select those features that were statistically significant. Subsequently, the minimum redundancy maximum correlation (mRMR) algorithm was used to reduce the dimensions of the selected features as well as to select the features that had the highest correlation with the tumor classification and had the smallest redundancy between one another. After that, the emerging gradient boosting decision tree (GBDT) algorithm was used to further reduce the dimensionality of the preselected features. In this study, feature selections were performed on both the NCCT and CECT images of all cases and finally obtained a joint feature set containing NCCT and CECT image features. Based on these selected features, logistic regression was used to construct the radiomics signature.
To determine the correlation between the radiomics signature and tumor classification, a logistic regression (LR)-based signature model based on the combined feature set was used to calculate a score to reflect the actual tumor classification in the training set, defined as the rad-score, which was then used to determine the effectiveness of the signature models in differentiating between patients with benign and malignant parotid tumors. The formula of the model used in the training set was then employed to calculate the scores for the test set.
The area under the curve (AUC) of the receiver operating characteristic (ROC) curve was used to evaluate the accuracy of the radiomics signature in both the training and validation sets. The calibration performance was assessed with the calibration curve for the continuous variables. Furthermore, decision curve analysis (DCA) was used to assess the clinical efficiency of the radiomics signature in classifying the tumor by calculating the net benefit.
Prediction Model Construction and Validation
One-way analysis of variance was performed for each potential predictor variable including clinical characteristics, radiological characteristics, and the radiomics signature in the training group, and then multivariable logistic regression was used on the preselected features with significant differences to obtain the predictors that were ultimately employed for model construction. As machine learning can provide highly accurate and reliable models to improve clinical oncology decisions, in this study, we chose a support vector machine (SVM) to build a combined prediction model based on the selected predictors. The performance of the model was validated with the training set and the test set separately, including calibration performance assessed with the calibration curve, diagnostic accuracy using ROC analysis and net benefit evaluated by DCA. In addition, the tumor prediction value of each patient in the training set and test set was calculated according to the model, the cut-off value of the ROC curve was used to divide parotid tumors into low-risk and high-risk groups, and the clinical effectiveness was determined by the actual tumor classification in the different groups. Figure 2 shows the workflow of this study.
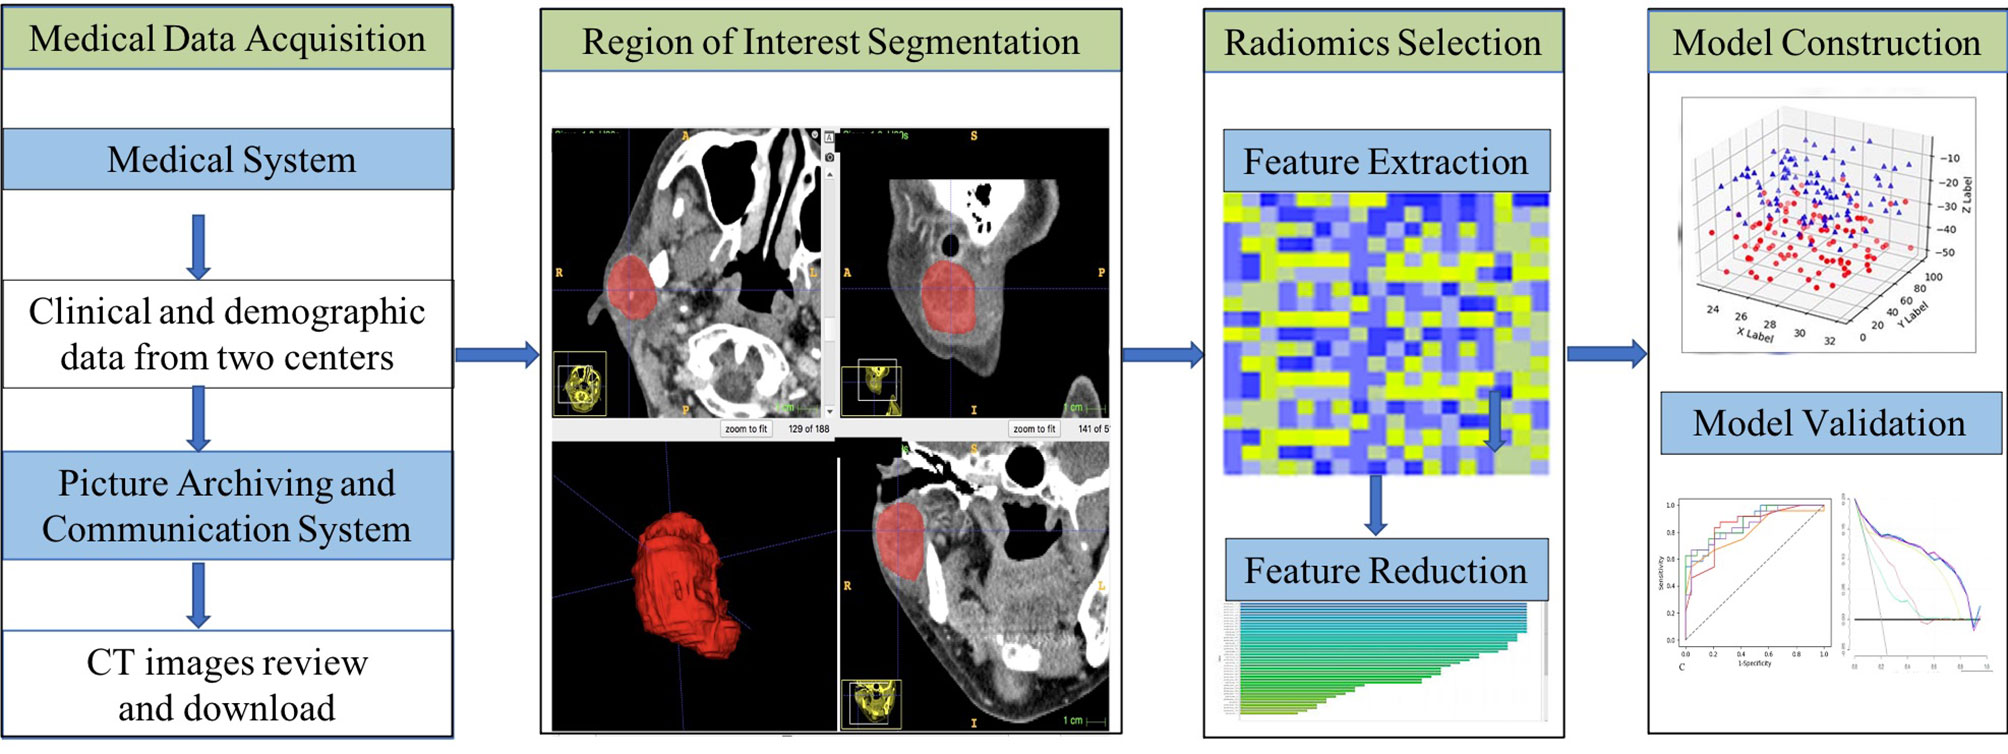
Figure 2 Workflow of this study.
Statistics Analysis
SPSS 17.0 software (IBM, Chicago, IL, USA) was used to evaluate the normality of the distribution of the dataset using the Kolmogorov-Smirnov test and to perform the chi-square test for the categorical data. The T test is used for normally distributed variables, and the Mann-Whitney test is used for non-normally distributed variables. The conditional forward stepwise selection method was applied for the multivariable logistic regression model. MedCalc15.8 software (MedCalc, Ostend, Belgium) was used to assess the ROC curves for the diagnostic performance of the models, and differences between the various AUCs were compared with the DeLong test. R statistical software was used for all other statistical analyses. The “mRMRe” and “gbm” packages were used for mRMR and GBDT analyses, respectively. DCA plots were generated with the “dca. R” package. Two-tailed p-values less than 0.05 were considered statistically significant.
Results
Clinical Features
A total of 125 patients (63 male and 62 female) with PG tumors were included from two medical centers. The results showed that there was no significant difference between the included and excluded datasets (see Table 1 in the Supplementary Materials for details). Seventeen different tumor types were represented, most of which were benign tumors, especially pleomorphic adenomas and Warthin tumors. The details of the PG tumors are shown in Table 1. The clinical and radiological features of the patients in the training set and test set are shown in Table 2. No statistically significant difference was found for any of the data between the two groups. In the training set, the tumor location and borders and lymph node status were significantly different between benign and malignant PG tumors. In the test group, there were significant differences only in tumor location (Table 3). Figure 3 shows an example of radiological feature analysis of two cases.
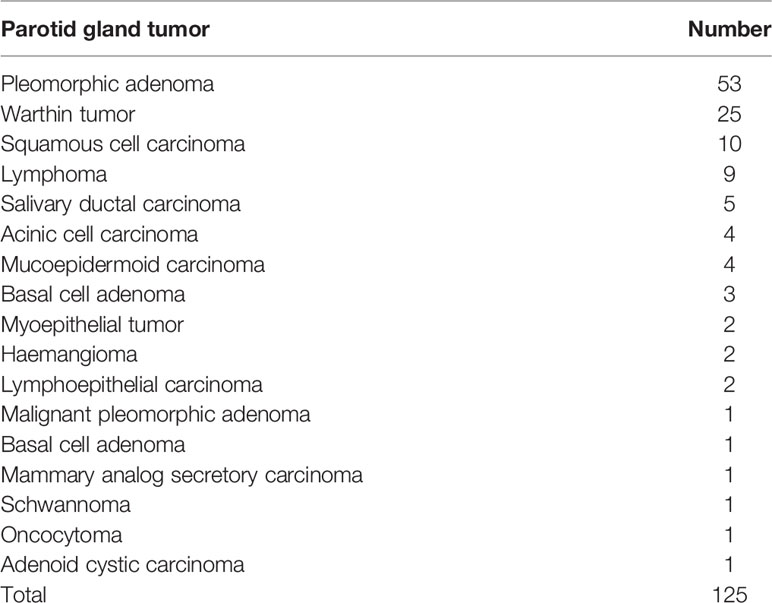
Table 1 Details of the parotid tumors.
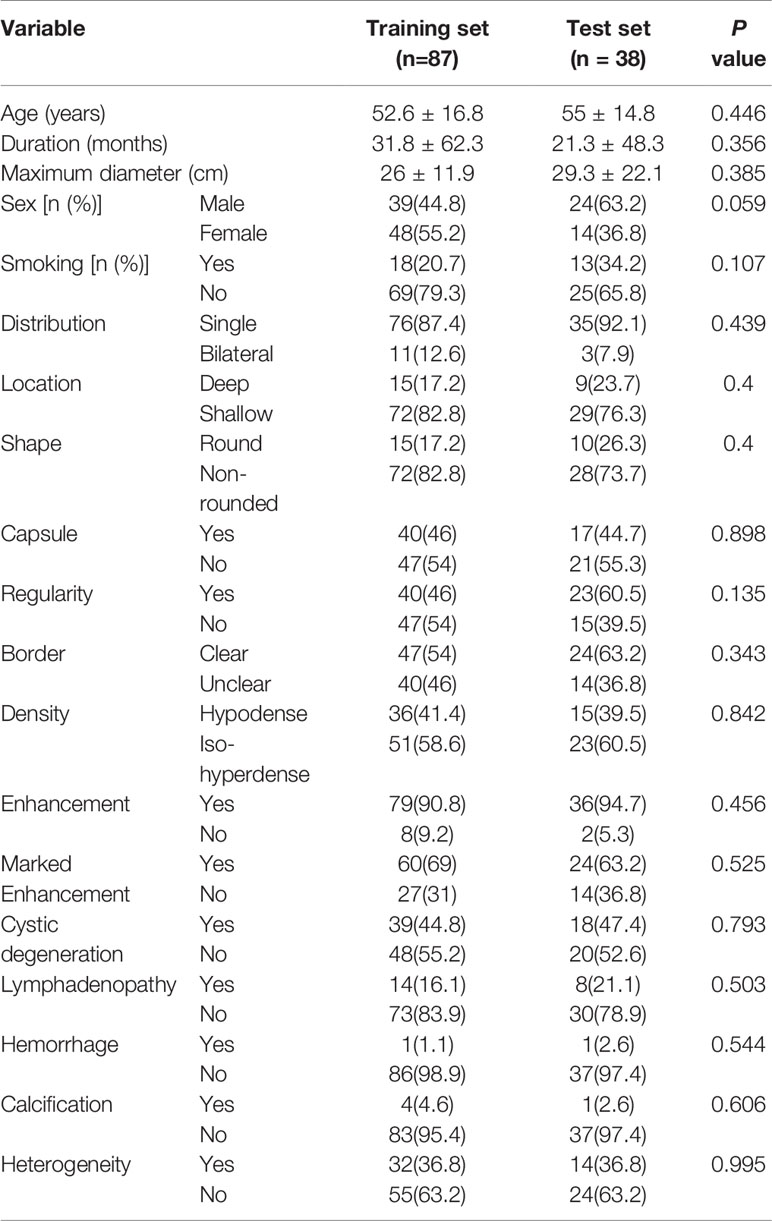
Table 2 Clinical and radiological characteristics of patients in the training and test sets.
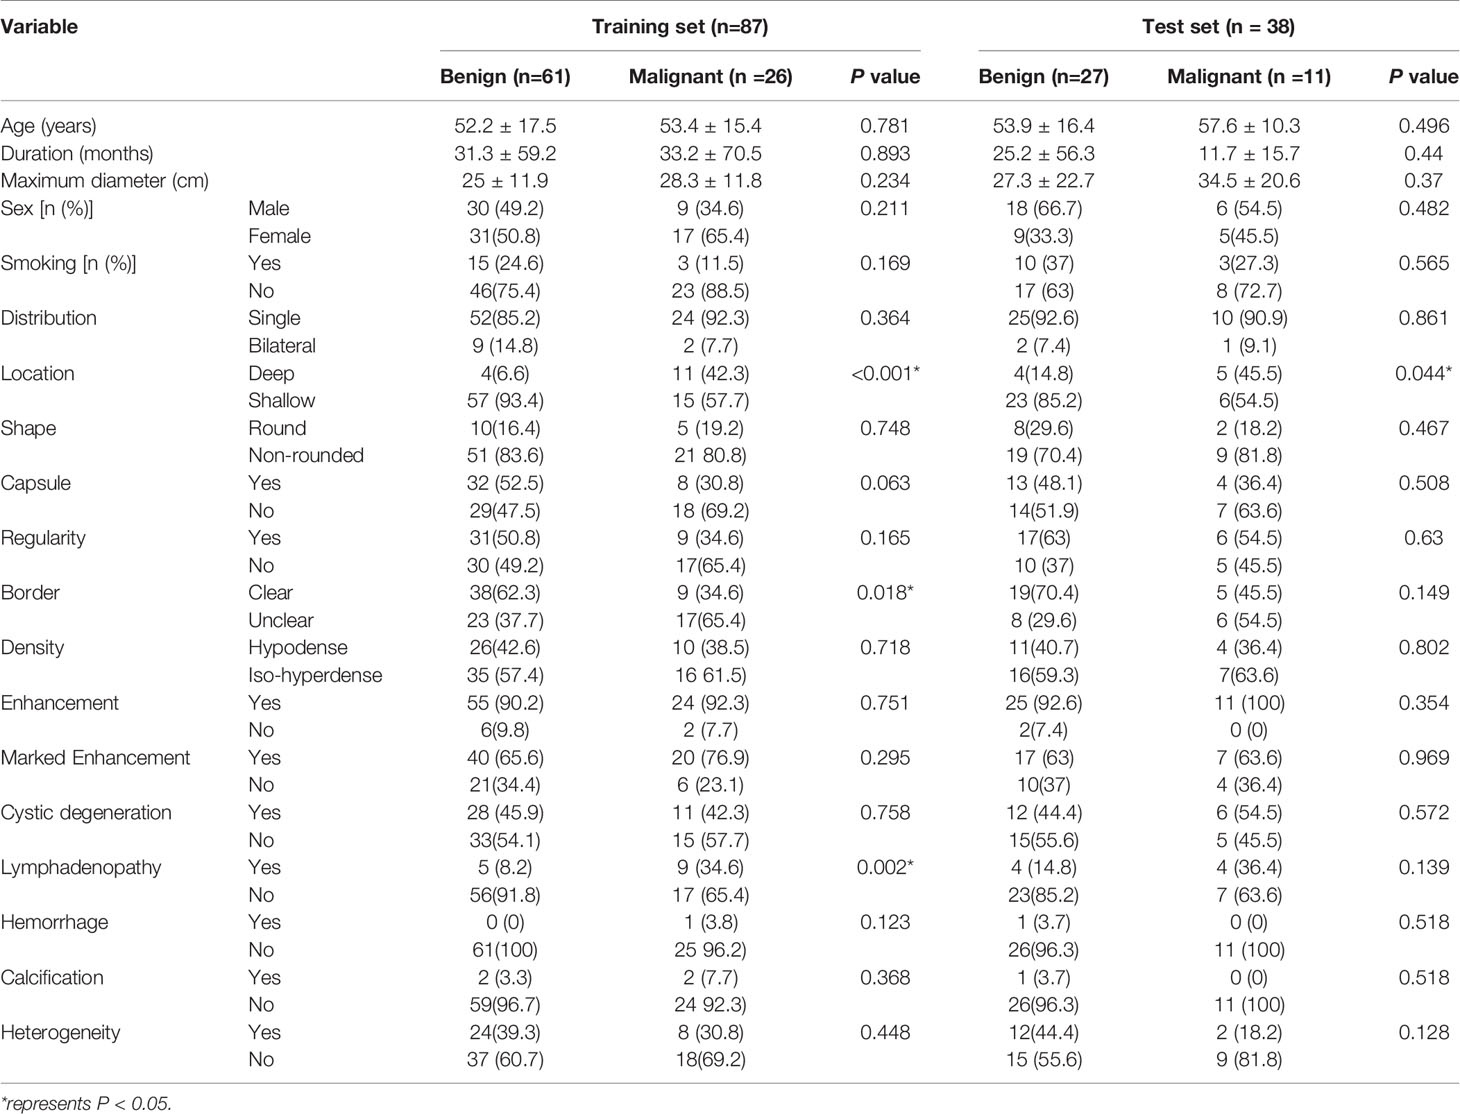
Table 3 Clinical and radiological characteristics between benign and malignant parotid gland tumors in the training and test sets.
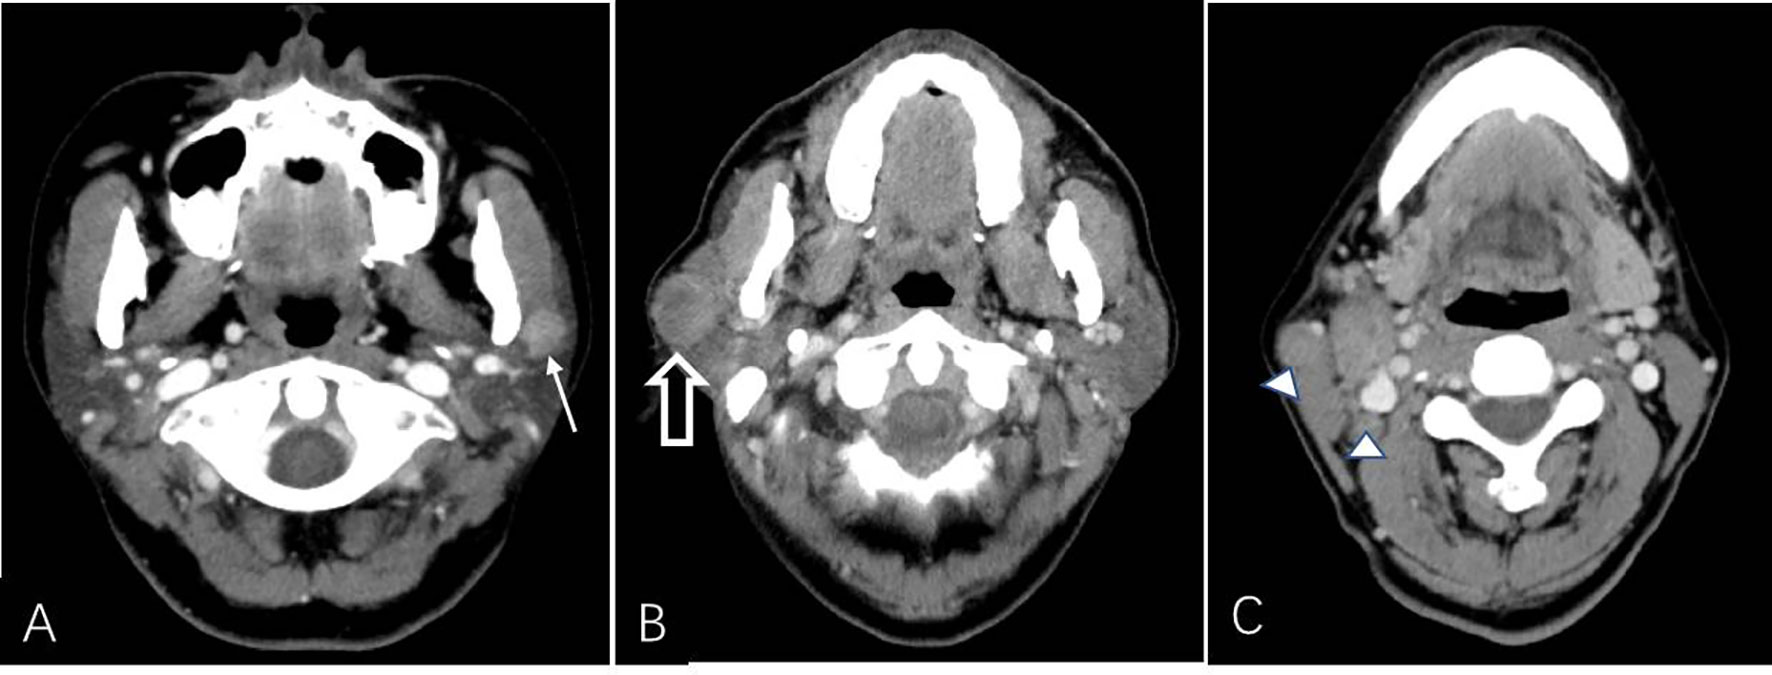
Figure 3 CT example images of benign and malignant parotid tumors. (A) Axial plain CT image of a 60-year-old male patient without a smoking history presenting with a left neck mass (solid white arrow). The patient had undergone parotidectomy 3 days after CT examination, and the mass was histopathologically confirmed as a Warthin tumor. (B, C) Axial contrast-enhanced CT image of a 59-year-old male patient with a 20-year smoking history presenting with a right neck mass (open white arrow, B) that was surgically removed and histopathologically confirmed as a salivary ductal carcinoma with lymph node metastasis (△, C). The mass shows heterogeneous enhancement with an irregular and unclear border.
Radiomics Signature Construction and Validation
A total of 378 radiomics features were extracted from a single ROI; thus, 756 radiomics features were extracted from each patient in the two scan phases. Among these features, 14 retained after feature dimensionality reduction, including 5 features from NCCT images (HaralickCorrelation_angle45_offset7_P, Inertia_angle45_offset7_P, LongRunEmphasis_angle135_offset1_P, uniformity_P, Percentile5_P) and 9 features from CECT images (Correlation_AllDirection_offset7_SD_A, Correlation_angle90_offset1_A, GLCMEnergy_AllDirection_offset7_SD_A, GreyLevelNonuniformity_AllDirection_offset1_SD_A, HaralickCorrelation_AllDirection_offset1_SD_A, HighGreyLevelRunEmphasis_AllDirection_offset7_SD_A, HighIntensitySmallAreaEmphasis_A, kurtosis_A, ShortRunEmphasis_angle0_offset1_A). Logistic regression was used to construct the radiomics signature. The rad-scores were significantly different between the training group and the test group. The predictive effects of the two groups of patients were favorable, with AUCs of 0.772 and 0.771, specificities of 0.878 and 0.889, and sensitivities of 0.808 and 0.790, respectively (see Figure 4 for details). Detailed information about the dimensionality reduction procedures and results can be found in the Supplementary Materials.
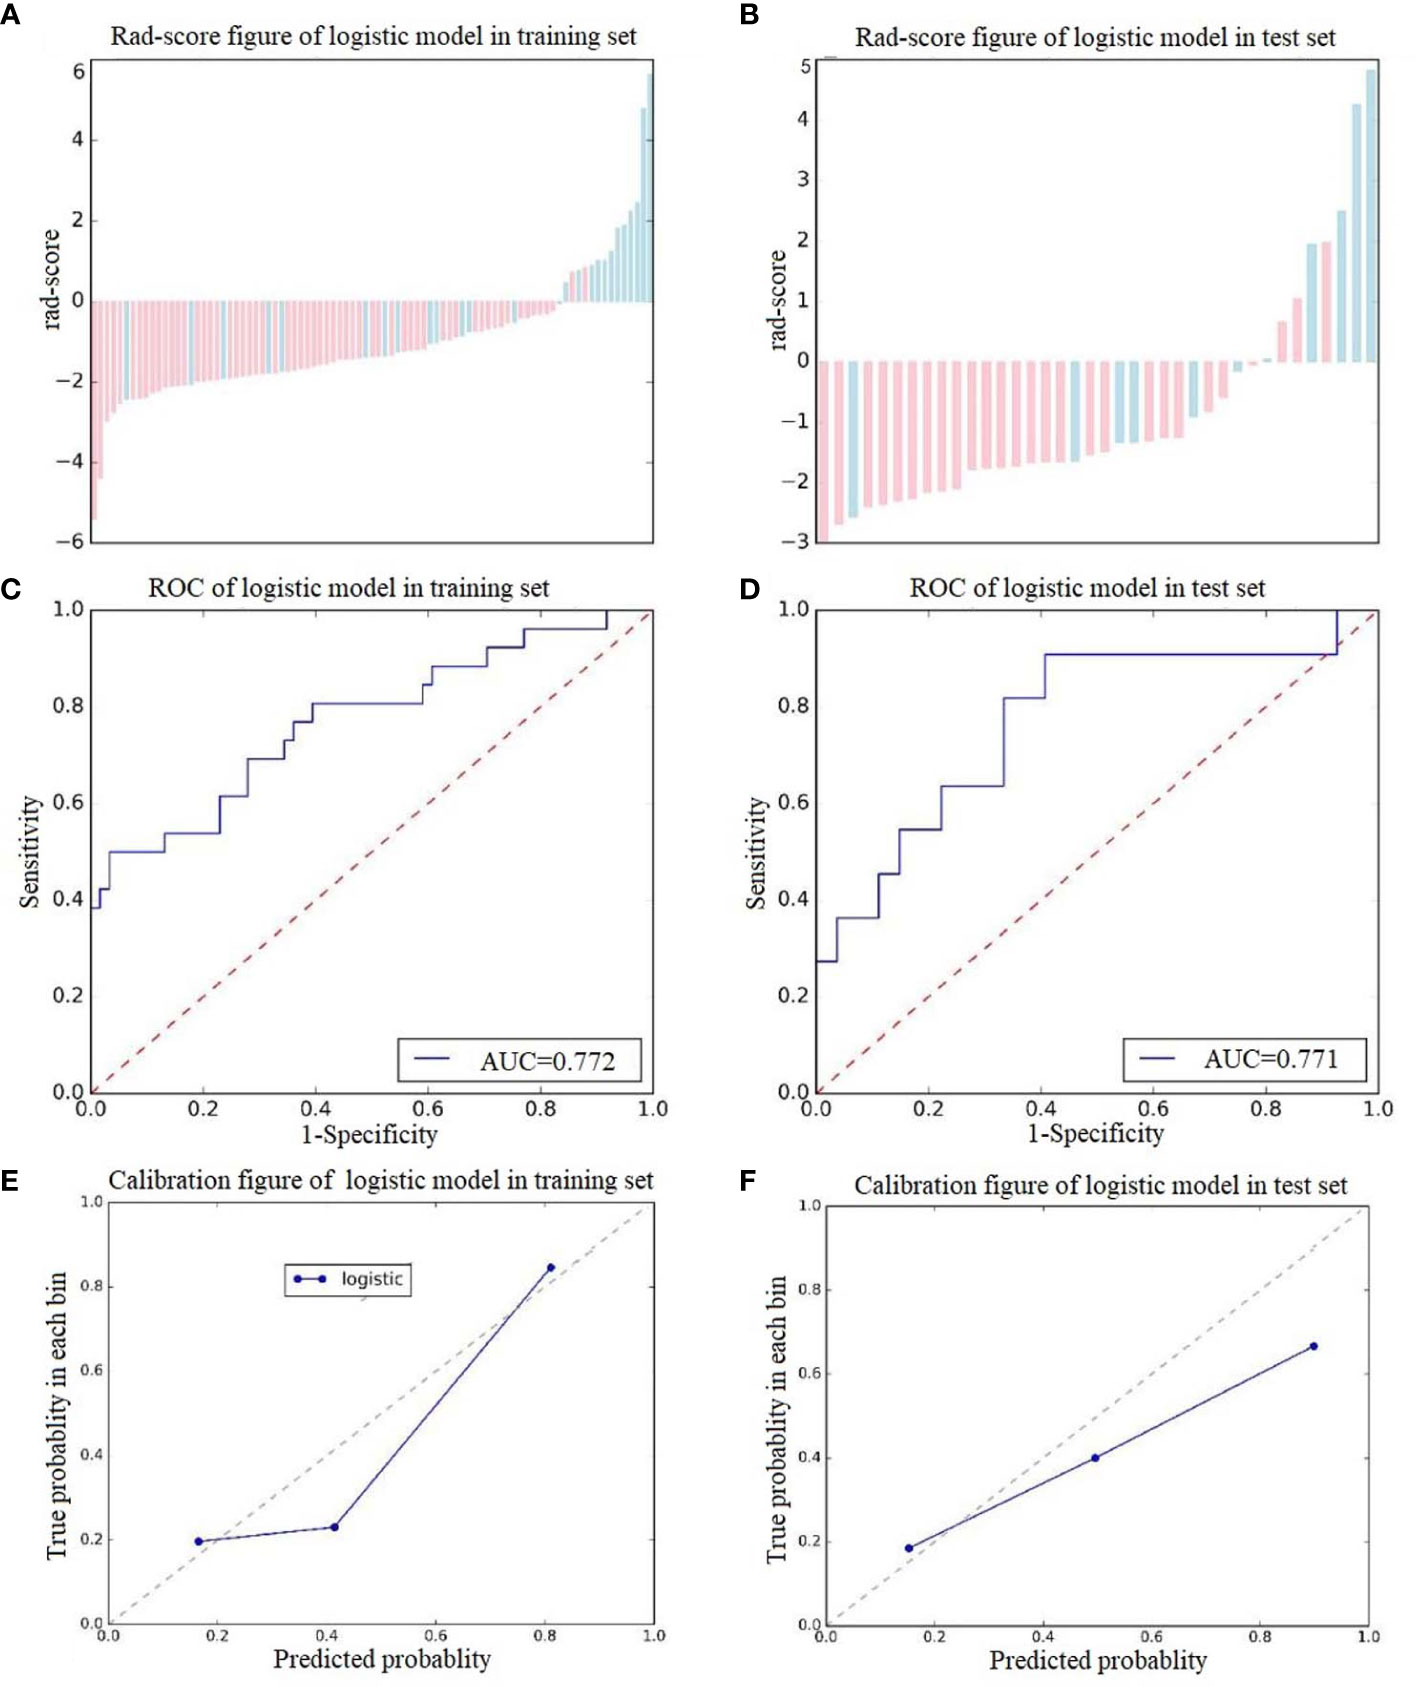
Figure 4 Score diagrams of the radiomics signature in (A) the training set and (B) the test set. (C, D) show the diagnostic accuracy of the rad-score of the radiomics signature in the training and test groups. (E, F) show the calibration curve of the radiomics signature in the training and test sets.
Classification Model Construction and Validation
Analysis of variance and multivariable logistic regression analysis showed that location, lymph node status, and rad-score were independent predictors of benign and malignant tumors. See Table 4 for details. ROC curve analysis shows that the accuracy of the SVM-based prediction model, radiomics signature, location and lymph node status in the training set was 0.854, 0.772, 0.679, and 0.632, respectively; the specificity was 0.869, 0.878, 0.734, and 0.773; and the sensitivity was 0.731, 0.808, 0.723 and 0.742. In the test set, the accuracy was 0.835, 0.771, 0.653, and 0.608, respectively; the specificity was 0.741, 0.889, 0.852, and 0.812; and the sensitivity was 0.818, 0.790, 0.731, and 0.716. Details are shown in Figure 5.
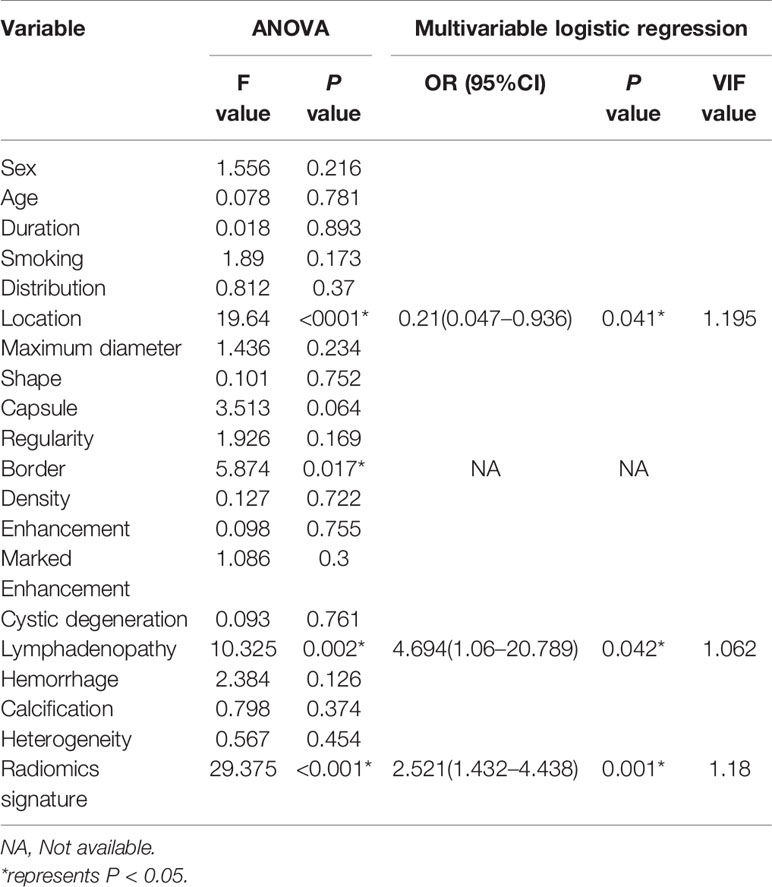
Table 4 Multivariable logistic regression analysis for selecting predictors for model construction.
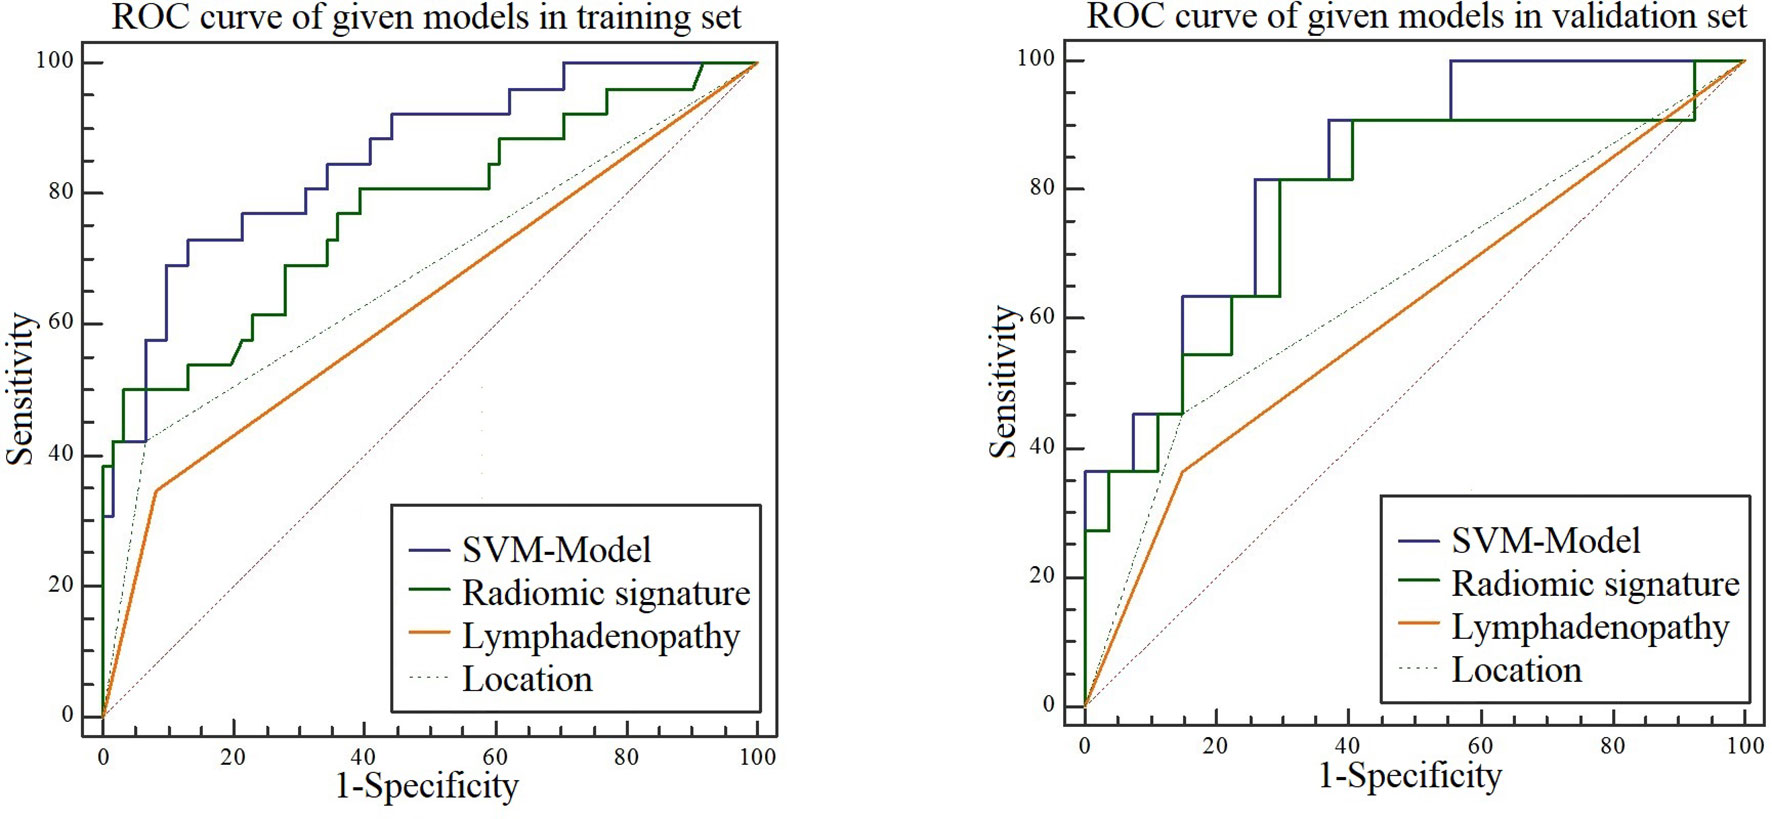
Figure 5 ROC curves for the SVM model, radiomic signature, location, and lymphadenopathy when predicting malignancy in the training and test sets.
We performed DCA for the SVM model, radiomics signature, location, and lymphadenopathy in the training and test sets. The results show that the SVM model has the greatest net benefit in both datasets. Additionally, we conducted calibration curve analysis of these continuous variables in both datasets, and they all showed good consistency, as shown in Figure 6. According to the optimal diagnostic cut-off value of the model (0.323), patients were divided into a low-risk group and a high-risk group. There were significant differences in the number of malignant PG tumors between the low-risk group and the high-risk group in both the training set and test set (P<0.0001), as shown in Figure 7.
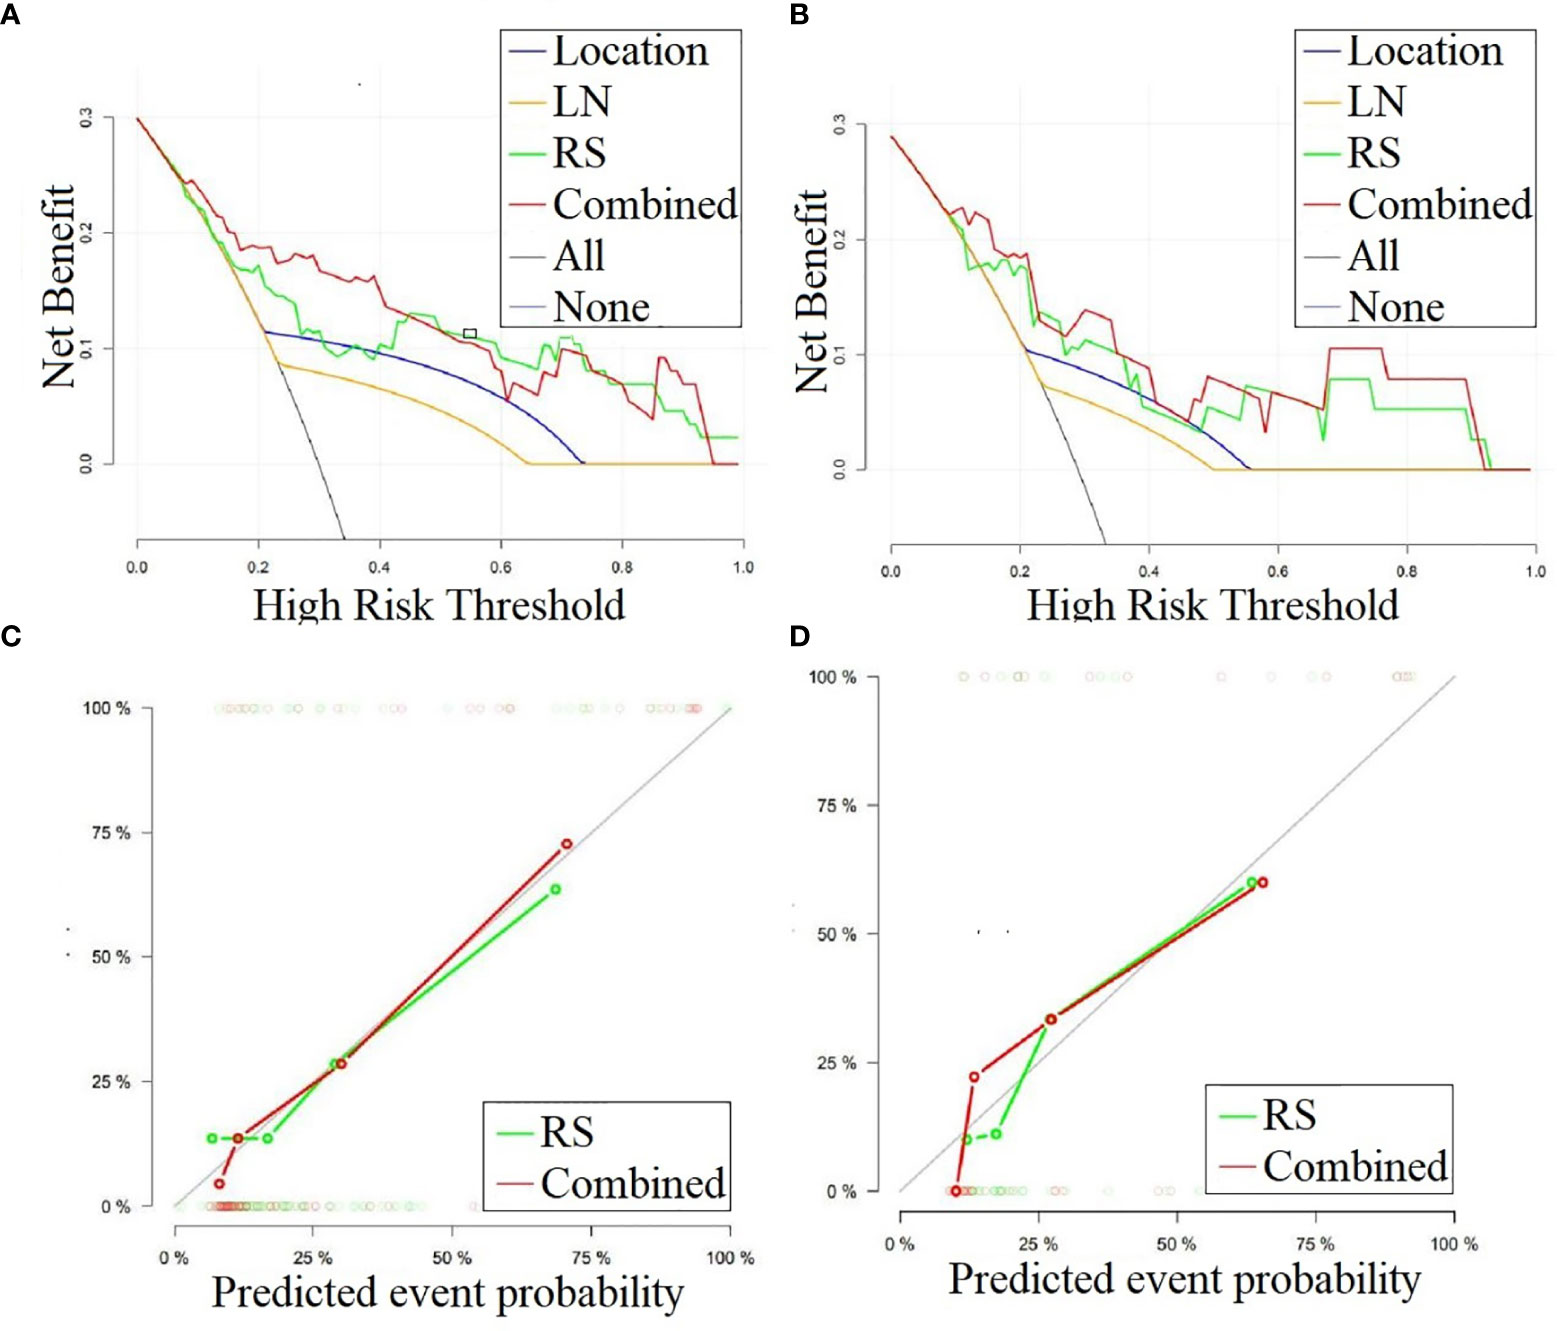
Figure 6 (A, B) DCA curves for the combined model, radiomics signature, lymphadenopathy and location in classifying parotid gland tumors in the training and test sets, respectively. The graphs show that the combined model has the greatest net benefit for both datasets. (C, D) Calibration curves for the combined model and radiomics signature in classifying the parotid gland tumors in the training and test sets, respectively. LN, Lymphadenopathy; RS, radiomic signature.
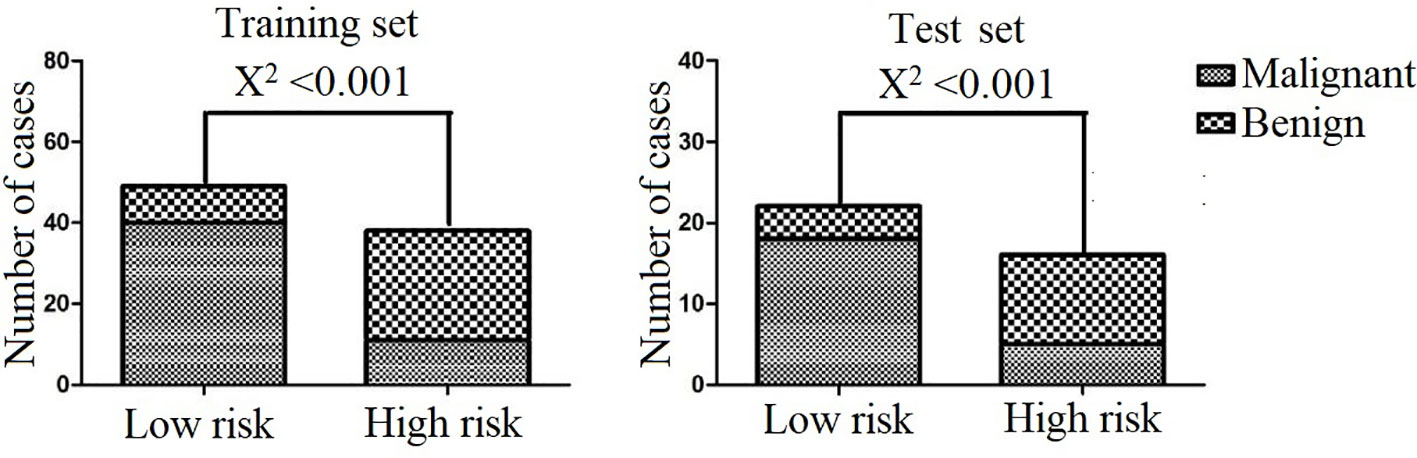
Figure 7 Classification performance of the combined model in the training and test sets.
Discussion
We developed and validated a combined prediction model based on radiological data and CT-radiomics for differentiating benign and malignant PG tumors in two independent clinical cohorts. The combined model was constructed by incorporating the rad-score from the radiomics signature and two radiological features. The rad-score was calculated using the LR model, which was developed with 14 selective features, including five features from NCCT and nine features from CECT images of PG tumors. The combined SVM model outperformed the radiomics signature and individual radiological features in both the training and test groups. Thus, the proposed non-invasive method of the favorable, combined prediction model makes it a potential preoperative evaluation tool in clinical practice.
Medical imaging is one of the major factors in clinical evaluation and treatment. However, traditional medical imaging is primarily a subjective or qualitative science. Radiomics, a relatively newly developed set of techniques, allows the high-throughput extraction of imaging features to quantify the different characteristics that oncologic tissues exhibit in medical imaging (20). Recently, there have been several studies on the application of radiomics to PG disease. Ajmi et al. (16) used dual-energy CT to investigate the classification of two benign parotid tumors, Warthin tumors and pleomorphic adenomas. Pallamar et al. (21) utilized standard MRI sequence-based textures to discriminate PG masses; however, only a rather small 38 patients with various pathological entities were enrolled, and regions of interest derived from only three slices rather than from the whole tumor were used for extracting a limited number of features. Another study (22) used only the arterial phase to distinguish pleomorphic adenoma from Warthin tumor, both of which are benign tumors and have similar clinical management. In addition, several studies have investigated the changes in the parotid morphology and secretory function induced by radiotherapy for head and neck cancers (23, 24). Unlike the above-mentioned literature, we performed 3D whole tumor analysis to differentiate benign and malignant PG tumors with larger, multicentre datasets of both plain CT and contrast-enhanced CT images. Furthermore, machine learning methods were employed to ensure robustness and reproductivity, which make this study more clinically practical.
In this study, 14 texture features were selected with a machine learning method from both NCCT and CECT images to develop a radiomics signature, including first-order and high-order features. Previous literature has demonstrated that radiomics features may reflect relevant and potentially important phenotypic information, such as intra-tumor heterogeneity, subsequently providing valuable information for diagnosis, prognosis and individualized therapy (25). Our results showed that several GLCM features survived as robust in the radiomics signature and participated in the construction of the prediction model. GLCM features describe the relationship between two neighboring pixels, which could potentially reflect local intra-tumor heterogeneity and is associated with tumor malignancy. It is hypothesized that intra-tumor heterogeneity can be exhibited at several spatial levels—macroscopic, cellular and molecular (genetics)—, all leading to radiological differences; thus, radiological tumor phenotype characteristics may be useful for investigating the underlying evolving biology and have been reported to be associated with worse survival in tumor patients (26). Our radiomics result was consistent with that of Zhang (27), who found that texture features, mainly consisting of GLCM features, in malignant PG tumors were significantly different from those in benign tumors. It can be surmised that malignant tumors grow rapidly and are mostly infiltrating, resulting in insufficient blood supply, which can easily cause microbleeds and necrosis of the tumor. Therefore, the heterogeneity of malignant lesions is higher than that of benign lesions.
Our study employed both plain CT and CECT to extract features to construct the radiomics signature as PG tumors have different CT densities for different tumor histologies and are mainly supplied by arterial blood, yielding more texture information than only the arterial phase, as used in a previous study (22). More features were selected from CECT images than from NCCT images; thus, CECT may reflect more important information, and it may be speculated that unlike plain CT, CECT might also reflect some heterogeneous features associated with the tumor blood supply (3). Our results may further suggest that blood supply information is different between benign and malignant PG tumors, which may be because tumor capillaries generally have wider inter-endothelial junctions and a large number of discontinuous or absent basement membranes in malignant tumors, which result in different haemodynamic conditions in the arterial stage between benign and malignant tumors (28).
Our integrated model showed the best performance, followed by the radiomics signature alone and then individual radiological features, which indicates that although the radiomics features of the tumor itself had better predictive ability than the radiological features themselves, extra-tumor radiological information such as lymphadenopathy is also important; only by combining these two complementary features could the model provide a precise evaluation of the entire tumor for management.
Our study still has several limitations. First, the sample size was relatively small, with 87 patients in the training group. However, 38 patients were enrolled from another independent medical center as the test group to investigate the models’ reproducibility, and our results showed that the prediction model based on the training set was also stable for the test set. In the future, we will carry out further multicentre studies with a larger sample size. Second, the manual process of tumor segmentation and the reproducibility of radiomics features is one debatable aspect in radiomics analysis, as there is some subjectivity involved in the delineation of tumor boundaries. However, a recent study on the robustness and reproducibility of radiomics features suggested that only those reproducible features should be selected in building a radiomics model (29), which was employed in this study to ascertain the robustness of the features extracted from the segmented tumors by the two radiologists independently. In addition, ultrasound is sufficient for most benign tumors for primary diagnosis. However, CT can be used as a complementary assessment tool in some cases such as deep tissue involvement, recurrence, suspicious malignancy or large tumors.
Conclusion
This study developed and validated a combined prediction model based on radiological data and CT radiomics features to distinguish benign and malignant PG tumors in two independent clinical cohorts; this model showed better prediction accuracy than the radiomics signature and radiological features alone. Thus, the proposed model could be used as a noninvasive prognostic or predictive biomarker for personal evaluation and could help clinicians guide surgical decisions. Multicentre and prospective validation studies with larger datasets should be further implemented prior to practical application of the model in the clinic.
Data Availability Statement
The original contributions presented in the study are included in the article/Supplementary Material. Further inquiries can be directed to the corresponding authors.
Ethics Statement
The studies involving human participants were reviewed and approved by the Zhejiang Provincial People’s Hospital. Written informed consent for participation was not required for this study is in accordance with the national legislation and the institutional requirements.
Author Contributions
The study concept and design were carried out by YX, ZS, and XW. Literature research was collected by YX and YL. Clinical studies were conducted by YX, GS, and YL. Data and statistical analyses were performed by YX, PP, and ZS. XG and XW guarantee the integrity of the entire research study. All authors contributed to the article and approved the submitted version.
Funding
This work was supported by the Fund of Health Commission of Zhejiang Province (2017KY230、2020KY402).
Conflict of Interest
PP was employed by GE Healthcare.
The remaining author declares that the research was conducted in the absence of any commercial or financial relationships that could be construed as a potential conflict of interest.
Acknowledgments
We are grateful to Ms. Peipei Pang (GE Healthcare, Hangzhou, China) for her technical support.
Supplementary Material
The Supplementary Material for this article can be found online at: https://www.frontiersin.org/articles/10.3389/fonc.2021.634452/full#supplementary-material
References
1. Zhan KY, Khaja SF, Flack AB, Day TA. Benign Parotid Tumors. Otolaryngol Clin North Am (2016) 49(2):327–42. doi: 10.1016/j.otc.2015.10.005
2. Kato MG, Erkul E, Nguyen SA, Day TA, Hornig JD, Lentsch EJ, et al. Extracapsular Dissection vs Superficial Parotidectomy of Benign Parotid Lesions: Surgical Outcomes and Cost-effectiveness Analysis. JAMA Otolaryngol Head Neck Surg (2017) 143(11):1092–7. doi: 10.1001/jamaoto.2017.1618
3. Dong Y, Lei GW, Wang SW, Zheng SW, Ge Y, Wei FC. Diagnostic value of CT perfusion imaging for parotid neoplasms. Dentomaxillofac Radiol (2014) 43(1):20130237. doi: 10.1259/dmfr.20130237
4. Xu ZF, Yong F, Yu T, Chen YY, Gao Q, Zhou T, et al. Different histological subtypes of parotid gland tumors: CT findings and diagnostic strategy. World J Radiol (2013) 5(8):313–20. doi: 10.4329/wjr.v5.i8.313
5. Cha MJ, Kang DY, Lee W, Yoon SH, Choi YH, Byun JS, et al. Hypersensitivity Reactions to Iodinated Contrast Media: A Multicenter Study of 196 081 Patients. Radiology (2019) 293(1):117–24. doi: 10.1148/radiol.2019190485
6. Sun Q, Ma C, Dong M, Jiang M, Tao X. Effects of region of interest sizes on apparent diffusion coefficient measurements of pleomorphic adenoma, Warthin tumor, and normal parotid parenchyma. Quant Imaging Med Surg (2019) 9(4):681–90. doi: 10.21037/qims.2019.04.11
7. Kechagias N, Ntomouchtsis A, Valeri R, Patrikidou A, Kitikidou K, Xirou P, et al. Fine-needle aspiration cytology of salivary gland tumours: a 10-year retrospective analysis. Oral Maxillofac Surg (2012) 16(1):35–40. doi: 10.1007/s10006-011-0291-8
8. Bahar G, Dudkiewicz M, Feinmesser R, Joshua BZ, Braslavsky D, Popovtzer A, et al. Acute parotitis as a complication of fine-needle aspiration in Warthin’s tumor. A unique finding of a 3-year experience with parotid tumor aspiration. Otolaryngol Head Neck Surg (2006) 134(4):646–9. doi: 10.1016/j.otohns.2005.10.050
9. Haldar S, Sinnott JD, Tekeli KM, Turner SS, Howlett DC. Biopsy of parotid masses: Review of current techniques. World J Radiol (2016) 8(5):501–5. doi: 10.4329/wjr.v8.i5.501
10. Liu Z, Wang S, Dong D, Wei J, Fang C, Zhou X, et al. The Applications of Radiomics in Precision Diagnosis and Treatment of Oncology: Opportunities and Challenges. Theranostics (2019) 9(5):1303–22. doi: 10.7150/thno.30309
11. Jethanandani A, Lin TA, Volpe S, Elhalawani H, Mohamed ASR, Yang P, et al. Exploring Applications of Radiomics in Magnetic Resonance Imaging of Head and Neck Cancer: A Systematic Review. Front Oncol (2018) 8:131. doi: 10.3389/fonc.2018.00131
12. Kickingereder P, Neuberger U, Bonekamp D, Piechotta PL, Gotz M, Wick A, et al. Radiomic subtyping improves disease stratification beyond key molecular, clinical, and standard imaging characteristics in patients with glioblastoma. Neuro Oncol (2018) 20(6):848–57. doi: 10.1093/neuonc/nox188
13. Guo Y, Hu Y, Qiao M, Wang Y, Yu J, Li J, et al. Radiomics Analysis on Ultrasound for Prediction of Biologic Behavior in Breast Invasive Ductal Carcinoma. Clin Breast Cancer (2018) 18(3):e335–44. doi: 10.1016/j.clbc.2017.08.002
14. Liu Z, Zhang XY, Shi YJ, Wang L, Zhu HT, Tang Z, et al. Radiomics Analysis for Evaluation of Pathological Complete Response to Neoadjuvant Chemoradiotherapy in Locally Advanced Rectal Cancer. Clin Cancer Res (2017) 23(23):7253–62. doi: 10.1158/1078-0432.CCR-17-1038
15. Huang X, Long L, Wei J, Li Y, Xia Y, Zuo P, et al. Radiomics for diagnosis of dual-phenotype hepatocellular carcinoma using Gd-EOB-DTPA-enhanced MRI and patient prognosis. J Cancer Res Clin Oncol (2019) 145(12):2995–3003. doi: 10.1007/s00432-019-03062-3
16. Al Ajmi E, Forghani B, Reinhold C, Bayat M, Forghani R. Spectral multi-energy CT texture analysis with machine learning for tissue classification: an investigation using classification of benign parotid tumours as a testing paradigm. Eur Radiol (2018) 28(6):2604–11. doi: 10.1007/s00330-017-5214-0
17. Sun R, Limkin EJ, Vakalopoulou M, Dercle L, Champiat S, Han SR, et al. A radiomics approach to assess tumour-infiltrating CD8 cells and response to anti-PD-1 or anti-PD-L1 immunotherapy: an imaging biomarker, retrospective multicohort study. Lancet Oncol (2018) 19(9):1180–91. doi: 10.1016/S1470-2045(18)30413-3
18. Shu Z, Fang S, Ding Z, Mao D, Cai R, Chen Y, et al. MRI-based Radiomics nomogram to detect primary rectal cancer with synchronous liver metastases. Sci Rep (2019) 9(1):3374. doi: 10.1038/s41598-019-39651-y
19. Wu J, Aguilera T, Shultz D, Gudur M, Rubin DL, Loo BW Jr, et al. Early-Stage Non-Small Cell Lung Cancer: Quantitative Imaging Characteristics of (18)F Fluorodeoxyglucose PET/CT Allow Prediction of Distant Metastasis. Radiology (2016) 281(1):270–8. doi: 10.1148/radiol.2016151829
20. Wei W, Liu Z, Rong Y, Zhou B, Bai Y, Wei W, et al. A Computed Tomography-Based Radiomic Prognostic Marker of Advanced High-Grade Serous Ovarian Cancer Recurrence: A Multicenter Study. Front Oncol (2019) 9:255. doi: 10.3389/fonc.2019.00255
21. Fruehwald-Pallamar J, Czerny C, Holzer-Fruehwald L, Nemec SF, Mueller-Mang C, Weber M, et al. Texture-based and diffusion-weighted discrimination of parotid gland lesions on MR images at 3.0 Tesla. NMR BioMed (2013) 26(11):1372–9. doi: 10.1002/nbm.2962
22. Zhang D, Li X, Lv L, Yu J, Yang C, Xiong H, et al. Improving the diagnosis of common parotid tumors via the combination of CT image biomarkers and clinical parameters. BMC Med Imaging (2020) 20(1):38. doi: 10.1186/s12880-020-00442-x
23. Nardone V, Tini P, Nioche C, Mazzei MA, Carfagno T, Battaglia G, et al. Texture analysis as a predictor of radiation-induced xerostomia in head and neck patients undergoing IMRT. Radiol Med (2018) 123(6):415–23. doi: 10.1007/s11547-017-0850-7
24. Wu H, Chen X, Yang X, Tao Y, Xia Y, Deng X, et al. Early Prediction of Acute Xerostomia During Radiation Therapy for Head and Neck Cancer Based on Texture Analysis of Daily CT. Int J Radiat Oncol Biol Phys (2018) 102(4):1308–18. doi: 10.1016/j.ijrobp.2018.04.059
25. Yip SS, Aerts HJ. Applications and limitations of radiomics. Phys Med Biol (2016) 61(13):R150–66. doi: 10.1088/0031-9155/61/13/R150
26. Aerts HJ, Velazquez ER, Leijenaar RT, Parmar C, Grossmann P, Carvalho S, et al. Decoding tumour phenotype by noninvasive imaging using a quantitative radiomics approach. Nat Commun (2014) 5:4006. doi: 10.1038/ncomms5006
27. Zhang D, Li X, Lv L, Yu J, Yang C, Xiong H, et al. A Preliminary Study of CT Texture Analysis for Characterizing Epithelial Tumors of the Parotid Gland. Cancer Manag Res (2020) 12:2665–74. doi: 10.2147/cmar.s245344
28. Miles KA, Griffiths MR. Perfusion CT: a worthwhile enhancement? Br J Radiol (2003) 76(904):220–31. doi: 10.1259/bjr/13564625
Keywords: CT, malignancy, parotid gland, radiomics, tumor
Citation: Xu Y, Shu Z, Song G, Liu Y, Pang P, Wen X and Gong X (2021) The Role of Preoperative Computed Tomography Radiomics in Distinguishing Benign and Malignant Tumors of the Parotid Gland. Front. Oncol. 11:634452. doi: 10.3389/fonc.2021.634452
Received: 27 November 2020; Accepted: 02 February 2021;
Published: 10 March 2021.
Edited by:
Patrick James Bradley, Queen’s Medical Centre, United KingdomReviewed by:
Orlando Guntinas-Lichius, University Hospital Jena, GermanyWei Wei, Xi’an Polytechnic University, China
Copyright © 2021 Xu, Shu, Song, Liu, Pang, Wen and Gong. This is an open-access article distributed under the terms of the Creative Commons Attribution License (CC BY). The use, distribution or reproduction in other forums is permitted, provided the original author(s) and the copyright owner(s) are credited and that the original publication in this journal is cited, in accordance with accepted academic practice. No use, distribution or reproduction is permitted which does not comply with these terms.
*Correspondence: Xuehua Wen, eHVlaHVhc3VxaWFuQDEyNi5jb20=; Xiangyang Gong, Y2pyLmd4eUBob3RtYWlsLmNvbQ==
†ORCID Yuyun Xu, orcid.org/0000-0003-2818-852X; Zhenyu Shu, orcid.org/0000-0002-4372-7897; Xuehua Wen, orcid.org/0000-0002-5504-0400
‡These authors have contributed equally to this work