 Yi Zou1,2†Huaqin Sun2†Yating Guo2†
 Yidan Shi2Zhiyu Jiang2Jingxuan Huang3
 Li Li3,4Fengle Jiang2Zeman Lin2Junling Wu2Ruixiang Zhou3,5*Yuncai Liu1*
 Lu Ao2,3*
- 1Department of Automation and Key Laboratory of China MOE for System Control and Information Processing, Shanghai Jiao Tong University, Shanghai, China
- 2Department of Bioinformatics, Fujian Key Laboratory of Medical Bioinformatics, School of Basic Medical Sciences, Fujian Medical University, Fuzhou, China
- 3Key Laboratory of Ministry of Education for Gastrointestinal Cancer, School of Basic Medical Sciences, Fujian Medical University, Fuzhou, China
- 4Department of Cell Biology and Genetics, School of Basic Medical Sciences, Fujian Medical University, Fuzhou, China
- 5Department of Human Anatomy, Histology and Embryology, School of Basic Medical Sciences, Fujian Medical University, Fuzhou, China
Background: Melatonin has been shown to play a protective role in the development and progression of cancer. However, the relationship between alterations in the melatonergic microenvironment and cancer development has remained unclear.
Methods: We performed a comprehensive investigation on 12 melatonergic genes and their relevance to cancer occurrence, progression and survival by integrating multi-omics data from microarray analysis and RNA sequencing across 11 cancer types. Specifically, the 12 melatonergic genes that we investigated, which reflect the melatonergic microenvironment, included three membrane receptor genes, three nuclear receptor genes, two intracellular receptor genes, one synthetic gene, and three metabolic genes.
Results: Widely coherent underexpression of nuclear receptor genes, intracellular receptor genes, and metabolic genes was observed in cancerous samples from multiple cancer types compared to that in normal samples. Furthermore, genomic and/or epigenetic alterations partially contributed to these abnormal expression patterns in cancerous samples. Moreover, the majority of melatonergic genes had significant prognostic effects in predicting overall survival. Nevertheless, few corresponding alterations in expression were observed during cancer progression, and alterations in expression patterns varied greatly across cancer types. However, the association of melatonergic genes with one specific cancer type, hepatocellular carcinoma, identified RORA as a tumor suppressor and a prognostic marker for patients with hepatocellular carcinoma.
Conclusions: Overall, our study revealed decreased melatonergic gene expression in various cancers, which may help to better elucidate the relationship between melatonin and cancer development. Taken together, our findings highlight the potential prognostic significance of melatonergic genes in various cancers.
Introduction
Melatonin, a hormone produced mainly by the pineal gland, has many functions in regulating physiological processes, such as sleep, circadian rhythms, immunomodulation, anti-inflammatory signaling, and vasoconstriction (1). Melatonin exerts these actions via both receptor-dependent and -independent mechanisms. Melatonergic receptors include membrane-bound receptors, such as melatonin receptor type 1A (MT1, encoded by MTNR1A) and 1B (MT2, encoded by MTNR1B) (2, 3), and nuclear retinoic acid receptor-related orphan receptors (RORs; consisting of RORalpha, RORbeta and RORgamma) (4). Melatonin also binds to intracellular proteins, such as calmodulin 1 (CALM1), to modulate neurodevelopment (5). Additionally, N-Ribosyldihydronicotinamide: Quinone Reductase 2 (NQO2) has been identified as a melatonin-binding site (6) and G Protein-Coupled Receptor 50 (GPR50) has been reported to dimerize MT1 receptor to inhibit melatonergic signaling (7). Acetylserotonin O-methyltransferase (ASMT) is the final enzyme in the biosynthetic pathway of melatonin (8). In humans, melatonin is metabolized by hepatic cytochromes, including cytochrome P450 (CYP) 1 family members: CYP1A1, CYP1A2 and CYP1B1, to 6-hydroxymelatonin (9, 10). Importantly, melatonergic levels are restricted by both biosynthetic and metabolic processes, and expressional alterations in these melatonergic genes influence the melatonergic microenvironment (11).
In the last several decades, accumulating evidence has demonstrated that melatonin plays an important role in modulating pathological processes. Many studies have shown a protective role of melatonin in the occurrence and progression of cancer (12–14). For instance, low melatonergic levels have been reported to be associated with a high risk of breast cancer (15, 16). Moreover, melatonergic genes has a therapeutic perspective (17, 18). For example, overexpression of MT1 receptor was shown to enhance the growth suppressive effects of melatonin in breast cancer and melanoma cell lines (19, 20). Therefore, a comprehensive study investigating the relationship between alterations in the melatonergic microenvironment and cancer development, progression, and prognosis is needed.
In 2020, liver cancer ranks the fifth in cancer incidence and the third in tumor related mortality worldwide (21). Sorafenib is the first target drug approved for the treatment of hepatocellular carcinoma (HCC), a major type of liver cancer, which can prolong the overall survival time with a response rate of only 2% (22, 23). Our previous study has shown the anticancer property of melatonin in HCC (24) and increasing evidences have presented that melatonin can increase the sensitivity of HCC to sorafenib (25, 26). Thus, addressing melatonergic microenvironment in HCC is helpful to tailor individualized treatments for patients.
In the present study, we leveraged the large-scale gene expression profiles in the Gene Expression Omnibus (GEO) and RNA sequencing (RNA-seq) transcriptomic data in The Cancer Genome Atlas (TCGA) to characterize associations between genes reflecting the melatonergic microenvironment and cancer development across multiple cancer types. We comprehensively evaluated the expressional alterations of 12 melatonergic genes in 6,014 patients across 11 cancer types from GEO and TCGA databases. Genetic, epigenetic, and prognostic patterns of melatonergic genes were investigated by integrating multi-omic data from TCGA. Furthermore, the association of melatonergic genes with carcinogenesis was specifically investigated in HCC. Collectively, our findings may aid in better understanding the impacts of melatonin on cancer development, progression, and prognosis.
Materials and Methods
Data Sources and Data Preprocessing
All gene expression datasets of 6,014 cancerous samples and 1,211 matched normal samples for 11 cancer types analyzed in the present study are summarized in Table 1, and the cancer types included breast cancer (BRCA), colon and rectal adenocarcinoma (COAD), esophageal squamous cell carcinoma (ESCA), head and neck squamous cell carcinoma (HNSC), kidney clear cell carcinoma (KIRC), liver hepatocellular carcinoma (LIHC), lung adenocarcinoma (LUAD), lung squamous cell carcinoma (LUSC), pancreatic adenocarcinoma (PAAD), prostate adenocarcinoma (PRAD), and stomach adenocarcinoma (STAD). Each cancer type included the following two datasets: (1) microarray data from GEO; and (2) RNA-seq data with metastasis information from TCGA (27). The RNA-seq data for pancreatic cancer were from GEO due to an insufficient number of matched cancerous and normal samples in TCGA. Metastasis information for samples from TCGA is shown in Supplementary Table S1. For the microarray data, the raw mRNA expression data of cancerous and normal samples were downloaded and the robust multi-array average algorithm was used for background adjustment (28). For the RNA-seq data, gene expression values of cancerous and normal samples were represented by raw counts and limma was used to remove batch effects (29). Then, these data underwent TMM normalization (30).
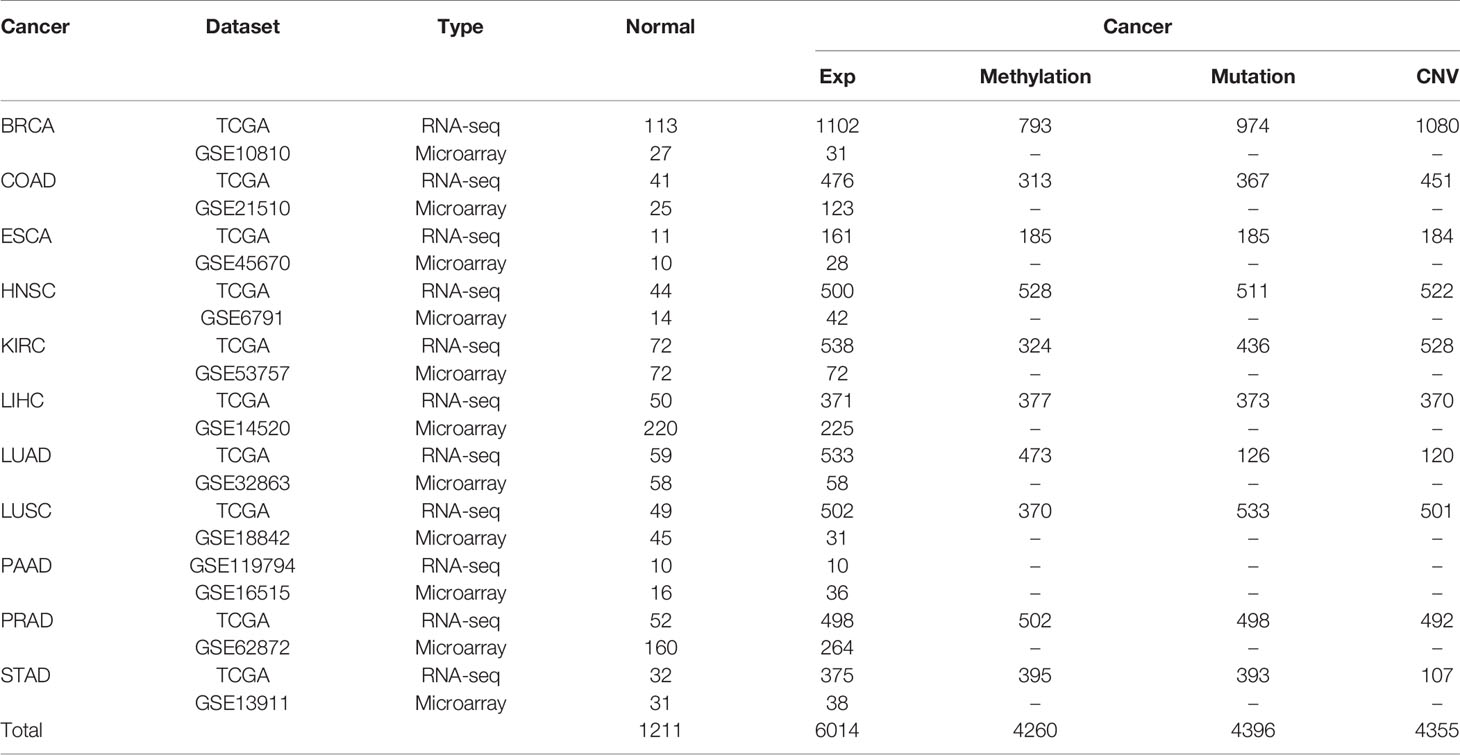
Table 1 Description of datasets used in this study.
Multi-omic data for 10 of the 11 analyzed cancer types (i.e., all types except PAAD) were downloaded. Level-four somatic mutation data and copy number variation (CNV) data were obtained from TCGA via the Broad GDAC (http://gdac.broadinstitute.org/). Mutational data were identified by the CHASM algorithm (31) and only non−synonymous mutations were analyzed in the present study. A discrete copy-number-alteration status was given to each melatonergic gene in each sample by significant regions of gain or loss identified by the GISTIC 2.0 algorithm (q value<0.1) (32). Level-three DNA methylation data from the Illumina Infinium Human DNA methylation 450 platform were obtained from TCGA. For each CpG site, the methylation status was expressed as a beta-value in each sample, ranging from 0 to 1. We focused on the 264 CpG sites of 12 melatonergic genes, which were not “NA” in half of the above samples. The remaining “NA” values were replaced by the minimum beta value of this site in all samples.
The third independent LIHC dataset used in this study was the LIRI-JP dataset (n=231) from the International Cancer Genome Consortium (ICGC) database. Clinical information from the GSE14520, TCGA-LIHC, and LIRI-JP datasets are shown in Supplementary Table S2. LIHC microRNA (miRNA) expression profiles were downloaded from TCGA. The miRNAs regulating RORA were predicted from three commonly used databases, miRTarBase (http://miRTarBase.mbc.nctu.edu.tw/) (33), miRDB (http://mirdb.org/) (34), and Targetscan (http://www.targetscan.org/) (35).
Identification of Differentially Expressed Melatonergic Genes Between Cancerous and Normal Tissue Samples
Student’s t-tests and edgeR were used to identify differentially expressed melatonergic genes between cancerous and normal samples via microarray analysis and RNA-seq, respectively (36, 37). The Benjamini and Hochberg (BH) procedure was used to control for the false discovery rate (FDR) (38). The differentially expressed statuses of melatonergic genes in cancerous samples were assigned to 1 for overexpression and -1 for underexpression for significant alterations compared to those in normal samples. The differentially expressed status was assigned to 0.5 or -0.5 in cancerous samples if the corresponding expression level was non-significantly greater than or less than that in normal samples. The final differentially expressed status of each melatonergic gene was calculated as follows:
sarray and sseq, represent the differentially expressed statuses from the microarray dataset and RNA-seq dataset, respectively. For example, if a gene was significantly overexpressed in the RNA-seq data (FDR<0.05, fold change (FC)>0) and non-significantly overexpressed in the microarray data (FDR>0.05, t>0), then sarray and sseq were 1 and 0.5, respectively, and its final differentially expressed status S was set as 1.5; if it was significantly overexpressed in the RNA-seq data (FDR<0.05, FC>1) but non-significantly underexpressed in the microarray data (FDR>0.05, t<0), then sarray and sseq were 1 and -0.5, respectively, and its final differentially expressed status status S was set to 0. The FDR value below 0.05 was considered to be statistical significance. The differentially expressed statuses of each melatonergic gene in a particular cancer type were shown in Supplementary Tables S3, S4.
Statistical Analysis
The Wilcoxon rank sum test was used to identify differential methylation sites between cancerous and normal samples (39). If a gene was mapped by multiple CpG sites that were both hypermethylated and hypomethylated, the gene was not included in the following analysis. When all the CpG sites of a gene were differentially hypermethylated or hypomethylated, the gene was considered to be a differentially methylated gene. The univariate Cox proportional-hazards regression model was used to evaluate the correlation between gene expression levels and patient survival time. Student’s t-tests were used to identify differentially expressed melatonergic genes between metastatic samples with lymph node or distant metastasis (N+M+) and non-metastatic samples without lymph node or distant metastasis (N0M0). One-way analyses of variance (ANOVAs) and Tukey’s post-hoc tests were used to determine whether the mean expression values of melatonergic genes were significantly different among patients at different cancer stages. The multivariate Cox proportional-hazards regression model was used to evaluate the independent prognostic value of melatonergic genes after adjusting for clinical factors including serum alpha-fetoprotein (AFP), cancer size, and TNM stage (40). Patients were then dichotomized into high and low subgroups according to their median expression levels of melatonergic genes. The log-rank test (41) was used to evaluate whether survival was significantly different between these two subgroups, and the Kaplan-Meier method was used to represent the survival probability over time. Kaplan-Meier analysis and log-rank tests were also used to determine the association of somatic mutations (TP53/CTNNB1) in combination with the expression level of RORA in LIHC. All data analyses were performed using the R software package version 3.6.0.
RORA-Related Functional Enrichment Analysis
Pearson correlation analysis was conducted to identify genes that were positively or negatively correlated with RORA expression in the corresponding datasets. Then, 223 pathways, excluding human disease pathways, were obtained from the KEGG database (https://www.kegg.jp/kegg/pathway.html). For each dataset, functional enrichment analysis was used to annotate biological pathways for RORA-positive-related and RORA-negative-related genes. The hypergeometric distribution model was used to determine significantly enriched pathways of these genes (42).
Results
Overview of Melatonergic Gene Expression in Cancer Development
A total of 6,014 cancer samples of 11 cancer types were analyzed. A heatmap of the differentially expressed statuses of melatonergic genes between cancerous and normal samples is shown in Figure 1A and Supplementary Tables S5, S6. The majority of nuclear receptor genes, intracellular genes, and metabolic genes were underexpressed to varying degrees across cancer types, which is consistent with previous studies (43–45). Strikingly, CALM1 was significantly underexpressed in all cancer types except for PAAD, whereas CYP1A2 was underexpressed in eight cancer types (e.g., BRCA and LIHC). Additionally, some genes exhibited low expression in most cancer types but had high expression in one or two cancer types, which may have been associated with heterogeneity across these cancer types. RORA was significantly underexpressed in eight cancer types but was overexpressed in KIRC, whereas CYP1A1 was underexpressed in seven cancer types but was overexpressed in COAD. Interestingly, RORC was significantly underexpressed in seven hormone-independent cancers (COAD, ESCA, HNSC, LIHC, LUSC, PAAD, and STAD) but was overexpressed in hormone-dependent cancers (e.g., BRCA and PRAD). In contrast, membrane receptor genes and synthetic genes were rarely differentially expressed across multiple cancer types, suggesting that the biological actions of melatonin in these cancer types might be independent of membrane-bound melatonergic receptors.
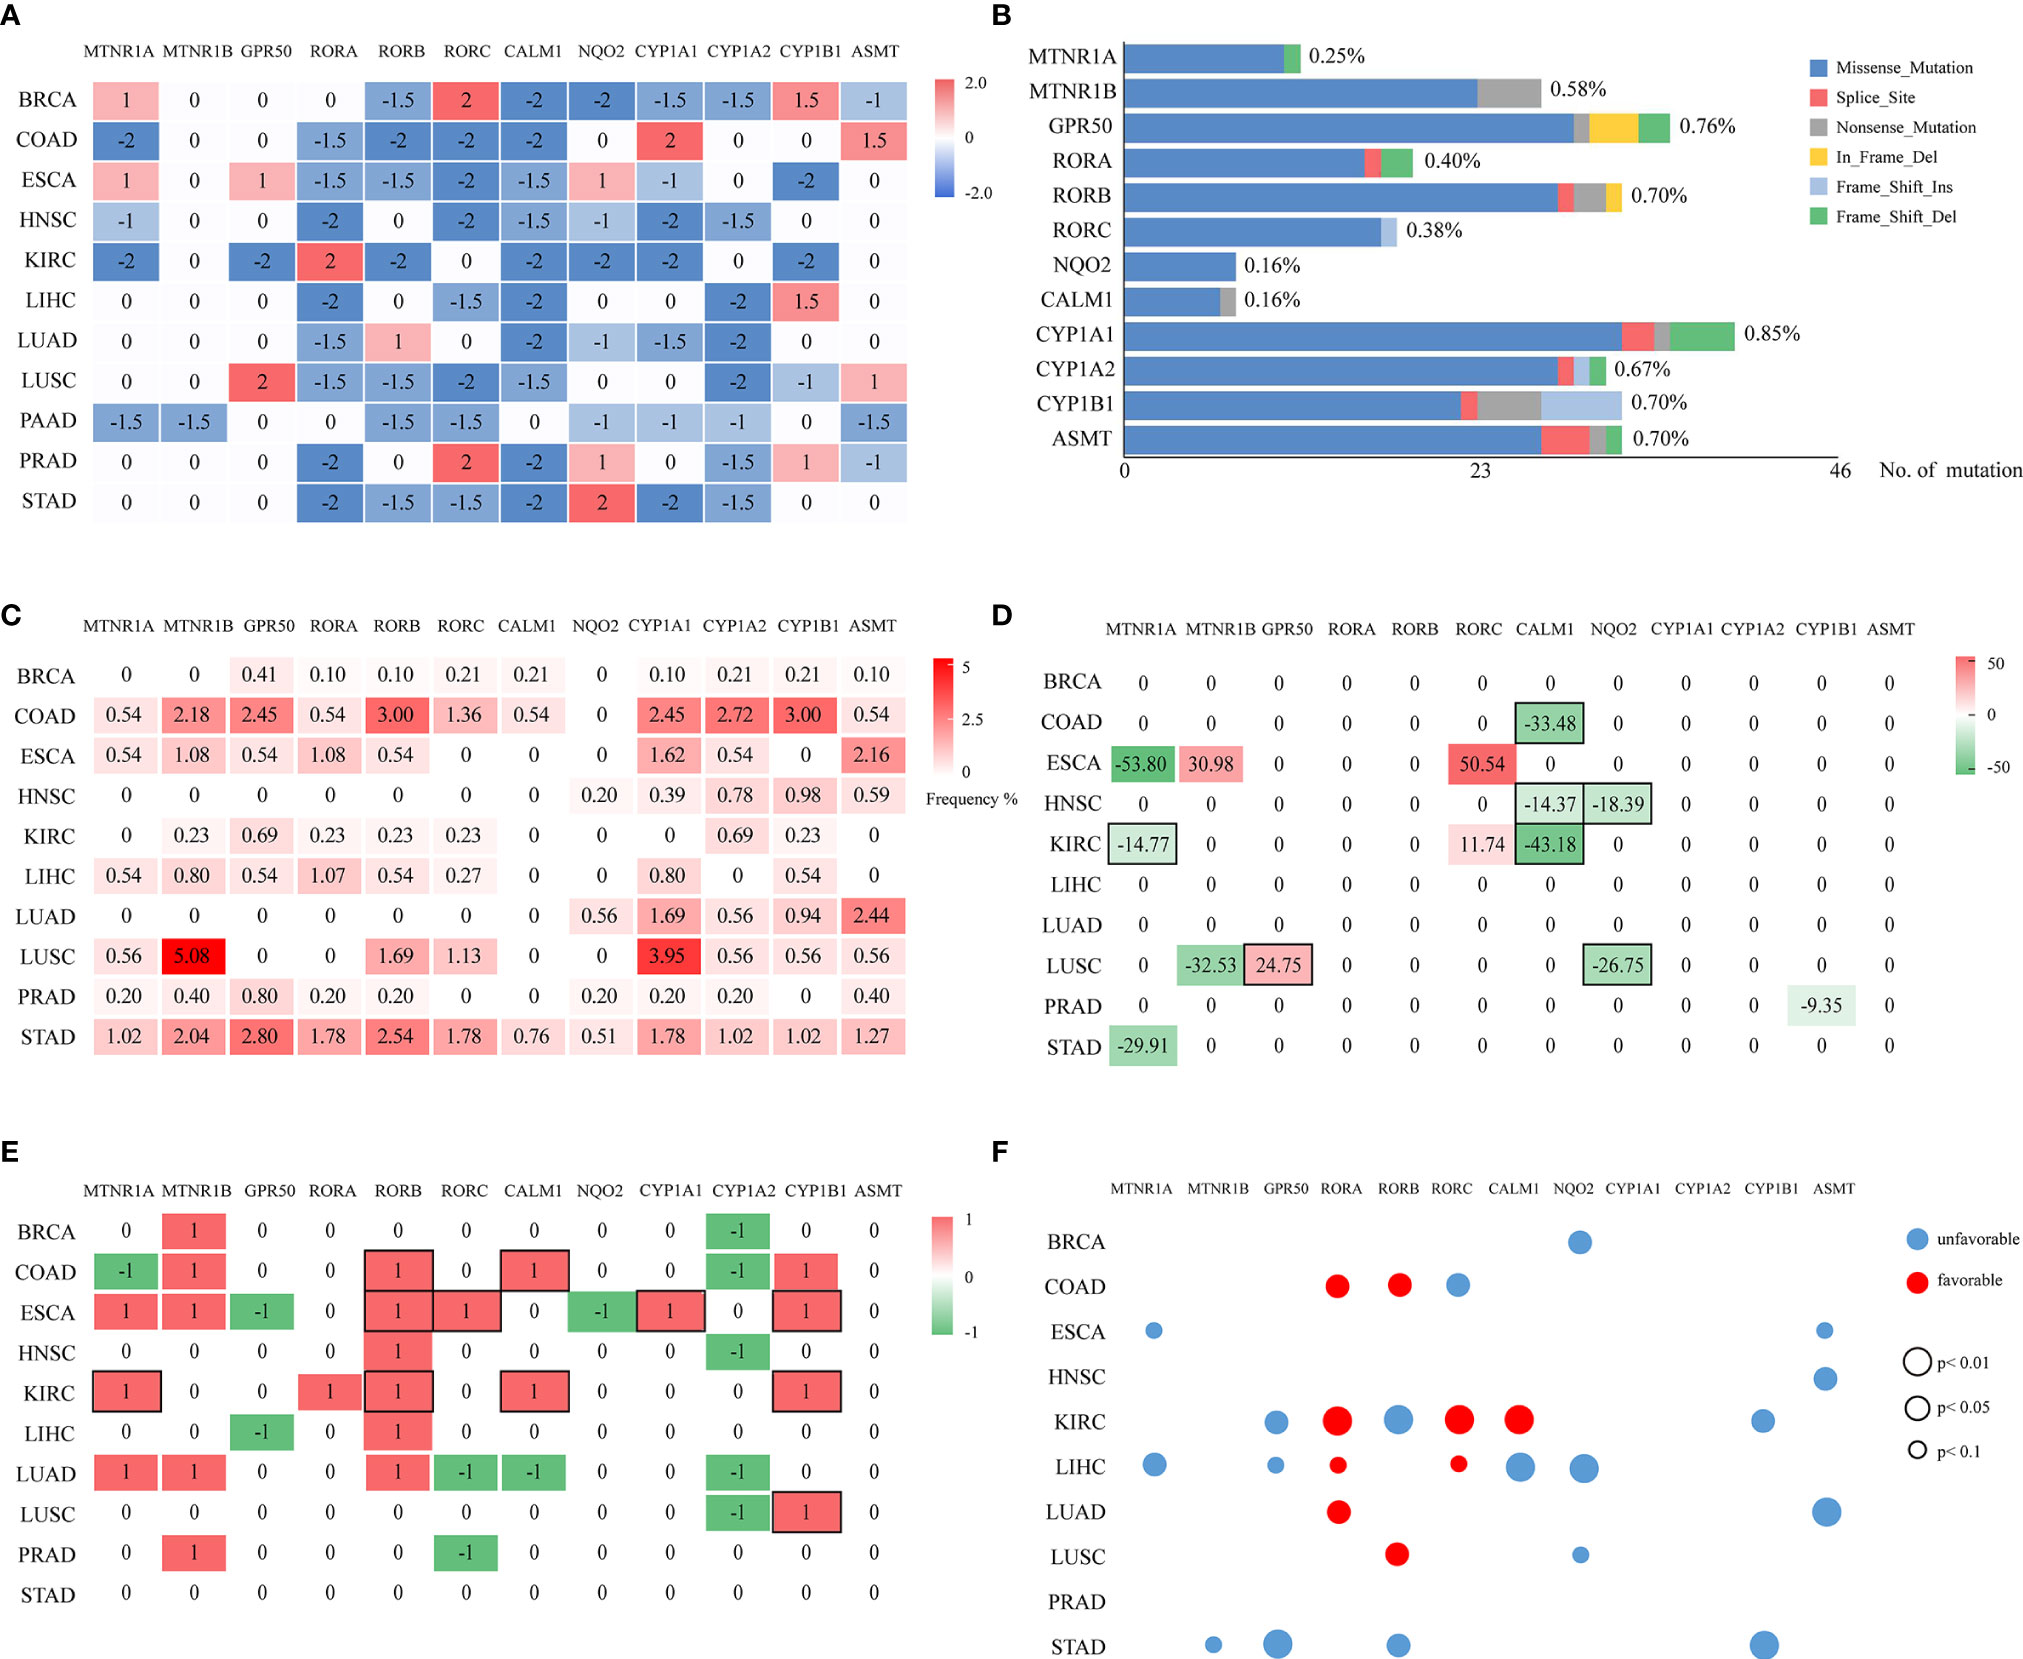
Figure 1 Multi-omic investigation and prognostic impacts of melatonergic genes across cancers. (A) Heatmap of the differentially expressed statuses of 12 melatonergic genes between cancerous and normal samples. The number on each cell represents its differentially expressed status. Red and blue indicate differential overexpression and underexpression, respectively. (B) Summary of mutated melatonergic genes. The x-axis denotes the total numbers of mutations of melatonergic genes in all RNA-seq samples across 11 cancer types. The length of the bar represents the proportion of mutated samples, which is marked on the right of the bar. (C) Mutational frequencies of melatonergic genes in certain cancer types. The numbers on the cells represent mutational percentages. (D) CNV frequencies of melatonergic genes across different cancer types. Numbers on the cells represent the CNV percentages, while red (greater than zero) and green (less than zero)represent amplification and deletion, respectively. (E) Heatmap of the differential-methylation statuses of melatonergic genes between cancerous and normal samples. Red (1) and green (-1) indicate hypermethylation and hypomethylation, respectively, in cancerous samples. The black boxes in (D, E) indicate that alterations in copy number or methylation are consistent with alterations in transcriptional expression. (F) Transcriptome-based prognostic impacts of melatonergic genes on OS across different cancer types. The univariate Cox proportional-hazards regression model was used to evaluate correlations. Red and blue denote favorable and unfavorable prognostic effects, respectively. The size of each circle indicates its significant p-value, whereas no circle denotes that there was no significant prognostic effect.
In two cancer types, HNSC and PAAD, all the differentially expressed melatonergic genes were consistently underexpressed. Meanwhile, all except for one of the differentially expressed melatonergic genes were underexpressed in KIRC, LIHC, LUAD, and STAD. Notably, the synthetic gene, ASMT, and metabolic gene, CYP1A1, were both highly expressed in COAD; notably, the gastro intestinal tract is an extra-pineal source of melatonin production during the daytime (46). Additionally, the metabolic gene, CYP1B1, was overexpressed in LIHC, possibly because the liver is the main site for metabolism of melatonin (1). However, synthetic genes and metabolic genes were not significantly differentially expressed in STAD. These heterogeneous expression patterns of melatonergic genes are likely due to cancer heterogeneity and are suggestive of cancer-type-specific functions of melatonergic genes. The comprehensively underexpressed nuclear receptor genes and intracellular genes across multiple cancer types are consistent with a protective role of melatonin in carcinogenesis. In contrast, there was no consistent relationship between membrane receptor genes and cancer incidence.
Multi-Omics Analyses of Alterations in Transcription of Melatonergic Genes
According to TCGA somatic mutation profiles, mutations in melatonergic genes were rare, with a mean mutation rate of 0.68% (Figure 1B). The first- and second-highest mutation frequencies were 5.08% for MTNR1B and 3.95% for CYP1A1, respectively, in LUSC (Figure 1C). CYP1A1 showed the highest mean mutation frequency across all cancer types (1.30%). The top-three mean mutation rates were observed in COAD (1.61%), STAD (1.53%), and LUSC (1.18%).
Compared with the relatively rare mutations, the CNV profiles showed that some melatonergic genes exhibited high alteration rates; for example, CALM1 had deletion rates of 43.18%, 33.48%, and 14.37% in COAD, KIRC, and HNSC (Figure 1D), respectively, which were in line with alterations in expression. The highest alteration rate of deletion and amplification were both observed in ESCA, which were 53.80% for MTNR1A and 50.54% for RORC. The deletions of three genes were consistent with concomitant decreases in transcriptional levels (e.g., MTNR1A in KIRC; NQO2 in HNSC and LUSC; CALM1 in COAD, HNSC, and KIRC), while amplification of GPR50 coincided with increased transcriptional levels in LUSC. However, RORC was amplified in two cancers, ESCA and KIRC, which was not coincident with transcriptional alterations.
Differentially methylated alterations of melatonergic genes varied across cancer types, as shown in Figure 1E. Compared with those in normal samples, RORB, CALM1, CYP1A1, and CYP1B1 were significantly differentially hypermethylated in multiple cancer types, which was consistent with their transcriptional underexpression (e.g., RORB in COAD, ESCA, and KIRC; CALM1 in COAD and KIRC; CYP1A1 in ESCA; CYP1B1 in ESCA, KIRC, and LUSC). However, CYP1A2 was significantly differentially hypomethylated in five cancer types, which was inconsistent with its transcriptional alterations. Moreover, MTNR1B, which was rarely differentially expressed in pan-cancer transcriptional analysis, was significantly differentially hypermethylated in five cancer types, whereas frequent differentially underexpressed RORA did not exhibit consistent hypermethylation.
In summary, these results of multi-omics data suggest that genomic and epigenetic alterations partially contributed to the broad transcriptional changes of melatonergic genes across various cancer types.
Relationship Between Melatonergic Gene Expression and Cancer Survival
Correlations among mRNA levels of melatonergic genes and patient overall survival (OS) in different TCGA cancer types are shown in Figure 1F. The results showed that most melatonergic genes had either favorable or unfavorable prognostic effects on patient OS. Among them, six melatonergic genes were significant unfavorable factors in cancers (e.g., MTNR1A in ESCA and LIHC; GPR50 in KIRC, LIHC, and STAD; NQO2 in BRCA, LIHC, and LUSC; CYP1B1 in KIRC and STAD; ASMT in ESCA, HNSC, and LUAD; and MTNR1B in STAD). RORA was a significant favorable factor in COAD, KIRC, LIHC, and LUAD. Moreover, the effects of some melatonergic genes varied across cancer types; for example, RORB was associated with unfavorable survival for KIRC and STAD, while it was associated with favorable survival for COAD and LUSC. These results might be attributed to the complicated and variable mechanisms of different melatonergic genes in different cancers.
In addition, all favorable factors in COAD, LIHC, LUAD, and LUSC, as well as CALM1 in KIRC, were also significantly differentially underexpressed in in the corresponding cancer types. Similarly, higher expression of MTNR1A, as an unfavorable factor, had a significantly shorter OS in ESCA. These results suggest that these melatonergic genes exert a coherent influence on the development and prognosis of various cancers.
Relationship Between Melatonergic Gene Expression and Cancer Progression
Next, we examined the relationship between melatonergic gene expression and cancer progression. All cancerous samples from TCGA were classified into two subgroups: (1) metastatic samples with lymph node metastasis or distant metastasis (N+M+); and (2) non-metastatic samples with neither lymph node metastasis nor distant metastasis (N0M0). LIHC was excluded due to there only being eight samples in the metastatic group. In contrast to the widely coherent expressional alterations between cancerous and normal samples across different cancer types, few expressional alterations of melatonergic genes correlated to cancer progression (Figure 2A). Moreover, melatonergic genes with significantly different expressional alterations between metastatic and non-metastatic samples varied greatly across cancer types. Some melatonergic genes showed opposite alterations in expression patterns across different cancers. For example, as the cancer stage increased, CALM1 expression decreased in KIRC, while it increased in BRCA (Figure 2B). Only CYP1A1 was significantly underexpressed during cancer progression in five cancer types, which was consistent with alterations in the development of three cancer types, namely, BRCA, KIRC, and LUAD. Meanwhile, consistent with the expressional alterations between cancerous and normal samples, significantly lower levels of some melatonergic genes were observed between the metastatic and non-metastatic groups (e.g., MTNR1A in COAD; RORA in LUAD; RORB in BRCA; CALM1 in KIRC; CYP1A2 in LUAD). In contrast, some melatonergic genes were significantly overexpressed during cancer progression and were opposite to their differentially expressed status between cancerous and normal samples (e.g., RORB in COAD, KIRC, and STAD; CALM1 in BRCA; CYP1A2 in LUSC). Strikingly, GPR50 had the highest expression level in the metastatic group compared to that in the non-metastatic group in three cancer types (e.g., BRCA, COAD, and LUAD). Interestingly, higher levels of ASMT and CYP1A1 were observed in COAD than in normal samples, whereas lower levels were observed in metastatic COAD than in non-metastatic COAD.
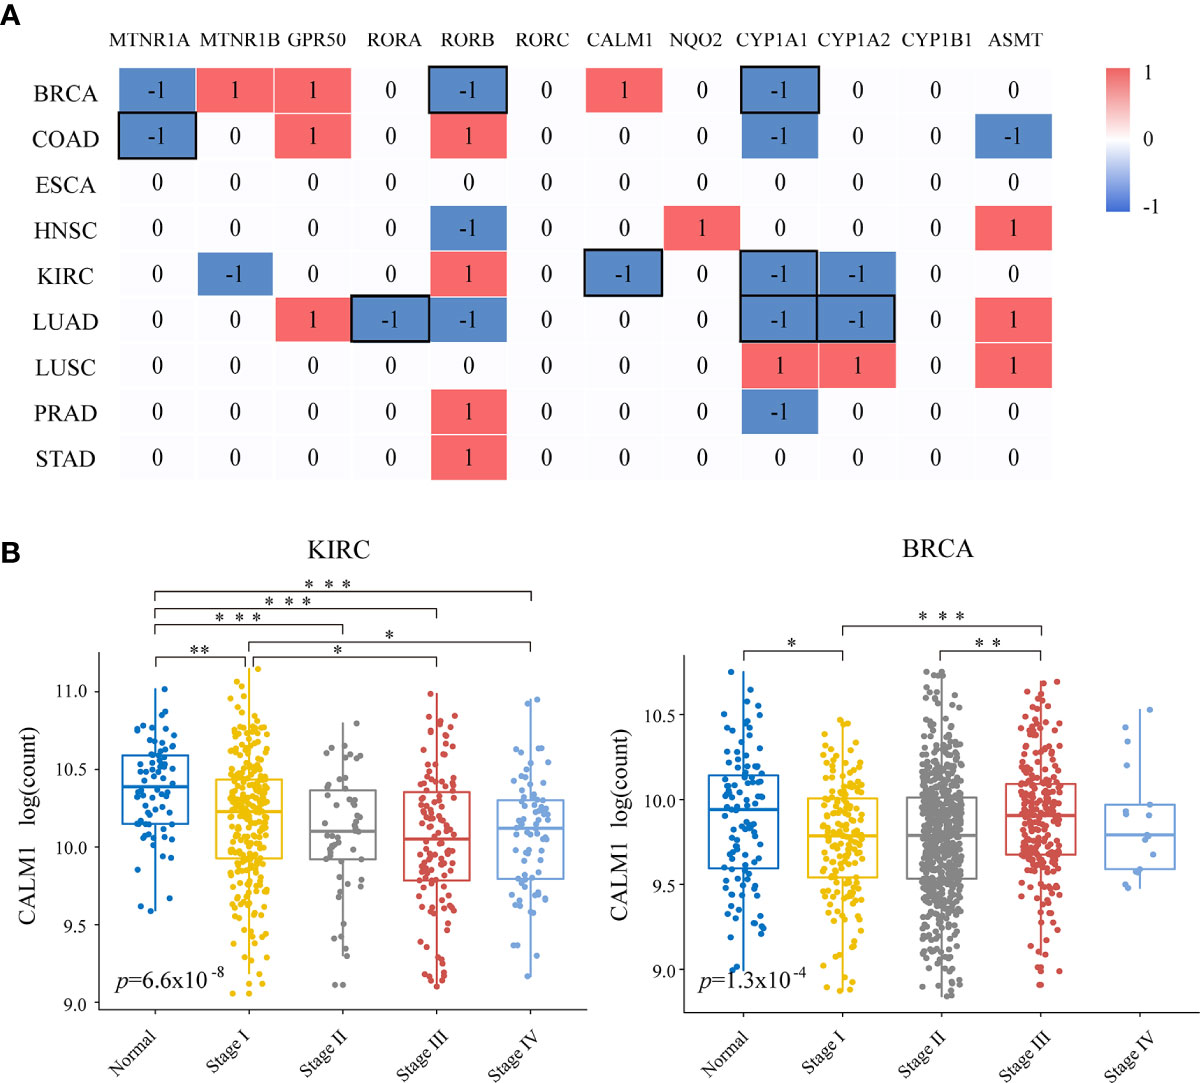
Figure 2 Relationships of melatonergic genes with cancer progression. (A) Differentially expressed melatonergic genes between metastatic samples with lymph node metastasis or distant metastasis (N+M+) and non-metastatic samples with neither lymph node metastasis nor distant metastasis (N0M0). Red (1) and blue (-1) indicate significant overexpression and underexpression, respectively. The black box represents the consistent differentially expressed patterns in cancer development and progression. (B) Expression levels of CALM1 at different cancer stages in KIRC and BRCA. An ANOVA and Tukey’s post-hoc tests were used for pairwise comparisons. *, **, and *** indicate p < 0.05, p < 0.01, and p < 0.001, respectively.
Evaluation of Melatonergic Gene Expression in LIHC
We further evaluated the relationship between melatonergic gene expression and LIHC in the third independent dataset, LIRI-JP. With a 5% FDR, the expression levels of RORA, CALM1, and CYP1A2 were significantly lower in LIHC samples than in normal samples in all three datasets. RORA expression showed a decreased trend as the cancer AJCC stage increased (Figure 3A). Moreover, significant differences were observed between stage III–IV and stage I–II: TCGA-LIHC (p=0.0036) and LIRI-JP (p=0.0084). Then, we examined whether the expressional alterations of RORA, CALM1, and CYP1A2 influenced the survival rates of LIHC. All cancer samples were classified into two subgroups according to the median expression levels of the three genes (high vs low expression) in the three independent datasets. The results showed that RORA and CYP1A2 had favorable prognostic effects on OS, while CALM1 had no significant influence. A higher expression of RORA was associated with a favorable OS in the three datasets and better disease-specific survival (DSS) in the TCGA-LIHC dataset (Figure 3B). Similarly, patients with a higher expression of CYP1A2 had significantly better OS in the three datasets, better recurrence free survival (RFS) in the GSE14520 dataset, and better DSS and progression-free interval (PFI) in the TCGA-LIHC dataset (Figure 3C). Multivariate Cox regression analysis revealed that RORA was an independent prognostic factor in the TCGA-LIHC dataset after controlling for AFP, cancer size, and TNM stage (Figure 3D). Moreover, according to the Human Protein Atlas (HPA, https://www.proteinatlas.org/) database (47), the antibody staining proportions of protein RORA in HCC tissues were less than that in normal tissues. The detail information was shown in Supplementary Figure S1. The result suggested that the level of protein RORA might be underexpressed in HCC tissues.
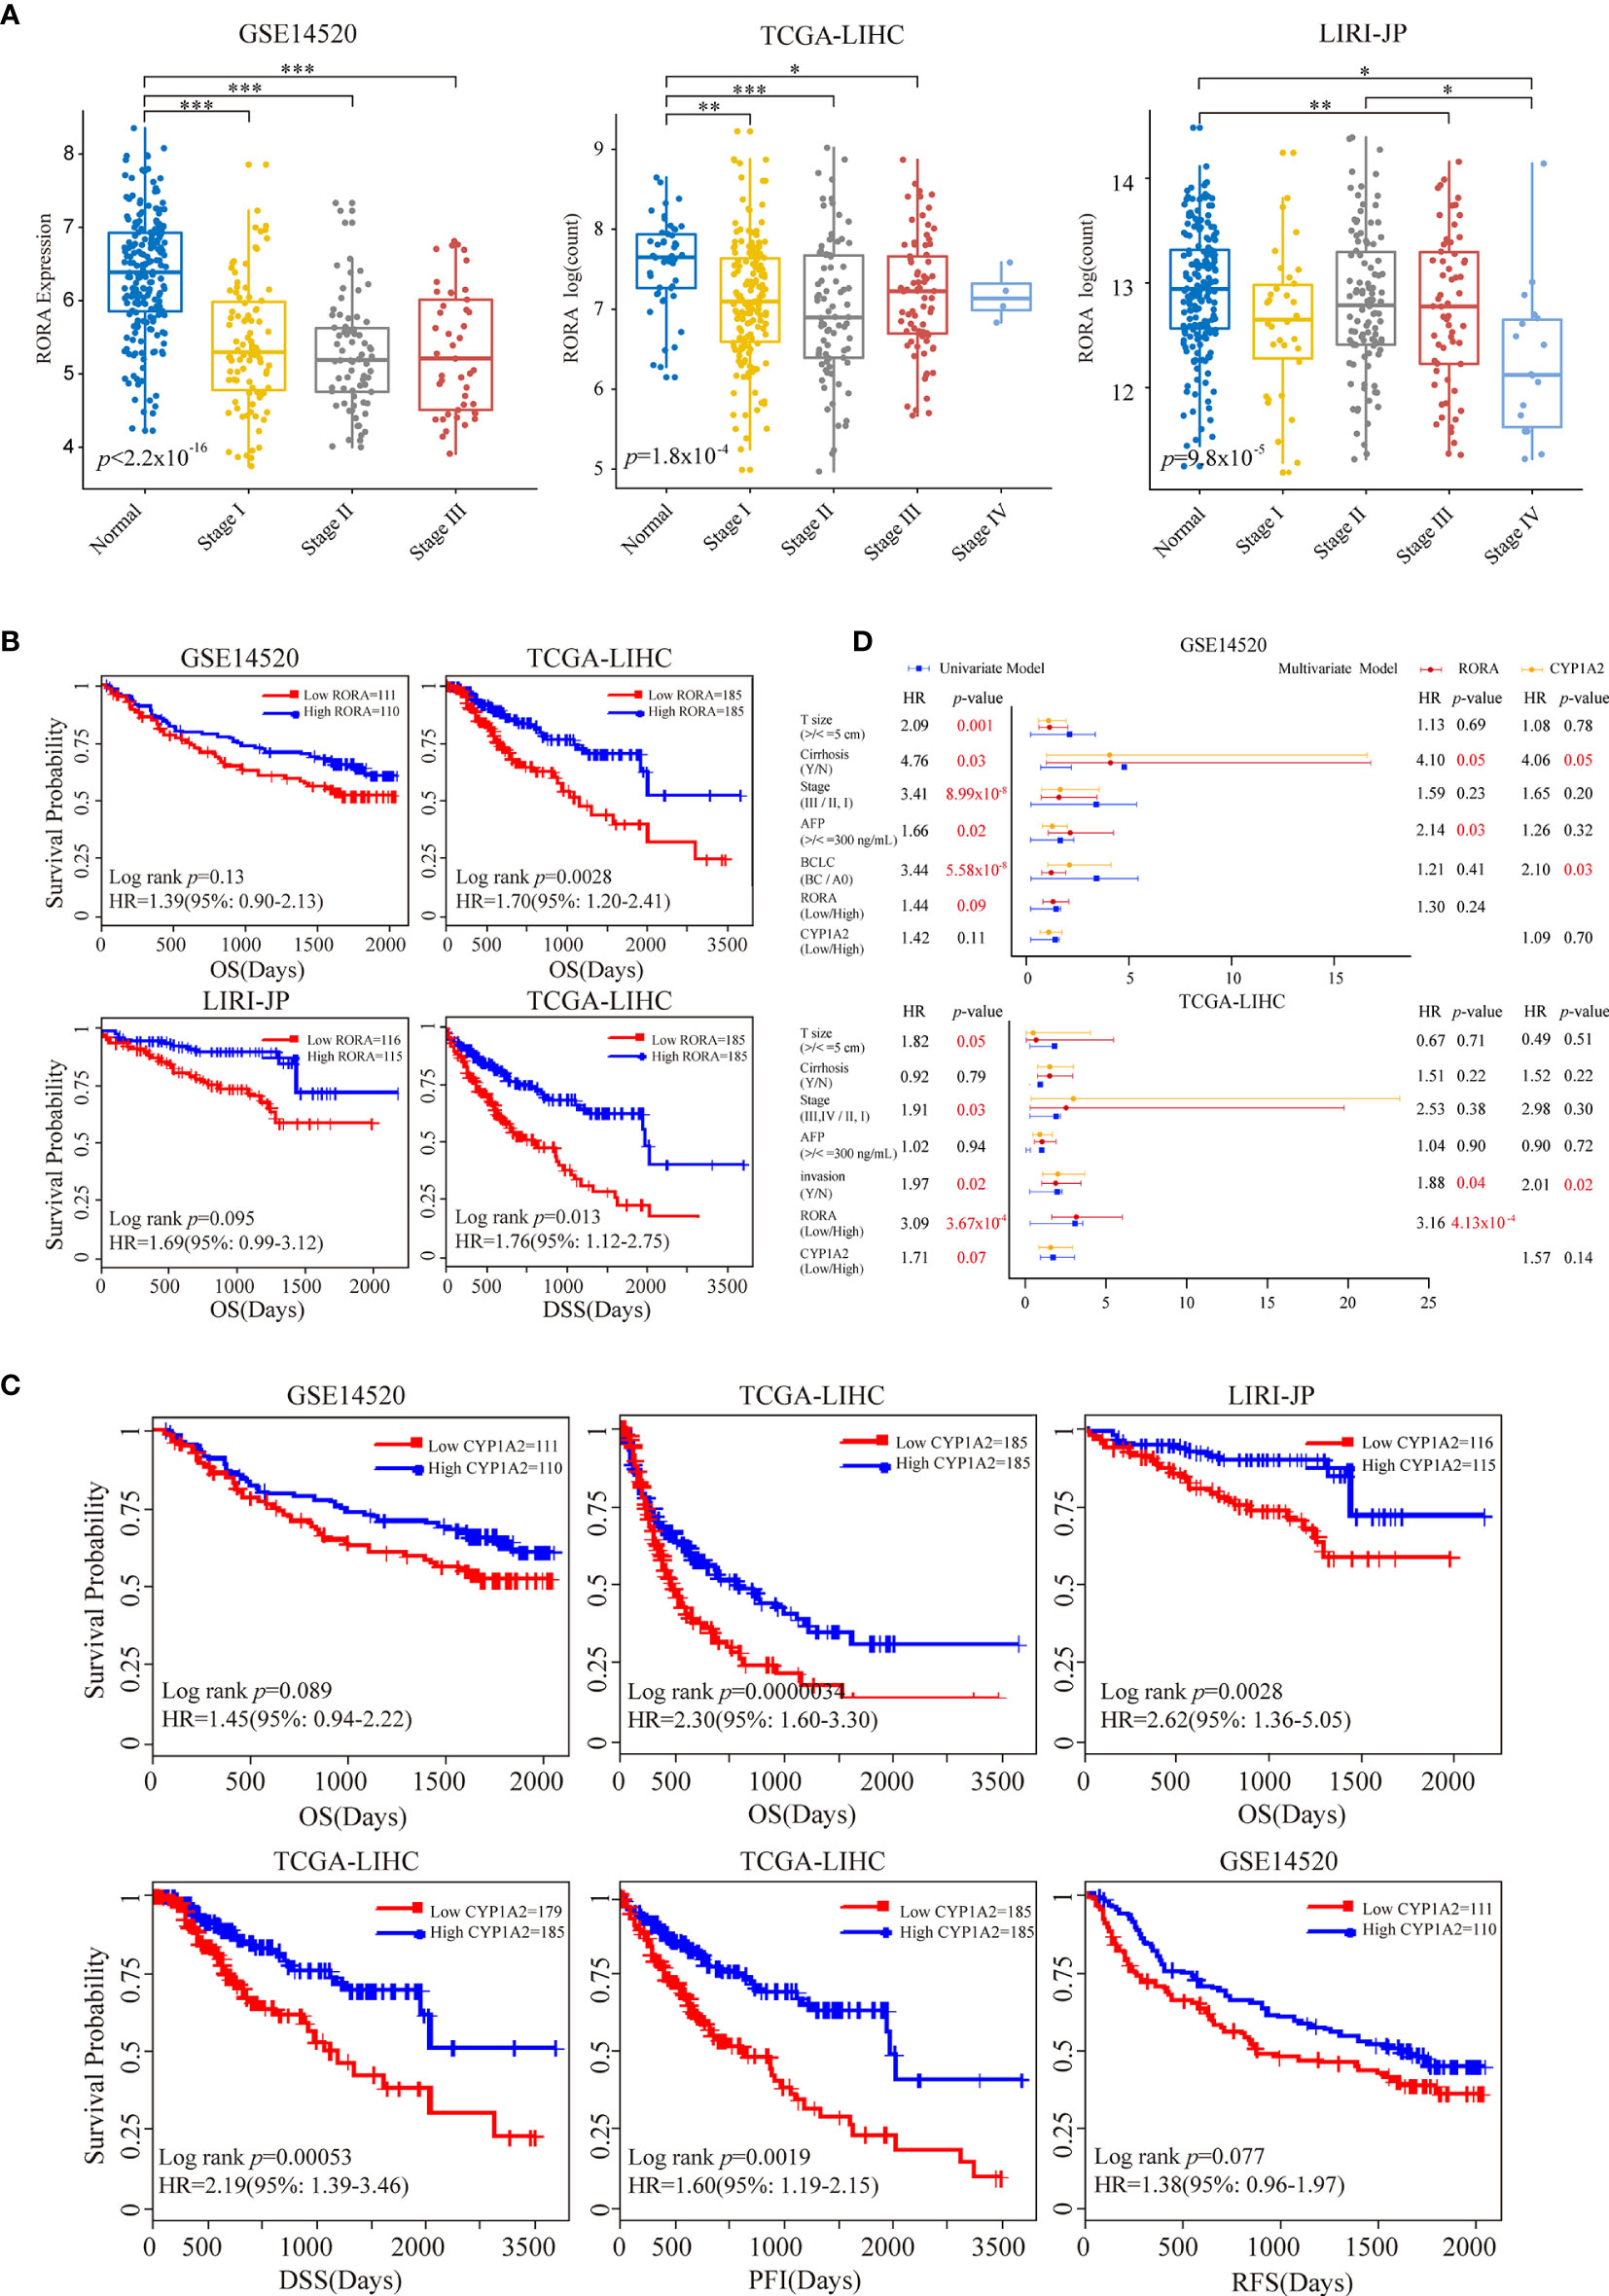
Figure 3 Prognostic impacts of RORA and CYP1A2 in three independent LIHC datasets. Patients were grouped according to the median expression levels of RORA and CYP1A2. (A) Expression levels of RORA at different cancer stages of three datasets. An ANOVA and Tukey’s post-hoc tests were used for pairwise comparisons. *, **, and *** indicate p < 0.05, p < 0.01, and p < 0.001, respectively. Kaplan-Meier survival curves of RORA (B) and CYP1A2 (C) on patient survival. (D) Univariate and multivariate Cox proportional hazard regression analysis of RORA and CYP1A2.
In the TCGA-LIHC and LIRI-JP datasets with available mutation data, we next investigated the relationship between RORA expression and the mutation status ofTP53 and CTNNB1, two of the most commonly mutated genes in LIHC (48). Studies have consistently reported a strong association between TP53 mutations and a poor prognosis, while results on the association of CTNNB1 mutations with prognosis have been contradictory (49, 50). In the present study, we observed that TP53 mutations were significantly associated with a worse OS, while there was no significant difference between CTNNB1 mutations and OS (Figure 4A). Next, all cancer samples were classified into a mutant group and a wild-type group according to TP53 or CTNNB1 mutations. We observed that RORA exhibited a significantly lower expression level in the TP53 mutant group than in the TP53 wild-type group (Figure 4B). All samples were classified into four subgroups according to TP53 mutations and the expression level of RORA. A significant difference in OS was observed in the four subgroups; patients harboring TP53 mutations and low expression of RORA had the worst OS (Figure 4C). In the two TP53 wild-type subgroups, a low expression level of RORA was significantly associated with a sharp decline in OS in the TCGA-LIHC cohort (p=0.0074) but had no significant association with OS in the LIRI-JP cohort (p=0.10). Furthermore, in the two subgroups with TP53 mutations, the expression level of RORA was not associated with patient OS. Similar analyses were performed in the four subgroups according to CTNNB1 mutations and the expression level of RORA. RORA exhibited a higher expression level in the CTNNB1 mutant group than in the CTNNB1 wild-type group (Figure 4D), while patients harboring CTNNB1 mutations and low expression of RORA had the worst OS (Figure 4E). In the TCGA-LIHC dataset, the association of RORA expression and patient OS in the two subgroups with wild-type CTNNB1 was significant (p=0.016), as was that of the two subgroups with CTNNB1 mutations (p=0.034). Collectively, these results suggest that the RORA expression may be a prognostic marker for HCC patients.
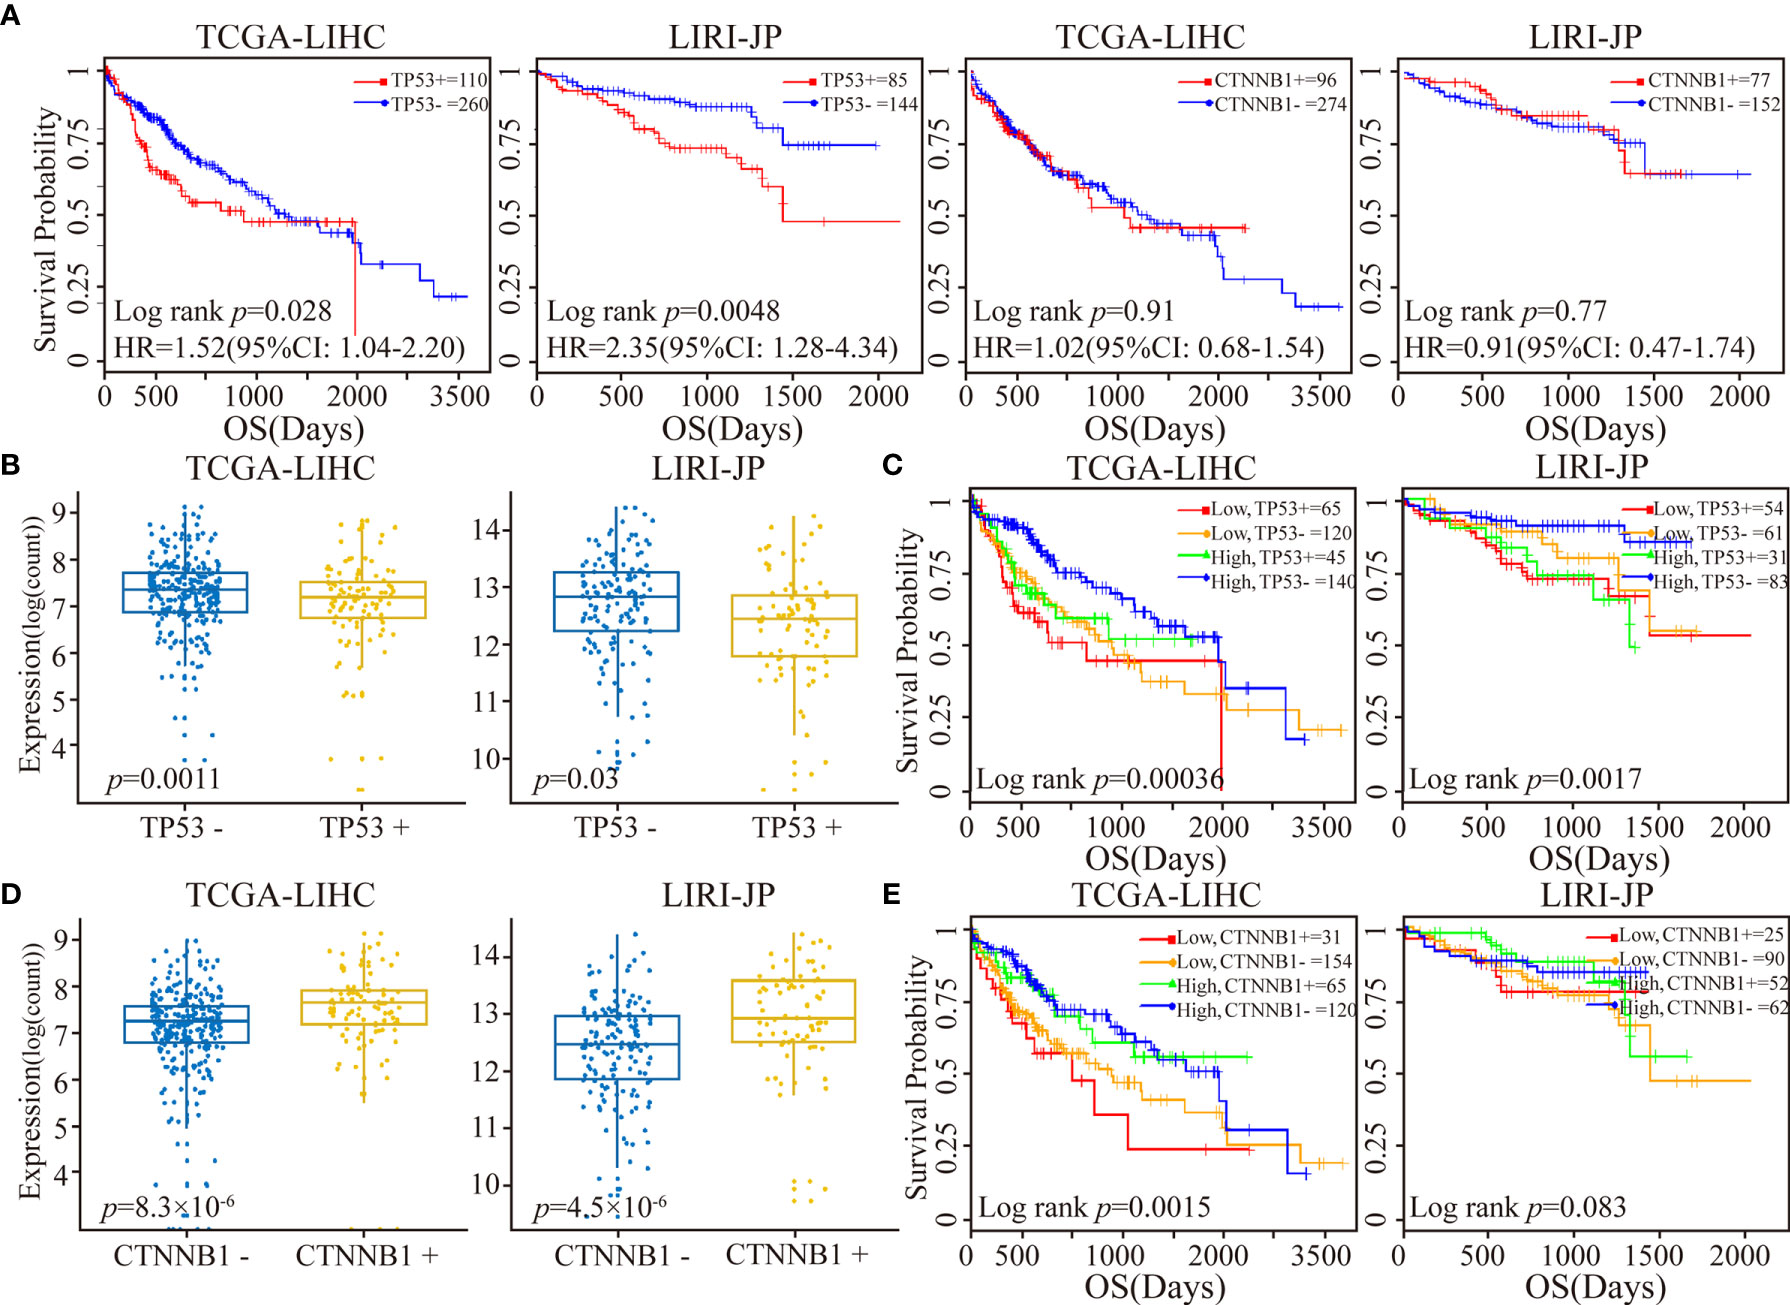
Figure 4 Patient stratification via the median expression level of RORA and TP53/CTNNB1 mutational status. (A) Kaplan-Meier survival curves of TP53 or CTNNB1 mutations on OS. (B) Box plots of RORA expression levels in patients classified with TP53 mutations. (C) Kaplan-Meier plots depicting a combined relation of TP53 mutational status and RORA expression with OS in HCC patients. (D) Box plots of RORA expression levels in patients classified with CTNNB1 mutations. (E) Kaplan-Meier plots depicting a combined relation of CTNNB1 mutation status and RORA expression levels with OS in HCC patients.
Because RORA showed a low mutation frequency in LIHC and few genomic or epigenetic alternation, then we analyzed the expressions of miRNAs which could regulate the expression of RORA. RORA has been predicted to have miRNA-binding sites, e.g., hsa-miR-3662 and hsa-miR-4643 (51–54). A total of 153 miRNAs which were predicted or verified to target RORA in at least two databases of miRTarBase, miRDB, and Targetscan were selected (Figure 5A). 12 miRNAs were differentially expressed (Student’s t-test, FDR<0.05, Figure 5B), of which 10 miRNAs were overexpressed in cancerous samples compared with normal samples. It has been reported that hsa-miR-137 could repress RORA in autism spectrum disorders (55). The result suggested that the abnormal expression pattern of RORA might be attributed to the dysregulation of miRNA.
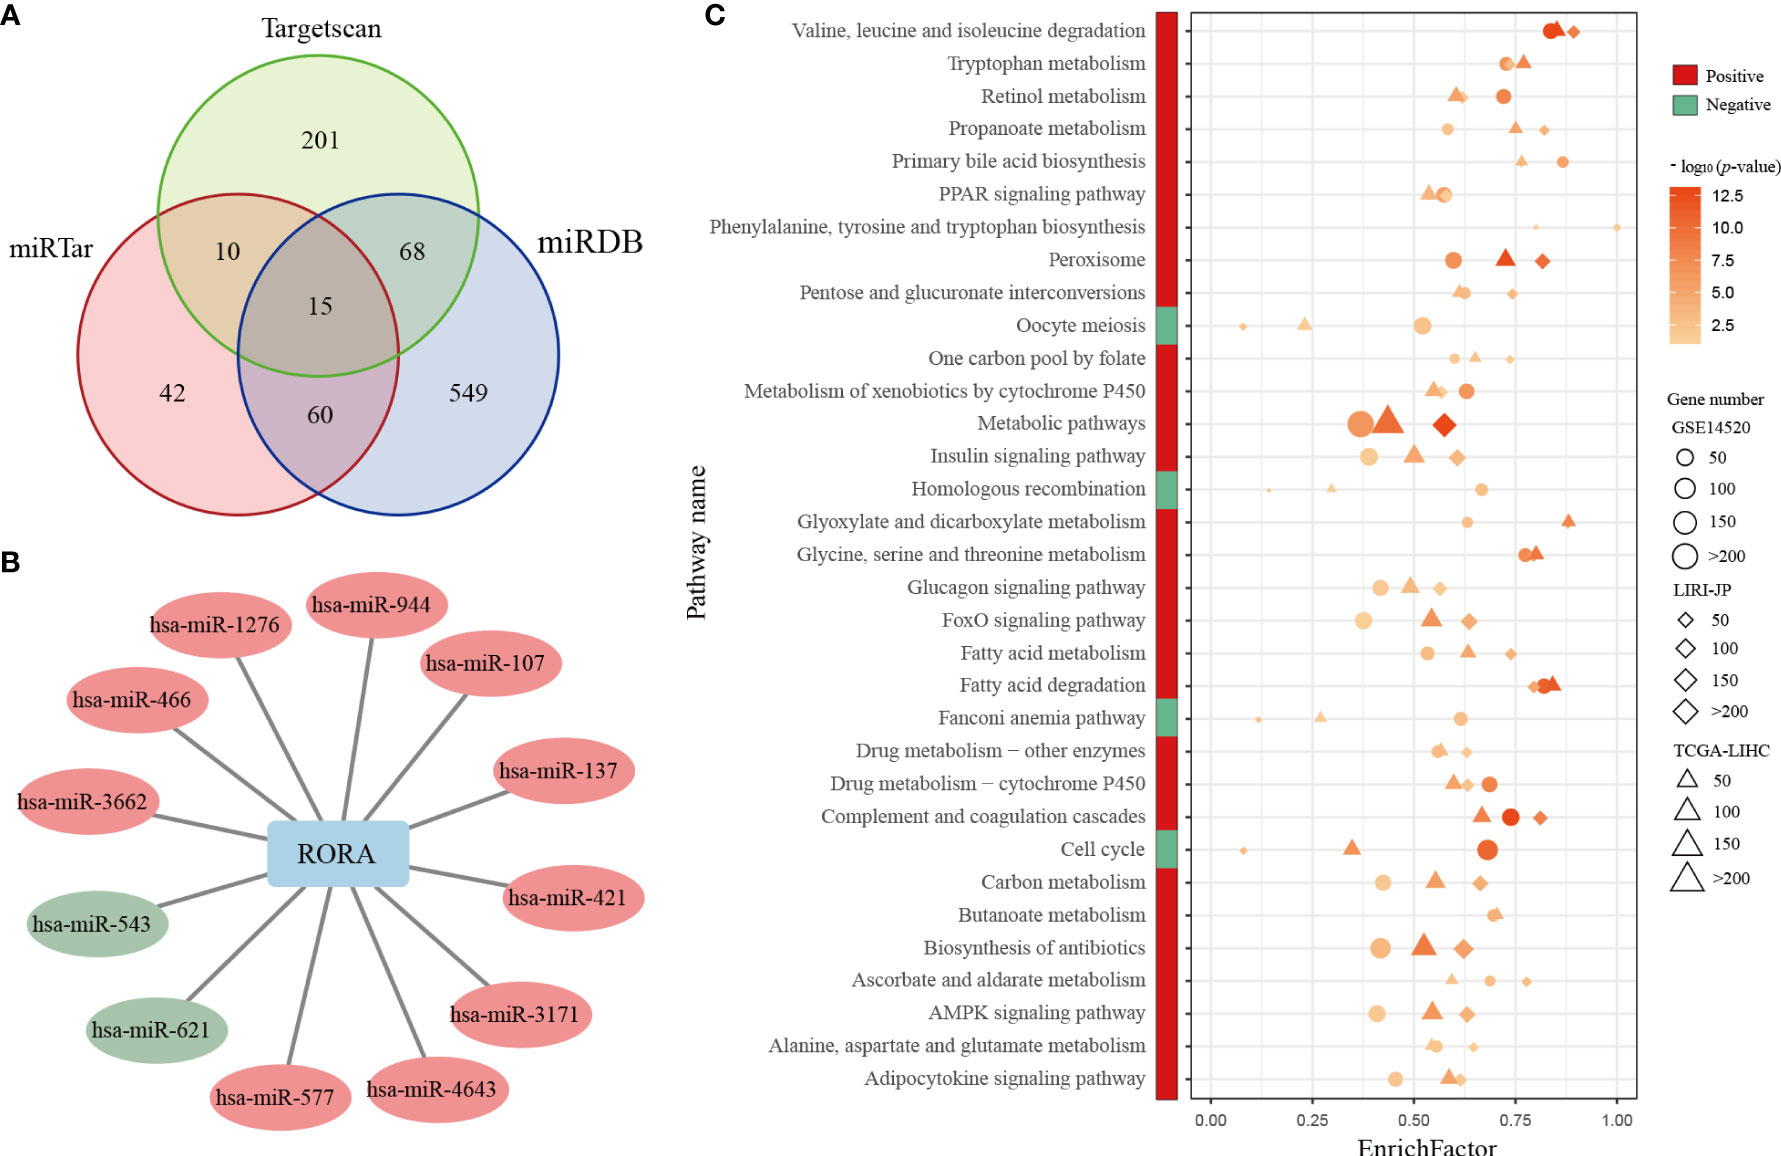
Figure 5 Differentially expressed miRNAs and common KEGG pathways enriched in RORA-related genes. (A) Venn diagram of miRNAs whichcan regulate RORA in the miRTarBase, miRDB, and Targetscan databases. (B) The interactions of differentially expressed miRNAs and RORA. Red and green circles indicate significant overexpression and underexpression miRNA in LIHC, respectively (Student’s t-test, FDR<0.05). (C) Red and green boxes indicate pathways enriched in RORA-positively regulated and RORA-negatively related genes, respectively. The three shapes indicate the pathways enriched in different datasets: circles for GSE14520, diamonds for LIRI-JP, and triangles for TCGA-LIHC. The sizes of shapes indicate the numbers of RORA-related genes enriched in a specific pathway. The p values of KEGG pathways were adjusted by BH (FDR < 5%), and -log10(p) was used to generate the heatmap.
Pearson correlation analyses identified 3,633, 6,909, and 8,538 genes that were significantly positively correlated with RORA expression in the GSE14520, TCGA-LIHC, and LIRI-JP datasets (p<0.05), respectively. With a 5% FDR, these genes were significantly enriched in 29 common biological pathways in all three datasets (Figure 5C). These pathways were mostly associated with metabolic mechanisms related to the development of HCC, including fatty acid metabolism and xenobiotic metabolism via cytochrome P450. Likewise, 4,859, 3,343, and 449 genes were significantly negatively correlated with RORA expression in the GSE14520, TCGA-LIHC, and LIRI-JP datasets, respectively, which were enriched in four common biological pathways (FDR<0.05), namely, those involving homologous recombination, Fanconi anemia, cell-cycle progression, and oocyte meiosis. Collectively, these results indicate that RORA might regulate these pathways to exhibit its favorable prognostic effects in HCC.
Discussion
In the present study, we systematically investigated the relationships between melatonergic genes and the occurrence, progression, and prognosis of cancer across 11 cancer types. The results showed that nuclear receptor genes, intracellular receptor genes, and metabolic genes were coherently underexpressed in multiple cancer types, whereas membrane receptor genes and synthetic genes were rarely differentially expressed. Multi-omic analyses showed that the abnormal expression patterns of melatonergic genes were partially attributed to genomic and epigenetic alterations. Furthermore, the majority of melatonergic genes had significant prognostic effects in various cancers. Nevertheless, few alterations in melatonergic gene expression were observed during cancer progression.
Recently, Lv et al. performed a genome-wide characterization of the melatonergic microenvironment in human cancers using TCGA RNA-seq data and revealed that the rates of melatonergic synthesis and metabolism were negatively correlated with mutational burden and clinical outcome (56). This previous study provided a key insight into the role of the melatonergic synthesis/metabolism system in cancer biology. However, this previous study only included one synthetic gene, ASMT, and three metabolic genes (CYP1A1, CYP1A2, and CYP1B1), and receptor genes were not assessed. Moreover, this previous study only analyzed TCGA RNA-seq data and did not included any microarray data. Notably, in the present study, we included both RNA-seq from TCGA and microarray data from GEO to analyze 12 melatonergic genes across 11 cancer types. For a particular cancer type, only melatonergic genes with a consistent differentially expressed status in both the RNA-seq and microarray datasets were assessed for transcriptional alterations. This approach may have helped to mitigate uncertainty in different platforms due to different design principles, and may have helped to yield more reproducible results.
Our investigation of melatonergic genes in three independent datasets identified RORA as a cancer suppresser and prognostic marker in LIHC, consistent with some previous studies (57–59). However, these previous studies were performed in vitro and/or identified changes in mRNA levels by quantitative reverse-transcriptase polymerase chain reaction. Our present study demonstrated a suppressive role of RORA in LIHC via high-throughput gene expression profiles in large-scale independent samples, revealing a relationship between RORA expression levels and clinicopathological features of LIHC. Furthermore, we found that RORA was significantly underexpressed in eight cancer types but was overexpressed in KIRC, suggesting that the biological impacts of expressional alterations in melatonergic genes are dependent on the cancer type. A study has presented that RORA is involved in kidney development (60). The overexpression of RORA in KIRC might be due to its tissue specificity. Such cancer-type specificities revealed via pan-cancer analyses suggest that melatonergic genes may have clinical utility.
Many studies have reported anticancer effects of melatonin through induction of apoptosis and cell-cycle arrest (13, 54, 61). The results of our functional enrichment analysis of RORA-negatively correlated genes in LIHC were consistent with findings from previous studies, such as the finding of an enrichment in cell-cycle pathways. The coincidence of underexpression of RORA and overexpression of RORA-negatively correlated genes might promote cell-cycle progression of cancer cells, which would further promote cancer development. RORA-positively correlated genes in LIHC were mostly enriched in metabolism-related pathways, which might be due to the liver being the main metabolic organ disrupted in LIHC.
In our study, CYP1A2 was significantly differentially hypomethylated in five types of cancer, which was significantly differentially underexpressed in four of them. The inconsistence between hypomethylation and underexpression of gene is possibly due to that hypomethylation always allies with gene activation to enhance gene expression (62). Moreover, DNA hypomethylation in some regions may further leads to gene silence (63). The metabolic genes, CYP1A1 and CYP1A2, were widely underexpressed in multiple cancer types, whereas CYP1B1 exhibited different alterations in expression patterns. This result may be due to CYP1B1 having a ubiquitous extra hepatic distribution and being primarily responsible for the metabolism of melatonin in the brain (10). Furthermore, relevant pathways of melatonergic genes involved in different types of cancers are worthy of further investigation in future studies. Melatonin has been reported to play a protective role in cancer metastasis (64). However, our present findings revealed that a minority of melatonergic genes were differentially expressed between metastatic and non-metastatic samples, and that alterations in expression patterns varied greatly across cancer types. Therefore, the protective effects of melatonin during cancer progression require further cancer-type-specific analysis.
Data Availability Statement
The original contributions presented in the study are included in the article/Supplementary Material. Further inquiries can be directed to the corresponding authors.
Author Contributions
All authors had full access to all the data in the study and take responsibility for the integrity of the data and the accuracy of the data analysis. LA and RZ conceived and supervised the study. YZ, HS, and YG acquired the data and participated in the statistical analysis. ZJ and YS participated in the statistical analysis and drew the figures. JH, LL, FJ, ZL, and JW interpreted the results. YZ, HS, and YG drafted the manuscript. LA and YL revised the manuscript. All authors contributed to the article and approved the submitted version.
Funding
This work was supported by the National Natural Science Foundation of China (Grant No. 81602738), the Joint Scientific and Technology Innovation Fund of Fujian Province (Grant No. 2018Y9065), the Joint research program of health and education in Fujian Province (Grant No. 2019-WJ-32), the Natural Science Foundation of Fujian Province (Grant No. 2020J01600), and Undergraduate Training Programs for Innovation and Entrepreneurship of Fujian Medical University (Grant No. C20092).
Conflict of Interest
The authors declare that the research was conducted in the absence of any commercial or financial relationships that could be construed as a potential conflict of interest.
Acknowledgments
We thank Professor Zheng Guo of Fujian Medical University for participating in conceiving the idea of this study.
Supplementary Material
The Supplementary Material for this article can be found online at: https://www.frontiersin.org/articles/10.3389/fonc.2021.643983/full#supplementary-material
Supplementary Figure 1 | IHC-based antibody-specific staining in HCC and normal liver tissues.
Supplementary Table 1 | Metastasis information of TCGA samples.
Supplementary Table 2 | Clinical characteristics of HCC patients in three datasets.
Supplementary Table 3 | Score of differentially expressed status from microarray dataset, sarray.
Supplementary Table 4 | Score of differentially expressed status from RNA-seq dataset, sseq.
Supplementary Table 5 | Differentially expressed status of melatonergic genes in the TCGA data.
Supplementary Table 6 | Differentially expressed status of melatonergic genes in the microarray data.
References
1. Talib WH. Melatonin and Cancer Hallmarks. Molecules (2018) 23(3):518. doi: 10.3390/molecules23030518
2. Dubocovich ML, Hudson RL, Sumaya IC, Masana MI, Manna E. Effect of MT1 melatonin receptor deletion on melatonin-mediated phase shift of circadian rhythms in the C57BL/6 mouse. J Pineal Res (2005) 39(2):113–20. doi: 10.1111/j.1600-079X.2005.00230.x
3. Dubocovich ML, Yun K, Al-Ghoul WM, Benloucif S, Masana MI. Selective MT2 melatonin receptor antagonists block melatonin-mediated phase advances of circadian rhythms. FASEB J (1998) 12(12):1211–20. doi: 10.1096/fasebj.12.12.1211
4. Carrillo-Vico A, Guerrero JM, Lardone PJ, Reiter RJ. A review of the multiple actions of melatonin on the immune system. Endocrine (2005) 27(2):189–200. doi: 10.1385/ENDO:27:2:189
5. de Faria Poloni J, Feltes BC, Bonatto D. Melatonin as a central molecule connecting neural development and calcium signaling. Funct Integr Genomics (2011) 11(3):383–8. doi: 10.1007/s10142-011-0221-8
6. Nosjean O, Ferro M, Coge F, Beauverger P, Henlin JM, Lefoulon F, et al. Identification of the melatonin-binding site MT3 as the quinone reductase 2. J Biol Chem (2000) 275(40):31311–7. doi: 10.1074/jbc.M005141200
7. Levoye A, Dam J, Ayoub MA, Guillaume JL, Couturier C, Delagrange P, et al. The orphan GPR50 receptor specifically inhibits MT1 melatonin receptor function through heterodimerization. EMBO J (2006) 25(13):3012–23. doi: 10.1038/sj.emboj.7601193
8. Simonneaux V, Ribelayga C. Generation of the melatonin endocrine message in mammals: a review of the complex regulation of melatonin synthesis by norepinephrine, peptides, and other pineal transmitters. Pharmacol Rev (2003) 55(2):325–95. doi: 10.1124/pr.55.2.2
9. Young IM, Leone RM, Francis P, Stovell P, Silman RE. Melatonin is metabolized to N-acetyl serotonin and 6-hydroxymelatonin in man. J Clin Endocrinol Metab (1985) 60(1):114–9. doi: 10.1210/jcem-60-1-114
10. Ma X, Idle JR, Krausz KW, Gonzalez FJ. Metabolism of melatonin by human cytochromes p450. Drug Metab Dispos (2005) 33(4):489–94. doi: 10.1124/dmd.104.002410
11. Liu M, He S, Cheng L, Qu J, Xia J. Phase-Separated Multienzyme Biosynthesis. Biomacromolecules (2020) 21(6):2391–9. doi: 10.1021/acs.biomac.0c00321
12. Lee SE, Kim SJ, Youn JP, Hwang SY, Park CS, Park YS. MicroRNA and gene expression analysis of melatonin-exposed human breast cancer cell lines indicating involvement of the anticancer effect. J Pineal Res (2011) 51(3):345–52. doi: 10.1111/j.1600-079X.2011.00896.x
13. Carbajo-Pescador S, Garcia-Palomo A, Martin-Renedo J, Piva M, Gonzalez-Gallego J, Mauriz JL. Melatonin modulation of intracellular signaling pathways in hepatocarcinoma HepG2 cell line: role of the MT1 receptor. J Pineal Res (2011) 51(4):463–71. doi: 10.1111/j.1600-079X.2011.00910.x
14. Hong Y, Won J, Lee Y, Lee S, Park K, Chang KT, et al. Melatonin treatment induces interplay of apoptosis, autophagy, and senescence in human colorectal cancer cells. J Pineal Res (2014) 56(3):264–74. doi: 10.1111/jpi.12119
15. Schernhammer ES, Hankinson SE. Urinary melatonin levels and postmenopausal breast cancer risk in the Nurses’ Health Study cohort. Cancer Epidemiol Biomarkers Prev (2009) 18(1):74–9. doi: 10.1158/1055-9965.EPI-08-0637
16. Bao S, Zhao H, Yuan J, Fan D, Zhang Z, Su J, et al. Computational identification of mutator-derived lncRNA signatures of genome instability for improving the clinical outcome of cancers: a case study in breast cancer. Brief Bioinform (2020) 21(5):1742–55. doi: 10.1093/bib/bbz118
17. Kojetin DJ, Burris TP. REV-ERB and ROR nuclear receptors as drug targets. Nat Rev Drug Discovery (2014) 13(3):197–216. doi: 10.1038/nrd4100
18. Liu J, Clough SJ, Hutchinson AJ, Adamah-Biassi EB, Popovska-Gorevski M, Dubocovich ML. MT1 and MT2 Melatonin Receptors: A Therapeutic Perspective. Annu Rev Pharmacol Toxicol (2016) 56:361–83. doi: 10.1146/annurev-pharmtox-010814-124742
19. Yuan L, Collins AR, Dai J, Dubocovich ML, Hill SM. MT(1) melatonin receptor overexpression enhances the growth suppressive effect of melatonin in human breast cancer cells. Mol Cell Endocrinol (2002) 192(1-2):147–56. doi: 10.1016/s0303-7207(02)00029-1
20. Kadekaro AL, Andrade LN, Floeter-Winter LM, Rollag MD, Virador V, Vieira W, et al. MT-1 melatonin receptor expression increases the antiproliferative effect of melatonin on S-91 murine melanoma cells. J Pineal Res (2004) 36(3):204–11. doi: 10.1111/j.1600-079x.2004.00119.x
21. Vaccarella S, Lortet-Tieulent J, Colombet M, Davies L, Stiller CA, Schuz J, et al. Global patterns and trends in incidence and mortality of thyroid cancer in children and adolescents: a population-based study. Lancet Diabetes Endocrinol (2021) 9(3):144–52. doi: 10.1016/S2213-8587(20)30401-0
22. Dawkins J, Webster RM. The hepatocellular carcinoma market. Nat Rev Drug Discovery (2019) 18(1):13–4. doi: 10.1038/nrd.2018.146
23. Rimola J, Diaz-Gonzalez A, Darnell A, Varela M, Pons F, Hernandez-Guerra M, et al. Complete response under sorafenib in patients with hepatocellular carcinoma: Relationship with dermatologic adverse events. Hepatology (2018) 67(2):612–22. doi: 10.1002/hep.29515
24. Ao L, Li L, Sun H, Chen H, Li Y, Huang H, et al. Transcriptomic analysis on the effects of melatonin in gastrointestinal carcinomas. BMC Gastroenterol (2020) 20(1):233. doi: 10.1186/s12876-020-01383-z
25. Prieto-Dominguez N, Ordonez R, Fernandez A, Mendez-Blanco C, Baulies A, Garcia-Ruiz C, et al. Melatonin-induced increase in sensitivity of human hepatocellular carcinoma cells to sorafenib is associated with reactive oxygen species production and mitophagy. J Pineal Res (2016) 61(3):396–407. doi: 10.1111/jpi.12358
26. Zhou B, Lu Q, Liu J, Fan L, Wang Y, Wei W, et al. Melatonin Increases the Sensitivity of Hepatocellular Carcinoma to Sorafenib through the PERK-ATF4-Beclin1 Pathway. Int J Biol Sci (2019) 15(9):1905–20. doi: 10.7150/ijbs.32550
27. Tomczak K, Czerwinska P, Wiznerowicz M. The Cancer Genome Atlas (TCGA): an immeasurable source of knowledge. Contemp Oncol (Pozn) (2015) 19(1A):A68–77. doi: 10.5114/wo.2014.47136
28. Irizarry RA, Hobbs B, Collin F, Beazer-Barclay YD, Antonellis KJ, Scherf U, et al. Exploration, normalization, and summaries of high density oligonucleotide array probe level data. Biostatistics (2003) 4(2):249–64. doi: 10.1093/biostatistics/4.2.249
29. Zhou W, Koudijs KKM, Bohringer S. Influence of batch effect correction methods on drug induced differential gene expression profiles. BMC Bioinf (2019) 20(1):437. doi: 10.1186/s12859-019-3028-6
30. Jimenez-Jacinto V, Sanchez-Flores A, Vega-Alvarado L. Integrative Differential Expression Analysis for Multiple EXperiments (IDEAMEX): A Web Server Tool for Integrated RNA-Seq Data Analysis. Front Genet (2019) 10:279:279. doi: 10.3389/fgene.2019.00279
31. Carter H, Samayoa J, Hruban RH, Karchin R. Prioritization of driver mutations in pancreatic cancer using cancer-specific high-throughput annotation of somatic mutations (CHASM). Cancer Biol Ther (2010) 10(6):582–7. doi: 10.4161/cbt.10.6.12537
32. Mermel CH, Schumacher SE, Hill B, Meyerson ML, Beroukhim R, Getz G. GISTIC2.0 facilitates sensitive and confident localization of the targets of focal somatic copy-number alteration in human cancers. Genome Biol (2011) 12(4):R41. doi: 10.1186/gb-2011-12-4-r41
33. Chou CH, Shrestha S, Yang CD, Chang NW, Lin YL, Liao KW, et al. miRTarBase update 2018: a resource for experimentally validated microRNA-target interactions. Nucleic Acids Res (2018) 46(D1):D296–302. doi: 10.1093/nar/gkx1067
34. Chen Y, Wang X. miRDB: an online database for prediction of functional microRNA targets. Nucleic Acids Res (2020) 48(D1):D127–D31. doi: 10.1093/nar/gkz757
35. Agarwal V, Bell GW, Nam JW, Bartel DP. Predicting effective microRNA target sites in mammalian mRNAs. Elife (2015) 4:1–38. doi: 10.7554/eLife.05005
36. Robinson MD, McCarthy DJ, Smyth GK. edgeR: a Bioconductor package for differential expression analysis of digital gene expression data. Bioinformatics (2010) 26(1):139–40. doi: 10.1093/bioinformatics/btp616
37. Xi WD, Liu YJ, Sun XB, Shan J, Yi L, Zhang TT. Bioinformatics analysis of RNA-seq data revealed critical genes in colon adenocarcinoma. Eur Rev Med Pharmacol Sci (2017) 21(13):3012–20.
38. Hochberg Y, Benjamini Y. More powerful procedures for multiple significance testing. Stat Med (1990) 9(7):811–8. doi: 10.1002/sim.4780090710
39. Zhang Z, Wiencke JK, Koestler DC, Salas LA, Christensen BC, Kelsey KT. Absence of an embryonic stem cell DNA methylation signature in human cancer. BMC Cancer (2019) 19(1):711. doi: 10.1186/s12885-019-5932-6
40. Harrell FE Jr., Lee KL, Mark DB. Multivariable prognostic models: issues in developing models, evaluating assumptions and adequacy, and measuring and reducing errors. Stat Med (1996) 15(4):361–87. doi: 10.1002/(SICI)1097-0258(19960229)15:4<361::AID-SIM168>3.0.CO;2-4
41. Pavlic K, Perme MP. On comparison of net survival curves. BMC Med Res Methodol (2017) 17(1):79. doi: 10.1186/s12874-017-0351-3
42. Fury W, Batliwalla F, Gregersen PK, Li W. Overlapping probabilities of top ranking gene lists, hypergeometric distribution, and stringency of gene selection criterion. Conf Proc IEEE Eng Med Biol Soc (2006) 2006:5531–4. doi: 10.1109/IEMBS.2006.260828
43. Nemeth C, Humpeler S, Kallay E, Mesteri I, Svoboda M, Rogelsperger O, et al. Decreased expression of the melatonin receptor 1 in human colorectal adenocarcinomas. J Biol Regul Homeost Agents (2011) 25(4):531–42. doi: 10.1139/H11-084
44. Wang RX, Liu H, Xu L, Zhang H, Zhou RX. Involvement of nuclear receptor RZR/RORgamma in melatonin-induced HIF-1alpha inactivation in SGC-7901 human gastric cancer cells. Oncol Rep (2015) 34(5):2541–6. doi: 10.3892/or.2015.4238
45. Wang RX, Liu H, Xu L, Zhang H, Zhou RX. Melatonin downregulates nuclear receptor RZR/RORgamma expression causing growth-inhibitory and anti-angiogenesis activity in human gastric cancer cells in vitro and in vivo. Oncol Lett (2016) 12(2):897–903. doi: 10.3892/ol.2016.4729
46. Bubenik GA. Thirty four years since the discovery of gastrointestinal melatonin. J Physiol Pharmacol (2008) 59 Suppl 2:33–51. doi: 10.2170/physiolsci.RP006108
47. Uhlen M, Bjorling E, Agaton C, Szigyarto CA, Amini B, Andersen E, et al. A human protein atlas for normal and cancer tissues based on antibody proteomics. Mol Cell Proteomics (2005) 4(12):1920–32. doi: 10.1074/mcp.M500279-MCP200
48. Lee JS. The mutational landscape of hepatocellular carcinoma. Clin Mol Hepatol (2015) 21(3):220–9. doi: 10.3350/cmh.2015.21.3.220
49. Cieply B, Zeng G, Proverbs-Singh T, Geller DA, Monga SP. Unique phenotype of hepatocellular cancers with exon-3 mutations in beta-catenin gene. Hepatology (2009) 49(3):821–31. doi: 10.1002/hep.22695
50. Mao TL, Chu JS, Jeng YM, Lai PL, Hsu HC. Expression of mutant nuclear beta-catenin correlates with non-invasive hepatocellular carcinoma, absence of portal vein spread, and good prognosis. J Pathol (2001) 193(1):95–101. doi: 10.1002/1096-9896(2000)9999:9999<::AID-PATH720>3.0.CO;2-3
51. Kishore S, Jaskiewicz L, Burger L, Hausser J, Khorshid M, Zavolan M. A quantitative analysis of CLIP methods for identifying binding sites of RNA-binding proteins. Nat Methods (2011) 8(7):559–64. doi: 10.1038/nmeth.1608
52. Zhou M, Zhang Z, Bao S, Hou P, Yan C, Su J, et al. Computational recognition of lncRNA signature of tumor-infiltrating B lymphocytes with potential implications in prognosis and immunotherapy of bladder cancer. Brief Bioinform (2020) 21(3):1–13. doi: 10.1093/bib/bbaa047
53. Spengler RM, Zhang X, Cheng C, McLendon JM, Skeie JM, Johnson FL, et al. Elucidation of transcriptome-wide microRNA binding sites in human cardiac tissues by Ago2 HITS-CLIP. Nucleic Acids Res (2016) 44(15):7120–31. doi: 10.1093/nar/gkw640
54. Cheng L, Leung KS. Quantification of non-coding RNA target localization diversity and its application in cancers. J Mol Cell Biol (2018) 10(2):130–8. doi: 10.1093/jmcb/mjy006
55. Devanna P, Vernes SC. A direct molecular link between the autism candidate gene RORa and the schizophrenia candidate MIR137. Sci Rep (2014) 4:3994. doi: 10.1038/srep03994
56. Lv JW, Zheng ZQ, Wang ZX, Zhou GQ, Chen L, Mao YP, et al. Pan-cancer genomic analyses reveal prognostic and immunogenic features of the tumor melatonergic microenvironment across 14 solid cancer types. J Pineal Res (2019) 66(3):e12557. doi: 10.1111/jpi.12557
57. Fu RD, Qiu CH, Chen HA, Zhang ZG, Lu MQ. Retinoic acid receptor-related receptor alpha (RORalpha) is a prognostic marker for hepatocellular carcinoma. Tumour Biol (2014) 35(8):7603–10. doi: 10.1007/s13277-014-2007-9
58. Byun JK, Choi YK, Kang YN, Jang BK, Kang KJ, Jeon YH, et al. Retinoic acid-related orphan receptor alpha reprograms glucose metabolism in glutamine-deficient hepatoma cells. Hepatology (2015) 61(3):953–64. doi: 10.1002/hep.27577
59. Ou Z, Shi X, Gilroy RK, Kirisci L, Romkes M, Lynch C, et al. Regulation of the human hydroxysteroid sulfotransferase (SULT2A1) by RORalpha and RORgamma and its potential relevance to human liver diseases. Mol Endocrinol (2013) 27(1):106–15. doi: 10.1210/me.2012-1145
60. Qi X, Okinaka Y, Nishita M, Minami Y. Essential role of Wnt5a-Ror1/Ror2 signaling in metanephric mesenchyme and ureteric bud formation. Genes Cells (2016) 21(4):325–34. doi: 10.1111/gtc.12342
61. Martin-Renedo J, Mauriz JL, Jorquera F, Ruiz-Andres O, Gonzalez P, Gonzalez-Gallego J. Melatonin induces cell cycle arrest and apoptosis in hepatocarcinoma HepG2 cell line. J Pineal Res (2008) 45(4):532–40. doi: 10.1111/j.1600-079X.2008.00641.x
62. Xiong L, Wu F, Wu Q, Xu L, Cheung OK, Kang W, et al. Aberrant enhancer hypomethylation contributes to hepatic carcinogenesis through global transcriptional reprogramming. Nat Commun (2019) 10(1):335. doi: 10.1038/s41467-018-08245-z
63. Hon GC, Hawkins RD, Caballero OL, Lo C, Lister R, Pelizzola M, et al. Global DNA hypomethylation coupled to repressive chromatin domain formation and gene silencing in breast cancer. Genome Res (2012) 22(2):246–58. doi: 10.1101/gr.125872.111
Keywords: melatonergic genes, pan-cancer analysis, expressional alteration, cancer occurrence and progression, prognosis
Citation: Zou Y, Sun H, Guo Y, Shi Y, Jiang Z, Huang J, Li L, Jiang F, Lin Z, Wu J, Zhou R, Liu Y and Ao L (2021) Integrative Pan-Cancer Analysis Reveals Decreased Melatonergic Gene Expression in Carcinogenesis and RORA as a Prognostic Marker for Hepatocellular Carcinoma. Front. Oncol. 11:643983. doi: 10.3389/fonc.2021.643983
Received: 22 December 2020; Accepted: 02 March 2021;
Published: 25 March 2021.
Edited by:
Meng Zhou, Wenzhou Medical University, ChinaReviewed by:
Lixin Cheng, Jinan University, ChinaShitao Rao, The Chinese University of Hong Kong, China
Copyright © 2021 Zou, Sun, Guo, Shi, Jiang, Huang, Li, Jiang, Lin, Wu, Zhou, Liu and Ao. This is an open-access article distributed under the terms of the Creative Commons Attribution License (CC BY). The use, distribution or reproduction in other forums is permitted, provided the original author(s) and the copyright owner(s) are credited and that the original publication in this journal is cited, in accordance with accepted academic practice. No use, distribution or reproduction is permitted which does not comply with these terms.
*Correspondence: Lu Ao, bHVrZXlAZmptdS5lZHUuY24=; Yuncai Liu, d2hvbWxpdUBzanR1LmVkdS5jbg==; Ruixiang Zhou, emhvdXJ4QG1haWwuZmptdS5lZHUuY24=
†These authors have contributed equally to this work