 Chun-Bi Chang1,2†Yu-Chun Lin2,3
 Yon-Cheong Wong1,2
 Shin-Nan Lin1,2
 Chien-Yuan Lin4Yu-Han Lin3†Ting-Wen Sheng2,5Chen-Chih Huang2,5Lan-Yan Yang6*‡
 Li-Jen Wang2,5*‡
- 1Department of Medical Imaging and Intervention, Chang Gung Memorial Hospital, College of Medicine, Chang Gung University, Taoyuan, Taiwan
- 2Department of Medical Imaging and Radiological Sciences, Chang Gung University, Taoyuan, Taiwan
- 3Department of Medical Imaging and Intervention, Chang Gung Memorial Hospital, Taoyuan, Taiwan
- 4Department of Clinical Science, General Electric (GE) Healthcare, Taipei, Taiwan
- 5Department of Medical Imaging and Intervention, New Taipei Municipal TuCheng Hospital, Chang Gung Memorial Hospital and Chang Gung University, Taoyuan, Taiwan
- 6Biostatistics Unit of Clinical Trial Center, Chang Gung Memorial Hospital, Taoyuan, Taiwan
Purpose: To elucidate the usefulness of intravoxel incoherent motion (IVIM)/apparent diffusion coefficient (ADC) parameters in preoperative risk stratification using International Society of Urological Pathology (ISUP) grades.
Materials and Methods: Forty-five prostate cancer (PCa) patients undergoing radical prostatectomy (RP) after prostate multiparametric magnetic resonance imaging (mpMRI) were included. The ISUP grades were categorized into low-risk (I-II) and high-risk (III-V) groups, and the concordance between the preoperative and postoperative grades was analyzed. The largest region of interest (ROI) of the dominant tumor on each IVIM/ADC image was delineated to obtain its histogram values (i.e., minimum, mean, and kurtosis) of diffusivity (D), pseudodiffusivity (D*), perfusion fraction (PF), and ADC. Multivariable logistic regression analysis of the IVIM/ADC parameters without and with preoperative ISUP grades were performed to identify predictors for the postoperative high-risk group.
Results: Thirty-two (71.1%) of 45 patients had concordant preoperative and postoperative ISUP grades. Dmean, D*kurtosis, PFkurtosis, ADCmin, and ADCmean were significantly associated with the postoperative ISUP risk group (all p < 0.05). Dmean and D*kurtosis (model I, both p < 0.05) could predict the postoperative ISUP high-risk group with an area under the curve (AUC) of 0.842 and a 95% confidence interval (CI) of 0.726–0.958. The addition of D*kurtosis to the preoperative ISUP grade (model II) may enhance prediction performance, with an AUC of 0.907 (95% CI 0.822–0.992).
Conclusions: The postoperative ISUP risk group could be predicted by Dmean and D*kurtosis from mpMRI, especially D*kurtosis. Obtaining the biexponential IVIM parameters is important for better risk stratification for PCa.
Introduction
The Gleason scores (GSs) obtained from prostate biopsies or transurethral resection of the prostate (TURP) before radical prostatectomy (RP) are used as treatment guidance for prostate cancers (PCas) by stratifying them into low-risk (GS 6), intermediate-risk (GS 7) and high-risk (GS 8-10) groups. For example, low-risk patients may undergo active surveillance or brachytherapy as monotherapy (1, 2). However, the concordance of the GS on prostate biopsy and the GS according to RP are limited, ranging from 31% to 60% (3–5), which implies possibly inappropriate treatment selection for some patients when relying on the GS obtained from prostate biopsies (4, 5). Recently, the International Society of Urological Pathology (ISUP) adopted a new grading system for PCas using GSs 6, 3 + 4, 4 + 3, 8, and 9-10 as grades I, II, III, IV, and V, respectively, to replace the old risk stratification groups (i.e., GS 6, 7, 8-10) (6). The intermediate-risk group (GS 7) in the old risk stratification system is divided into GS 3 + 4 (grade II) and 4 + 3 (grade III) in the new ISUP grade system because there is a significant difference in recurrence between patients in the two new grades (6). The hazard ratios of biochemical recurrence relative to ISUP grade I were 1.9, 5.1, 8.0, and 11.7 for ISUP grades II, III, IV, and V, respectively. Thus, the accurate prediction of the postoperative ISUP grade according to the RP specimen is important for risk stratification and treatment selection for PCas.
Diffusion weighted imaging (DWI) is currently considered a key component of prostate multiparametric magnetic resonance imaging (mpMRI) examinations (7, 8). There are statistically significant correlations between the apparent diffusion coefficients (ADCs) and the GSs of PCas (9–11). The ADC values representing water diffusion are usually calculated from DWI using monoexponential fitting (12), which, however, does not consider the influence of intravoxel incoherent motion (IVIM) (13, 14). Thus, Le Bihan et al. (15). proposed an IVIM model using biexponential fitting, which allows the extraction of IVIM parameters, including diffusivity (D), pseudodiffusivity (D*), and perfusion fraction (PF). Two studies have shown that both ADC and IVIM parameters are associated with low risk (GS 6) and intermediate/high risk (GS 7-10) via biopsy or RP (16, 17). Nonetheless, it remains unclear whether the ADC/IVIM parameters are associated with the postoperative ISUP grades and thus may be useful for their prediction. In addition, for patients with preoperative ISUP grades obtained via biopsy or TURP, do the addition of the ADC/IVIM parameters have incremental value for risk stratification? Thus, the purpose of the current study was to elucidate whether ADC and IVIM parameters alone or in combination with preoperative ISUP grades could predict the postoperative ISUP grade.
Materials and Methods
Patients
The institutional review board approved this retrospective study and provided a waiver for obtaining informed consent from the enrolled patients. From June 2016 to December 2017, 247 patients underwent prostate mpMRI, including DWI, IVIM, and dynamic contrast enhancement (DCE) pulse sequences. The patients who met all inclusion criteria and did not fit any of the exclusion criteria were enrolled for final analysis. The inclusion criteria were (1) a histological diagnosis of PCa by prostate biopsy or TURP, (2) no treatments for PCa before mpMRI, and (3) RP after mpMRI. At this stage, 195 patients were excluded due to violation of inclusion criteria, including ten without a histological diagnosis, 20 with records of treating PCa (such as prior RP, anti-hormone therapy, radiation therapy, etc.), and 165 without receiving RP. Of 52 patients who met all inclusion criteria, seven patients were excluded because of fitting the exclusion criteria. The exclusion criteria were (1) no PCa found in RP specimens (n = 1), (2) concurrent malignancy other than PCa in RP specimens (n = 1), (3) a time interval of more than 90 days between mpMRI and RP (n = 5) (16, 18), (4) poor diagnostic quality due to artifact of hip prostheses on mpMRI (n = 0), and (5) no detectable PCa on mpMRI (n = 0). Forty-five patients were eligible for this study and were used to construct the database (Figure 1).
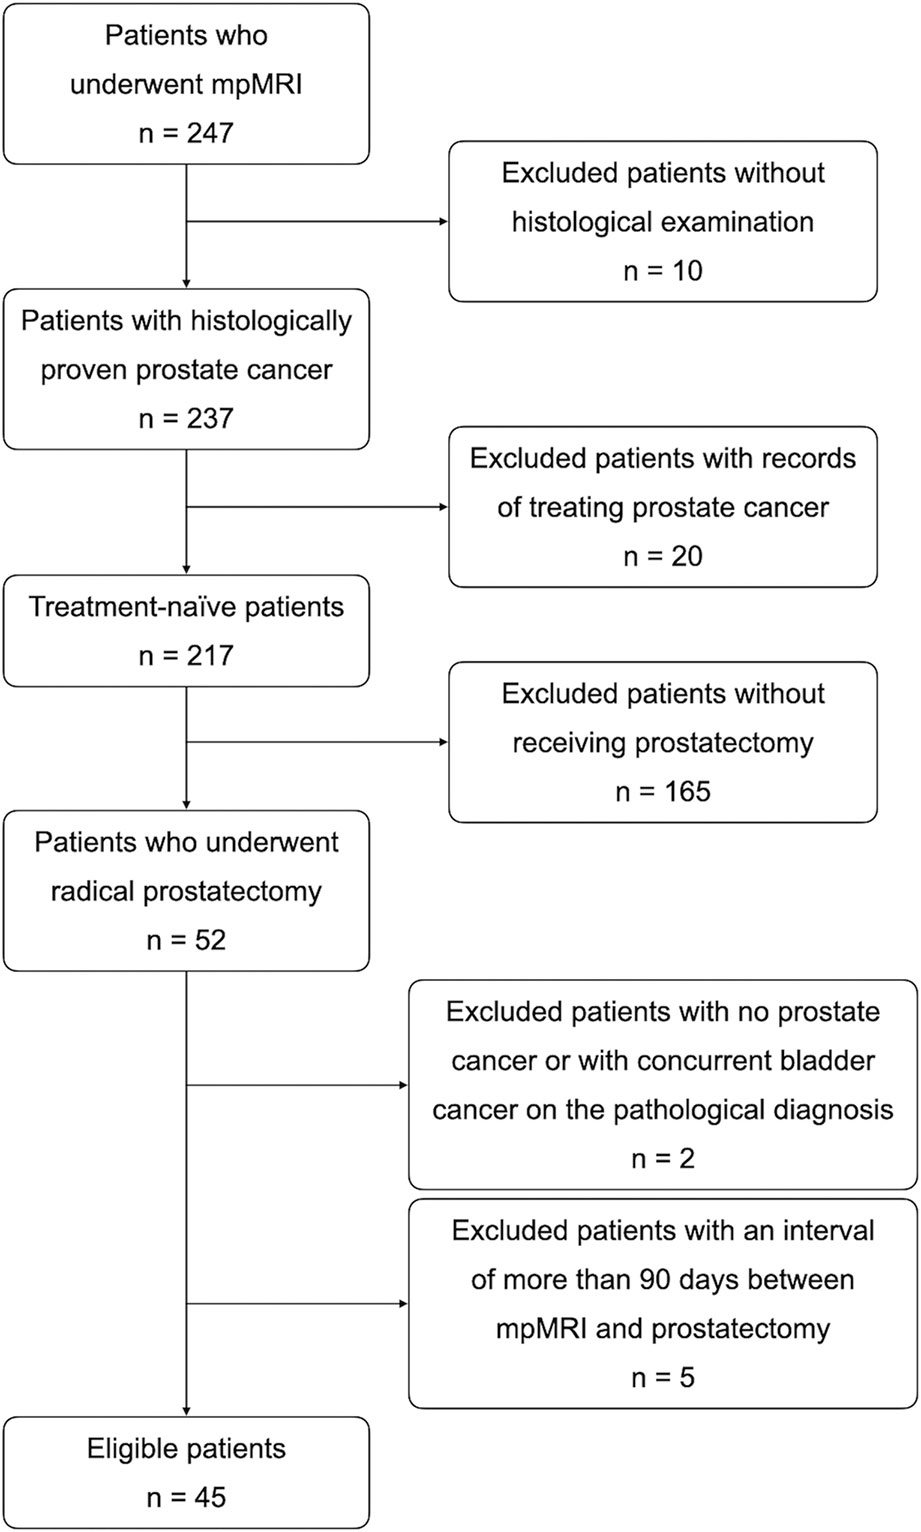
Figure 1 Flow diagram of the enrollment of the 45 patients selected by applying inclusion and exclusion criteria.
MRI Technique and IVIM/ADC Parameters on MRI
All MRI acquisitions were performed on a 3T clinical scanner (Discovery MR750, GE Healthcare, Milwaukee, USA). The mpMRI pulse sequences included conventional T2-weighted imaging (T2WI) in the sagittal, coronal and axial planes and T1-weighted imaging (T1WI) in the axial plane as well as functional imaging such as DWI, IVIM and DCE. T2WI was performed using a fast spin echo (FSE) sequence with repetition time (TR) = 5800-6100 ms; echo time (TE) = 92 - 103 ms; slice thickness = 4 mm; matrix = 384 × 320; and field of view (FOV) = 180 × 180 - 240 × 240 mm2. T1WI was performed using an FSE sequence with TR = 660 ms; TE = 15 ms; slice thickness = 4 mm; matrix = 256 × 224; and FOV = 180 × 180 mm2. IVIM imaging was performed using 8 b values (i.e., 0, 10, 30, 50, 80, 100, 400, 1000 s/mm2) with a reduced FOV (rFOV) = 20 × 10 cm2; matrix = 80 × 40; and TE = 53.4 ms. After IVIM DWI, DCE using a three-dimensional (3D) T1-weighted spoiled gradient-echo sequence in the axial plane (TR = 2.6 ms; TE = 1.1 ms; flip angle = 13°; number of excitations (NEX) = 1; matrix = 140 × 140; FOV = 280 × 280 mm2; and slice thickness = 4 mm) was acquired using a standard dose (0.1 mmol/kg body weight) of gadopentetate dimeglumine (Gd-DTPA; Magnevist; Bayer-Schering, Burgess Hill, UK) administered at a rate of 3 mL/s with a temporal resolution of 5.4 seconds and a total acquisition time of 324 seconds (60 phases). A uroradiologist with over 20 years of experience reviewed the ADC and IVIM images using homemade software written in MATLAB (R2015b; MathWorks, Inc., Natick, MA, USA) and delineated the largest region of interest (ROI) of the dominant tumor nodule on each image (Figures 2–4). Histogram values (i.e., minimum, mean, and kurtosis) of the IVIM parameters (D, D*, and PF) were then calculated and obtained using a biexponential model (15). Histogram values (i.e., minimum, mean, and kurtosis) of the ADCs generated from DWI using a standard monoexponential model (19) were recorded.
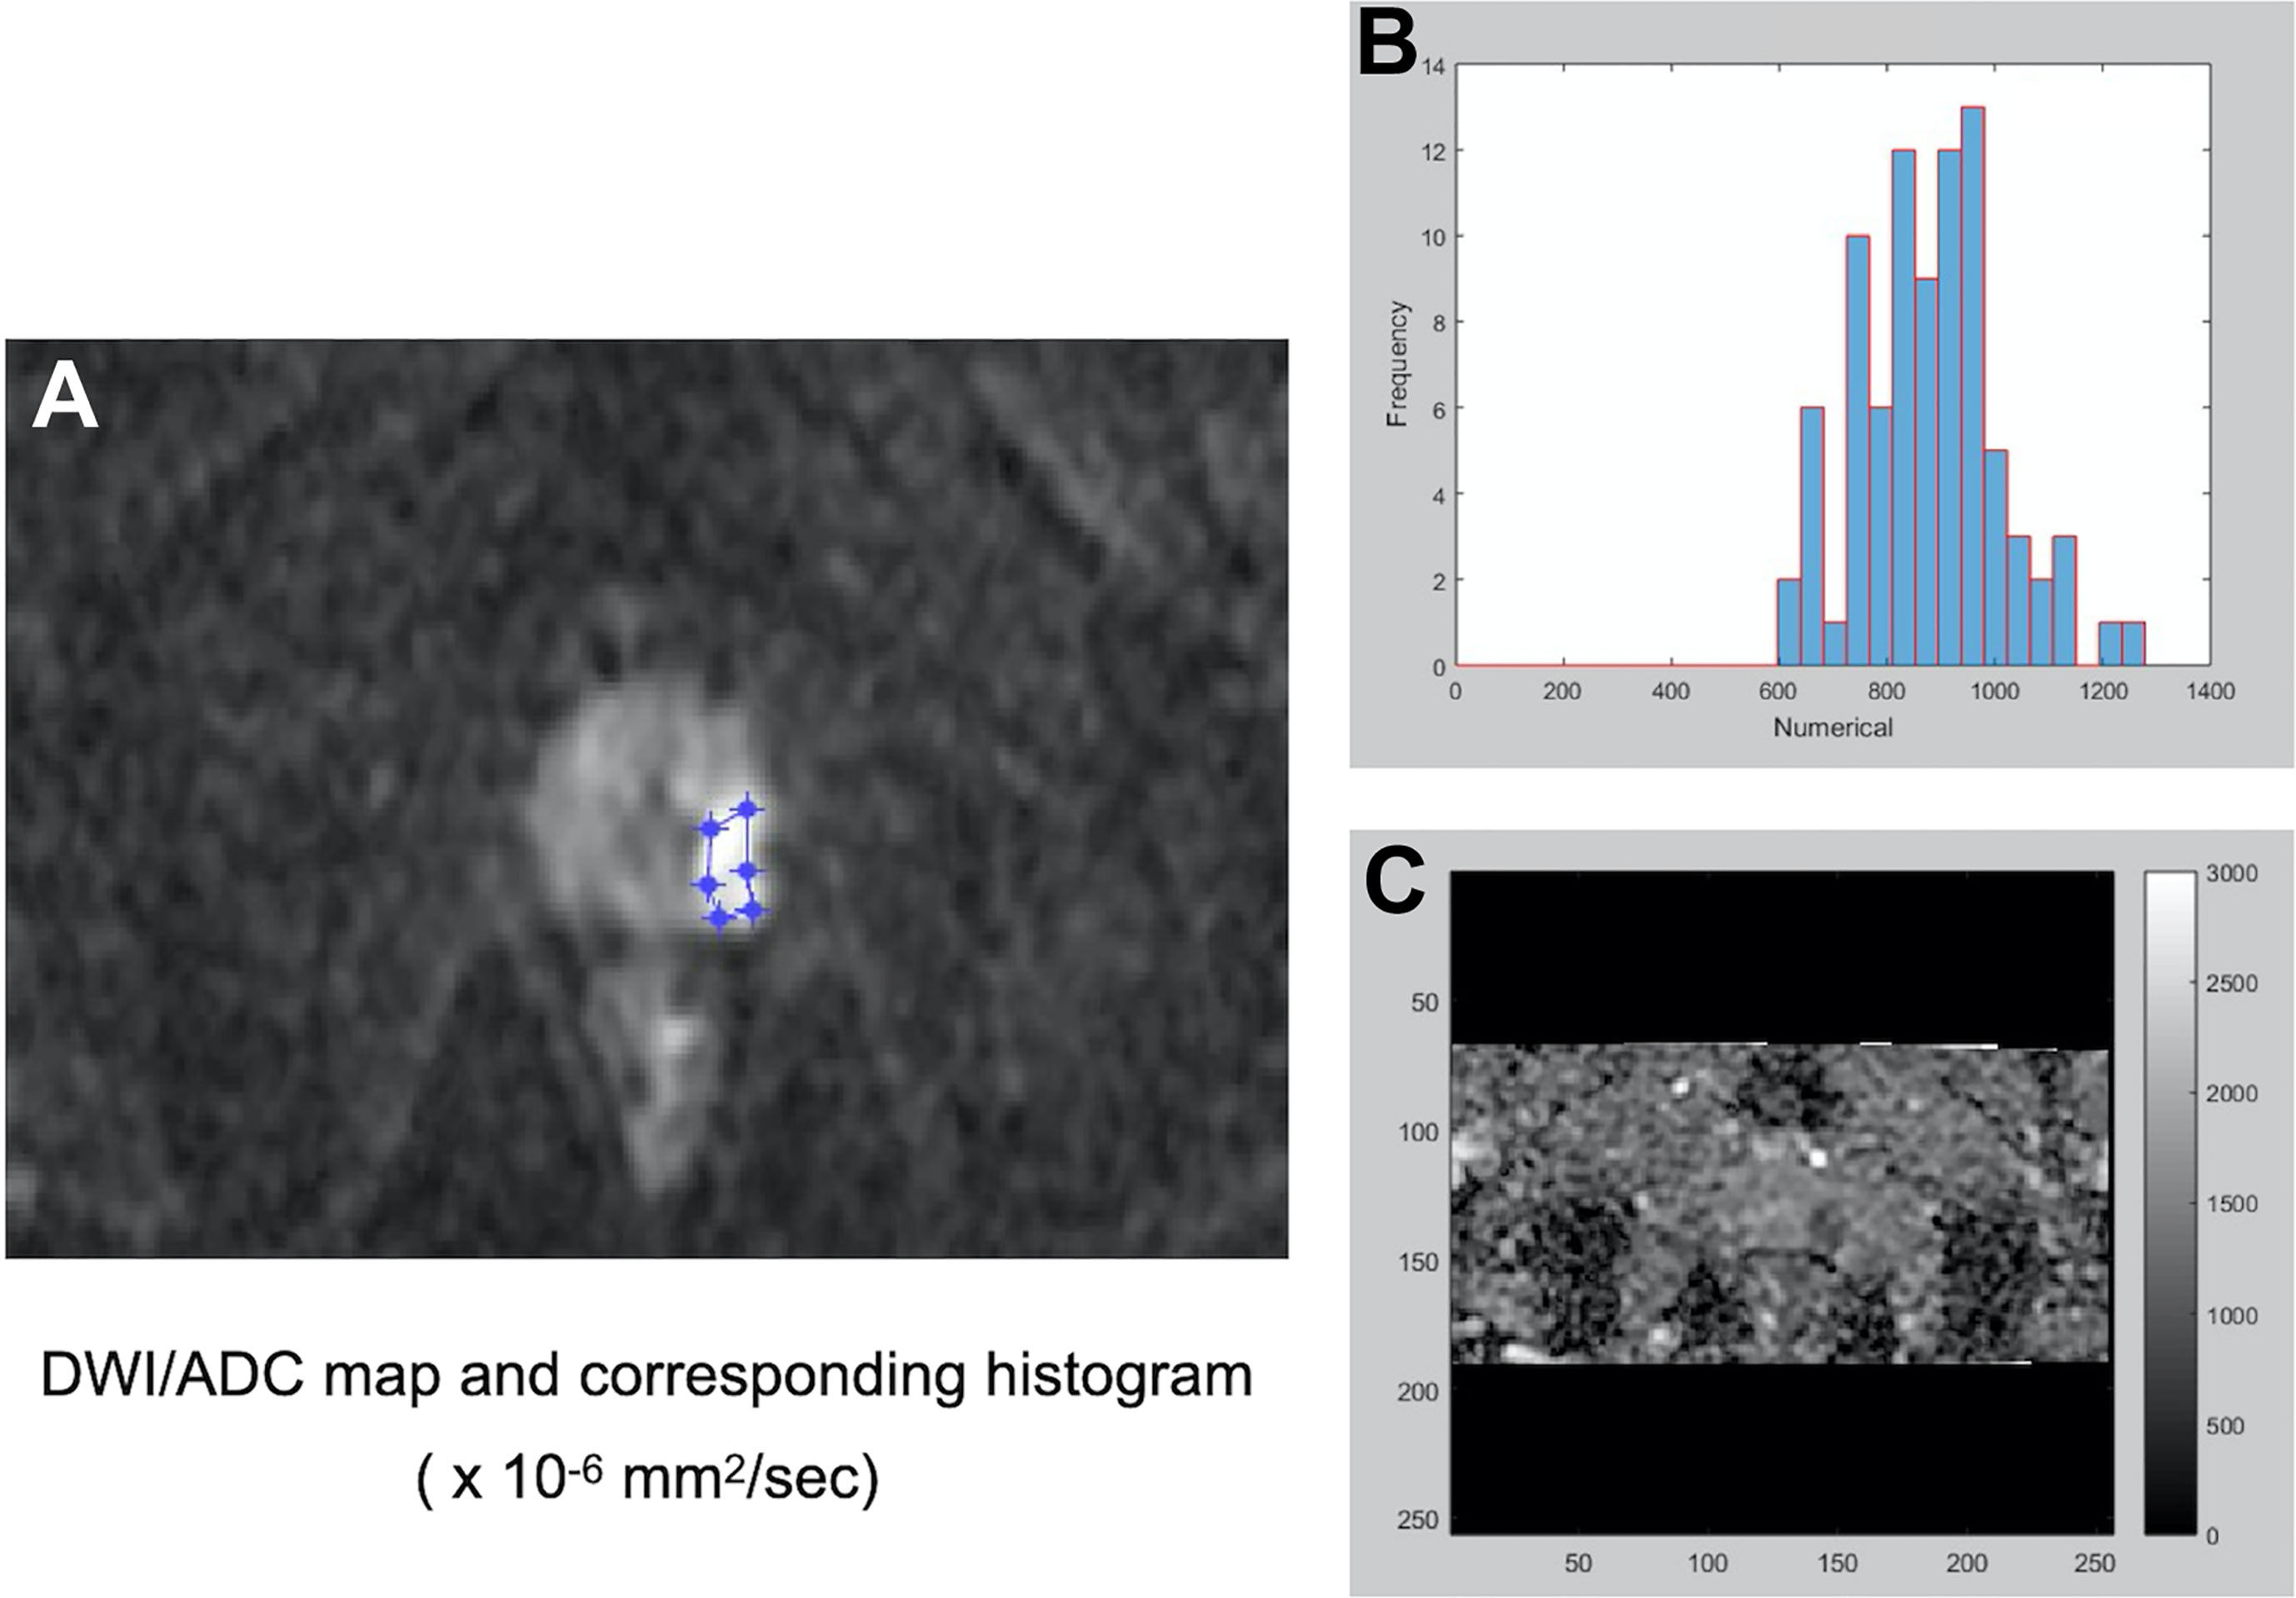
Figure 2 A representative PCa with a preoperative Gleason score of 3 + 3 for the histogram analysis of DW imaging measures. After identifying the dominant tumor nodule in the prostate gland, a region of interest (ROI) was delineated manually on a conventional DWI image (b = 1500 s/mm2) (A) to obtain an ADC map and the corresponding histogram (B) of the ADC map (C).
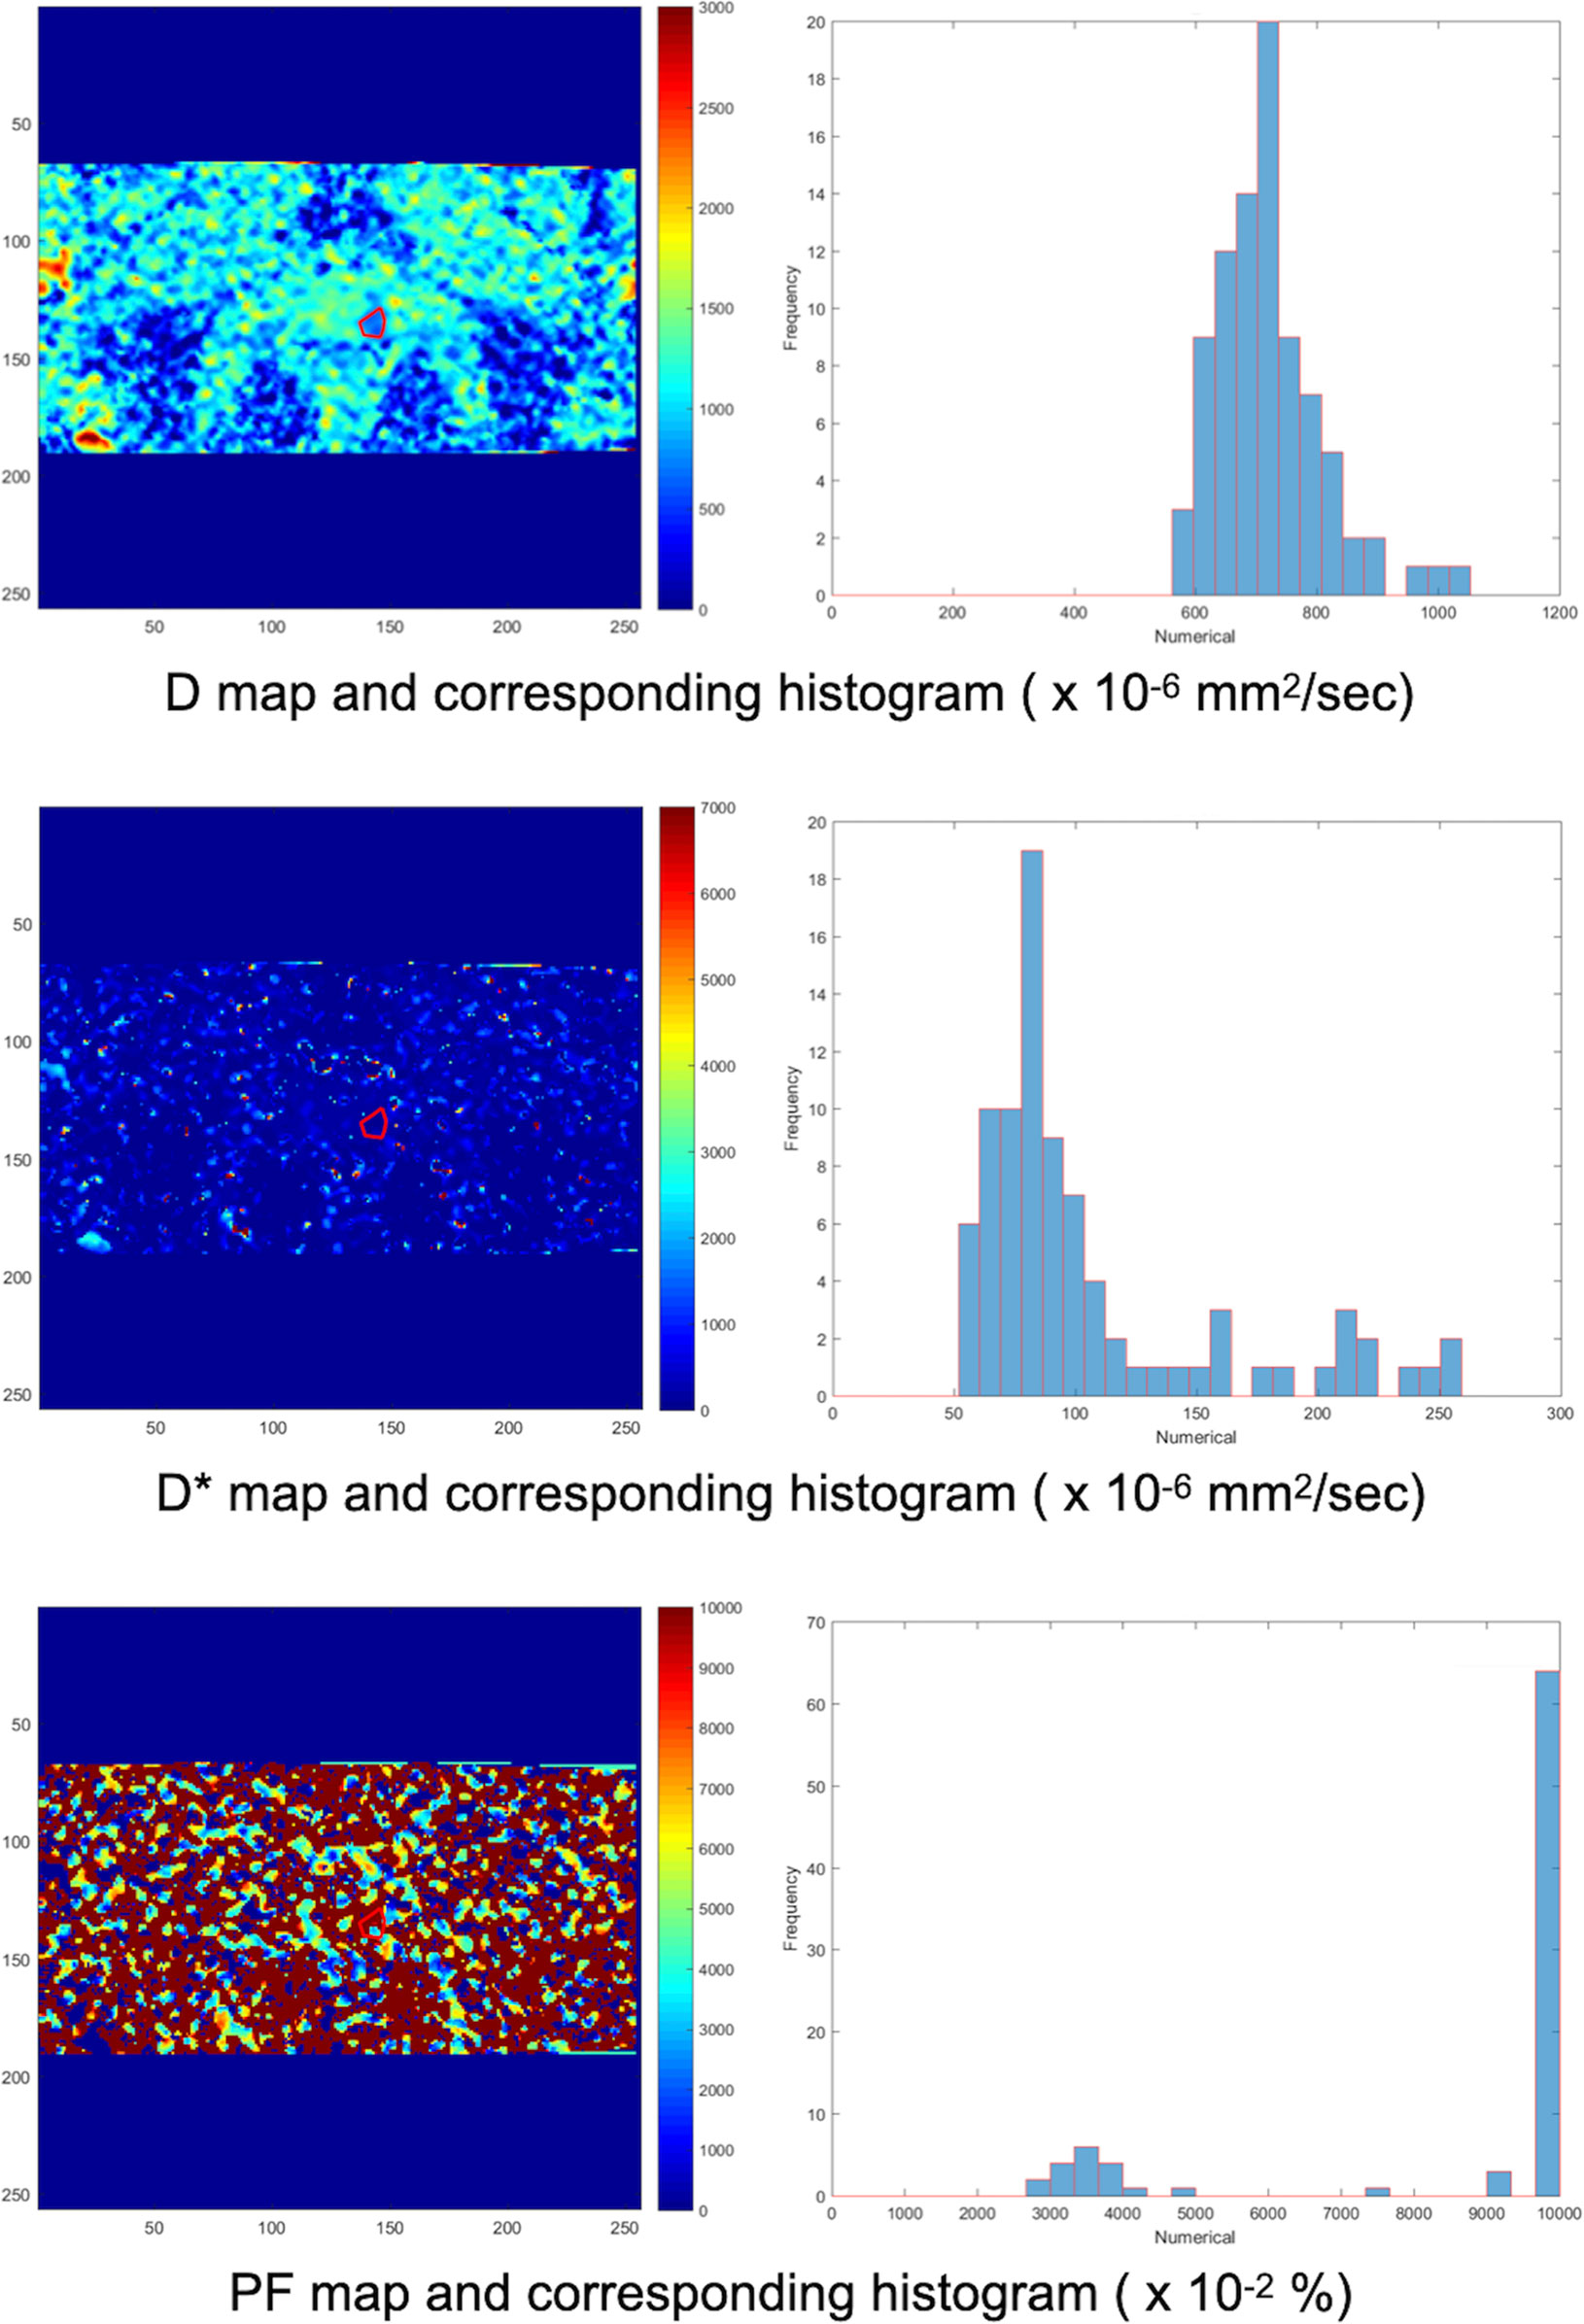
Figure 3 Another ROI was delineated manually on the IVIM D map. The ROI on the D map was automatically copied to the D* and PF maps by our homemade software. Then, the corresponding histograms of the D, D*, and PF maps were obtained. The process was repeated for each DWI image and IVIM map containing the dominant tumor nodule.
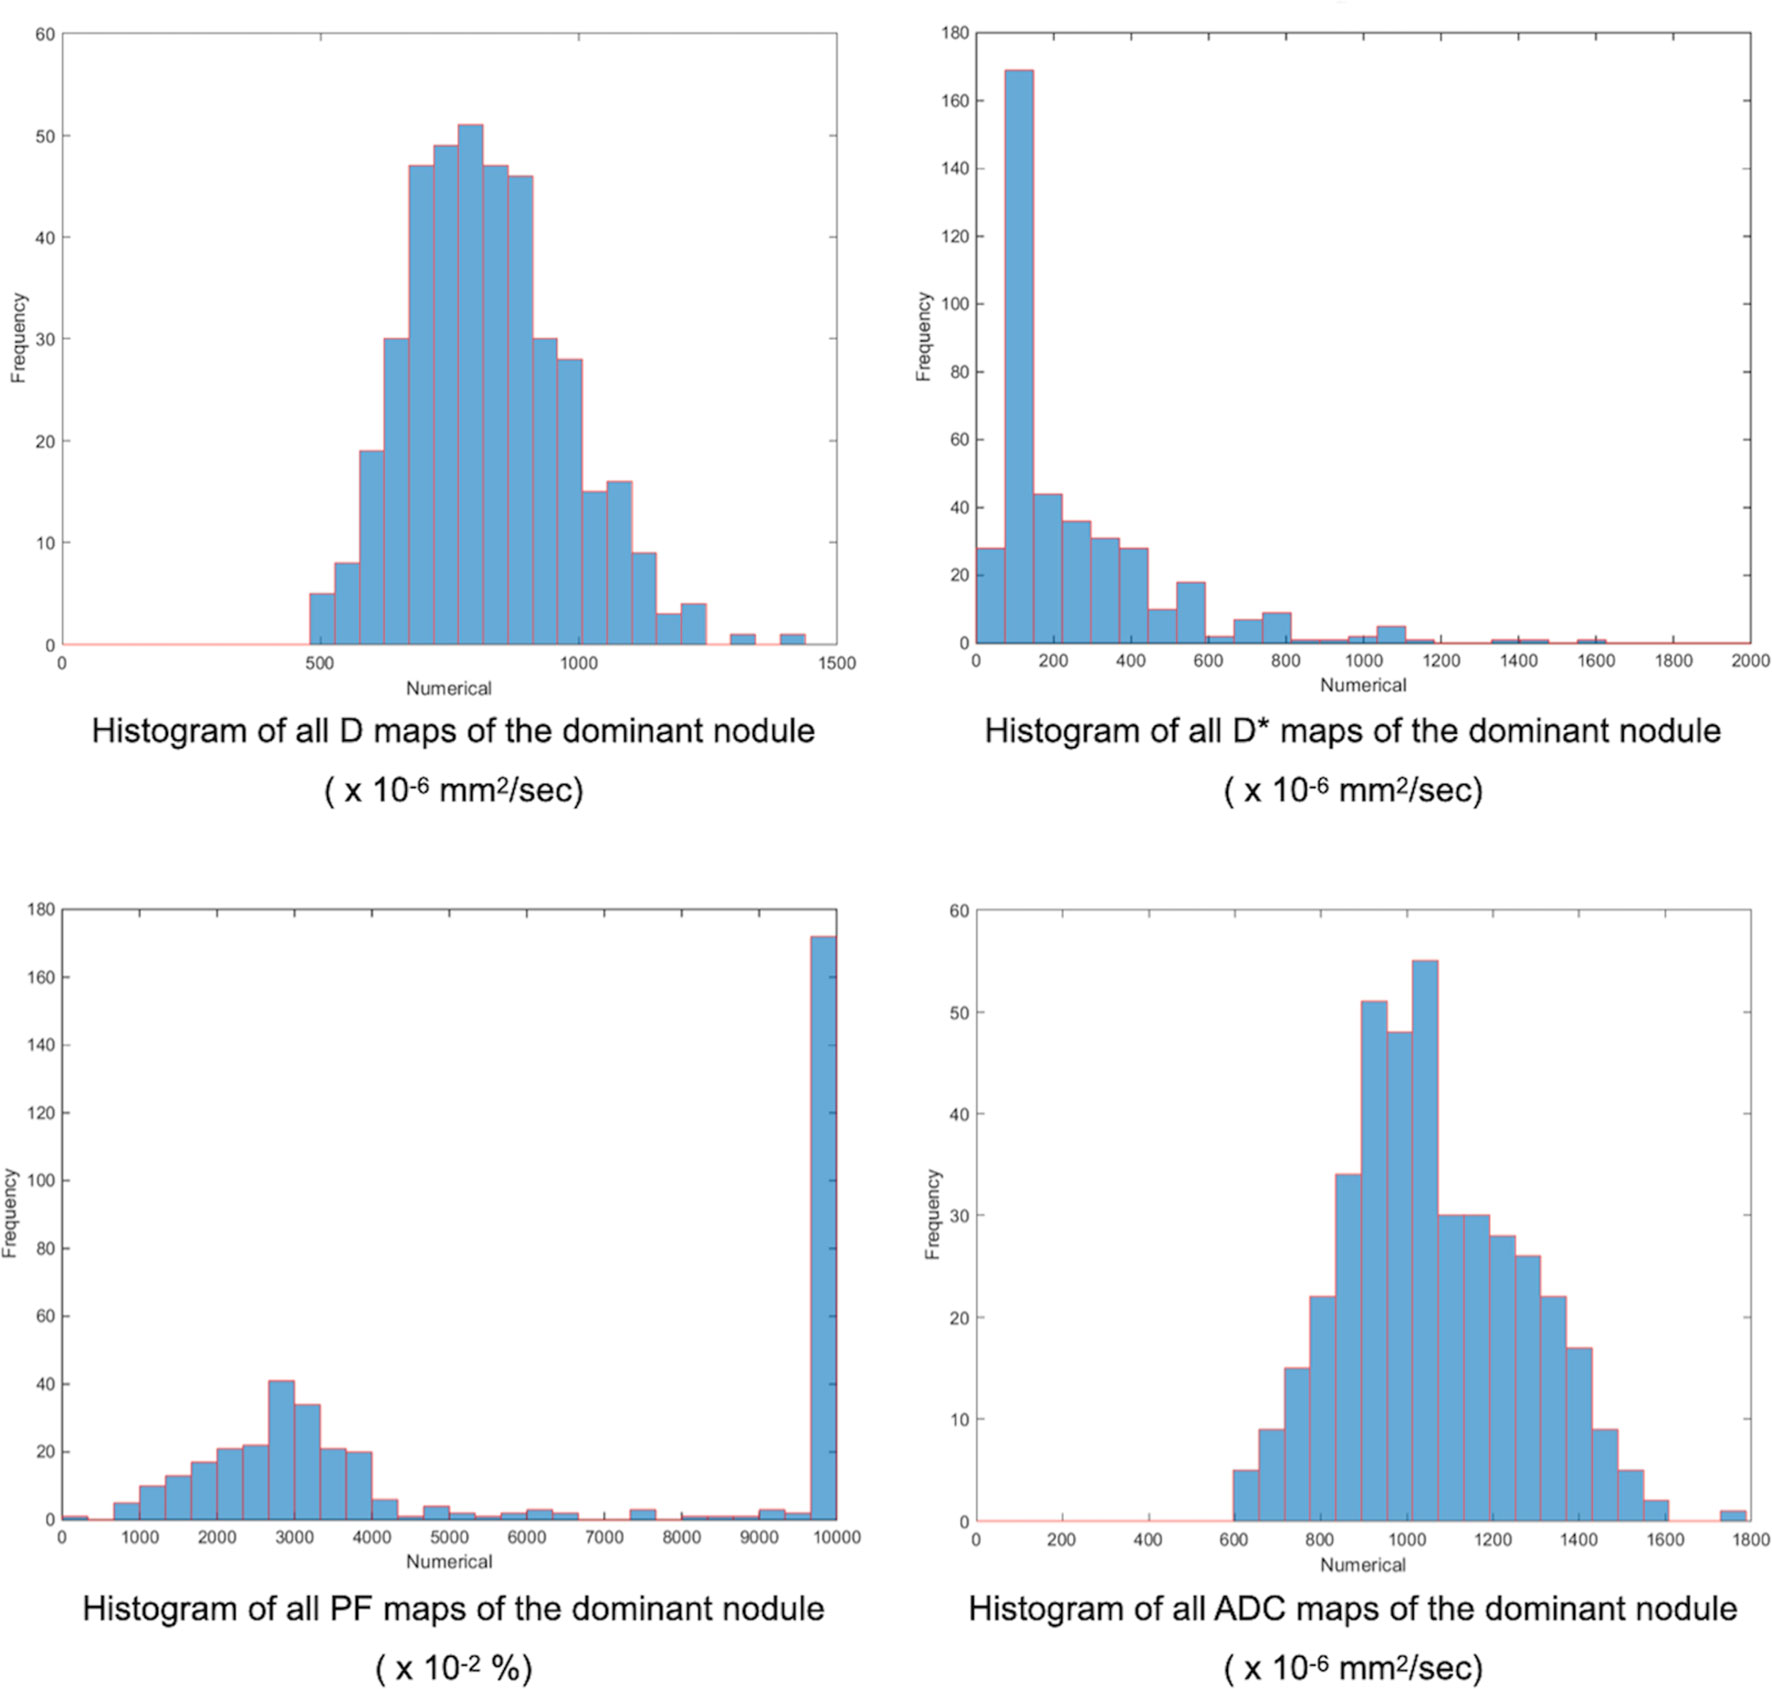
Figure 4 Finally, our homemade software constructed the whole dominant nodule histograms for D, D*, PF, and ADC by combining the different histograms from each image. The minimum, mean, and kurtosis of the IVIM/ADC parameters were extracted from the whole dominant nodule histogram and used for further analysis.
Clinical Variables and Risk Groups Based on Preoperative and Postoperative Gleason Grading
For each patient, we recorded his age and prostate-specific antigen (PSA) titer at diagnosis. The preoperative ISUP grades of PCas (6, 20) were recorded using the histological results from transrectal ultrasound (TRUS) biopsy or TURP specimens and categorized into low-risk (grade I-II) and high-risk (grade III-V) groups. The percentage of positive TRUS biopsy specimen cores was recorded. The final pathological results based on RP specimens were then used for recording postoperative ISUP grades and similarly categorized into the two risk groups. The preoperative and postoperative ISUP grades and their corresponding risk groups of all patients were compared and recorded as same, upgraded or downgraded.
Statistical Analysis
Descriptive statistics for continuous variables are expressed as the median and interquartile range (IQR) because of the small sample size and skewed distributions. Categorical variables are expressed as counts and proportions. The kappa statistic was calculated to analyze the agreement between the preoperative and postoperative ISUP grades. The associations of clinical characteristics and the IVIM/ADC parameters with the final risk groups (high/low) based on the postoperative ISUP grades were analyzed using the Mann-Whitney U test for continuous variables. Furthermore, multivariable logistic regression with forward selection procedure was performed to identify the predictors of a high-risk stratification for the RP specimens. First, all clinical characteristics (including age, PSA at diagnosis, positive biopsy specimen cores) and all IVIM/ADC parameters were initially entered in a logistic regression to identify the significant predictors of the postoperative ISUP risk group based on forward selection (Model I). Afterward, we added a factor of risk groups based on the preoperative ISUP grade combining with the model of forward procedure to investigate its adding effect (Model II). The ROC curves were plotted to show the predictive performance of the models. A similar multivariable logistic regression with forward selection procedure was also performed to identify the key predictors of postoperative ISUP grade or risk group upgrading. All statistical analyses were performed using SPSS Statistics version 25 (IBM, Armonk, New York). A two-tailed p-value of less than 0.05 was considered statistically significant.
Results
The descriptive statistics of the clinical characteristics and the IVIM/ADC parameters of the 45 patients are summarized in Table 1. Before RP, the median PSA titer at diagnosis was 14.2 ng/mL, and 10 patients (22.2%) had PSA titer less than 9 ng/mL at diagnosis, ranging from 2.0 ng/mL to 8.3 ng/mL. Of these 10 patients, two patients (4.0%) had a PSA titer less than 4 ng/mL at diagnosis: 2.0 ng/mL and 3.2 ng/mL. Of the 45 patients, 41 (91.1%) underwent TRUS biopsy, and 4 (8.9%) underwent TURP to obtain the GS. Among ADC, D, and D*, D* had the lowest mean, and ADC had the highest. In contrast, D* had the highest kurtosis, and ADC had the lowest.
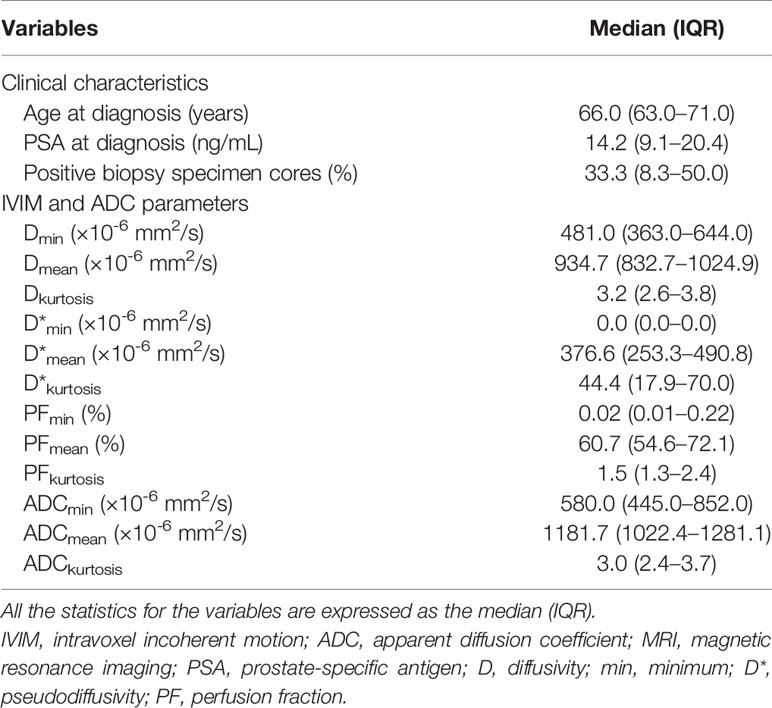
Table 1 Clinical characteristics and IVIM/ADC parameters obtained on MRI of 45 prostate cancer patients before radical prostatectomy.
Table 2 shows the distributions of the preoperative and postoperative ISUP grades of the 45 patients. For the preoperative TRUS biopsies and TURP specimens, ISUP grades I and III were the most common. However, grade III was the most common for the postoperative RP specimens. Fifteen of 45 (33.3%) patients had the same preoperative and postoperative ISUP grades. Thirty-two (71.1%) patients were categorized into the same preoperative and postoperative ISUP risk groups (16 low-risk and 16 high-risk). Overall, 7 (15.6%) patients upgraded from low risk to high risk (i.e., grade I to III for 2, and II to III for 5) and 6 (13.3%) patients downgraded from high risk to low risk (i.e., grade III to I for 1 and III to II for 5) postoperatively. There was moderate agreement between the preoperative and postoperative ISUP risk groups (kappa = 0.423, p=0.005). There were significant associations of preoperative and postoperative ISUP risk group, as 16 of 22 (72.7%) postoperative ISUP low-risk patients and 7 of 23 (30.4%) postoperative ISUP high-risk patients were regarded to have preoperative ISUP low-risk grades (p=0.005).
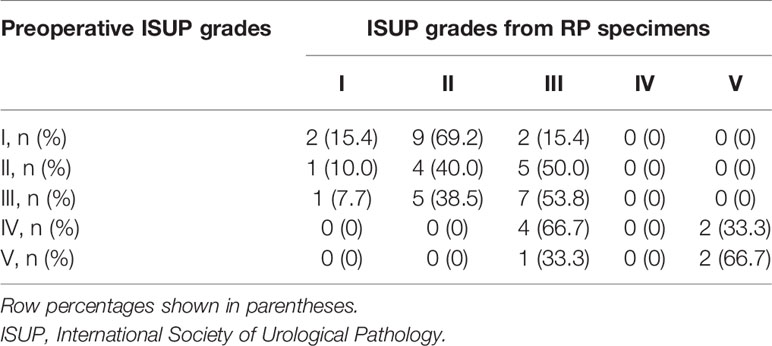
Table 2 ISUP grades of prostate cancers obtained before radical prostatectomy (RP) and using histological results of the RP specimens of the 45 patients.
The clinical characteristics (i.e., age and PSA at diagnosis and percentage of positive cores from TRUS biopsy) had no associations with both the postoperative ISUP high-risk group and postoperative ISUP risk group upgrading (Table 3; Table S1 and S2). However, multiple IVIM and ADC parameters, including Dmean, D*kurtosis, PFkurtosis, ADCmin, and ADCmean, were significantly associated with postoperative ISUP risk group (all p < 0.05, Table 3). Besides, Dmean, PFkurtosis, and ADCmean, were associated with postoperative ISUP risk group upgrading (all p ≤ 0.05, Table S2). Further multivariable logistic regression analysis showed that Dmean and D*kurtosis were significant predictors for the postoperative ISUP high-risk group (both p < 0.05, model I, Table 4). Dmean was the only significant predictor for the postoperative ISUP risk group upgrading, with a negative relationship (p < 0.0001, Table S3). Significant predictors for the postoperative ISUP grade upgrading were not identified. By using the preoperative ISUP grade as an adjustment variable, the additive effect of D*kurtosis and Dmean could improve the performance of the prediction models (p < 0.05, model II, Table 4). Figure 5 shows that the areas under the ROC curves for model I and model II were 0.842 (95% CI 0.726–0.958) and 0.907 (95% CI 0.822–0.992), respectively.
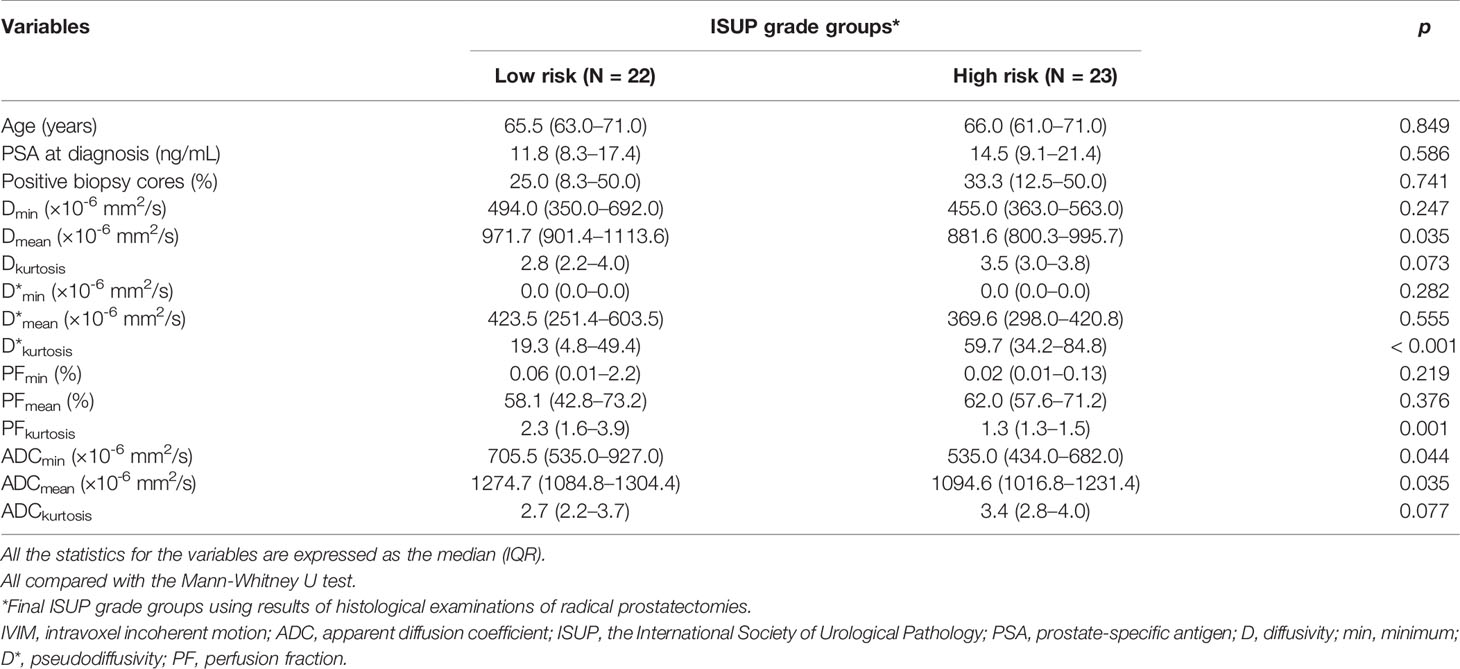
Table 3 Associations of clinical characteristics and IVIM/ADC parameters obtained before radical prostatectomy with final risk groups of 45 prostate cancer patients.
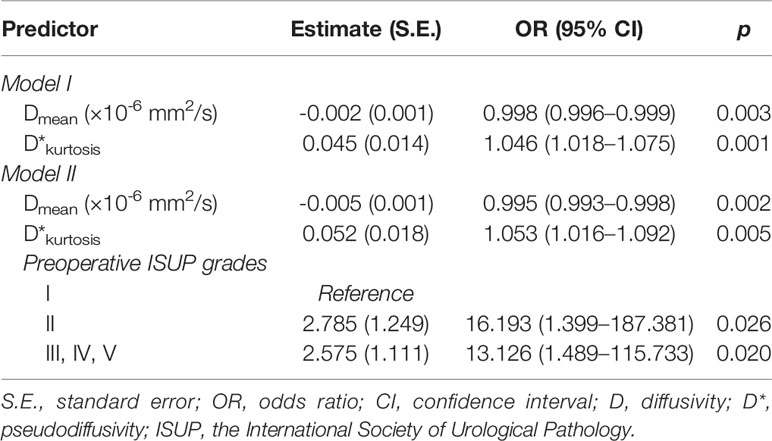
Table 4 Multivariable analysis of significant predictors of high-risk group according to radical prostatectomy specimens using logistic regression analysis.
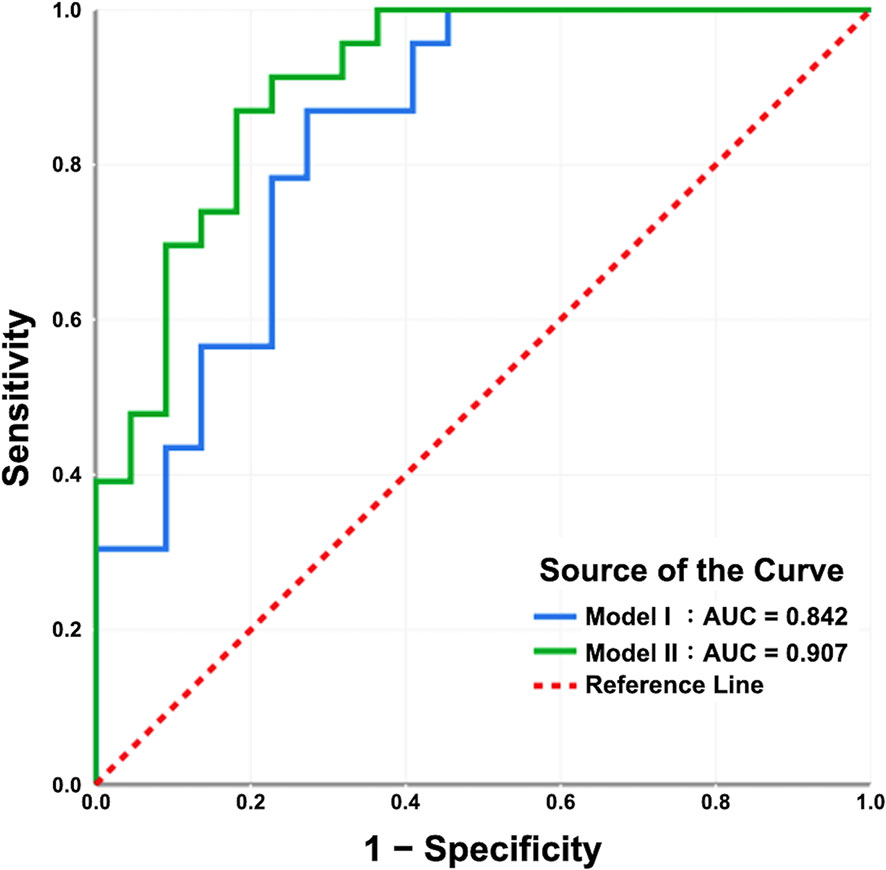
Figure 5 The receiver operating characteristic curves of the prediction models. The areas under the curves of model I and model II are 0.842 and 0.907, respectively. In model I, the IVIM/ADC parameters Dmean and D*kurtosis were significant predictors for the ISUP high-risk group according to radical prostatectomy (RP) specimens. In model II, the use of the preoperative ISUP grade as an adjustment variable, in addition to Dmean and D*kurtosis, may enhance the predictive performance of the model.
Discussion
This study shows that there is only moderate agreement in the preoperative and postoperative ISUP risk groups, with a final concordance of 71.1%. Two major factors may account for this limited concordance: (1) bias in the pathological evaluation and (2) sampling error from an underrepresented area (21). Previous studies have also reported similar but lower concordances for GS risk groups ranging from 31% to 60% (3–5). Although the higher concordance achieved in this study could be explained by the use of more biopsy cores (12, 13) than in previous studies (10 or fewer), 29% of patients who upgraded or downgraded postoperatively remained misclassified in the risk stratification and could have been potentially misled in the treatment selection if it had been based on the preoperative ISUP risk group alone.
There were significant associations of the postoperative ISUP risk groups with ADCmin, ADCmean, Dmean, PFkurtosis and D*kurtosis (all p < 0.05) but not with the clinical characteristics in this study. Previous studies have also reported that ADCmean and Dmean are associated with the GS risk group but not with clinical characteristics (16–18, 22–24). Since there is an inverse correlation between ADCmean and GS 6-10 obtained from biopsies (19), the significant differences in ADCmean using the monoexponential model and Dmean using the biexponential model between GS risk groups are reasonable and could be expected. However, the new ISUP grades differ from GS, as GS 7 is now categorized into two grades, ISUP grade II for GS 3 + 4 and ISUP grade III for GS 4 + 3, because of their substantial differences in recurrence. Shan et al. (18). showed that ADCmean, PFmean, and Dmean could differentiate GS 3 + 4 from GS > 3 + 4 according to RP with AUCs of 0.744, 0.726 and 0.732, respectively (all p < 0.05), which is similar to our results except for PFmean. In IVIM models, PF represents the proportion of water flowing in capillaries of the total water in a voxel, and D* represents water movement in the randomly oriented capillary network mimicking diffusion (15). This study showed that the postoperative ISUP high-risk group had significantly higher D*kurtosis and lower PFkurtosis than the low-risk group, which means that there are more outliers of the D* distribution and fewer outliers of the PF distribution (25). Thus, the postoperative ISUP high-risk grades tend to have markedly more heterogeneous water movement in the capillary network in voxels and a relatively more restricted range of PF than the low-risk group. The associations of these ADC and IVIM parameters with the postoperative ISUP risk group implies their potential usefulness in preoperative risk stratification and prediction for the postoperative ISUP grades, which have replaced the old GS system worldwide.
From a practical point of view, it is necessary to address whether the ADC/IVIM parameters could predict the final postoperative ISUP risk groups, and multivariate analysis with controlling variables showed that Dmean and D*kurtosis, rather than PFkurtosis and ADCmean, were significant predictors for the postoperative ISUP risk group in this study. This means that lower Dmean and higher D*kurtosis values predict the postoperative ISUP high-risk group with an expected high accuracy (0.842), as shown by the AUC, which is higher than the concordance (0.71) of the preoperative and postoperative ISUP risk group. The limited concordance between the preoperative and postoperative ISUP grades or GSs might result in the inappropriate selection of treatment. Thus, are the ADC and IVIM parameters helpful in filling this gap? This study shows that the addition of D*kurtosis into the model using the preoperative ISUP grades has incremental value, achieving a high AUC of 0.907, which accounts for a 67.8% decrease in upgrading/downgrading the postoperative ISUP risk group with respect to the preoperative ISUP risk group. Thus, it is worth obtaining IVIM parameters using a biexponential model because unlike the ADC parameters, they are significant predictors of postoperative ISUP grade, both without and with biopsy/TURP information.
Le Bihan et al. (15). proposed the IVIM model by assuming a 2-compartment scenario and characterized the diffusion signals with a biexponential decay function. Since IVIM is an expanded form of DWI, it can be used for PCa detection in peripheral and transition zones of the prostate, just like monoexponential-fitted ADC. Previous studies had shown that the IVIM parameters were not superior to ADC in evaluating PCa in the transition zone (22) but might increase the diagnostic performance in detecting PCa in the peripheral zone (24). For tumor detection in the whole prostate, IVIM parameters and ADC might have comparable diagnostic performance (18). Overall, the biexponential-fitted IVIM did not add more information in tumor detection than traditional ADC. However, the IVIM parameters, as shown in the present study, would be beneficial to predict GS, aggressiveness, and postoperative ISUP risk group of PCa. The IVIM diffusion might, therefore, potentially influence the treatment selection of PCa.
There are limitations in the present work. First, this is a retrospective study of PCa patients undergoing RP with possible selection bias resulting from the recruitment of operable patients undergoing active surveillance, radiation therapy or hormone therapy by using the GS from biopsies/TURP as a reference for treatment selection. Another limitation is the small number of patients included in the present study due to the strict inclusion and exclusion criteria used, which, however, were implemented to ensure comparability between mpMRI and the RP specimens (e.g., patients with a delay of more than 90 days between mpMRI and RP were excluded). Future studies with prospective designs and large patient cohorts should be performed to confirm our results.
In conclusion, predicting the postoperative ISUP risk group with the use of histological information from biopsies/TURP could be unsatisfactory and sometimes misleading. It might be feasible and helpful to use the IVIM parameters Dmean and D*kurtosis from mpMRI alone to predict the postoperative ISUP risk group. The addition of D*kurtosis to the preoperative ISUP grades has incremental value in the prediction of postoperative ISUP grades. Therefore, it is important to obtain IVIM parameters using a biexponential model for better risk stratification for PCa before surgery or other treatments.
Data Availability Statement
The raw data supporting the conclusions of this article will be made available by the authors, without undue reservation.
Ethics Statement
The studies involving human participants were reviewed and approved by the Institutional Review Board of Chang Gung Medical Foundation (IRB number, 202000712B0). The IRB approved a waiver for obtaining informed consent from patients/participants in this study.
Author Contributions
Study concept and design: L-JW and L-YY. Acquisition, analysis, or interpretation of data: all authors. Drafting of the manuscript: C-BC, Y-HL, and Y-CL. Critical revision of manuscript: L-JW and L-YY. Statistical analysis: L-JW, L-YY, C-BC, and Y-CW. Administrative, technical, and material support: Y-HL, Y-CL, Y-CW, S-NL, C-YL, T-WS, and C-CH. Study supervision: L-JW and L-YY. All authors contributed to the article and approved the submitted version.
Conflict of Interest
Author C-YL was employed by General Electric (GE) Healthcare.
The remaining authors declare that the research was conducted in the absence of any commercial or financial relationships that could be construed as a potential conflict of interest.
Acknowledgments
The authors acknowledge the statistical assistance provided by the Clinical Trial Center, Chang Gung Memorial Hospital, Linkou, Taiwan, which was founded by the Ministry of Health and Welfare of Taiwan; MOHW109-TDU-B-212-114005.
Supplementary Material
The Supplementary Material for this article can be found online at: https://www.frontiersin.org/articles/10.3389/fonc.2021.659014/full#supplementary-material
Abbreviations
GS, Gleason score; TURP, transurethral resection of the prostate; RP, radical prostatectomy; PCa, prostate cancer; ISUP, International Society of Urological Pathology; DWI, Diffusion weighted imaging; mpMRI, multiparametric magnetic resonance imaging; ADC, apparent diffusion coefficient; IVIM, intravoxel incoherent motion; D, diffusivity; D*, pseudodiffusivity; PF, perfusion fraction; DCE, dynamic contrast enhancement; FOV, field of view; PSA, prostate-specific antigen; TRUS, transrectal ultrasound.
References
1. Klotz L. Active Surveillance for Favorable-Risk Prostate Cancer: Who, How and Why? Nat Clin Pract Oncol (2007) 4:692. doi: 10.1038/ncponc0966
2. Salembier C, Lavagnini P, Nickers P, Mangili P, Rijnders A, Polo A, et al. Tumour and Target Volumes in Permanent Prostate Brachytherapy: A Supplement to the ESTRO/EAU/EORTC Recommendations on Prostate Brachytherapy. Radiother Oncol (2007) 83:3. doi: 10.1016/j.radonc.2007.01.014
3. Hsieh TF, Chang CH, Chen WC, Chou CL, Chen CC, Wu HC. Correlation of Gleason Scores Between Needle-Core Biopsy and Radical Prostatectomy Specimens in Patients With Prostate Cancer. J Chin Med Assoc (2005) 68:167. doi: 10.1016/S1726-4901(09)70243-6
4. Suer E, Gokce MI, Gulpinar O, Guclu AG, Haciyev P, Gogus C, et al. How Significant is Upgrade in Gleason Score Between Prostate Biopsy and Radical Prostatectomy Pathology While Discussing Less Invasive Treatment Options? Scand J Urol (2014) 48:177. doi: 10.3109/21681805.2013.829519
5. Colleselli D, Pelzer AE, Steiner E, Ongarello S, Schaefer G, Bartsch G, et al. Upgrading of Gleason Score 6 Prostate Cancers on Biopsy After Prostatectomy in the Low and Intermediate tPSA Range. Prostate Cancer Prostatic Dis (2010) 13:182. doi: 10.1038/pcan.2009.54
6. Epstein JI, Zelefsky MJ, Sjoberg DD, Nelson JB, Egevad L, Magi-Galluzzi C, et al. A Contemporary Prostate Cancer Grading System: A Validated Alternative to the Gleason Score. Eur Urol (2016) 69:428. doi: 10.1016/j.eururo.2015.06.046
7. Tamada T, Sone T, Jo Y, Toshimitsu S, Yamashita T, Yamamoto A, et al. Apparent Diffusion Coefficient Values in Peripheral and Transition Zones of the Prostate: Comparison Between Normal and Malignant Prostatic Tissues and Correlation With Histologic Grade. J Magn Reson Imaging (2008) 28:720. doi: 10.1002/jmri.21503
8. Hambrock T, Somford DM, Huisman HJ, van Oort IM, Witjes JA, Hulsbergen-van de Kaa CA, et al. Relationship Between Apparent Diffusion Coefficients at 3.0-T MR Imaging and Gleason Grade in Peripheral Zone Prostate Cancer. Radiology (2011) 259:453. doi: 10.1148/radiol.11091409
9. Turkbey B, Shah VP, Pang Y, Bernardo M, Xu S, Kruecker J, et al. Is Apparent Diffusion Coefficient Associated With Clinical Risk Scores for Prostate Cancers That are Visible on 3-T MR Images? Radiology (2011) 258:488. doi: 10.1148/radiol.10100667
10. Barbieri S, Bronnimann M, Boxler S, Vermathen P, Thoeny HC. Differentiation of Prostate Cancer Lesions With High and With Low Gleason Score by Diffusion-Weighted MRI. Eur Radiol (2017) 27:1547. doi: 10.1007/s00330-016-4449-5
11. Peng Y, Jiang Y, Yang C, Kruecker J, Kadoury S, Merino MJ, et al. Quantitative Analysis of Multiparametric Prostate MR Images: Differentiation Between Prostate Cancer and Normal Tissue and Correlation With Gleason Score–a Computer-Aided Diagnosis Development Study. Radiology (2013) 267:787. doi: 10.1148/radiol.13121454
12. Gibbs P, Liney GP, Pickles MD, Zelhof B, Rodrigues G, Turnbull LW, et al. Correlation of ADC and T2 Measurements With Cell Density in Prostate Cancer at 3.0 Tesla. Invest Radiol (2009) 44:572. doi: 10.1097/RLI.0b013e3181b4c10e
13. Quentin M, Blondin D, Klasen J, Lanzman RS, Miese FR, Arsov C, et al. Comparison of Different Mathematical Models of Diffusion-Weighted Prostate MR Imaging. Magn Reson Imaging (2012) 30:1468. doi: 10.1016/j.mri.2012.04.025
14. Pang Y, Turkbey B, Bernardo M, Kruecker J, Kadoury S, Merino MJ, et al. Intravoxel Incoherent Motion MR Imaging for Prostate Cancer: An Evaluation of Perfusion Fraction and Diffusion Coefficient Derived From Different B-Value Combinations. Magn Reson Med (2013) 69:553. doi: 10.1002/mrm.24277
15. Le Bihan D, Breton E, Lallemand D, Aubin ML, Vignaud J, Laval-Jeantet M. Separation of Diffusion and Perfusion in Intravoxel Incoherent Motion MR Imaging. Radiology (1988) 168:497. doi: 10.1148/radiology.168.2.3393671
16. Yang DM, Kim HC, Kim SW, Jahng GH, Won KY, Lim SJ, et al. Prostate Cancer: Correlation of Intravoxel Incoherent Motion MR Parameters With Gleason Score. Clin Imaging (2016) 40:445. doi: 10.1016/j.clinimag.2016.01.001
17. Zhang YD, Wang Q, Wu CJ, Wang X-N, Zhang J, Liu H, et al. The Histogram Analysis of Diffusion-Weighted Intravoxel Incoherent Motion (IVIM) Imaging for Differentiating the Gleason Grade of Prostate Cancer. Eur Radiol (2015) 25:994. doi: 10.1007/s00330-014-3511-4
18. Shan Y, Chen X, Liu K, Zeng M, Zhou J. Prostate Cancer Aggressive Prediction: Preponderant Diagnostic Performances of Intravoxel Incoherent Motion (IVIM) Imaging and Diffusion Kurtosis Imaging (DKI) Beyond ADC at 3.0 T Scanner With Gleason Score at Final Pathology. Abdom Radiol (NY) (2019) 44:3441. doi: 10.1007/s00261-019-02075-3
19. Le Bihan D, Mangin JF, Poupon C, Clark D, Pappata S, Molko N, et al. Diffusion Tensor Imaging: Concepts and Applications. J Magn Reson Imaging (2001) 13:534. doi: 10.1002/jmri.1076
20. Epstein JI, Egevad L, Amin MB, Delahunt B, Srigley JR, Humphrey PA. The 2014 International Society of Urological Pathology (ISUP) Consensus Conference on Gleason Grading of Prostatic Carcinoma: Definition of Grading Patterns and Proposal for a New Grading System. Am J Surg Pathol (2016) 40:244. doi: 10.1097/PAS.0000000000000530
21. King CR, Long J P. Prostate Biopsy Grading Errors: A Sampling Problem? Int J Cancer (2000) 90:326. doi: 10.1002/1097-0215(20001220)90:6<326::AID-IJC3>3.0.CO;2-J
22. Bao J, Wang X, Hu C, Hou J, Dong F, Guo L. Differentiation of Prostate Cancer Lesions in the Transition Zone by Diffusion-Weighted MRI. Eur J Radiol Open (2017) 4:123. doi: 10.1016/j.ejro.2017.08.003
23. Shinmoto H, Tamura C, Soga S, Shiomi E, Yoshihara N, Kaji T, et al. An Intravoxel Incoherent Motion Diffusion-Weighted Imaging Study of Prostate Cancer. AJR Am J Roentgenol (2012) 199:W496. doi: 10.2214/AJR.11.8347
24. Valerio M, Zini C, Fierro D, Giura F, Colarieti A, Giuliani A, et al. 3T Multiparametric MRI of the Prostate: Does Intravoxel Incoherent Motion Diffusion Imaging Have a Role in the Detection and Stratification of Prostate Cancer in the Peripheral Zone? Eur J Radiol (2016) 85:790. doi: 10.1016/j.ejrad.2016.01.006
Keywords: prostate cancer, IVIM, ISUP grade, diffusivity, pseudodiffusivity, perfusion fraction, kurtosis
Citation: Chang C-B, Lin Y-C, Wong Y-C, Lin S-N, Lin C-Y, Lin Y-H, Sheng T-W, Huang C-C, Yang L-Y and Wang L-J (2021) IVIM Parameters on MRI Could Predict ISUP Risk Groups of Prostate Cancers on Radical Prostatectomy. Front. Oncol. 11:659014. doi: 10.3389/fonc.2021.659014
Received: 26 January 2021; Accepted: 11 June 2021;
Published: 01 July 2021.
Edited by:
Sanja Štifter, Skejby Sygehus, DenmarkReviewed by:
Alessandro Tafuri, University of Verona, ItalyJoshua Cabral, Howard University, United States
Copyright © 2021 Chang, Lin, Wong, Lin, Lin, Lin, Sheng, Huang, Yang and Wang. This is an open-access article distributed under the terms of the Creative Commons Attribution License (CC BY). The use, distribution or reproduction in other forums is permitted, provided the original author(s) and the copyright owner(s) are credited and that the original publication in this journal is cited, in accordance with accepted academic practice. No use, distribution or reproduction is permitted which does not comply with these terms.
*Correspondence: Li-Jen Wang, bGlqZW53YW5nMDkxOEBnbWFpbC5jb20=; Lan-Yan Yang, bHl5YW5nMDExMUBnbWFpbC5jb20=
†These authors have contributed equally to this work and share first authorship
‡These authors have contributed equally to this work