 Lena M. Mittlmeier1
 Matthias Brendel1
 Leonie Beyer1
 Nathalie L. Albert1
 Andrei Todica1
 Mathias J. Zacherl1Vera Wenter1Annika Herlemann2Alexander Kretschmer2Stephan T. Ledderose3
 Nina-Sophie Schmidt-Hegemann4Wolfgang G. Kunz5Jens Ricke5Peter Bartenstein1
 Harun Ilhan1
 Marcus Unterrainer5*
- 1Department of Nuclear Medicine, University Hospital, Ludwig Maximilian University (LMU) Munich, Munich, Germany
- 2Department of Urology, University Hospital, LMU Munich, Munich, Germany
- 3Department of Pathology, University Hospital, LMU Munich, Munich, Germany
- 4Department of Radiation Oncology, University Hospital, LMU Munich, Munich, Germany
- 5Department of Radiology, University Hospital, LMU Munich, Munich, Germany
Background: Delineation of PSMA-positive tumor volume on PET using PSMA-ligands is of highest clinical interest as changes of PSMA-PET/CT-derived whole tumor volume (WTV) have shown to correlate with treatment response in metastatic prostate cancer patients. So far, WTV estimation was performed on PET using 68Ga-labeled ligands; nonetheless, 18F-labeled PET ligands are gaining increasing importance due to advantages over 68Ga-labeled compounds. However, standardized tumor delineation methods for 18F-labeled PET ligands have not been established so far. As correlation of PET-based information and morphological extent in osseous and visceral metastases is hampered by morphological delineation, low contrast in liver tissue and movement artefacts, we correlated CT-based volume of lymph node metastases (LNM) and different PET-based delineation approaches for thresholding on 18F-PSMA-1007 PET.
Methods: Fifty patients with metastatic prostate cancer, 18F-PSMA-1007 PET/CT and non-bulky LNM (short-axis diameter ≥10mm) were included. Fifty LNM were volumetrically assessed on contrast-enhanced CT (volumetric reference standard). Different approaches for tumor volume delineation were applied and correlated with the reference standard: I) fixed SUV threshold, II) isocontour thresholding relative to SUVmax (SUV%), and thresholds relative to III) liver (SUVliver), IV) parotis (SUVparotis) and V) spleen (SUVspleen).
Results: A fixed SUV of 4.0 (r=0.807, r2 = 0.651, p<0.001) showed the best overall association with the volumetric reference. 55% SUVmax (r=0.627, r2 = 0.393, p<0.001) showed highest association using an isocontour-based threshold. Best background-based approaches were 60% SUVliver (r=0.715, r2 = 0.511, p<0.001), 80% SUVparotis (r=0.762, r2 = 0.581, p<0.001) and 60% SUVspleen (r=0.645, r2 = 0.416, p<0.001). Background tissues SUVliver, SUVparotis & SUVspleen did not correlate (p>0.05 each). Recently reported cut-offs for intraprostatic tumor delineation (isocontour 44% SUVmax, 42% SUVmax and 20% SUVmax) revealed inferior association for LNM delineation.
Conclusions: A threshold of SUV 4.0 for tumor delineation showed highest association with volumetric reference standard irrespective of potential changes in PSMA-avidity of background tissues (e. g. parotis). This approach is easily applicable in clinical routine without specific software requirements. Further studies applying this approach for total tumor volume delineation are initiated.
Introduction
Prostate-specific membrane antigen (PSMA) targeted positron-emission-tomography (PET)/computed tomography (CT) is increasingly used for prostate cancer (PCa) staging and localization of recurrent and/or advanced disease (1). International PCa guidelines, including the European Association of Urology guideline, recommend PSMA PET/CT and its use, specifically in patients with PSA recurrence after primary therapy. Recently, the proPSMA trial also highlighted the important role of PSMA PET in high-risk patients prior to curative-intent surgery or radiotherapy with superior accuracy and lower costs compared to conventional imaging (2, 3). Furthermore, PCa staging using PSMA PET has significant impact on patient management as demonstrated in several groups (1, 4–8).
Beyond staging, PSMA PET/CT represents a useful tool for response to systemic therapy such as chemotherapy and radioligand therapy using 177Lu-PSMA ligands (1, 9, 10). Here, PSMA PET/CT provides additional information beyond the most commonly used tools for oncological response assessment in clinical trials such as CT, magnetic resonance imaging (MRI), bone scintigraphy and PSA serum levels (9, 11–13). Due to the limited diagnostic and predictive accuracy of morphological criteria, such as Response Evaluation Criteria in Solid Tumors (RECIST), particularly in mCRPC patients, advanced imaging-based response assessment tools with higher accuracy are needed, like it is the case with 18F-FDG-PET/CT in other tumor types like non-small-cell lung cancer (9, 14–16).
In this context, the longitudinal course of the PET-derived whole tumor volume (WTV) during systemic therapies is gaining increasing interest as an additional imaging biomarker for therapy monitoring. Several studies demonstrated that changes of PSMA PET-derived WTV correlate with treatment response (1, 9, 11, 17, 18) and may also serve as prognostic tool for overall survival estimation (1, 19, 20), as recently highlighted by a consensus statement by Fanti et al. (1).
In the field of PSMA ligands, 18F-labeled PSMA ligands will become increasingly important due to their advantages compared to 68Ga-labeled compounds, e. g. longer half-life, a lower positron energy and the possibility of large-batch production (21). While there are already published studies for tracer-specific thresholding and window-level-setting for WTV delineation using 68Ga-labeled ligands, to the best of our knowledge no study so far evaluated different models for WTV estimation using 18F-labeled PSMA ligands hitherto. So far, only two studies focused on intraprostatic tumor delineation using 18F-PSMA-1007, but without application to WTV (21, 22). Hence, we aimed at identifying and comparing different thresholding approaches for tumor delineation on 18F-PSMA-1007 PET/CT in correlation to a direct, CT-based volumetric reference standard.
Even if bone metastases present a common and clinically relevant metastatic spread in PCa patients (23), they are difficult to delineate on CT, mostly deeming them as non-measurable lesions according to RECIST 1.1 (24, 25). Also, lung metastases represent an unideal reference standard, especially due to motion artefacts on PET/CT and unequivocal protocols concerning breath-holding impacting PET imaging. In contrast, LNM represent measurable metastatic sites, especially in case of large extent and non-bulky localization. Therefore, we used large, non-bulky lymph nodes as volumetric reference standard for the evaluation of different threshold approaches for tumor delineation on 18F-PSMA-1007 PET/CT.
Material and Methods
Inclusion Criteria
This retrospective analysis was approved by the institutional ethics committee of the LMU Munich. Criteria for inclusion were I) patients with known or highly suspected (i.e., highly increased PSA value) metastatic prostate cancer; II) 18F-PSMA-1007 PET/CT, III) at least one singular located, non-bulky and PSMA-avid lymph node metastasis with short axis diameter (SAD) ≥ 1.0 cm.
Radiopharmaceutical and Imaging Protocol
A median activity of 247 MBq (range, 192-306 MBq) 18F-PSMA-1007 was injected intravenously in line with previously reported radiosynthesis and administration procedures (26). The patients were premedicated with furosemide (20 mg intravenously), when no contraindication was noted (27). The administration of the radiopharmaceutical was based on an individual patient basis according to the German Pharmaceuticals Act §13(2b). PET was performed from skull base to mid-thigh using a Biograph mCT scanner or a Biograph 64 PET/CT scanner (Siemens Healthineers Erlangen, Germany). The PET/CT scan was performed 60 min after tracer injection which included a diagnostic, contrast-enhanced CT scan in portal-venous phase (Imeron 350; 1.5 ml/kg body weight; Bracco Imaging, Milano, Italy). Images were reconstructed iteratively using TrueX (three iterations, 21 subsets) with Gaussian post-reconstruction smoothing (2 mm full width at half-maximum). Slice thickness on contrast-enhanced CT was 0.3 cm.
CT Image Analysis
For lymph node analysis, the SAD and the long-axis-diameter (LAD) were assessed. Assessment criterion for lymph node metastases were SAD of at least 1.0 cm, non-bulky, singular located and a distinct localization without contact to other structures. The extent of PSMA-avidity was no criterion for the selection of lymph node metastases. Then, the volume of the respective lymph nodes was manually delineated on a slice-by-slice manner and visually checked for correctness. The respective localizations were determined in each of the selected LNM (one per patient) by two experienced radiologists (WGK, MU) on a dedicated workstation (Siemens Healthineers Erlangen, Germany).
PET Image Analysis
Using a dedicated workstation (Affinity 1.1.4, Hermes Medical Solutions, Stockholm, Sweden) an ellipsoid volume of interest (VOI) was created surrounding the selected lymph node excluding off-target, PSMA-avid lesions. Exclusion of other PSMA-avid lesions was checked visually in order to avoid biased results. In this VOI, different approaches for volumetric delineation of the respective lymph nodes were applied and correlated with the reference standard; the following approaches were used: I) fixed SUV threshold, II) isocontour thresholding relative to SUVmax (SUV%) and thresholds relative to III) liver (SUVliver), IV) parotis (SUVparotis) and V) spleen (SUVspleen):
I. Fixed SUV thresholds: The following values were applied: SUV 15.0; SUV 10.0; SUV 7.5; SUV 5.0; SUV 4.5; SUV 4; SUV 3.5; SUV 3.0 and SUV 2.5).
II. Isocontour relative to SUVmax (SUV%): The following values were applied: 10.0%; 15.0%, 20.0%, 25.0%, 30.0%, 35.0%, 40.0%, 42.0%, 44.0%, 45.0%, 50.0%, 55.0%; 50.0%; 70.0% and 75.0%).
III. Thresholds relative to SUVliver: Background values were derived from a 30 mm-diameter circular reference region of interest (ROI) in the normal inferior right liver lobe in the axial plane excluding blood vessel activity, as described previously (28). The following threshold values were applied: SUVliver minus 45.0%; 50.0%; 55.0%; 60.0%; 70.0% and 75.0%.
IV. Thresholds relative to SUVparotis: Values were derived from a cubic 10 x 10 x 10 mm reference ROI in the parotis. The following threshold values were applied: SUVparotis minus 60.0%; 70.0%; 75.0%; 80.0%; 85.0% and 90.0%.
V. Thresholds relative to SUVspleen: Background values were derived from a cubic 30 x 30 x 30 mm reference ROI in the spleen. The following threshold values were applied: SUVspleen minus 40.0%; 50.0%; 55.0%; 60.0%; 65.0% and 70.0%.
Statistical Analyses
Statistical analyses were performed with IBM SPSS® Statistics (version 25, IBM Corp., Armonk, NY). Correlation between CT-measured volumes and the PET-based volumes using different threshold was evaluated using Spearman and Pearson correlation coefficient after testing for normal distribution as determined by the Shapiro-Wilk test. The coefficient of variation (CoV) was used as standardized measure of dispersion of a probability distribution as defined as the ratio of the standard to the mean. Group comparisons of continuous, not normally distributed parameters were compared using the Kruskal-Wallis test. For visualization of correlation, scatter plots and Bland-Altman plots were used. Statistical significance was defined as a two-sided p-value <0.05.
Results
Patients
The median age was 71.0 years (range, 55.8-91.5 years). There was a median PSA of 25.8 ng/ml (range, 0.2 – 1118.0 ng/ml) and a median Gleason score of 9 (range, 6 – 10). Lymph node metastases were present in 50/50 patients (100.0%), tumors at the prostate bed in 28/50 patients (56.0%), bone metastases in 36/50 patients (72.0%) and visceral metastases in 11/50 patients (22.0%). Non PSMA-avid metastatic lesions were present in 0/50 patients (0.0%). Extended patients’ specifications including previous therapies are listed in the Supplementary Table.
CT Image Analysis
Lymph node size was assessed using the SAD (median 1.4 cm (range, 1.0 – 2.8 cm), LAD (median 1.9 cm; range 1.1 – 3.8 cm) and CT-derived volume (median 3.2 ml; range 1.0 – 23.8 ml). Among the lymph node metastases, 31/50 were located next to the common and internal iliac vessels (62.0%), 6/50 cervical (12.0%), 3/50 mediastinal (6.0%), 3/50 paraaortic and paracaval/interaortocaval (6.0%), 2/50 in the inguinal region (4.0%), 2/50 pararectal (4.0%), 2/50 axillar (4.0%) and1/50 in the retroclavicular region (2.0%).
Volumetric Correlation of Different Delineation Approaches
Results from above mentioned I) fixed SUV thresholds, II) isocontour thresholding relative to SUVmax (SUV%), thresholds relative to III) liver (SUVliver), IV) parotis (SUVparotis) and V) spleen (SUVspleen) and their correlation to the CT derived volume as reference standard can be found in Tables 1–5.
I. Fixed SUV thresholds: In I) the highest correlation between CT-derived volume and a fixed threshold could be found with a SUV of 4.0 (r=0.807, r2 = 0.651, p<0.001). Generally, it could be shown that higher (e. g. 15.0; 10.0), but also lower fixed SUV values (e. g. 2.5, 5.0 and 4.5) comprised lower correlation to the reference standard (please see Table 1), due to a consecutive under- and overestimation of the respective volume.
II. socontour relative to SUVmax (SUV%): 55% SUVmax showed highest association using an isocontour (r=0.627, r2 = 0.393, p<0.001). Recently reported isocontour based cut-offs for intraprostatic tumor delineation [i. e. isocontour 20%, 44% and 42% SUVmax (21, 22)] revealed inferior association for LNM delineation (please see Table 2).
III. Thresholds relative to SUVliver: 60% SUVliver (r=0.715, r2 = 0.511, p<0.001) showed highest association using thresholds relative to the SUVmean of the liver while lower as well as higher values relative to the liver showed lower correlation to the reference standard (see Table 3).
IV. Thresholds relative to SUVparotis: 80% SUVparotis (r=0.762, r2 = 0.581, p<0.001) showed highest association using thresholds relative to the SUVmean of the parotis (SUVparotis). Lower values relative to the parotis (e. g. 60% SUVparotis), but also higher values (e. g. 90% SUVparotis) showed inferior correlation to the volumetric reference standard (see Table 3).
V. Thresholds relative to SUVspleen: 60% SUVspleen (r=0.645, r2 = 0.416, p<0.001) showed highest association using thresholds relative to the SUVmean of the spleen (SUVspleen). Lower as well as higher threshold values showed lower correlations respectively (see Table 3).
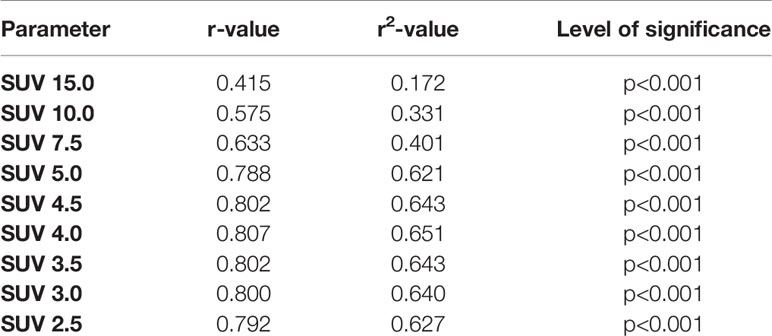
Table 1 Correlation with fixed SUV thresholds.
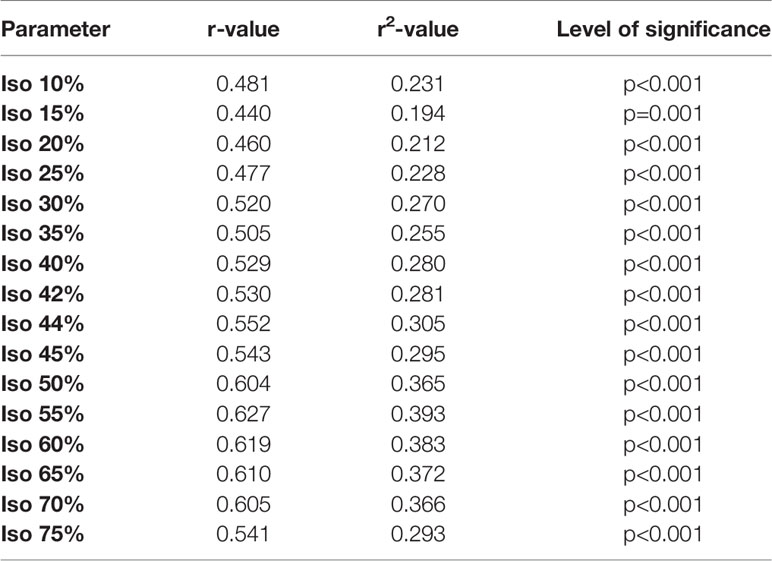
Table 2 Isocontour volumetric correlation.

Table 3 Background based volumetric correlations with SUVliver, SUVparotis and SUVspleen.
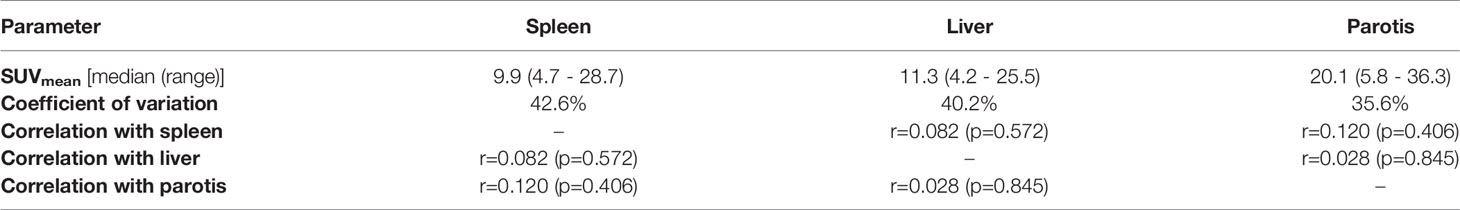
Table 4 Correlation of background tissues SUVliver, SUVparotis & SUVspleen.
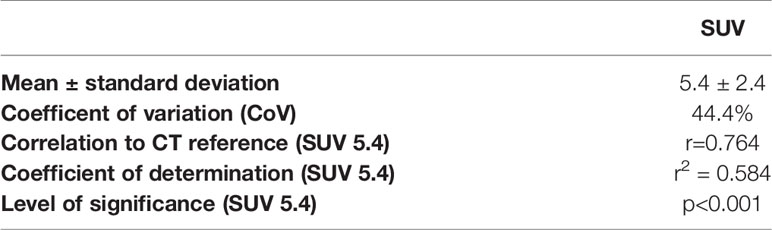
Table 5 Individual backwards thresholding.
A patient example applying the best threshold of the different approaches on a single LNM is shown in Figure 1. For visualization of the association of the best threshold of the different approaches with the reference standard, correlation plots and the respective Bland-Altman plots are shown in Figures 2 and 3.
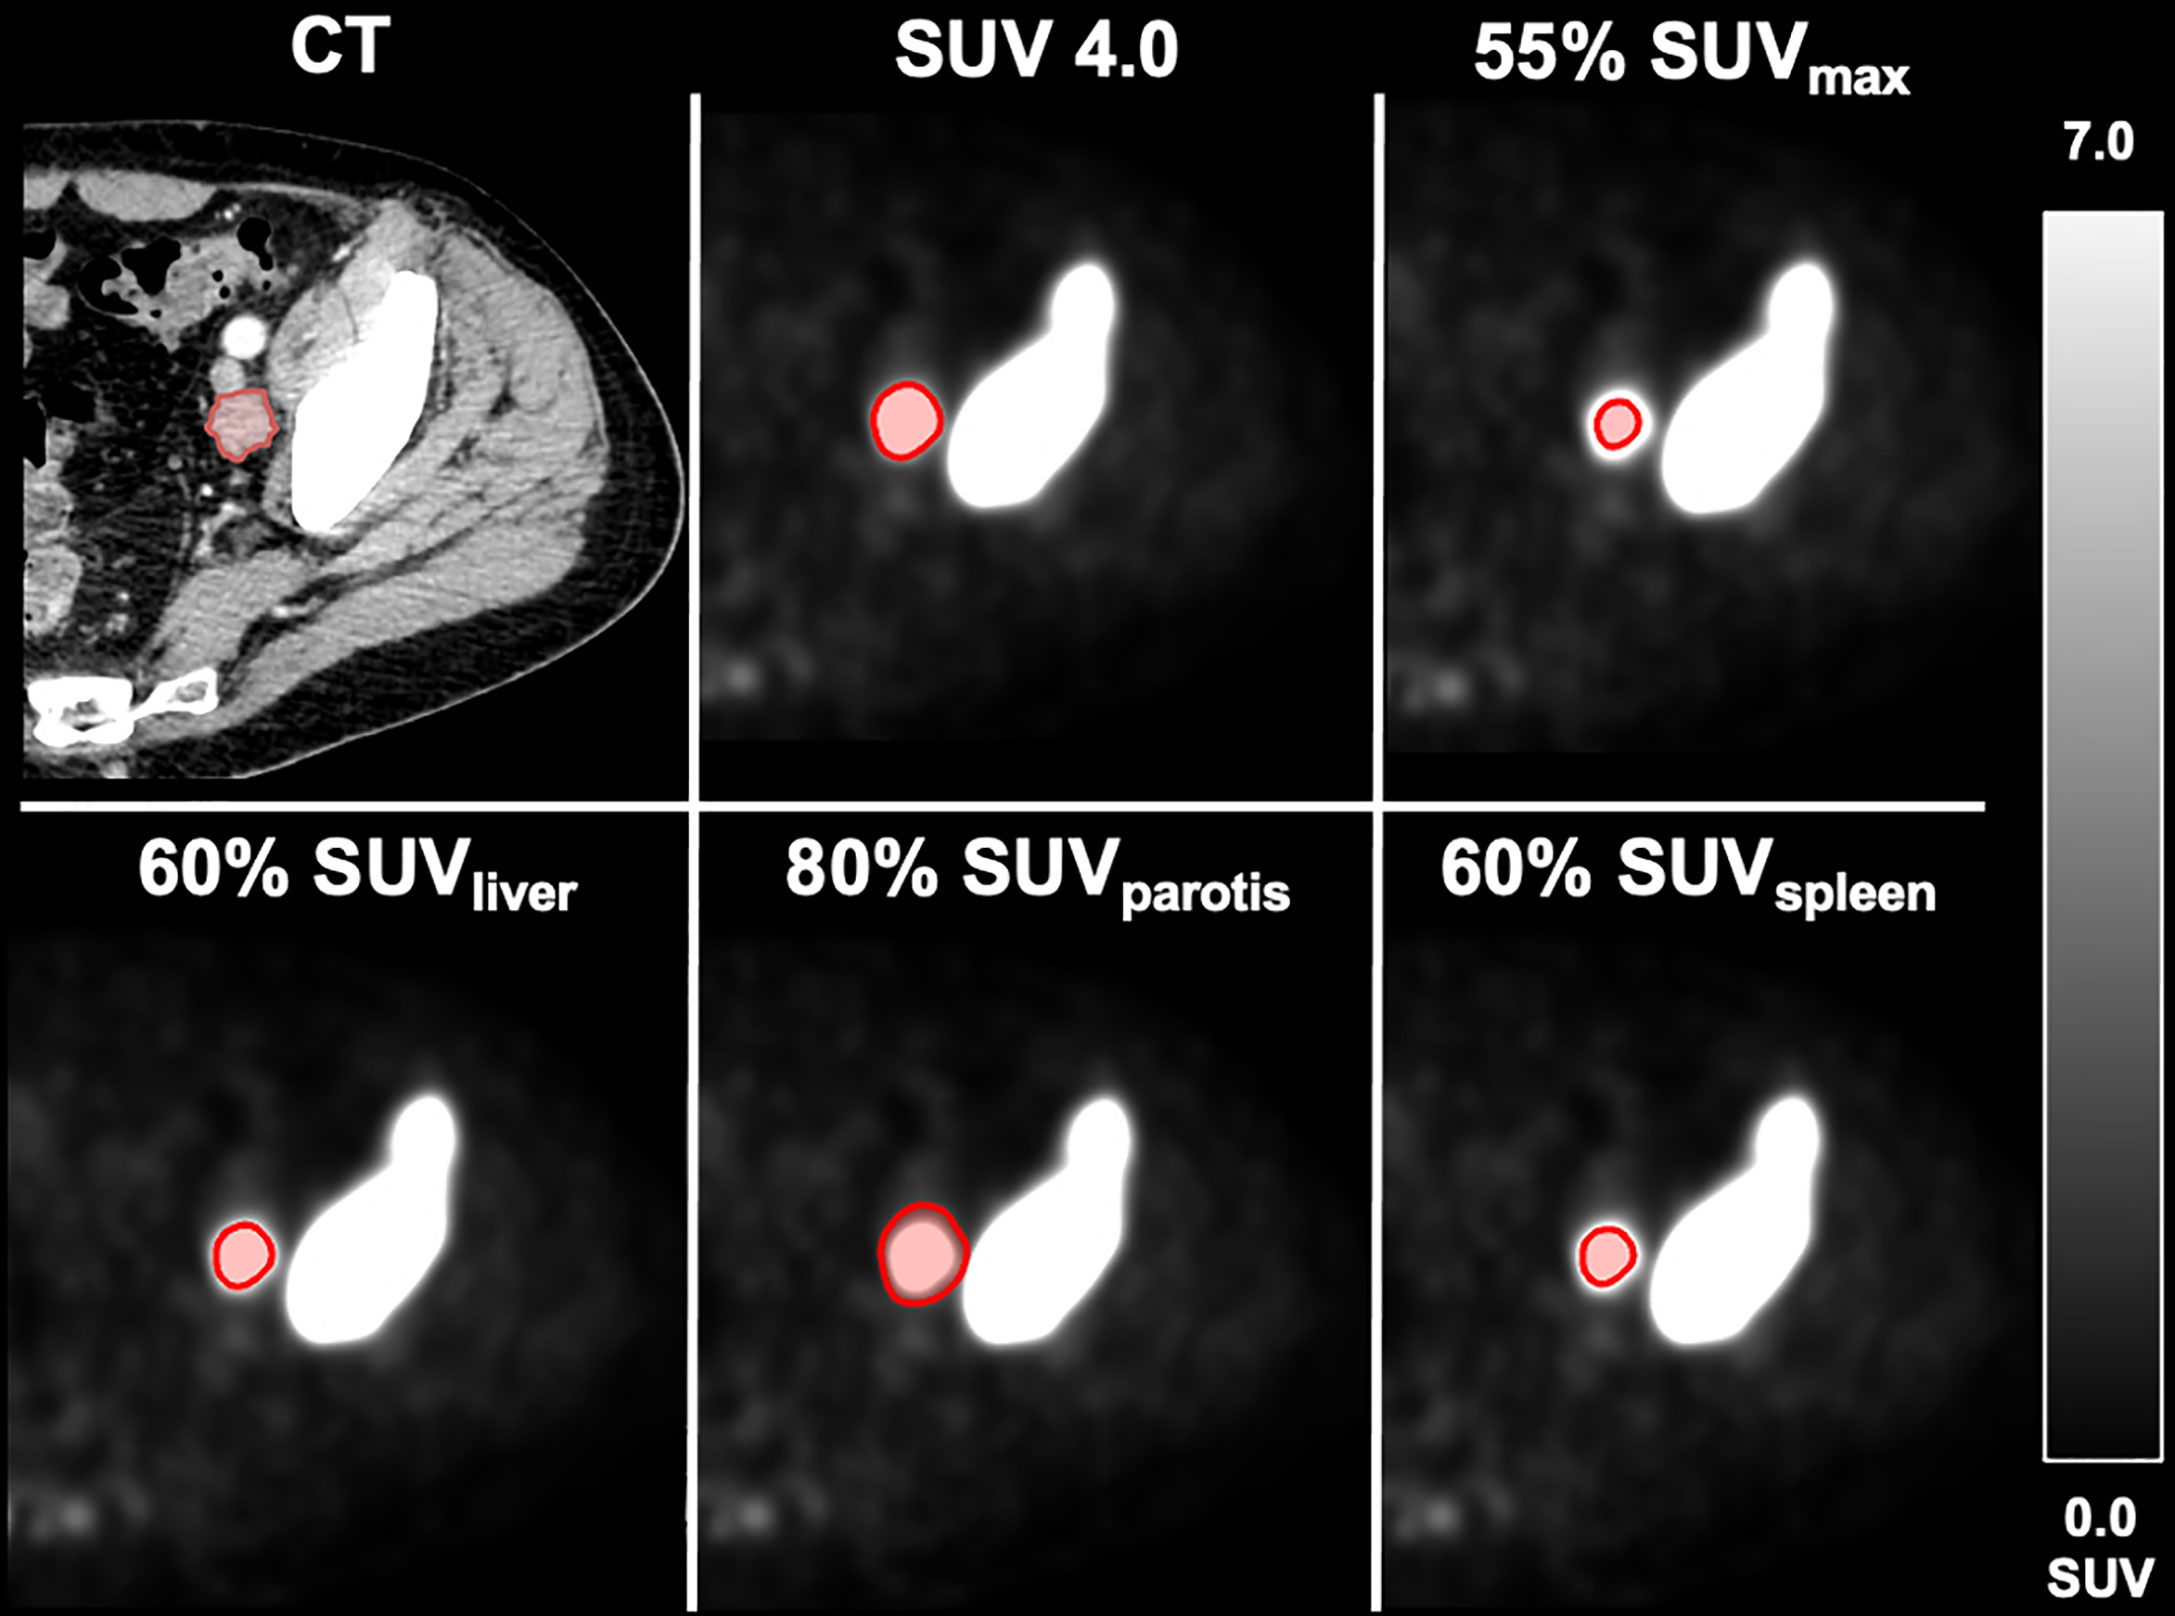
Figure 1 Different delineation methods in an exemplary metastatic patient. Volumetric reference standard 6.3 m; SUV 4.0: 5.5 ml. 55% SUVmax: 1.0 ml. 60% SUVliver: 4.5 ml. 80% SUVparotis: 6.4 ml. 60% SUVspleen: 4.0 ml.
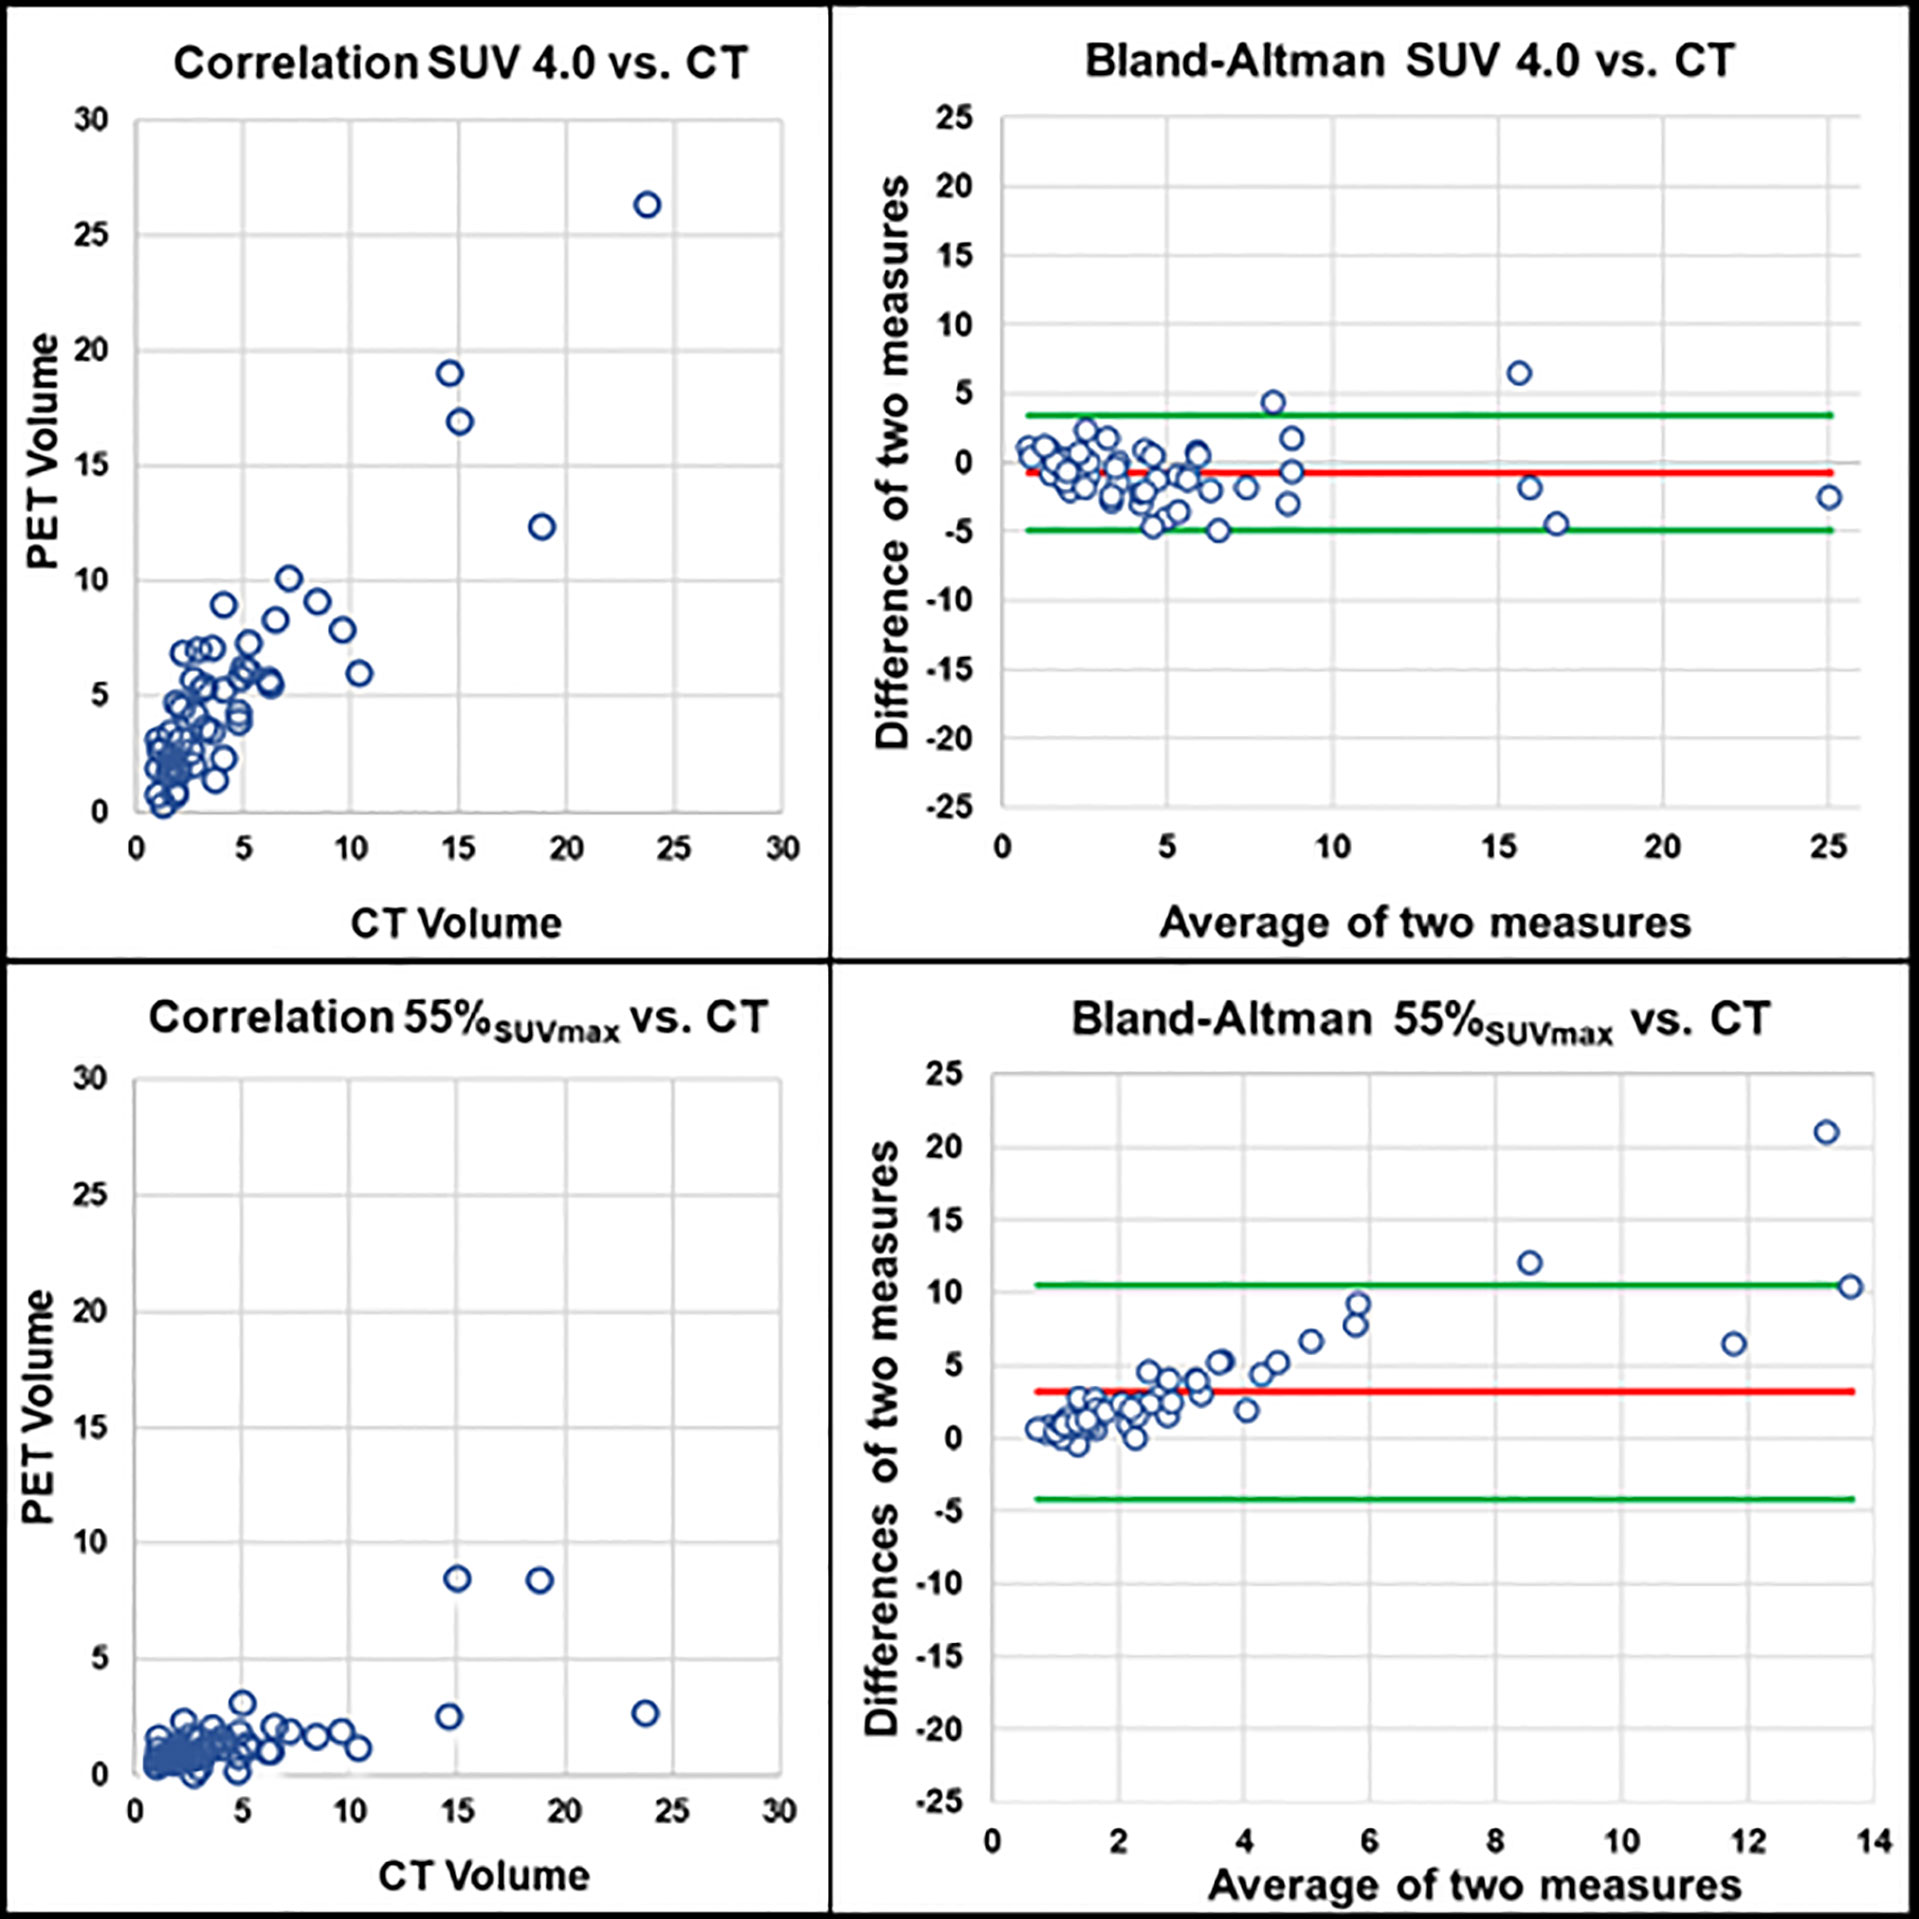
Figure 2 Correlation of PET volumes and CT-based reference standard. Upper row: PET volume SUV 4.0 (r = 0.807, r2 = 0.651, p < 0.001). Lower row: PET volume isocontour of 55% SUVmax (r = 0.627, r2 = 0.393, p < 0.001); each correlation plot is accompanied by the respective Bland-Altman plot (red line: mean difference of two measures. Green lines: mean difference of two measures ± 1.96 x standard deviation).
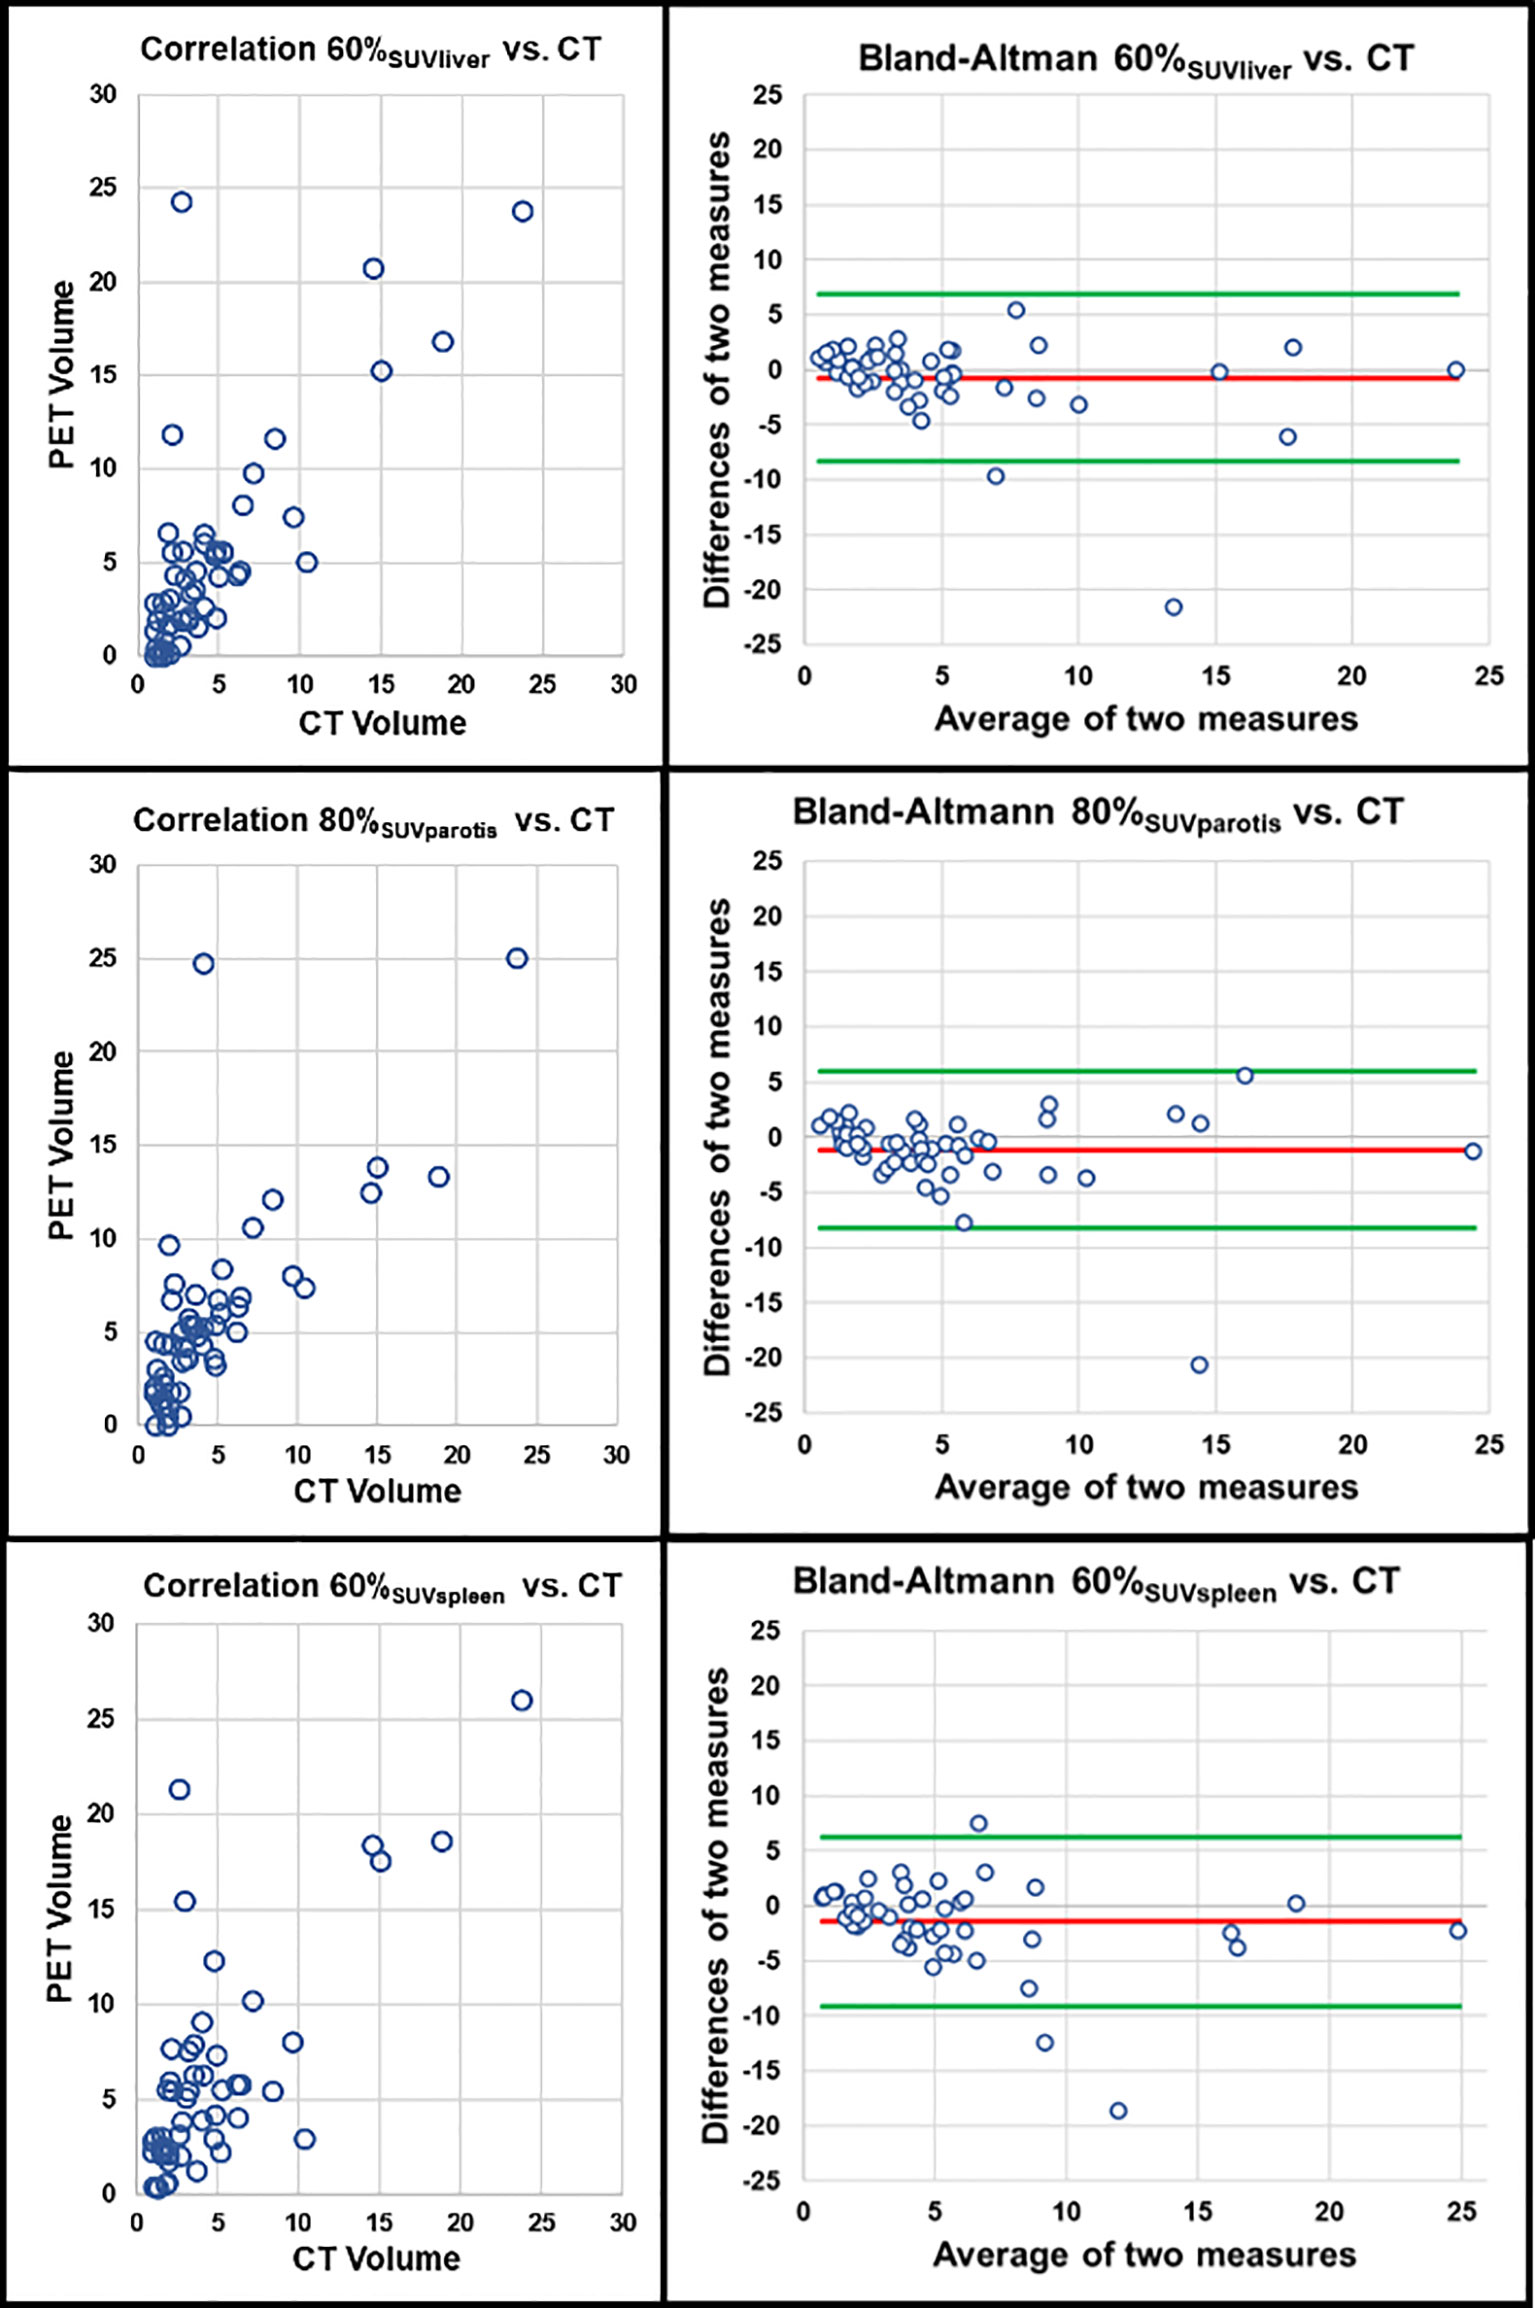
Figure 3 Correlation of PET volumes using background tissue and CT-based reference standard. Upper row: PET volume 60% SUVliver (r = 0.715, r2 = 0.511, p < 0.001). Middle row: 80% SUVparotis (r = 0.762, r2 = 0.581, p < 0.001). Lower row: PET volume 60% SUVspleen (r = 0.645, r2 = 0.412, p < 0.001); each correlation plot is accompanied by the respective Bland-Altman plot (red line: mean difference of two measures. Green lines: mean difference of two measures ± 1.96 x standard deviation).
PSMA-Avidity of Background Tissues
Highest median SUVmean in background tissues was found in the parotid gland followed by the liver and spleen (lowest uptake), i. e. 20.1 (range, 5.8 - 36.3) vs. 11.3 (range, 4.2 - 25.5) vs. 9.9 (4.7 – 28.7), p<0.001. These uptake values lead to an CoV of 42.6% using SUVspleen, followed by 40.2% using SUVliver and the lowest CoV of 35.6% using SUVparotis. PSMA-avidity of background tissues (SUVliver, SUVparotis & SUVspleen) did not show a significant correlation with each other (p>0.05 each) (please see Table 4).
Individual Backwards Thresholding
On an individual, single lymph node basis, threshold values were individually adjusted in order to achieve the very same PET-based volume compared to the CT-based reference standard in each lymph node using a fixed SUV value, as this approach performed best in previous analyses. Here, the same volume compared to the CT-based reference was achieved using a mean SUV of 5.4 ± 2.4, which resulted in a high CoV of 44.4% among the fifty LNM. However, applying these resulting mean values of backwards thresholding to all 50 lymph nodes and correlating these volumes the CT-based volumetric reference (i. e. SUV 5.4 in all 50 lymph nodes), the correlation coefficient was inferior to previous analyses (i. e. r=0.764, r2 = 0.584, p<0.001) (see Table 5).
Discussion
Measuring the volumetric extent of metastatic spread in prostate cancer is of fundamental interest in patients undergoing systemic therapy such as chemotherapy or radioligand therapy (17, 29) with potential impact on clinical decision making (7, 9, 30, 31). Due to its many advantages over 68Ga-labeled ligands, 18F-labeled compounds such as 18F-PSMA-1007 are becoming increasingly important for staging as well as treatment response assessment; in this analysis, we correlated tumor volumes derived from different threshold-based approaches for PET-based delineation with the CT-based, volumetric reference, i. e. the morphological volume of distinct, non-bulky lymph node metastases as derived from hybrid imaging using 18F-PSMA-1007 PET/CT.
Even if bone metastases present a common and clinically relevant metastatic spread in PCa patients (23), they are difficult to delineate on CT resulting in non-measurable lesions according to routine response criteria RECIST 1.1 (24, 25). Also, visceral metastases or lung metastases represent an unideal volumetric reference standard for the current issue, especially due to motion artefacts on PET/CT and unequivocal protocols concerning breath-holding impacting PET imaging. In contrast, LNM represent measurable metastatic sites, especially in case of large extent and non-bulky localization and were primarily evaluated in the current analysis.
In consideration of our results, we can state that a simple fixed SUV of 4.0 as threshold for tumor delineation without reference tissue correlated best with the volumetric reference standard (r=0.807, r2 = 0.651, p<0.001) even though some of our acquired threshold values also showed comparable, but slightly lower correlation coefficients to the reference standard [e.g. 60% SUVliver (r=0.715, r2 = 0.511, p<0.001) or 80% SUVparotis (r=0.762, r2 = 0.581, p<0.001)]. These data are additionally supported by the visual analyses of the respective Bland-Altman plots (see Figure 2), where the approach using SUV 4.0 as delineation method also performed best.
Previously published optimized thresholds for intraprostatic tumor delineation on 18F-PSMA-1007 PET/CT (20%, 42% and 44% isocontour relative to SUVmax) showed distinctly lower correlation to the reference standard compared to a fixed SUV of 4.0 (20% SUV%: r=0.460, r2 = 0.212. 42% SUV%: r=0.530, r2 = 0.28. 44% SUV%: r=0.552, r2 = 0.305, p<0.001 each), which indicates that these values seem feasible for delineation of the primary site of prostate cancer, but seem less feasible for delineation of lymph node volumes or even WTV in metastatic prostate cancer patients (22).
Obviously, it can be stated that the identification of the “one” ideal threshold value is a merely impossible task, as, on a cellular level, not all tumor cells can be delineated and be included in the image-derived WTV. However, a uniformly applied approach for PET-based delineation with the nearest approximation to a reference standard might, consequently, also allow a uniform and cross-institutional estimation of a WTV. We identified a simple SUV value of 4.0 as the threshold with the best correlation to the reference standard derived from large LNM. Thresholding using mere SUV values comprises several advantages: no specific software or algorithms are needed to determine WTV on 18F-PSMA-1007 PET/CT, as SUV is a commonly displayed unit in PET imaging. Moreover, no background/reference tissues are needed for WTV estimation making this analysis independent of potential change in PSMA-avidity in the reference tissues potentially changing over time or during systemic therapy, e.g. during 177Lu- or 225Ac-PSMA-radioligandtherapy (32, 33). Of note, we could show that on an inter-individual basis, the most commonly applied reference tissues (i.e. liver, parotis, spleen) do have a high inter-individual variability with CoV values up to 43%. Moreover, the respective PSMA-avidity of all three reference tissues is not correlated with one another on an intra-individual level, so that a general, uniform PSMA-avidity among healthy organs seems unlikely. These findings also support the application of a simple SUV-based approach without reference tissue.
When trying to derive an optimal threshold on a backwards step approach, i.e., setting the threshold value to achieve the same volume on PET in every single lymph node, one can state that the reverse deduction of a PET-based threshold is partially limited by the obtained dispersion of threshold-values, i.e., we observed an CoV of around 40% among the resulting threshold values. When directly applying the derived mean SUV value to all lymph nodes and performing a correlation analysis with the CT-based reference standard, a good correlation to the volumetric reference standard was observed, which was, however, still inferior compared to the mere application of a SUV value of 4.0.
Overall, the application of a threshold of SUV 4.0 seems easily applicable in clinical routine, despite a certain blurriness regarding the actual nodal tumor volume. Given the partially extensive WTV in patients prior to systemic therapy, e.g., 177Lu-PSMA radioligand therapy, these small differences in lymph node volumes and small uncertainties in WTV do probably not carry a clinically relevant weight, when the same procedure is applied in a uniform manner consequently, so that the unavoidable blurriness is applied to all studies to the same degree. For potential translation of the derived threshold to other metastases, we included patient examples where the threshold of SUV 4.0 was applied for whole tumor volume delineation (see Figures 4, 5) and showed a direct easy applicability and direct feasibility; nonetheless, further studies evaluating this threshold for WTV delineation and its course during therapy are the logical conclusion of the current analysis.
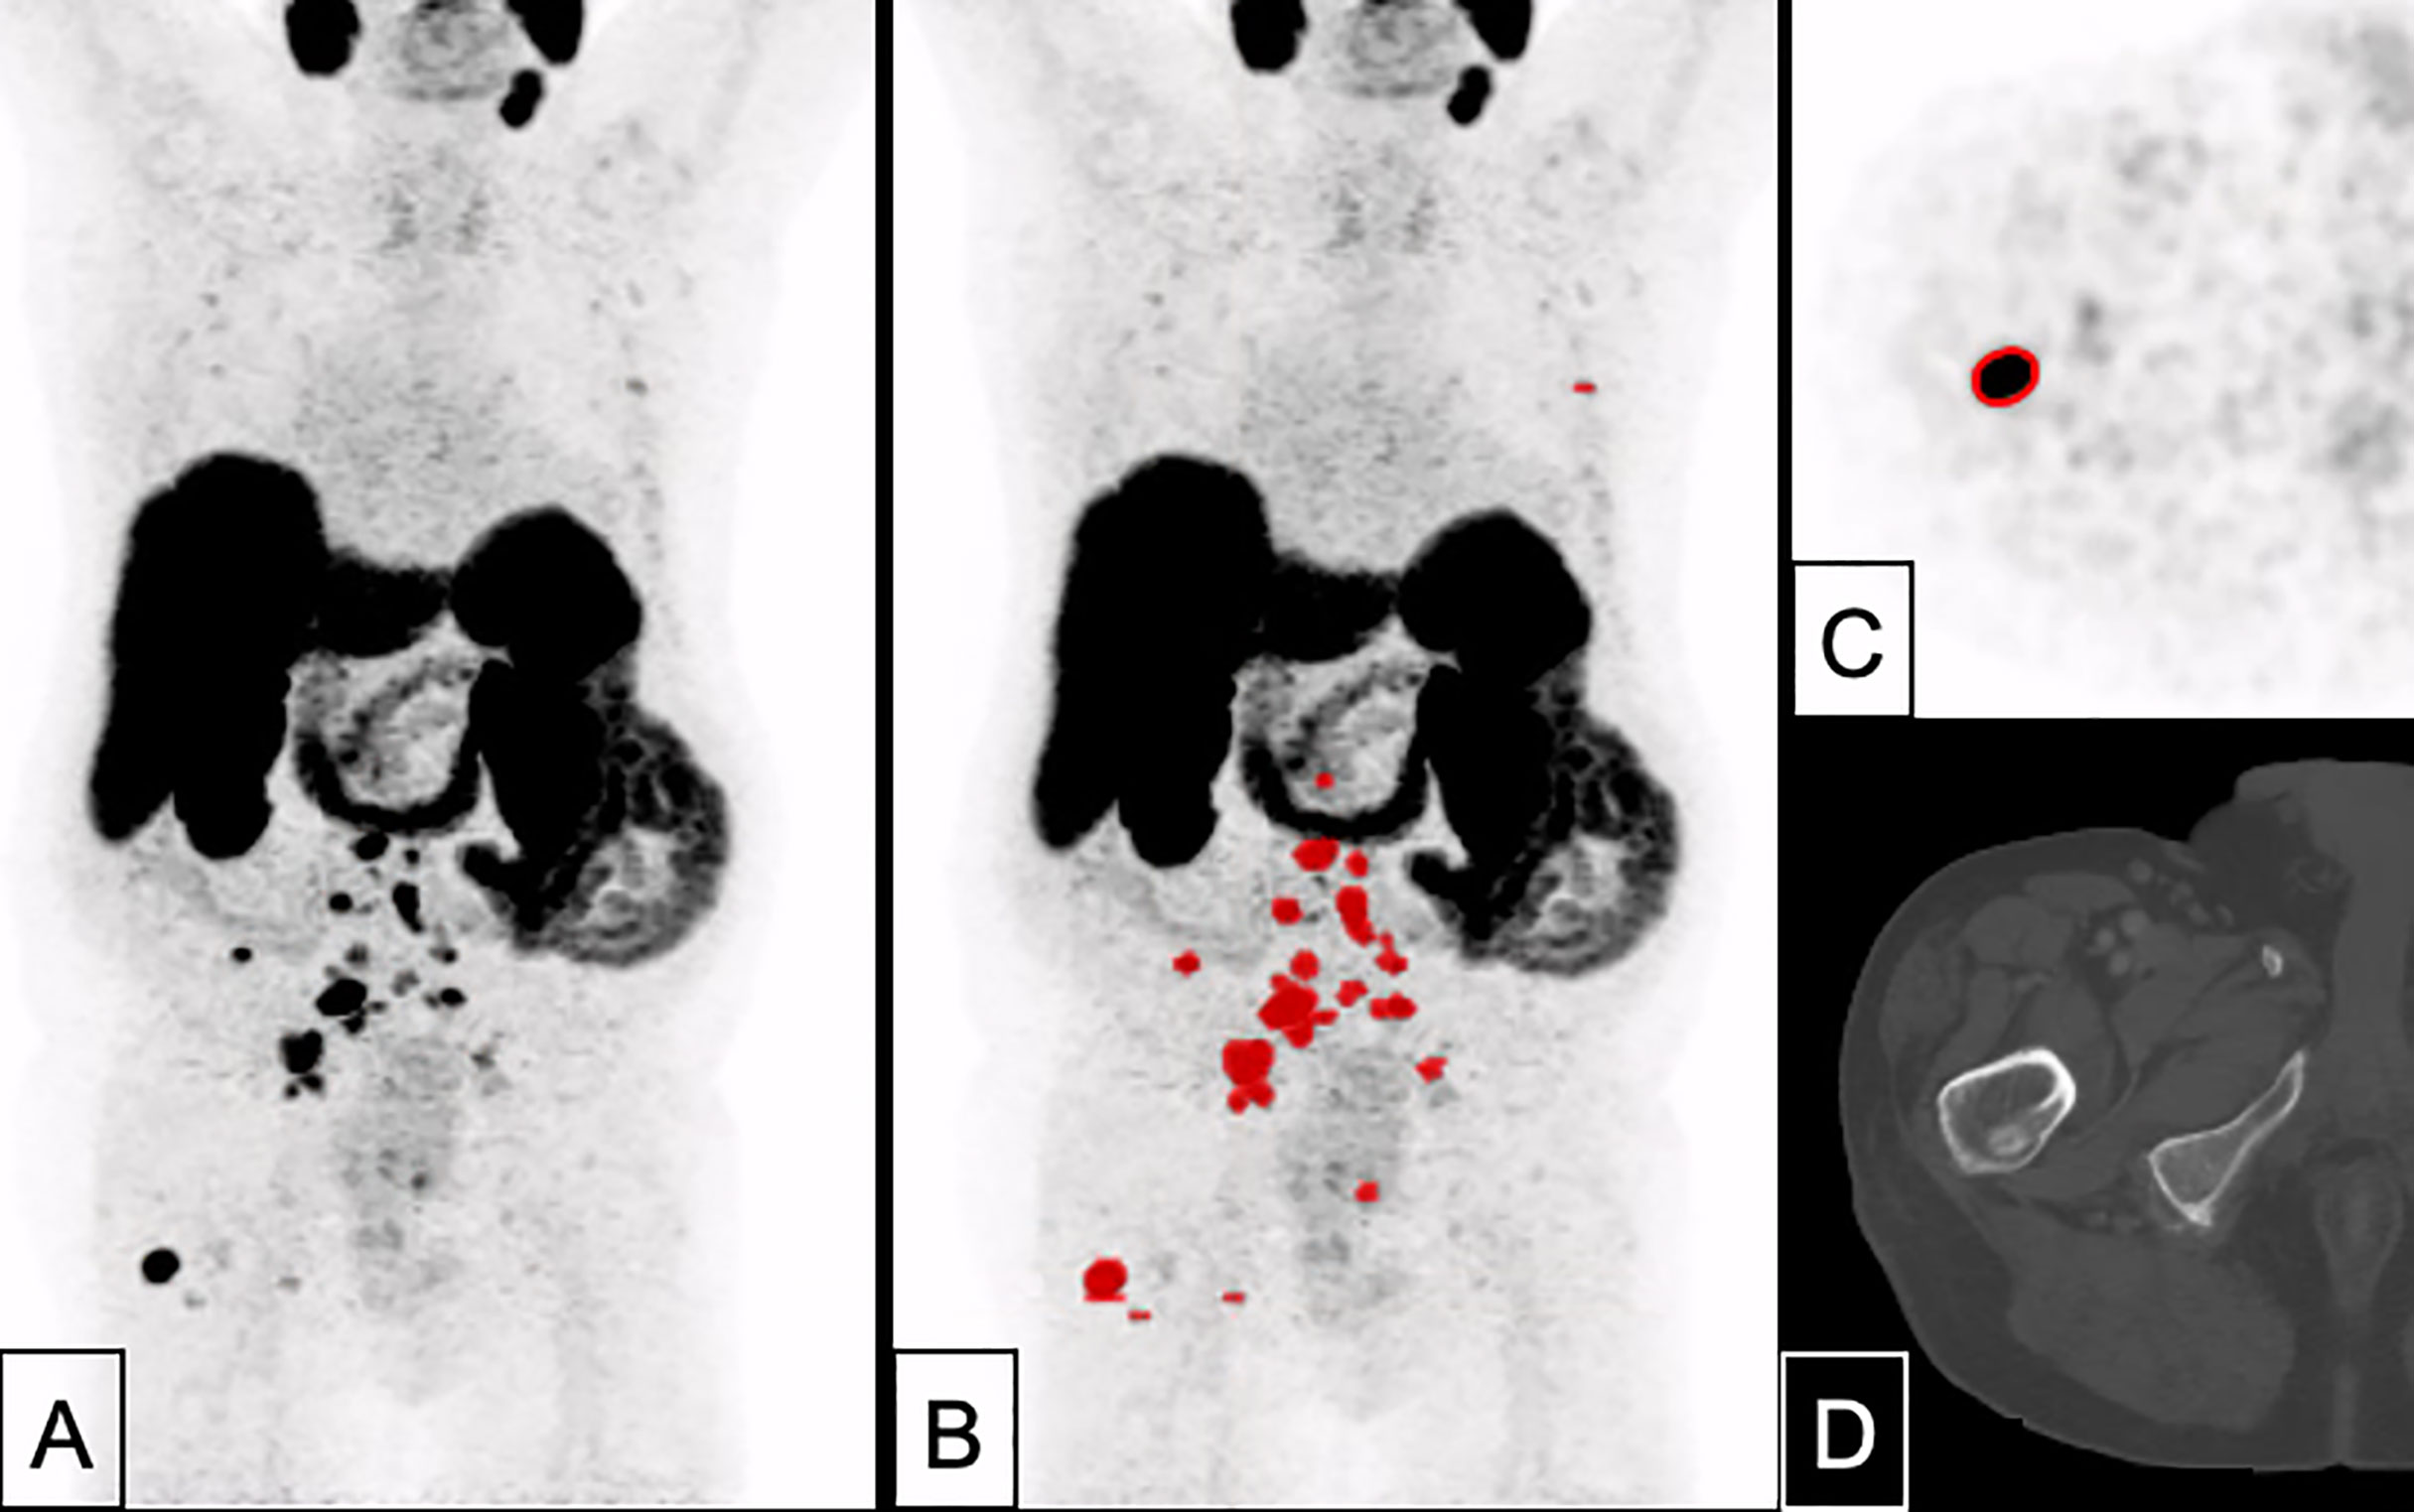
Figure 4 A 82 years-old patient with prostate cancer remnant as well as bone and lymph node metastases (PSA 10.1 ng/ml, Gleason 8). Tumor delineation using a cut-off of SUV 4.0 revealed a WTV of 37.9 ml. (A) maximum intensity projection (MIP); (B) MIP + WTV (red color); (C) delineation of a bone metastasis on PET; (D) CT correlate (bone window).
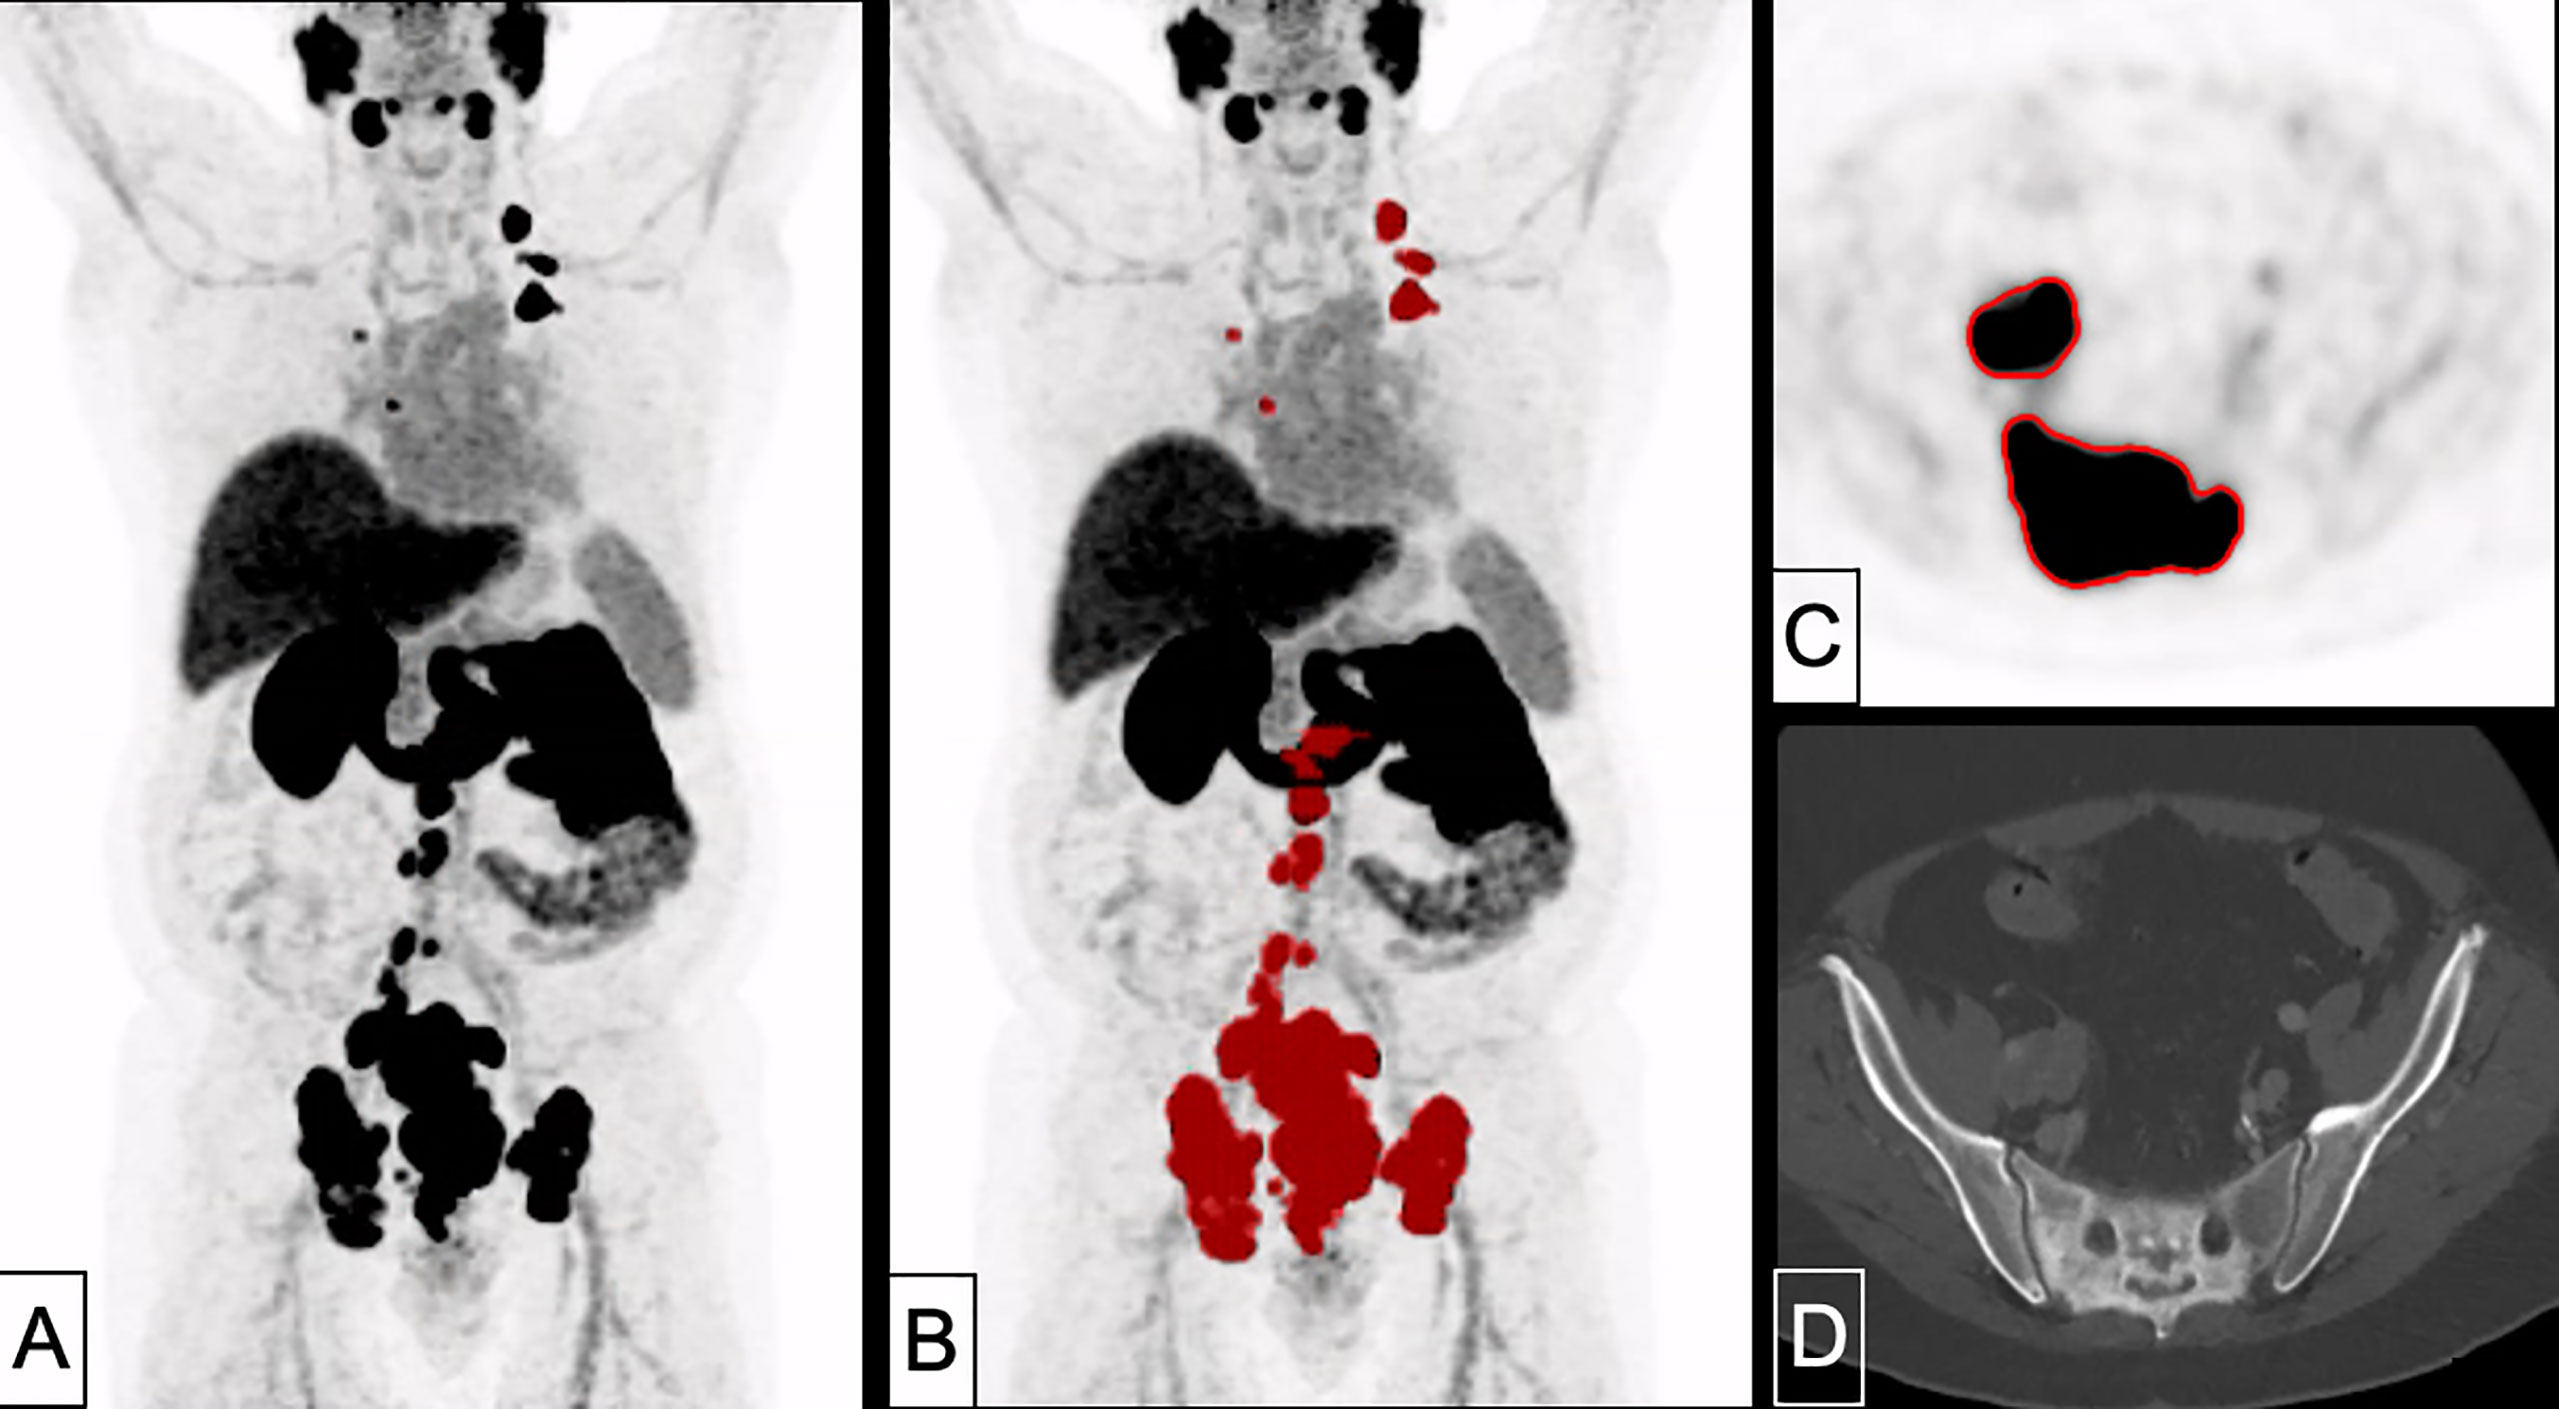
Figure 5 A 70 years-old patient with primary prostate cancer remnant with bone, pleura and lymph node metastases (PSA 78.0 ng/ml, Gleason 10). Tumor delineation using a cut-off of SUV 4.0 revealed a WTV of 586 ml. (A): MIP; (B) MIP + WTV (red color); (C) delineation of bone and lymph node metastasis on PET; (D) CT correlate (bone window).
However, it has to be discussed that metastatic sites without significant PSMA-avidity (e.g. < SUV 4.0) are not included in the whole tumor volume as a consequence. In case of PSMA-negative, but clear metastatic spread on CT imaging (e.g. large bone metastases, bulky lymph nodes, etc.), but very low or even missing PSMA-avidity, a PSMA-derived tumor volume might underestimate the “real” tumor volume. Therefore, more specifically, the term “whole tumor volume” should be noted to be the “PSMA-avid whole tumor volume”. However, in the concrete case, if there are obvious metastatic sites on CT that are not included in the whole tumor volume due to very low or even missing PSMA-avidity, this fact should lead to e. g. an additional 18F-FDG PET for the evaluation of tumor dedifferentiation; in case of FDG-avid, non-PSMA-avid lesions, 18F-FDG PET imaging might be the superior modality for tumor characterization and, moreover, the application of PSMA-directed therapies should be critically discussed (34, 35).
Moreover, it should be noted that the application of this threshold potentially needs manual refinement, especially in case of close vicinity to areas or physiologically high PSMA-avidity such as the liver or guts, where the application of this threshold would cause a direct inclusion of lesions with physiological PSMA-avidity; however, this phenomenon is common for all PSMA-ligands and, moreover, also other ligands such as 18F-FDG, where areas of high glucose consumptions such as the brain do hamper automated lesion segmentation. E. g. in the rather rare case of liver metastases, the automatic delineation of liver metastases using this threshold SUV 4.0 has to be refined manually, especially, as the radioligand 18F-PSMA-1007 presents with a rather high biliary excretion (36). Nonetheless, in cases with liver metastases from prostate cancer, these cases usually present with generally high tumor burden so that small variabilities in manual refinement of liver metastases do not have a major impact on the absolute whole tumor volume. However, the issue of delineation of liver metastases is shared by nearly every PSMA-ligand in dependence of the particular degree of biliary excretion.
Moreover, using comparable PET/CT scanners from the same vendor with the same reconstruction algorithms and EARL accreditation, we observed a higher rate of dispersion regarding tumor delineation based on approaches relating to SUVmax as reference value, i. e. isocontour delineation. Our proposed delineation method, however, is based on a mere application of SUV values independent of the specific SUVmax value within metastatic sites. As also shown for other ligands (37), diverging PET-scanners and reconstruction algorithms do rather affect the reproducibility of SUVmax values than significantly lower, mere SUV values within the lesion. Therefore, the proposed delineation method should be more robust and reproducible compared to delineation methods relating to SUVmax, as it seems less susceptible to diverging vendors and reconstruction algorithms. Further studies, however, have to address the reproducibility of PET parameters on 18F-PSMA-1007 PET in prostate cancer patients with emphasis on vendors and reconstruction algorithms beyond the scope of the current analysis.
Our analysis has several limitations that need to be considered: Some of the examined lymph nodes might potentially be susceptible to partial volume effect and spillover effects, even though we have chosen lymph nodes with a SAD of at least 1.0 cm (38). Another limitation is the retrospective design of the study as well as the fact that some of the lymph nodes were not histologically proven to be prostate cancer metastases. Nonetheless, our patients were already diagnosed with prostate cancer and presented with significantly increased PSA values and a high PSMA-expression of the lymph nodes, making an unspecifically high PSMA-avidity very unlikely. Moreover, readers were aware of common pitfalls with regard to lymph node detection, such as the presence of ganglia (39). In the future, a larger assessment with more patients is warranted to confirm our preliminary results. Additionally, further studies applying our approaches for total tumor volume delineation have to be performed to support our findings. Therefore, the concrete applicability of the currently derived threshold for metastatic sites other than lymph nodes has to be assessed systematically and has to be validated in the specific scenario of therapy monitoring of systemic treatments with assessment of WTV changes over time.
Conclusions
A simple threshold of SUV 4.0 for delineation of nodal PCa lesions showed highest association with the volumetric reference standard independent of potential changes of PSMA-avidity in background tissues (e.g. parotis). This approach is easily applicable in clinical routine without specific software requirements. Further studies applying this approach for total tumor volume delineation are underway.
Data Availability Statement
The original contributions presented in the study are included in the article/Supplementary Material, further inquiries can be directed to the corresponding author/s.
Ethics Statement
The studies involving human participants were reviewed and approved by Ethics Committee, LMU Munich. Written informed consent for participation was not required for this study in accordance with the national legislation and the institutional requirements.
Author Contributions
Manuscript draft/concept: LM and MU. Clinical management: NA, AT, MZ, VW, AH, AK, SL, and N-SS-H. Image analyses: LM, WK, HI, and MU. Supervision JR and PB. All authors increased the intelectual content of the work. All authors contributed to the article and approved the submitted version.
Conflict of Interest
The authors declare that the research was conducted in the absence of any commercial or financial relationships that could be construed as a potential conflict of interest.
Supplementary Material
The Supplementary Material for this article can be found online at: https://www.frontiersin.org/articles/10.3389/fonc.2021.663631/full#supplementary-material
Supplementary Table | Extended patients’ characteristics.
References
1. Fanti S, Goffin K, Hadaschik BA, Herrmann K, Maurer T, MacLennan S, et al. Consensus Statements on PSMA PET/CT Response Assessment Criteria in Prostate Cancer. Eur J Nucl Med Mol Imaging (2021) 48(2):111(9):469–76. doi: 10.1007/s00259-020-04934-4
2. Hofman MS, Murphy DG, Williams SG, Nzenza T, Herschtal A, Lourenco RDA, et al. A Prospective Randomized Multicentre Study of the Impact of gallium-68 Prostate-Specific Membrane Antigen (PSMA) PET/CT Imaging for Staging High-Risk Prostate Cancer Prior to Curative-Intent Surgery or Radiotherapy (proPSMA Study): Clinical Trial Protocol. BJU Int (2018) 122(5):783–93. doi: 10.1111/bju.14374
3. de Feria Cardet RE, Hofman MS, Segard T, Yim J, Williams S, Francis RJ, et al. Is Prostate-specific Membrane Antigen Positron Emission Tomography/Computed Tomography Imaging Cost-effective in Prostate Cancer: An Analysis Informed by the proPSMA Trial. Eur Urol (2021) 79(3):413–18. doi: 10.1016/j.eururo.2020.11.043
4. Bashir U, Tree A, Mayer E, Levine D, Parker C, Dearnaley D, et al. Impact of Ga-68-PSMA PET/CT on Management in Prostate Cancer Patients With Very Early Biochemical Recurrence After Radical Prostatectomy. Eur J Nucl Med Mol Imaging (2019) 46(4):901–7. doi: 10.1007/s00259-018-4249-z
5. Hirmas N, Al-Ibraheem A, Herrmann K, Alsharif A, Muhsin H, Khader J, et al. [68 Ga] Psma PET/CT Improves Initial Staging and Management Plan of Patients With High-Risk Prostate Cancer. Mol Imaging Biol (2019) 21(3):574–81. doi: 10.1007/s11307-018-1278-8
6. Hofman MS, Lawrentschuk N, Francis RJ, Tang C, Vela I, Thomas P, et al. Prostate-Specific Membrane Antigen PET-CT in Patients With High-Risk Prostate Cancer Before Curative-Intent Surgery or Radiotherapy (proPSMA): A Prospective, Randomised, Multi-Centre Study. Lancet (2020) 395(10231):1208–16.
7. Sonni I, Eiber M, Fendler WP, Alano RM, Vangala SS, Kishan AU, et al. Impact of 68Ga-PSMA-11 PET/CT on Staging and Management of Prostate Cancer Patients in Various Clinical Settings: A Prospective Single Center Study. J Nucl Med (2020) 61(8):1153–60. doi: 10.2967/jnumed.119.237602
8. Schmidt-Hegemann N-S, Eze C, Li M, Rogowski P, Schaefer C, Stief C, et al. Impact of 68Ga-PSMA PET/CT on the Radiotherapeutic Approach to Prostate Cancer in Comparison to CT: A Retrospective Analysis. J Nucl Med (2019) 60(7):963–70. doi: 10.2967/jnumed.118.220855
9. Grubmüller B, Senn D, Kramer G, Baltzer P, D’Andrea D, Grubmüller KH, et al. Response Assessment Using 68 Ga-PSMA Ligand PET in Patients Undergoing 177 Lu-PSMA Radioligand Therapy for Metastatic Castration-Resistant Prostate Cancer. Eur J Nucl Med Mol Imaging (2019) 46(5):1063–72. doi: 10.1007/s00259-018-4236-4
10. Prasad V, Huang K, Prasad S, Makowski MR, Czech N, Brenner W. In Comparison to PSA, Interim Ga-68-PSMA Pet/Ct Response Evaluation Based on Modified Recist 1.1 After 2nd Cycle is Better Predictor of Overall Survival of Prostate Cancer Patients Treated With 177lu-Psma. Front Oncol (2021) 11:291. doi: 10.3389/fonc.2021.578093
11. Seitz AK, Rauscher I, Haller B, Krönke M, Luther S, Heck MM, et al. Preliminary Results on Response Assessment Using 68 Ga-HBED-CC-PSMA PET/CT in Patients With Metastatic Prostate Cancer Undergoing Docetaxel Chemotherapy. Eur J Nucl Med Mol Imaging (2018) 45(4):602–12. doi: 10.1007/s00259-017-3887-x
12. Seifert R, Seitzer K, Herrmann K, Kessel K, Schäfers M, Kleesiek J, et al. Analysis of PSMA Expression and Outcome in Patients With Advanced Prostate Cancer Receiving 177Lu-PSMA-617 Radioligand Therapy. Theranostics (2020) 10(17):7812. doi: 10.7150/thno.47251
13. Sonpavde G, Pond GR, Armstrong AJ, Galsky MD, Leopold L, Wood BA, et al. Radiographic Progression by Prostate Cancer Working Group (PCWG)-2 Criteria as an Intermediate Endpoint for Drug Development in Metastatic Castration-Resistant Prostate Cancer. BJU Int (2014) 114(6b):E25–31. doi: 10.1111/bju.12589
14. Cook GJ, Azad G, Padhani AR. Bone Imaging in Prostate Cancer: The Evolving Roles of Nuclear Medicine and Radiology. Clin Trans Imaging (2016) 4(6):439–47. doi: 10.1007/s40336-016-0196-5
15. Beer L, Hochmair M, Haug AR, Schwabel B, Kifjak D, Wadsak W, et al. Comparison of RECIST, iRECIST, and PERCIST for the Evaluation of Response to PD-1/PD-L1 Blockade Therapy in Patients With non–Small Cell Lung Cancer. Clin Nucl Med (2019) 44(7):535–43. doi: 10.1097/RLU.0000000000002603
16. Rossi G, Bauckneht M, Genova C, Rijavec E, Biello F, Mennella S, et al. Comparison Between 18F-FDG-PET-and CT-based Criteria in non-Small Cell Lung Cancer (NSCLC) Patients Treated With Nivolumab. J Nucl Med (2020) 61(7):990–8. doi: 10.2967/jnumed.119.233056
17. Seifert R, Herrmann K, Kleesiek J, Schafers MA, Shah V, Xu Z, et al. Semi-Automatically Quantified Tumor Volume Using Ga-68-PSMA-11-PET as Biomarker for Survival in Patients With Advanced Prostate Cancer. J Nucl Med (2020) 61(12):1786–92. doi: 10.2967/jnumed.120.242057
18. Hartrampf PE, Heinrich M, Seitz AK, Brumberg J, Sokolakis I, Kalogirou C, et al. Metabolic Tumour Volume From PSMA Pet/Ct Scans of Prostate Cancer Patients During Chemotherapy—Do Different Software Solutions Deliver Comparable Results? J Clin Med (2020) 9(5):1390. doi: 10.3390/jcm9051390
19. Seifert R, Kessel K, Schlack K, Weber M, Herrmann K, Spanke M, et al. Psma PET Total Tumor Volume Predicts Outcome of Patients With Advanced Prostate Cancer Receiving [177 Lu] Lu-PSMA-617 Radioligand Therapy in a Bicentric Analysis. Eur J Nucl Med Mol Imaging (2021) 48(4):1200–10. doi: 10.1007/s00259-020-05040-1
20. Grubmüller B, Rasul S, Baltzer P, Fajkovic H, D’Andrea D, Berndl F, et al. Response Assessment Using [68Ga] Ga-PSMA Ligand PET in Patients Undergoing Systemic Therapy for Metastatic Castration-Resistant Prostate Cancer. Prostate (2020) 80(1):74–82. doi: 10.1002/pros.23919
21. Draulans C, De Roover R, van der Heide UA, Kerkmeijer L, Smeenk RJ, Pos F, et al. Optimal 68 Ga-PSMA and 18 F-PSMA PET Window Levelling for Gross Tumour Volume Delineation in Primary Prostate Cancer. Eur J Nucl Med Mol Imaging (2021) 48(4):1211–18. doi: 10.1007/s00259-020-05059-4
22. Spohn SK, Kramer M, Kiefer S, Bronsert P, Sigle A, Schultze-Seemann W, et al. Comparison of Manual and Semi-Automatic [18f] PSMA-1007 Pet Based Contouring Techniques for Intraprostatic Tumor Delineation in Patients With Primary Prostate Cancer and Validation With Histopathology as Standard of Reference. Front Oncol (2020) 10. doi: 10.3389/fonc.2020.600690
23. Zacho HD, Nielsen JB, Haberkorn U, Stenholt L, Petersen LJ. 68Ga-PSMA PET/CT for the Detection of Bone Metastases in Prostate Cancer: A Systematic Review of the Published Literature. Clin Physiol Funct Imaging (2018) 38(6):911–22. doi: 10.1111/cpf.12480
24. Gupta M, Choudhury PS, Rawal S, Goel HC, Rao SA. Evaluation of RECIST, Percist, EORTC, and MDA Criteria for Assessing Treatment Response With Ga68-PSMA Pet-CT in Metastatic Prostate Cancer Patient With Biochemical Progression: A Comparative Study. Nucl Med Mol Imaging (2018) 52(6):420–9. doi: 10.1007/s13139-018-0548-3
25. Schwartz LH, Litière S, de Vries E, Ford R, Gwyther S, Mandrekar S, et al. Recist 1.1—Update and Clarification: From the RECIST Committee. Eur J Cancer (2016) 62:132–7. doi: 10.1016/j.ejca.2016.03.081
26. Cardinale J, Schäfer M, Benešová M, Bauder-Wüst U, Leotta K, Eder M, et al. Preclinical Evaluation of 18F-PSMA-1007, a New Prostate-Specific Membrane Antigen Ligand for Prostate Cancer Imaging. J Nucl Med (2017) 58(3):425–31. doi: 10.2967/jnumed.116.181768
27. d’Amico A, Gorczewska I, Gorczewski K, Turska-d’Amico M, Di Pietro M. Effect of Furosemide Administration Before F-18 Fluorodeoxyglucose Positron Emission Tomography/Computed Tomography on Urine Radioactivity and Detection of Uterine Cervical Cancer. Nucl Med Rev (2014) 17(2):83–6. doi: 10.5603/NMR.2014.0022
28. Eiber M, Herrmann K, Calais J, Hadaschik B, Giesel FL, Hartenbach M, et al. Prostate Cancer Molecular Imaging Standardized Evaluation (PROMISE): Proposed miTNM Classification for the Interpretation of PSMA-ligand Pet/Ct. J Nucl Med (2018) 59(3):469–78. doi: 10.2967/jnumed.117.198119
29. Bieth M, Krönke M, Tauber R, Dahlbender M, Retz M, Nekolla SG, et al. Exploring New Multimodal Quantitative Imaging Indices for the Assessment of Osseous Tumor Burden in Prostate Cancer Using 68Ga-PSMA Pet/Ct. J Nucl Med (2017) 58(10):1632–7. doi: 10.2967/jnumed.116.189050
30. Grubmüller B, Baltzer P, D’andrea D, Korn S, Haug A, Hacker M, et al. 68 Ga-PSMA 11 Ligand PET Imaging in Patients With Biochemical Recurrence After Radical Prostatectomy–Diagnostic Performance and Impact on Therapeutic Decision-Making. Eur J Nucl Med Mol Imaging (2018) 45(2):235–42. doi: 10.1007/s00259-017-3858-2
31. Grubmüller B, Baltzer P, Hartenbach S, D’Andrea D, Helbich TH, Haug AR, et al. PSMA Ligand PET/MRI for Primary Prostate Cancer: Staging Performance and Clinical Impact. Clin Cancer Res (2018) 24(24):6300–7. doi: 10.1158/1078-0432.CCR-18-0768
32. Kratochwil C, Bruchertseifer F, Rathke H, Bronzel M, Apostolidis C, Weichert W, et al. Targeted α-Therapy of Metastatic Castration-Resistant Prostate Cancer With 225Ac-PSMA-617: Dosimetry Estimate and Empiric Dose Finding. J Nucl Med (2017) 58(10):1624–31. doi: 10.2967/jnumed.117.191395
33. Rathke H, Kratochwil C, Hohenberger R, Giesel FL, Bruchertseifer F, Flechsig P, et al. Initial Clinical Experience Performing Sialendoscopy for Salivary Gland Protection in Patients Undergoing 225 Ac-PSMA-617 Rlt. Eur J Nucl Med Mol Imaging (2019) 46(1):139–47. doi: 10.1007/s00259-018-4135-8
34. Wang B, Liu C, Wei Y, Meng J, Zhang Y, Gan H, et al. A Prospective Trial of 68Ga-PSMA and 18F-FDG PET/CT in Nonmetastatic Prostate Cancer Patients With an Early PSA Progression During Castration. Clin Cancer Res (2020) 26(17):4551–8. doi: 10.1158/1078-0432.CCR-20-0587
35. Current K, Meyer C, Magyar CE, Mona CE, Almajano J, Slavik R, et al. Investigating PSMA-Targeted Radioligand Therapy Efficacy as a Function of Cellular Psma Levels and Intratumoral Psma Heterogeneity. Clin Cancer Res (2020) 26(12):2946–55. doi: 10.1158/1078-0432.CCR-19-1485
36. Giesel FL, Hadaschik B, Cardinale J, Radtke J, Vinsensia M, Lehnert W, et al. F-18 Labelled PSMA-1007: Biodistribution, Radiation Dosimetry and Histopathological Validation of Tumor Lesions in Prostate Cancer Patients. Eur J Nucl Med Mol Imaging (2017) 44(4):678–88. doi: 10.1007/s00259-016-3573-4
37. Filss CP, Albert NL, Böning G, Kops ER, Suchorska B, Stoffels G, et al. O-(2-[18F]Fluoroethyl)-L-Tyrosine PET in Gliomas: Influence of Data Processing in Different Centres. EJNMMI Res (2017) 7(1):64. doi: 10.1186/s13550-017-0316-x
38. Cysouw MC, Kramer GM, Hoekstra OS, Frings V, De Langen AJ, Smit EF, et al. Accuracy and Precision of Partial-Volume Correction in Oncological PET/CT Studies. J Nucl Med (2016) 57(10):1642–9. doi: 10.2967/jnumed.116.173831
Keywords: PSMA, PET, mCRPC, Metastatic castrate-resistant prostate cancer, prostate cancer, whole tumor volume
Citation: Mittlmeier LM, Brendel M, Beyer L, Albert NL, Todica A, Zacherl MJ, Wenter V, Herlemann A, Kretschmer A, Ledderose ST, Schmidt-Hegemann N-S, Kunz WG, Ricke J, Bartenstein P, Ilhan H and Unterrainer M (2021) Feasibility of Different Tumor Delineation Approaches for 18F-PSMA-1007 PET/CT Imaging in Prostate Cancer Patients. Front. Oncol. 11:663631. doi: 10.3389/fonc.2021.663631
Received: 03 February 2021; Accepted: 19 April 2021;
Published: 21 May 2021.
Edited by:
Luigi Aloj, University of Cambridge, United KingdomReviewed by:
Vikas Prasad, Universitätsklinikum Ulm, GermanyBastiaan Privé, Radboud University Nijmegen Medical Centre, Netherlands
Aviral Singh, Central Clinic Bad Berka, Germany
Copyright © 2021 Mittlmeier, Brendel, Beyer, Albert, Todica, Zacherl, Wenter, Herlemann, Kretschmer, Ledderose, Schmidt-Hegemann, Kunz, Ricke, Bartenstein, Ilhan and Unterrainer. This is an open-access article distributed under the terms of the Creative Commons Attribution License (CC BY). The use, distribution or reproduction in other forums is permitted, provided the original author(s) and the copyright owner(s) are credited and that the original publication in this journal is cited, in accordance with accepted academic practice. No use, distribution or reproduction is permitted which does not comply with these terms.
*Correspondence: Marcus Unterrainer, bWFyY3VzLnVudGVycmFpbmVyQG1lZC51bmktbXVlbmNoZW4uZGU=