 Jon-Vidar Gaustad
 Einar K. Rofstad
- Group of Radiation Biology and Tumor Physiology, Department of Radiation Biology, Institute for Cancer Research, Oslo University Hospital, Oslo, Norway
Tumor hypoxia is a major cause of treatment resistance and poor survival in locally-advanced cervical carcinoma (LACC). It has been suggested that Ktrans and ve maps derived by dynamic contrast-enhanced magnetic resonance imaging can provide information on the oxygen supply and oxygen consumption of tumors, but it is not clear whether and how these maps can be combined to identify tumor hypoxia. The aim of the current study was to find the optimal strategy for calculating hypoxic fraction and predicting survival from Ktrans and ve maps in cervical carcinoma. Ktrans and ve maps of 98 tumors of four patient-derived xenograft models of cervical carcinoma as well as 80 patients with LACC were investigated. Hypoxic fraction calculated by using Ktrans maps correlated strongly (P < 0.0001) to hypoxic fraction assessed with immunohistochemistry using pimonidazole as a hypoxia marker and was associated with disease-free and overall survival in LACC patients. Maps of ve did not provide information on hypoxic fraction and patient outcome, and combinations of Ktrans and ve were not superior to Ktrans alone for calculating hypoxic fraction. These observations imply that Ktrans maps reflect oxygen supply and may be used to identify hypoxia and predict outcome in cervical carcinoma, whereas ve is a poor parameter of oxygen consumption and does not provide information on tumor oxygenation status.
Introduction
The recommended treatment for locally-advanced cervical carcinoma (LACC) is cisplatin-based chemoradiation therapy (1). Unfortunately, approximately one third of the LACC patients experience local or distant relapse after the treatment, and side effects severely reduce the quality of life for disease-free patients (2). It has been suggested that personalized treatment strategies can improve outcome for LACC patients, and the personalized strategies require prognostic biomarkers of treatment outcome (3–5). Because tumor hypoxia is a major cause of treatment resistance and poor survival in LACC patients, biomarkers reflecting the hypoxic status of tumors are warranted to personalize the treatment (4, 6, 7).
Magnetic resonance imaging (MRI) techniques, including blood oxygen level dependent MRI (BOLD-MRI), tissue oxygen level dependent MRI (TOLD-MRI), oxygen-enhanced MRI (OE-MRI), and dynamic contrast-enhanced MRI (DCE-MRI), have been applied to study tumor hypoxia (8–11). DCE-MRI is highly attractive because the technique is associated with a high signal to noise ratio and is routinely used to detect and characterize various types of cancer in the clinic. Furthermore, accumulating evidence from preclinical and clinical studies suggests that DCE-MRI can provide information on hypoxia in cervical carcinoma (12–16). A variety of strategies have been used to analyze DCE-MRI data, including semi-quantitative calculations of the signal enhancement after contrast agent administration as well as quantitative approaches using pharmacokinetic models (17). Tofs and colleagues have developed a generalized pharmacokinetic model, and this model has been shown to be preferable for analyzing human DCE-MRI data (18, 19). Tofts generalized pharmacokinetic model calculates the volume transfer rate constant (Ktrans) and the fractional distribution volume of the contrast agent (ve) from contrast agent concentration versus time series (18). Pretreatment Ktrans and/or ve values have been correlated with responses to radiation or chemoradiation, as well as disease-free survival (DFS) and overall survival (OS) in cervical carcinoma (20–22). However it is not clear whether and how the pharmacokinetic parameters can be used to estimate the hypoxic fraction in tumors.
Hypoxia is a result of an imbalance between oxygen supply and oxygen consumption (23). The oxygen supply is primarily determined by the blood perfusion, whereas the oxygen consumption is governed by the respiratory activity of the tissue and hence the cell density and the respiration rate of the cells (24). In our laboratory, we have investigated associations between DCE-MRI-derived parameters and hypoxia in cell line derived xenograft (CDX) models of melanoma (25, 26). In these models, we found correlations between median Ktrans and hypoxic fraction and between median ve and hypoxic fraction (25), and we suggested that Ktrans and ve values may be combined to calculate hypoxic fraction based on the hypothesis that Ktrans reflects oxygen supply and ve reflects oxygen consumption (26). Recently, Hillestad et al. (27) used the same hypothesis and proposed a strategy for combining Ktrans and ve values to determine hypoxic fractions in LACC.
Our group has also investigated associations between DCE-MRI-derived parameters and hypoxia in cervical carcinoma (12, 22, 28). In these studies, correlations were found between median Ktrans and hypoxic fraction in patient-derived xenograft (PDX) models of cervical carcinoma (12, 28), and median Ktrans was associated with DFS and OS in LACC patients (22). However, correlations between median ve and hypoxic fraction were not found in the cervical carcinoma xenografts, and median ve was not associated with outcome in the LACC patients (12, 22, 28). Although these studies were encouraging, the relationship between median Ktrans and hypoxic fraction was exponential rather than linear, and a strategy for calculating DCE-MRI-derived hypoxic fractions was not proposed.
The purpose of the current study was to find the optimal strategy for calculating hypoxic fractions and predicting survival from Ktrans and/or ve maps in cervical carcinoma. We used the DCE-MRI data, the hypoxic fractions, and the DFS and OS data obtained in our previous studies (12, 22, 28), and we investigated different combinations of Ktrans and ve to calculate hypoxic fractions and to predict patient outcome. The strategy proposed by Hillestad et al. (27) was also investigated.
Materials and Methods
Preclinical Data Sets
Ktrans and ve maps as well as hypoxic fractions obtained in individual tumors of four PDX models of cervical carcinoma from two previous studies by Hauge et al. (12, 28) were used in the current study. Seventy-four data sets of untreated tumors (22 BK-12, 12 ED-15, 28 HL-16, and 12 LA-19 tumors) and 24 data sets of bevacizumab-treated tumors (10 BK-12 and 14 HL-16 tumors) were included. The DCE-MRI protocol, the immunohistochemical assay for detection of tumor hypoxia, and the bevacizumab treatment have been described in detail previously (12, 28). Briefly, BK-12, ED-15, HL-16, and LA-19 tumors were initiated in the left quadriceps femoris of BALB/c nu/nu mice, and were included in experiments when having grown to a volume of 100–1600 mm3. The PDX models have been shown to be positive for HPV E6 and E7 (29). DCE-MRI was conducted on a preclinical 7-T scanner (Bruker Biospin, Ettlingen, Germany) by using Gd-DOTA (Dotarem, Guerbet, Paris, France) as contrast agent. Dynamic T1-weighted images were recorded with a temporal resolution of 14.8 s and a spatial resolution of 0.23 × 0.23 × 1.0 mm3. Regions of interest (ROIs) encompassing the tumor tissue were delineated in T2-weighted anatomical images acquired prior to DCE-MRI and were transferred to the T1-weighted images as illustrated previously (30). Gd-DOTA concentrations were calculated by using T1 maps recorded before Gd-DOTA injection as detailed elsewhere (31). For each voxel, numerical values of Ktrans and ve were calculated by using the Tofts generalized pharmacokinetic model (18) and the population-based arterial input function (Ca) reported by Bejaminsen et al. (32) for BALB/c nu/nu mice.
The numerical values of the constants were calculated from blood samples collected from 12 individual mice and were as follows: A = 2.55 mM, B = 0.080 s−1, C = 1.20 mM, and D = 0.0010 s−1. Plots of Gd-DOTA concentration versus time and the corresponding model fits for individual voxels in BK-12, ED-15, HL-16, and LA-19 tumors have been reported previously and illustrate the quality of the DCE-MRI acquisition and analysis (12). The time resolution was sufficient to produce good model fits using Tofts generalized pharmacokinetic model and the population-based arterial input function, but was too low to measure individual arterial input functions in large arteries within the field of view and for using Tofts extended pharmacokinetic model which includes the contribution from intravascular contrast agent (18, 33). Tumors were resected for histological examination immediately after DCE-MRI. Pimonidazole was used as a hypoxia marker and was administered in a single dose of 30 mg/kg 4 hours before tumor excision (34). Histological sections were prepared by standard procedures, and an anti-pimonidazole rabbit polyclonal antibody was used as primary antibody. Hypoxic fractions were assessed by image analysis and were defined as the area fraction of the viable tissue showing positive pimonidazole staining. The bevacizumab (Avastin; Hoffman-La Roche, Basel, Switzerland) treatment consisted of 3 bevacizumab doses of 10 mg/kg given over a period of 8 days.
Clinical Data Sets
Ktrans and ve maps as well as DFS and OS data of 80 LACC patients (FIGO stage IB through IVA) obtained by Lund et al. (22) were used in the current study. The DCE-MRI protocol, the patient characteristics, the treatment, and the follow-up have been described in detail previously (22, 35). Briefly, the size of the human tumors ranged from 2.1 to 319 cm3. DCE-MRI was conducted on a 1.5-T scanner (Signa; General Electric, Milwaukee, WI) by using Gd-DTPA (Schering, Berlin, Germany) as contrast agent. Dynamic T1-weighted images were recorded with a temporal resolution of 29 s and a spatial resolution of 0.78 × 0.78 × 5.0 mm3. ROIs encompassing the tumor tissue were delineated by an experienced radiologist in T2-weighted anatomical images acquired prior to DCE-MRI, and were transferred to T1-weighted and proton density images as illustrated previously (22). Gd-DTPA concentrations were calculated from T1-weighted and proton density images using the method of Hittmair et al. (36) as detailed elsewhere (22, 26). Numerical values of Ktrans and ve were calculated for every voxel by using the Tofts generalized pharmacokinetic model (18) and the population-based arterial input function for humans reported by Lund et al. (22). The Lund arterial input function is similar to the arterial input function reported for mice (described above), but the numerical values of the constants differ because the uptake and clearance of small-molecular-weight contrast agents differ between mice and humans. The numerical values of the constants in the Lund arterial input function were as follows: A = 5.10 mM, B = 14.2 s−1, C = 0.99 mM, and D = 0.159 s−1 (22). Plots of Gd-DTPA concentration versus time and the corresponding model fits for individual voxels in the human tumors have been reported previously (22, 33), and illustrate that the quality of the DCE-MRI acquisition and analysis was sufficient to produce good model fits. After DCE-MRI, the patients were treated with concurrent cisplatin-based chemoradiation therapy with curative intent. The primary endpoints were DFS, defined as the time to local or distant relapse or death from the date of diagnosis, and OS, defined as the interval from diagnosis to death.
Data Analysis
We investigated four strategies for calculating DCE-MRI-derived hypoxic fractions (HFMRI). Voxels were defined as hypoxic if and were threshold values for Ktrans and ve respectively. HFMRI was calculated for a range of thresholds and was compared with the hypoxic fraction assessed by immunohistochemistry (HFPIM) in xenografted tumors and with DFS and OS in human tumors.
In xenografted tumors, HFMRI was compared with HFPIM by using an adapted version of the Pearson correlation test for similarity (37):
where xi and yi are HFMRI and HFPIM of individual tumors, are the mean values and var(x) and var(y) are the variances of HFMRI and HFPIM respectively, and N is the number of tumors. The adapted Similarity test was originally introduced to evaluate whether the expression of different genes showed a one-to-one correlation (37). The Similarity is equal to 1 if HFMRI and HFPIM are perfectly correlated with a slope of 1, and is lower than 1 if the correlation is imperfect or the slope differs from 1.
To compare HFMRI of the human tumors with DFS and OS, the patients were divided into two groups consisting of one-third and two-third of the patients. This grouping was used because standard first-line treatment fails in approximately one-third of the patients with LACC (2). The DFS and OS of the 26 patients with the highest HFMRI were compared with the DFS and OS of the 54 patients with the lowest HFMRI by using the log-rank test. The comparison was performed for every threshold value to evaluate the performance of the thresholds.
Statistical Analysis
The Pearson product moment correlation test was used to search for correlation between parameters. Curves were fitted to the data by regression analysis. Kaplan-Meier curves were compared by using the log-rank test. Probability values of P < 0.05 were considered significant.
Results
Assessment of Hypoxic Fraction in PDX Models of Cervical Carcinoma
Hypoxic fractions were calculated from the Ktrans maps alone (HFMRI-Ktrans), the ve maps alone (HFMRI-ve), or by combining the Ktrans and ve maps (HFMRI-comb). Figure 1A shows the Similarity between HFMRI-Ktrans and HFPIM for a range of values, and HFMRI-Ktrans versus HFPIM for individual tumors using the optimal . A strong one-to-one correlation was found between HFMRI-Ktrans and HFPIM when the optimal was applied (Figure 1A; R2 = 0.63, P < 0.0001), and importantly, the same optimal was used for untreated and bevacizumab-treated tumors of all the PDX models. Figure 1B shows the Similarity between HFMRI-ve and HFPIM for a range of ve0 values and HFMRI-ve versus HFPIM for individual tumors using the optimal ve0. The optimal ve0 resulted in HFMRI-ve that was lower than HFPIM for most tumors, and a correlation between HFMRI-ve and HFPIM was only found for the ED-15 tumors implying that this strategy will have limited application (Figure 1B; R2 = 0.81 and P = 0.0006 for ED-15 tumors; R2 = 0.06 and P > 0.05 for BK-12, HL-16, and LA-19 tumors).
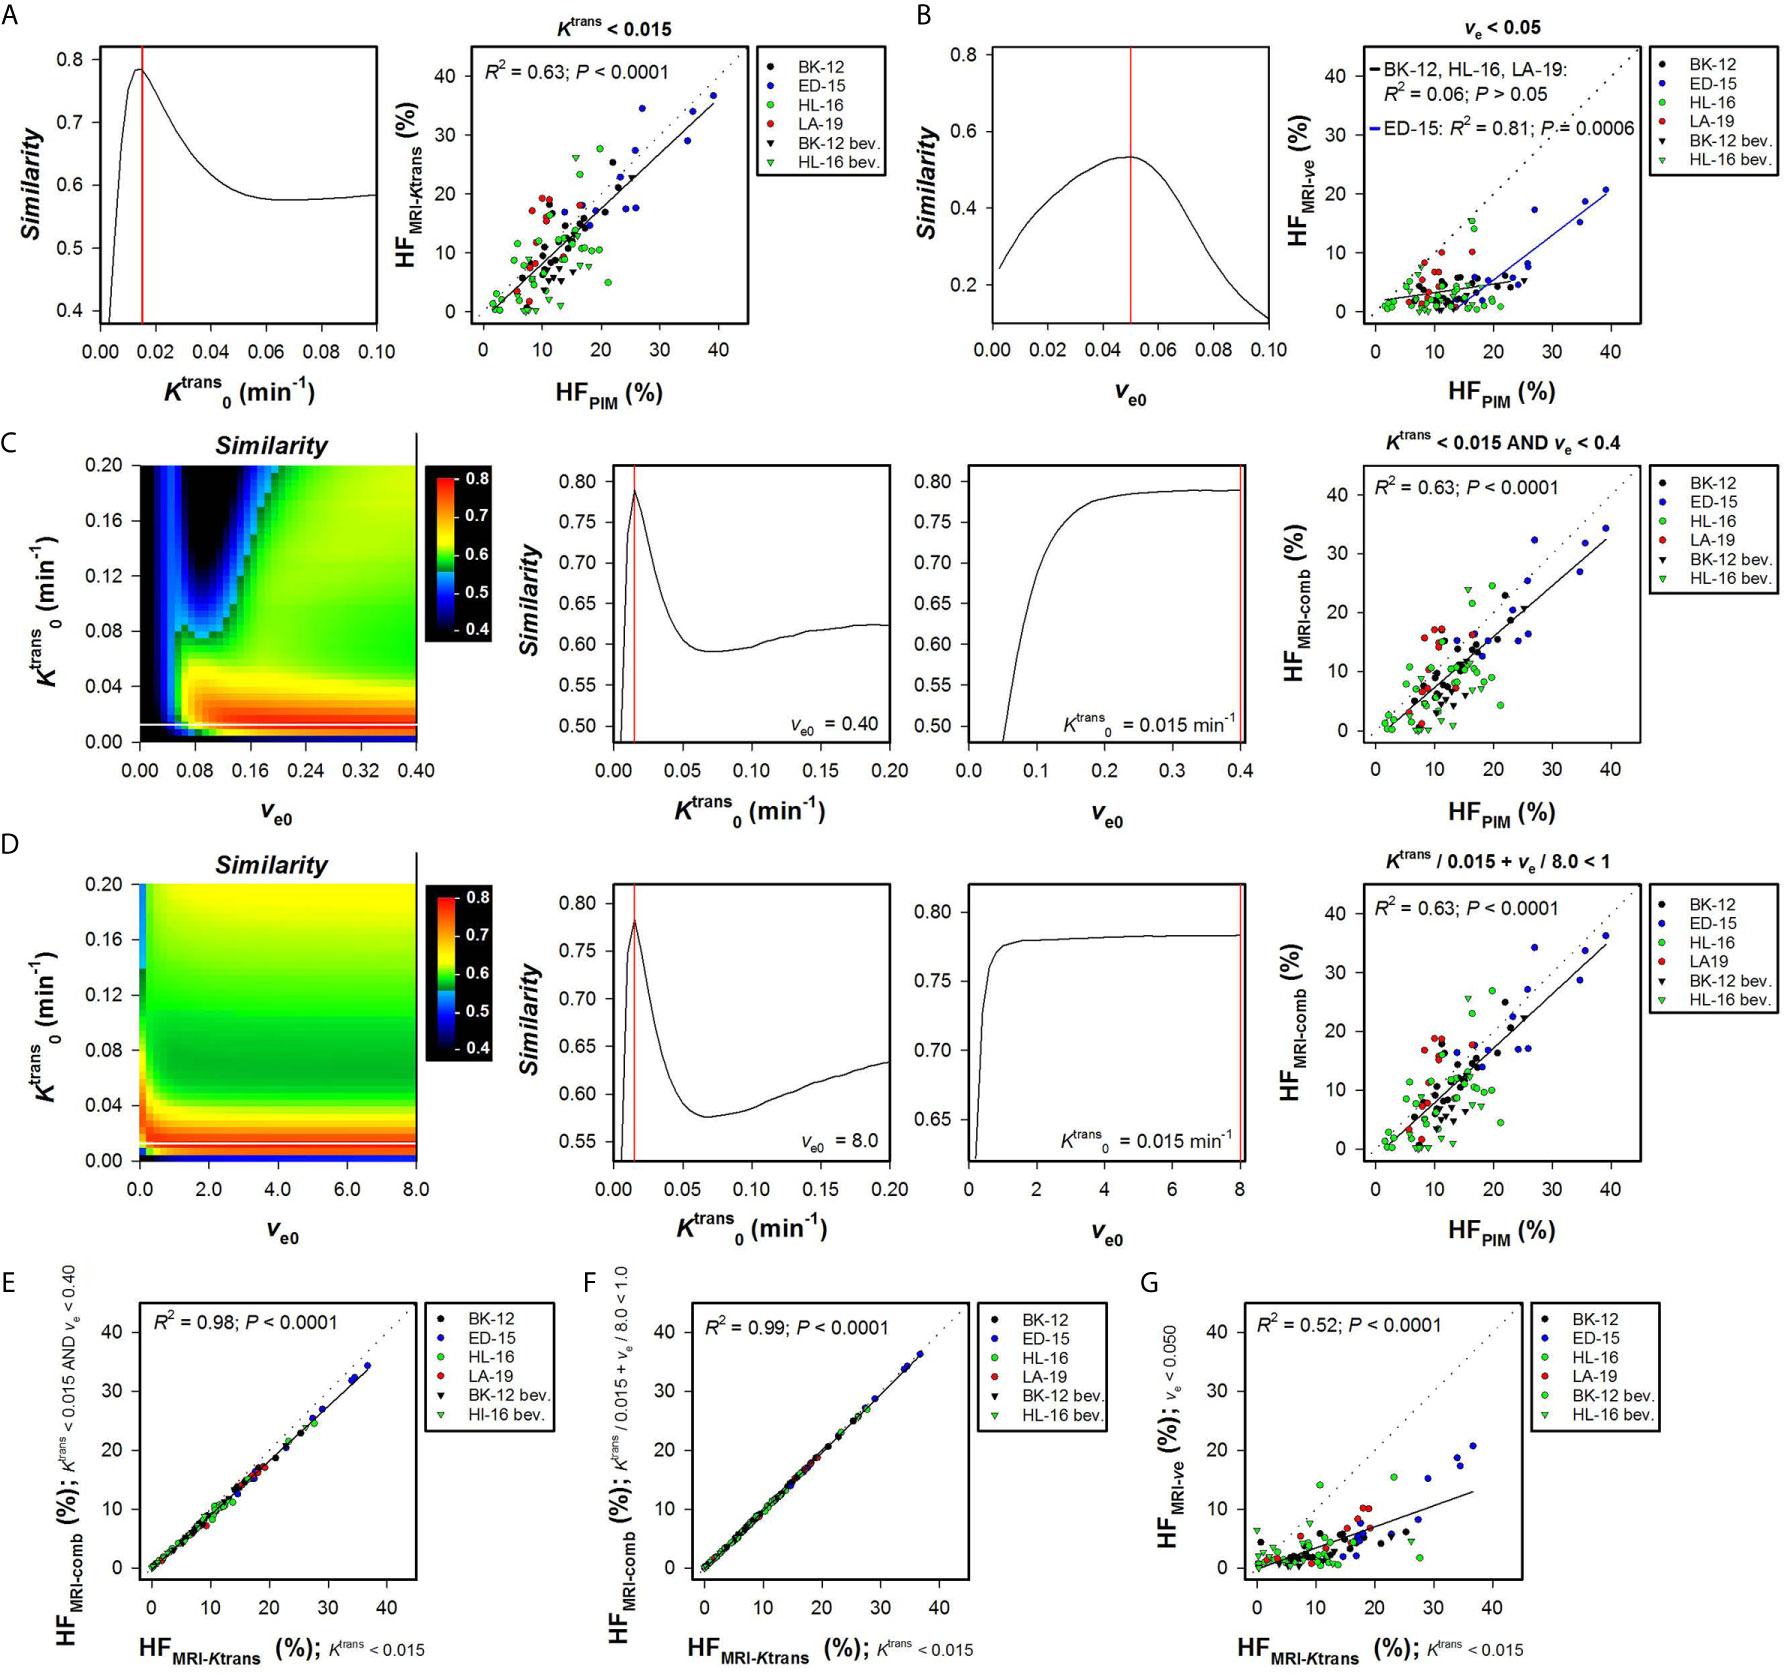
Figure 1 Hypoxic fractions were calculated from Ktrans maps alone (HFMRI-Ktrans), ve maps alone (HFMRI-ve), or by combining Ktrans and ve maps (HFMRI-comb), and were compared with hypoxic fractions assessed by immunohistochemistry using pimonidazole as a hypoxia marker (HFPIM) in untreated and bevacizumab-treated (bev) BK-12, ED-15, HL-16, and LA-19 cervical carcinoma xenografts. Voxels were defined as hypoxic if (A), ve < ve0 (B), and ve < ve0 (C), or + ve/ve0 < 1 (D), where and ve0 were threshold values for Ktrans and ve respectively. (A) The Similarity between HFMRI-Ktrans and HFPIM versus , and HFMRI-Ktrans versus HFPIM for individual tumors using the optimal . (B) The Similarity between HFMRI-ve and HFPIM versus ve0, and HFMRI-ve versus HFPIM for individual tumors using the optimal ve0. (C, D) Color-coded images of the Similarity between HFMRI-comp and HFPIM for combinations of and ve0, the Similarity between HFMRI-comp and HFPIM versus for the optimal ve0, the Similarity between HFMRI-comp and HFPIM versus ve0 for the optimal , and HFMRI-comp versus HFPIM for individual tumors using the optimal combination of and ve0. The optimal and ve0 are indicated by white and black lines respectively in the color coded Similarity images, and the Similarity scale is given by the color bar. (E–G), HFMRI-comp versus HFMRI-Ktrans (E, F), and HFMRI-ve versus HFMRI-Ktrans (G). Points represent individual tumors, solid black lines were fitted to the data by linear regression analysis, and dotted lines show the one-to-one correlation line (A–G). Solid red lines indicate the optimal and the optimal ve0 (A–D).
Two strategies were used to combine Ktrans and ve values and calculate HFMRI-comb. First, voxels were defined as hypoxic if both Ktrans < and ve < ve0, and second, voxels were defined as hypoxic if + ve/ve0 < 1 [i.e. by applying the strategy proposed by Hillestad et al. (27)]. Figures 1C, D show the Similarity between HFMRI-comb and HFPIM for various combinations of and ve0, and HFMRI-comb versus HFPIM for individual tumors by using the optimal combinations. The Similarity is displayed as color-coded Similarity images, and as graphs showing the Similarity versus for the optimal ve0 and the Similarity versus ve0 for the optimal . Strong one-to-one correlations were found between HFMRI-comb and HFPIM for the optimal combination in both strategies (Figures 1C, D; R2 = 0.63, P < 0.0001 for both strategies). The optimal combinations were = 0.015 min-1 and ve0 = 0.40 using the first strategy (Figure 1C), and = 0.015 min-1 and ve0 = 8.0 using the second strategy (Figure 1D). However, these combinations defined hypoxia essentially by considering the Ktrans value. Thus the vast majority of voxels had ve < 0.4, and ve/8.0 was very low compared to Ktrans/0.015 min-1 for most voxels. In line with this, strong correlations were found between HFMRI-comb and HFMRI-Ktrans (Figures 1E, F; R2 = 0.98 and 0.99, P < 0.0001 for both). A weaker correlation was found between HFMRI-ve and HFMRI-Ktrans (Figure 1G; R2 = 0.52, P < 0.0001), and HFMRI-Ktrans were approximately threefold higher than HFMRI-ve. HFMRI-comb was also calculated by using the and ve0 reported by Hillestad et al. (27), but this combination substantially overestimated the hypoxic fraction in the four PDX models used in the present study (Supplementary Figure S1).
The Ktrans and ve maps and histograms of a representative BK-12 cervical carcinoma xenograft are shown in Figures 2A, B. Figures 2C–F show hypoxia images produced by applying the optimal (Figure 2C), the optimal ve0 (Figure 2D), and the optimal combinations of and ve0 (Figures 2E, F), as well as plots of Ktrans versus ve for individual voxels of the representative BK-12 tumor. The voxels defined as hypoxic are shown in blue color in the images and plots, and the optimal discrimination line between hypoxic and normoxic voxels (i.e. the optimal and/or ve0) are marked with red lines in the plots. The figure illustrates that the same voxels were defined as hypoxic when hypoxia was defined by the optimal (Figure 2C) and when hypoxia was defined by the optimal combinations of and ve0 (Figures 2E, F). When hypoxia was defined by the optimal ve0, other voxels were defined as hypoxic and the number of hypoxic voxels was substantially lower (Figure 2D). Voxels with unphysiological ve values (ve > 1) are shown in white color in the hypoxia images (Figures 2C–F). We have previously demonstrated that voxels consisting of necrotic tissue show a low and constant uptake of contrast agent and have unphysiological ve values because the assumptions of the Tofts pharmacokinetic model are not fulfilled in these voxels (12, 25, 30). Interestingly, the voxels defined as hypoxic by the optimal or by the optimal combinations of and ve0 surrounded the voxels with unphysiological ve values, implying that the voxels defined as hypoxic surrounded necroses as one would expect.
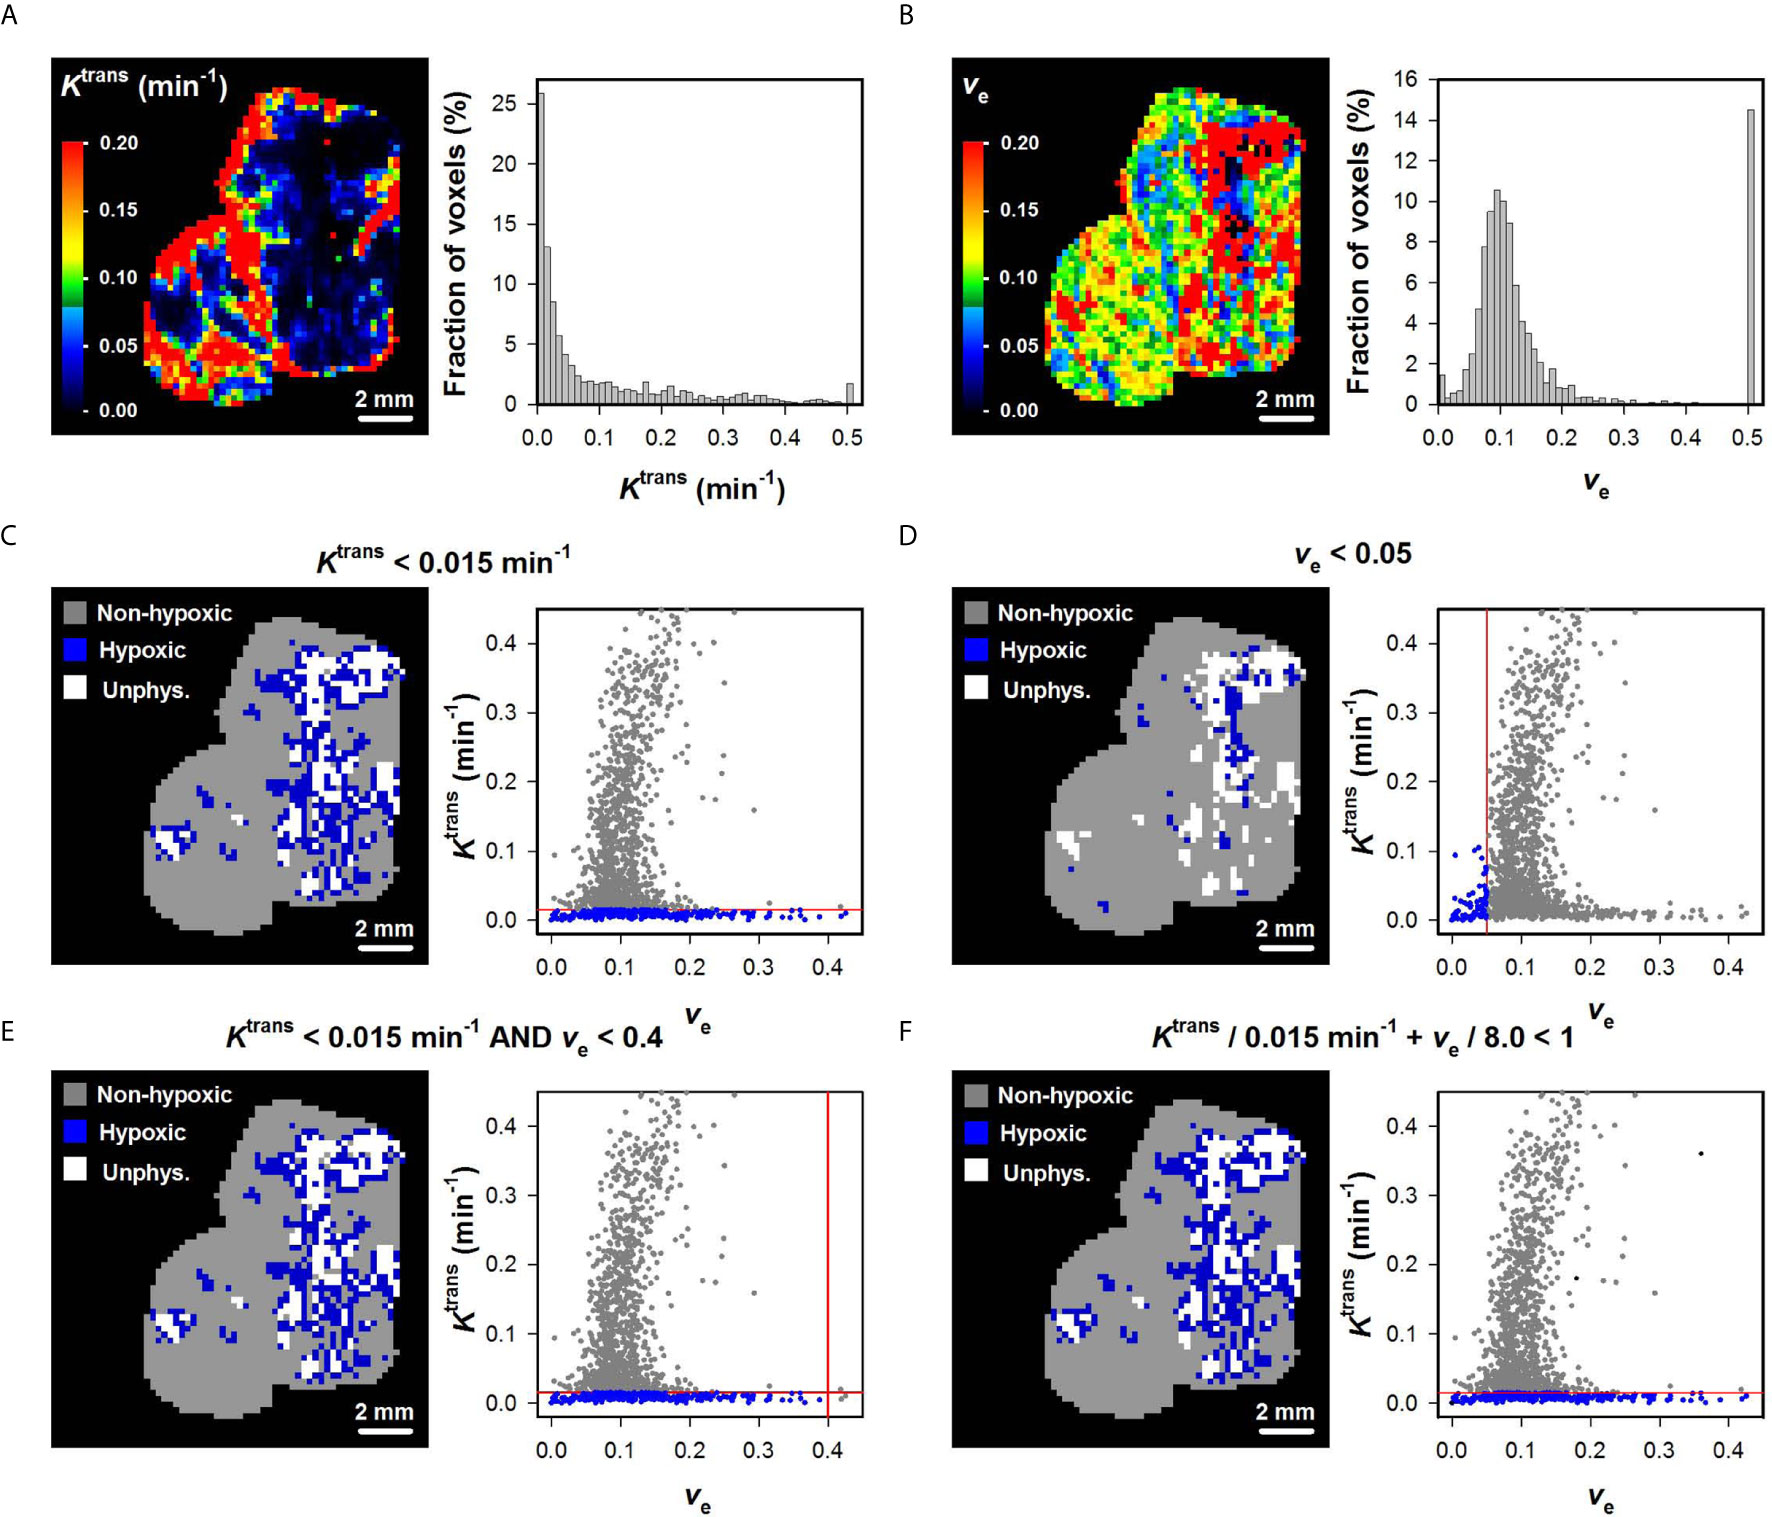
Figure 2 (A, B) Ktrans and ve maps and histograms of a representative BK-12 cervical carcinoma xenograft. The Ktrans and ve scales are given by the color bars. (C–F) DCE-MRI-derived hypoxia images and plots of Ktrans versus ve for individual voxels of the representative BK-12 tumor. Voxels were defined as hypoxic if Ktrans < 0.015 min-1 (C), ve < 0.05 (D), Ktrans < 0.015 min-1 and ve < 0.4 (E), or Ktrans/0.015 min-1 + ve/8.0 < 1 (F). Hypoxic voxels are shown in blue color, normoxic voxels are shown in gray color, and voxels with unphysiological ve values (ve > 1) are shown in white color. Solid red lines indicate the threshold values used to define hypoxic voxels.
Assessment of Hypoxic Fraction in LACC Patients
To begin with, HFMRI-Ktrans and HFMRI-ve of the LACC patients was calculated from the Ktrans or the ve maps alone. Figure 3A shows P-values obtained by the log-rank test for values ranging from 0.005 to 0.5 min-1, and illustrates that a range of values produced HFMRI-Ktrans values that were associated with outcome (P < 0.05). Examples of Kaplan-Meier plots for DFS and OS obtained by using a within this range are shown in Figure 3A, and illustrate that the patients with high HFMRI-Ktrans had lower DFS and OS than the patients with low HFMRI-Ktrans (Figure 3A; DFS: P = 0.0074, OS: P = 0.0014). However, when threshold values for ve were used to quantify HFMRI-ve, patients with high HFMRI-ve did not differ from patients with low HFMRI-ve in survival rates (Figure 3B; DFS: P > 0.05, OS: P > 0.05 for all ve0).
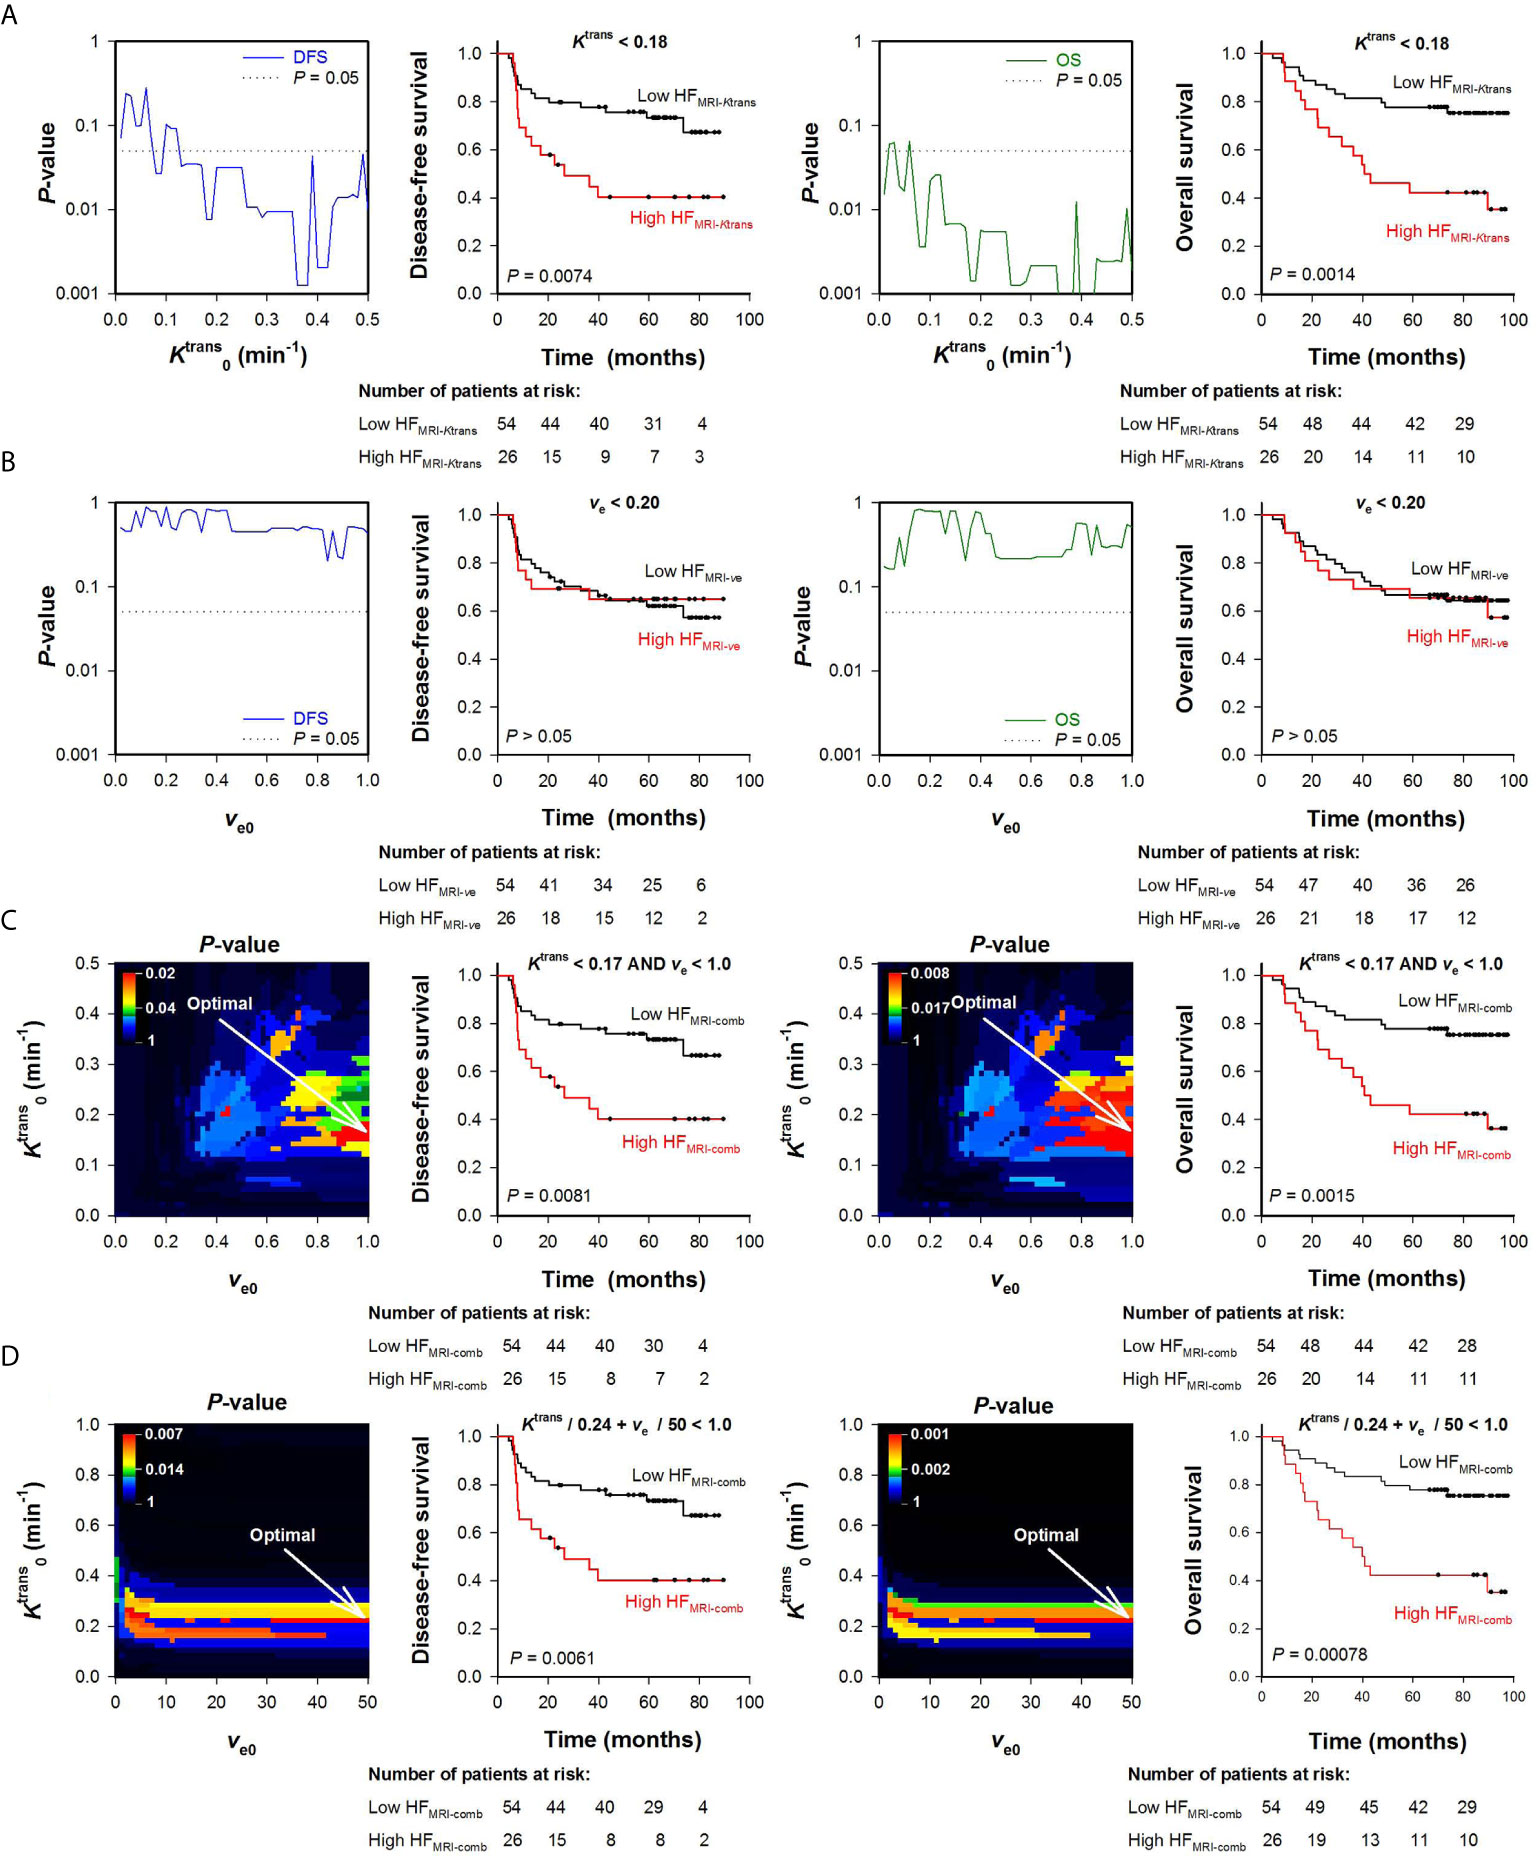
Figure 3 Hypoxic fractions were calculated from Ktrans maps alone (HFMRI-Ktrans), ve maps alone (HFMRI-ve), or by combining Ktrans and ve maps (HFMRI-comb) in locally-advanced cervical carcinoma patients. Voxels were defined as hypoxic if (A), ve < ve0 (B), and ve < ve0 (C), or + ve/ve0 < 1 (D), where and ve0 were threshold values for Ktrans and ve respectively. A range of and ve0 values was investigated, and HFMRI was calculated for every patient and for every threshold. The outcome of patients with high HFMRI was compared with the outcome of patients with low HFMRI by using the log-rank test for every threshold. (A, B) Plots of P-values obtained by the log-rank test versus (A) or ve0 (B), and examples of Kaplan-Meyer plots for patients with high and low HFMRI-Ktrans obtained by using = 0.18 min-1 (A) or patients with high and low HFMRI-ve obtained by using ve0 = 0.20 (B). The P-value plots and the Kaplan-Meyer plots refer to disease-free survival (left side) and overall survival (right side). Dotted lines in P-value plots show P = 0.05. (C, D) Color-coded P-value images obtained by the log-rank test using combinations of and ve0, and Kaplan-Meyer plots for patients with high and low HFMRI-conp obtained by using the optimal combinations of and ve0 (indicated by arrows in the P-value images). The P-value images and the Kaplan-Meyer plots refer to disease-free survival (left side) and overall survival (right side). The numbers of patients at risk refer to the time points indicated by the time-axis of the Kaplan-Meyer plots (i.e., 0, 20, 40, 60, and 80 months). The P-value scales are given by the color bars.
Ktrans and ve values were also combined to quantify HFMRI-comb in the human tumors. First, voxels were defined as hypoxic if both and ve < ve0 (Figure 3C), and second, voxels were defined as hypoxic if + ve/ve0 < 1 (i.e., by using the strategy proposed by Hillestad et al. (27); Figure 3D). Figures 3C, D show color-coded images of P-values obtained by the log-rank test for various combinations of and ve0, and Kaplan-Meier plots for DFS and OS obtained by using the optimal combinations of and ve0. The Kaplan-Meyer plots illustrate that the patients with high HFMRI-comb had lower DFS and OS than the patients with low HFMRI-comb (Figure 3C, DFS: P = 0.0081, OS: P = 0.0015; Figure 3D, DFS: P = 0.0061, OS: P = 0.0008). Interestingly, the Kaplan-Meyer plots obtained by combining Ktrans and ve (Figures 3C, D) were similar to the Kaplan-Meyer plots obtained by using Ktrans alone (Figure 3A). Moreover, the color-coded P-value images illustrate that the optimal combinations of thresholds were found when a high ve0 was chosen. This implies that the hypoxic fractions were defined essentially by considering the Ktrans value. In line with this, strong correlations were found between HFMRI-comb and HFMRI-Ktrans (Figures 4A, B; R2 = 0.98 and 0.90, P < 0.0001 for both). The horizontal and vertical lines in Figure 4 represent the border between small and large hypoxic fraction and show that the majority of the patients were stratified into the same risk group when hypoxia was defined by Ktrans alone and when hypoxia was defined by combining Ktrans and ve (Figures 4A, B). No correlation was found between HFMRI-ve and HFMRI-Ktrans (Figure 4C; R2 = 0.12, P > 0.05). Lastly HFMRI-comb was calculated by using the and ve0 reported by Hillestad et al. (27), but this HFMRI-comb was not associated with DFS and OS in the LACC patients included in the current study (Supplementary Figure S2; P > 0.05).
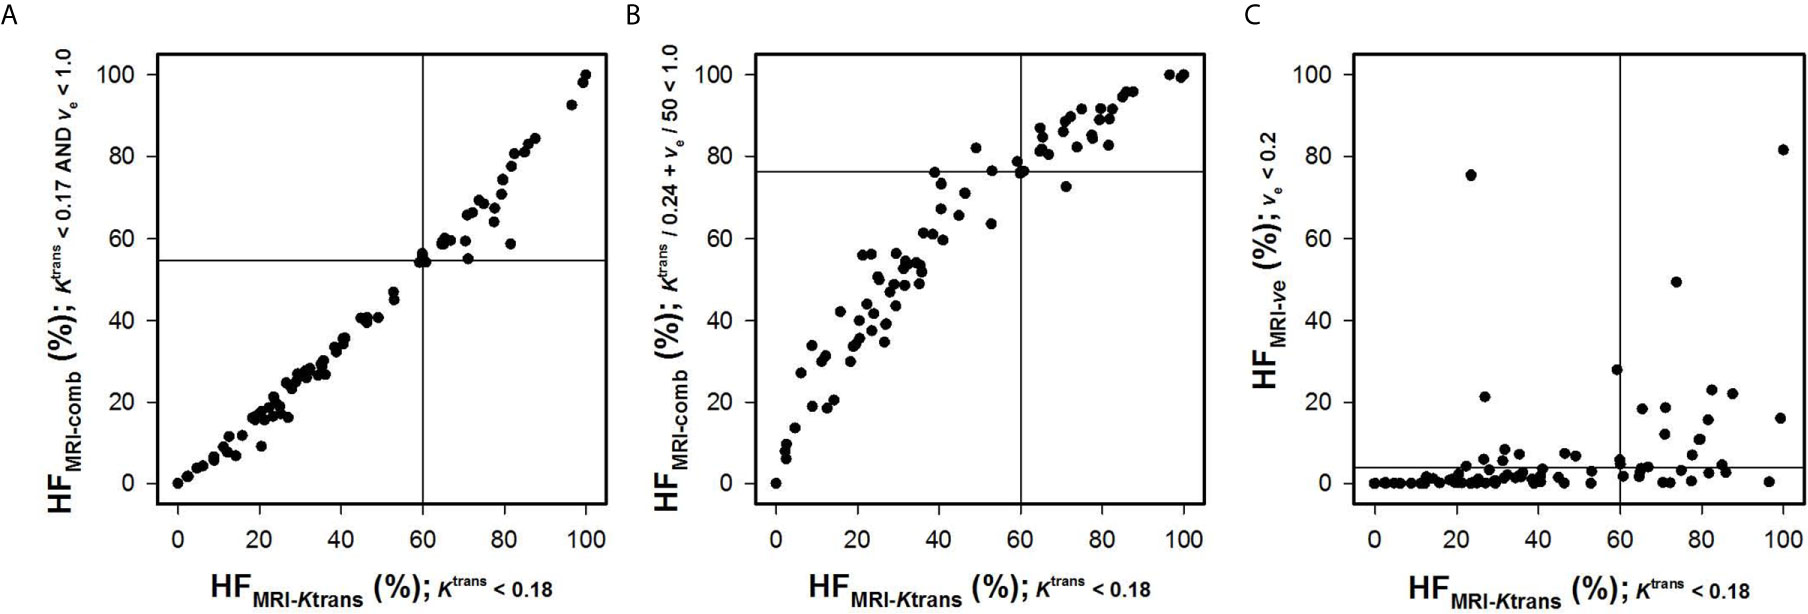
Figure 4 Hypoxic fractions were calculated from Ktrans maps alone (HFMRI-Ktrans), ve maps alone (HFMRI-ve), or by combining Ktrans and ve maps (HFMRI-comb) in locally-advanced cervical carcinoma patients. The plots show HFMRI-conp versus HFMRI-Ktrans (A, B), and HFMRI-ve versus HFMRI-Ktrans (C). The hypoxic fractions were defined by using the thresholds (i.e. and ve0) found in Figure 3. Points represent individual tumors and solid horizontal and vertical lines show the border between patients with high and low HFMRI.
Discussion
The current study demonstrated that Ktrans maps can be used to produce hypoxia images and to calculate hypoxic fractions in cervical carcinoma. Thus a strong one-to-one correlation was found between HFMRI-Ktrans and HFPIM in PDX models of cervical carcinoma, and HFMRI-Ktrans was associated with DFS and OS in LACC patients. Moreover, the same was used to calculate HFMRI-Ktrans in untreated and bevacizumab-treated tumors of all the PDX models, whereas a range of values was associated with outcome in the LACC patients. However, the optimal found in the PDX models was not associated with survival in the LACC patients. This discrepancy probably reflects the vast differences in metabolism between mice and humans, and illustrates that imaging biomarkers established in xenograft models need to be verified and customized in cancer patients (5). To identify an optimal for calculating hypoxic fraction in human LACC, novel studies that assess the hypoxic fraction by both DCE-MRI and an independent hypoxia assay are needed. Nevertheless, the associations between Ktrans derived parameters and survival rates found here may be useful also if the Ktrans derived parameters are only weakly associated with hypoxia.
According to Tofts generalized pharmacokinetic model, Ktrans is determined by the blood perfusion and the vessel permeability surface-area product (18). Preclinical studies have demonstrated that the uptake of small-molecular-weight contrast agents in tumors is limited by the blood perfusion rather than the vessel permeability (38, 39), and a recent clinical study of LACC revealed that differences in Ktrans was dominated by differences in blood perfusion and that the influence of differences in vessel permeability was negligible (40). In line with these previous studies, our findings imply that Ktrans reflected blood perfusion and oxygen supply, and that the intertumor heterogeneity in hypoxic fraction was caused by intertumor heterogeneity in blood perfusion.
Unlike Ktrans, ve did not provide information on hypoxic fraction and did not predict outcome in cervical carcinoma. Thus poor correlations were found between HFMRI-ve and HFPIM in the PDX models, and HFMRI-ve was not associated with DFS and OS in LACC patients. Moreover, combinations of Ktrans and ve were not superior to Ktrans alone for calculating hypoxic fractions, suggesting that ve did not reflect the rate of oxygen consumption in the PDX models of cervical carcinoma and the LACC tumors.
The hypothesis that ve reflects the oxygen consumption rate is based on two assumptions that may not be valid in cervical carcinoma. First, ve is assumed to reflect the cell density, and second, the cell density is assumed to govern the oxygen consumption. According to Tofts generalized pharmacokinetic model, ve is a measure of the fractional distribution volume of the contrast agent (18, 41). Small-molecular-weight contrast agents such as Gd-DTPA and Gd-DOTA are assumed to diffuse freely in the extravascular extracellular space but do not cross cell membranes and can be constrained by extracellular matrix components (18). The fractional distribution volume is thus determined by the extravascular extracellular volume fraction and the extent of extracellular matrix. If the extracellular matrix is sparse and the vascular volume is small, ve is primarily determined by the extracellular volume fraction (ECVF) and thus directly reflects the cell density (i.e. ve ≈ ECVF = 1 – cell density). However, several types of cancer, including cervical carcinoma, develop a dense collagen-rich extracellular matrix and display substantial intertumor heterogeneity in vessel density. In a cohort of tumors showing intertumor heterogeneity in the extent of extracellular matrix or vascular volume, ve cannot be expected to be a good parameter of cell density. Furthermore, the rate of oxygen consumption is influenced by both the cell density and the respiration rate of the cells (24). Solid tumors have been reported to be metabolically heterogeneous and may display both intertumor and intratumor variation in cellular respiration rates (42). Values of ve are insensitive to the cellular respiration rate, and if the cellular respiration rate varies, ve cannot be expected to reflect the rate of oxygen consumption even in tumors where ve reflects cell density. Taken together, these observations imply that it is unlikely that ve can be a good parameter of the oxygen consumption rate in a large cohort of LACC patients.
We have previously found correlations between median ve and hypoxic fraction in CDX models of melanoma (25, 26). This previous observation differs from the current finding in PDX models of cervical carcinoma, and the discrepancy probably reflects significant differences between the melanoma and cervical carcinoma models. The CDX models of melanoma showed a sparse extracellular matrix and a low vascular volume (25, 26), whereas the PDX models of cervical carcinoma develop an extensive extracellular matrix, and show substantial intertumor heterogeneity in stromal content and vessel density (29, 43). Consequently, it is likely that ve reflected the rate of oxygen consumption and the extent of hypoxic tissue in the CDX models of melanoma but not in the PDX models of cervical carcinoma and the LACC patients.
The findings reported in the current study differ markedly from those described in a recent study by Hillestad et al. (27). In the Hillestad study, both Ktrans and ve were associated with tumor hypoxia, and combinations of and ve0 were reported to identify hypoxic fractions in CDX models of cervical carcinoma and LACC patients. To find the optimal combination of and ve0 for LACC patients, Hillestad et al. (27) compared HFMRI with a hypoxia gene-signature. It should be noticed that the hypoxia gene-signature was created by the same group by comparing tumors with high and low ABrix and not by comparing tumors with high and low hypoxic fraction (44). ABrix was calculated from DCE-MRI data by using the Brix pharmacokinetic model, and this amplitude is related to both Ktrans and ve (18, 41). It is thus hard to agree with the authors’ claim that the ABrix-hypoxia-gene-signature is an independent measure of hypoxia, and one may suspect that the reported combination of and ve0 was optimized to identify low ABrix-tumors rather than hypoxic tumors. Because ABrix is related to both Ktrans and ve, it is not surprising that a combination of Ktrans and ve provided good correlation with the ABrix-hypoxia-gene-signature. Worth to mention, the combination of and ve0 reported by Hillestad et al. (27) was not associated with DFS or OS in our cohort of LACC patients, and was thus a poor measure of tumor hypoxia in our patient cohort.
The combination of and ve0 that was reported to identify hypoxia in CDX models of cervical carcinoma in the Hillestad study (27) substantially overestimated the hypoxic fractions in the PDX models used here. This discrepancy may reflect differences in tumor models, but more likely reflects differences in the immunohistochemical assays used to define HFPIM. In our study, 30 mg/kg pimonidazole was injected 4 hours before tumor excision. This assay has been optimized to minimize unspecific staining in normoxic tissue and provides a clear distinction between tissue regions with positive and negative staining (34). Hillestad et al. (27) injected 60 mg/kg pimonidazole 90 to 120 minutes before tumor excision, and reported that their assay resulted in gradients in pimonidazole staining. Gradients in pimonidazole staining make it difficult to differentiate between normoxic and hypoxic tissue, and may have introduced uncertainties in the assessment of HFPIM.
Novel treatment strategies are being investigated for LACC, and some of the strategies use hypoxia-targeting therapy in combination with chemoradiation therapy (45). These strategies may be highly effective in hypoxic tumors, but the benefit of adding hypoxia-targeting therapy is more questionable in tumors with little hypoxia. The study reported here suggests that Ktrans maps derived by DCE-MRI may be used to identify LACC patients with highly hypoxic tumors that could benefit from the additional treatment.
Studies investigating the effect of antiangiogenic drugs in combination with conventional therapy have also been initiated for LACC patients (46). However, the effect of antiangiogenic drugs on tumor oxygenation is controversial because antiangiogenic treatments have been shown to normalize tumor vasculature and improve tumor oxygenation in some preclinical studies and to induce hypoxia in others (47, 48). The reason for this discrepancy is poorly understood but may have substantial impact on combination therapies (49). In the current study, strong correlations were found between HFMRI-Ktrans and HFPIM in PDX models of cervical carcinoma, and the correlations were identical for untreated and bevacizumab-treated tumors. The current study thus suggests that Ktrans maps derived by DCE-MRI may be used to monitor the effect of bevacizumab treatment on tumor oxygenation in cervical carcinoma.
In summary, HFMRI-Ktrans calculated from Ktrans maps correlated with HFPIM in PDX models of cervical carcinoma and was associated with DFS and OS in LACC patients, whereas maps of ve did not provide significant information on hypoxic fraction and patient outcome. Furthermore, HFMRI-comb calculated by combining Ktrans and ve maps was not a better measure of hypoxia in cervical carcinoma than HFMRI-Ktrans calculated from Ktrans maps alone.
Data Availability Statement
The raw data supporting the conclusions of this article will be made available by the authors, without undue reservation.
Ethics Statement
The studies involving human participants were reviewed and approved by the regional committee of medical research ethics in southern Norway (REK sør-øst), Oslo, Norway, and was conducted in accordance with the Declaration of Helsinki. The patients/participants provided their written informed consent to participate in this study. The animal study was reviewed and approved by the Institutional Committee on Research Animal Care, Department of Comparative Medicine, Oslo University Hospital, Norway and the Norwegian Food Safety Authority (Mattilsynet), Brumunddal, Norway, and were performed in accordance with the Interdisciplinary Principles and Guidelines for the Use of Animals in Research, Marketing, and Education (New York Academy of Sciences, New York, NY, USA) and the EU Directive 2010/63/EU for animal experiments.
Author Contributions
J-VG and ER conceived and designed the study, analyzed, and interpreted the data. J-VG wrote the manuscript. All authors contributed to the article and approved the submitted version.
Funding
Financial support was received from the Norwegian Cancer Society and the South-Eastern Norway Regional Health Authority.
Conflict of Interest
The authors declare that the research was conducted in the absence of any commercial or financial relationships that could be construed as a potential conflict of interest.
Supplementary Material
The Supplementary Material for this article can be found online at: https://www.frontiersin.org/articles/10.3389/fonc.2021.668916/full#supplementary-material
References
1. Eifel PJ. Concurrent Chemotherapy and Radiation Therapy as the Standard of Care for Cervical Cancer. Nat Clin Pract Oncol (2006) 3(5):248–55. doi: 10.1038/ncponc0486
2. Green JA, Kirwan JM, Tierney JF, Symonds P, Fresco L, Collingwood M, et al. Survival and Recurrence After Concomitant Chemotherapy and Radiotherapy for Cancer of the Uterine Cervix: A Systematic Review and Meta-Analysis. Lancet (2001) 358(9284):781–6. doi: 10.1016/S0140-6736(01)05965-7
3. Barwick TD, Taylor A, Rockall A. Functional Imaging to Predict Tumor Response in Locally Advanced Cervical Cancer. Curr Oncol Rep (2013) 15(6):549–58. doi: 10.1007/s11912-013-0344-2
4. Horsman MR, Mortensen LS, Petersen JB, Busk M, Overgaard J. Imaging Hypoxia to Improve Radiotherapy Outcome. Nat Rev Clin Oncol (2012) 9(12):674–87. doi: 10.1038/nrclinonc.2012.171
5. O’Connor JP, Aboagye EO, Adams JE, Aerts HJ, Barrington SF, Beer AJ, et al. Imaging Biomarker Roadmap for Cancer Studies. Nat Rev Clin Oncol (2017) 14(3):169–86. doi: 10.1038/nrclinonc.2016.162
6. Hockel M, Schlenger K, Aral B, Mitze M, Schaffer U, Vaupel P. Association Between Tumor Hypoxia and Malignant Progression in Advanced Cancer of the Uterine Cervix. Cancer Res (1996) 56(19):4509–15.
7. Sundfor K, Lyng H, Trope CG, Rofstad EK. Treatment Outcome in Advanced Squamous Cell Carcinoma of the Uterine Cervix: Relationships to Pretreatment Tumor Oxygenation and Vascularization. Radiother Oncol (2000) 54(2):101–7. doi: 10.1016/S0167-8140(99)00175-9
8. Rickard AG, Palmer GM, Dewhirst MW. Clinical and Pre-clinical Methods for Quantifying Tumor Hypoxia. Adv Exp Med Biol (2019) 1136:19–41. doi: 10.1007/978-3-030-12734-3_2
9. Hallac RR, Zhou H, Pidikiti R, Song K, Stojadinovic S, Zhao D, et al. Correlations of Noninvasive BOLD and TOLD MRI With pO2 and Relevance to Tumor Radiation Response. Magn Reson Med (2014) 71(5):1863–73. doi: 10.1002/mrm.24846
10. O’Connor JPB, Robinson SP, Waterton JC. Imaging Tumour Hypoxia With Oxygen-Enhanced MRI and BOLD Mri. Br J Radiol (1095) 2019:9220180642. doi: 10.1259/bjr.20180642
11. Hallac RR, Zhou H, Pidikiti R, Song K, Solberg T, Kodibagkar VD, et al. A Role for Dynamic Contrast-Enhanced Magnetic Resonance Imaging in Predicting Tumour Radiation Response. Br J Cancer (2016) 114(11):1206–11. doi: 10.1038/bjc.2016.110
12. Hauge A, Wegner CS, Gaustad JV, Simonsen TG, Andersen LMK, Rofstad EK. Dce-MRI of Patient-Derived Xenograft Models of Uterine Cervix Carcinoma: Associations With Parameters of the Tumor Microenvironment. J Transl Med (2017) 15(1):225. doi: 10.1186/s12967-017-1331-4
13. Ellingsen C, Hompland T, Galappathi K, Mathiesen B, Rofstad EK. Dce-MRI of the Hypoxic Fraction, Radioresponsiveness, and Metastatic Propensity of Cervical Carcinoma Xenografts. Radiother Oncol (2014) 110(2):335–41. doi: 10.1016/j.radonc.2013.10.018
14. Zahra MA, Hollingsworth KG, Sala E, Lomas DJ, Tan LT. Dynamic Contrast-Enhanced MRI as a Predictor of Tumour Response to Radiotherapy. Lancet Oncol (2007) 8(1):63–74. doi: 10.1016/S1470-2045(06)71012-9
15. Loncaster JA, Carrington BM, Sykes JR, Jones AP, Todd SM, Cooper R, et al. Prediction of Radiotherapy Outcome Using Dynamic Contrast Enhanced MRI of Carcinoma of the Cervix. Int J Radiat Oncol Biol Phys (2002) 54(3):759–67. doi: 10.1016/S0360-3016(02)02972-3
16. Cooper RA, Carrington BM, Loncasters JA, Todd SM, Davidson SE, Logue JP, et al. Tumour Oxygenation Levels Correlate With Dynamic Contrast-Enhanced Magnetic Resonance Imaging Parameters in Carcinoma of the Cervix. Radiother Oncol (2000) 57(1):53–9. doi: 10.1016/S0167-8140(00)00259-0
17. Yankeelov TE, Gore JC. Dynamic Contrast Enhanced Magnetic Resonance Imaging in Oncology: Theory, Data Acquisition, Analysis, and Examples. Curr Med Imaging Rev (2009) 3(2):91–107. doi: 10.2174/157340507780619179
18. Tofts PS, Brix G, Buckley DL, Evelhoch JL, Henderson E, Knopp MV, et al. Estimating Kinetic Parameters From Dynamic Contrast-Enhanced T(1)-weighted MRI of a Diffusable Tracer: Standardized Quantities and Symbols. J Magn Reson Imaging (1999) 10(3):223–32. doi: 10.1002/(SICI)1522-2586(199909)10:3<223::AID-JMRI2>3.0.CO;2-S
19. Litjens GJS, Heisen M, Buurman J, Romeny BMT. Pharmacokinetic Models in Clinical Practice: What Model to Use for Dce-Mri of the Breast? In: IEEE International Symposium on Biomedical Imaging: From Nano to Macro. (2010). p. 185–8. doi: 10.1109/ISBI.2010.5490382
20. Zahra MA, Tan LT, Priest AN, Graves MJ, Arends M, Crawford RA, et al. Semiquantitative and Quantitative Dynamic Contrast-Enhanced Magnetic Resonance Imaging Measurements Predict Radiation Response in Cervix Cancer. Int J Radiat Oncol Biol Phys (2009) 74(3):766–73. doi: 10.1016/j.ijrobp.2008.08.023
21. Semple SI, Harry VN, Parkin DE, Gilbert FJ. A Combined Pharmacokinetic and Radiologic Assessment of Dynamic Contrast-Enhanced Magnetic Resonance Imaging Predicts Response to Chemoradiation in Locally Advanced Cervical Cancer. Int J Radiat Oncol Biol Phys (2009) 75(2):611–7. doi: 10.1016/j.ijrobp.2009.04.069
22. Lund KV, Simonsen TG, Kristensen GB, Rofstad EK. Dce-MRI of Locally-Advanced Carcinoma of the Uterine Cervix: Tofts Analysis Versus non-Model-Based Analyses. Radiat Oncol (2020) 15(1):79. doi: 10.1186/s13014-020-01526-2
23. Gulledge CJ, Dewhirst MW. Tumor Oxygenation: A Matter of Supply and Demand. Anticancer Res (1996) 16(2):741–9.
24. Brown JM, Giaccia AJ. The Unique Physiology of Solid Tumors: Opportunities (and Problems) for Cancer Therapy. Cancer Res (1998) 58(7):1408–16.
25. Egeland TA, Gulliksrud K, Gaustad JV, Mathiesen B, Rofstad EK. Dynamic Contrast-Enhanced-MRI of Tumor Hypoxia. Magn Reson Med (2012) 67(2):519–30. doi: 10.1002/mrm.23014
26. Vestvik IK, Egeland TA, Gaustad JV, Mathiesen B, Rofstad EK. Assessment of Microvascular Density, Extracellular Volume Fraction, and Radiobiological Hypoxia in Human Melanoma Xenografts by Dynamic Contrast-Enhanced MRI. J Magn Reson Imaging (2007) 26(4):1033–42. doi: 10.1002/jmri.21110
27. Hillestad T, Hompland T, Fjeldbo CS, Skingen VE, Salberg UB, Aarnes EK, et al. Mri Distinguishes Tumor Hypoxia Levels of Different Prognostic and Biological Significance in Cervical Cancer. Cancer Res (2020) 80(18):3993–4003. doi: 10.1158/0008-5472.CAN-20-0950
28. Hauge A, Gaustad JV, Huang R, Simonsen TG, Wegner CS, Andersen LMK, et al. Dce-MRI and Quantitative Histology Reveal Enhanced Vessel Maturation But Impaired Perfusion and Increased Hypoxia in Bevacizumab-Treated Cervical Carcinoma. Int J Radiat Oncol Biol Phys (2019) 104(3):666–76. doi: 10.1016/j.ijrobp.2019.03.002
29. Rofstad EK, Simonsen TG, Huang R, Andersen LM, Galappathi K, Ellingsen C, et al. Patient-Derived Xenograft Models of Squamous Cell Carcinoma of the Uterine Cervix. Cancer Lett (2016) 373(2):147–55. doi: 10.1016/j.canlet.2016.01.047
30. Wegner CS, Gaustad JV, Andersen LMK, Simonsen TG, Rofstad EK. Diffusion-Weighted and Dynamic Contrast-Enhanced MRI of Pancreatic Adenocarcinoma Xenografts: Associations With Tumor Differentiation and Collagen Content. J Transl Med (2016) 14(1):161. doi: 10.1186/s12967-016-0920-y
31. Gaustad JV, Simonsen TG, Smistad R, Wegner CS, Andersen LM, Rofstad EK. Early Effects of Low Dose Bevacizumab Treatment Assessed by Magnetic Resonance Imaging. BMC Cancer (2015) 15:900. doi: 10.1186/s12885-015-1918-1
32. Benjaminsen IC, Graff BA, Brurberg KG, Rofstad EK. Assessment of Tumor Blood Perfusion by High-Resolution Dynamic Contrast-Enhanced MRI: A Preclinical Study of Human Melanoma Xenografts. Magn Reson Med (2004) 52(2):269–76. doi: 10.1002/mrm.20149
33. Gaustad JV, Hauge A, Wegner CS, Simonsen TG, Lund KV, Hansem LMK, et al. DCE-MRI of Tumor Hypoxia and Hypoxia-Associated Aggressiveness. Cancers (Basel) (2020) 12(7):1979. doi: 10.3390/cancers12071979
34. Rofstad EK, Måseide K. Radiobiological and Immunohistochemical Assessment of Hypoxia in Human Melanoma Xenografts: Acute and Chronic Hypoxia in Individual Tumours. Int J Radiat Biol (1999) 75(11):1377–93. doi: 10.1080/095530099139250
35. Lund KV, Simonsen TG, Hompland T, Kristensen GB, Rofstad EK. Short-Term Pretreatment DCE-MRI in Prediction of Outcome in Locally Advanced Cervical Cancer. Radiother Oncol (2015) 115(3):379–85. doi: 10.1016/j.radonc.2015.05.001
36. Hittmair K, Gomiscek G, Langenberger K, Recht M, Imhof H, Kramer J. Method for the Quantitative Assessment of Contrast Agent Uptake in Dynamic Contrast-Enhanced MRI. Magn Reson Med (1994) 31(5):567–71. doi: 10.1002/mrm.1910310516
37. Danaher P, Warren S, Dennis L, D’Amico L, White A, Disis ML, et al. Gene Expression Markers of Tumor Infiltrating Leukocytes. J Immunother Cancer (2017) 5:18. doi: 10.1186/s40425-017-0215-8
38. Graff BA, Benjaminsen IC, Brurberg KG, Ruud EB, Rofstad EK. Comparison of Tumor Blood Perfusion Assessed by Dynamic Contrast-Enhanced MRI With Tumor Blood Supply Assessed by Invasive Imaging. J Magn Reson Imaging (2005) 21(3):272–81. doi: 10.1002/jmri.20265
39. Egeland TA, Simonsen TG, Gaustad JV, Gulliksrud K, Ellingsen C, Rofstad EK. Dynamic Contrast-Enhanced Magnetic Resonance Imaging of Tumors: Preclinical Validation of Parametric Images. Radiat Res (2009) 172(3):339–47. doi: 10.1667/RR1787.1
40. Dickie BR, Rose CJ, Kershaw LE, Withey SB, Carrington BM, Davidson SE, et al. The Prognostic Value of Dynamic Contrast-Enhanced MRI Contrast Agent Transfer Constant K(trans) in Cervical Cancer is Explained by Plasma Flow Rather Than Vessel Permeability. Br J Cancer (2017) 116(11):1436–43. doi: 10.1038/bjc.2017.121
41. Tofts PS. Modeling Tracer Kinetics in Dynamic Gd-DTPA MR Imaging. J Magn Reson Imaging (1997) 7(1):91–101. doi: 10.1002/jmri.1880070113
42. Viale A, Corti D, Draetta GF. Tumors and Mitochondrial Respiration: A Neglected Connection. Cancer Res (2015) 75(18):3685–6. doi: 10.1158/0008-5472.CAN-15-0491
43. Wegner CS, Hauge A, Andersen LMK, Huang R, Simonsen TG, Gaustad JV, et al. Increasing Aggressiveness of Patient-Derived Xenograft Models of Cervix Carcinoma During Serial Transplantation. Oncotarget (2018) 9(30):21036–51. doi: 10.18632/oncotarget.24783
44. Halle C, Andersen E, Lando M, Aarnes EK, Hasvold G, Holden M, et al. Hypoxia-Induced Gene Expression in Chemoradioresistant Cervical Cancer Revealed by Dynamic Contrast-Enhanced MRI. Cancer Res (2012) 72(20):5285–95. doi: 10.1158/0008-5472.CAN-12-1085
45. Rey S, Schito L, Koritzinsky M, Wouters BG. Molecular Targeting of Hypoxia in Radiotherapy. Adv Drug Delivery Rev (2017) 109:45–62. doi: 10.1016/j.addr.2016.10.002
46. Alldredge JK, Tewari KS. Clinical Trials of Antiangiogenesis Therapy in Recurrent/Persistent and Metastatic Cervical Cancer. Oncologist (2016) 21(5):576–85. doi: 10.1634/theoncologist.2015-0393
47. Winkler F, Kozin SV, Tong RT, Chae SS, Booth MF, Garkavtsev I, et al. Kinetics of Vascular Normalization by VEGFR2 Blockade Governs Brain Tumor Response to Radiation: Role of Oxygenation, angiopoietin-1, and Matrix Metalloproteinases. Cancer Cell (2004) 6(6):553–63. doi: 10.1016/S1535-6108(04)00305-8
48. Franco M, Man S, Chen L, Emmenegger U, Shaked Y, Cheung AM, et al. Targeted Anti-Vascular Endothelial Growth Factor Receptor-2 Therapy Leads to Short-Term and Long-Term Impairment of Vascular Function and Increase in Tumor Hypoxia. Cancer Res (2006) 66(7):3639–48. doi: 10.1158/0008-5472.CAN-05-3295
Keywords: cervical carcinoma, patient-derived xenografts, tumor hypoxia, oxygen supply, DCE-MRI
Citation: Gaustad J-V and Rofstad EK (2021) Assessment of Hypoxic Tissue Fraction and Prediction of Survival in Cervical Carcinoma by Dynamic Contrast-Enhanced MRI. Front. Oncol. 11:668916. doi: 10.3389/fonc.2021.668916
Received: 17 February 2021; Accepted: 26 April 2021;
Published: 20 May 2021.
Edited by:
Ellen Ackerstaff, Memorial Sloan Kettering Cancer Center, United StatesReviewed by:
Ralph Peter Mason, University of Texas Southwestern Medical Center, United StatesRadka Stoyanova, University of Miami, United States
Amita Shukla-Dave, Memorial Sloan Kettering Cancer Center, United States
Copyright © 2021 Gaustad and Rofstad. This is an open-access article distributed under the terms of the Creative Commons Attribution License (CC BY). The use, distribution or reproduction in other forums is permitted, provided the original author(s) and the copyright owner(s) are credited and that the original publication in this journal is cited, in accordance with accepted academic practice. No use, distribution or reproduction is permitted which does not comply with these terms.
*Correspondence: Jon-Vidar Gaustad, am9uLnZpZGFyLmdhdXN0YWRAcnItcmVzZWFyY2gubm8=