 Yan Qiu
 Min Pan
- Department of Gynecology, Maoming People’s Hospital, Maoming, China
Objective: The aim of the present study was to construct and test a liquid-liquid phase separation (LLPS)-related gene signature as a prognostic tool for epithelial ovarian cancer (EOC).
Materials and Methods: The data set GSE26712 was used to screen the differentially expressed LLPS-related genes. Functional enrichment analysis was performed to reveal the potential biological functions. GSE17260 and GSE32062 were combined as the discovery to construct an LLPS-related gene signature through a three-step analysis (univariate Cox, least absolute shrinkage and selection operator, and multivariate Cox analyses). The EOC data set from The Cancer Genome Atlas as the test set was used to test the LLPS-related gene signature.
Results: The differentially expressed LLPS-related genes involved in several cancer-related pathways, such as MAPK signaling pathway, cell cycle, and DNA replication. Eleven genes were selected to construct the LLPS-related gene signature risk index as prognostic biomarker for EOC. The risk index could successfully divide patients with EOC into high- and low-risk groups. The patients in high-risk group had significantly shorter overall survival than those with in low-risk group. The LLPS-related gene signature was validated in the test set and may be an independent prognostic factor compared to routine clinical features.
Conclusion: We constructed and validated an LLPS-related gene signature as a prognosis tool in EOC through integrated analysis of multiple data sets.
Introduction
Although rapid progress was made in recent decades in identifying the genetic causes of cancers, our mechanistic understanding of these diseases remains incomplete and limits our ability to provide effective treatments. Novel concepts may be required to reveal the complex mechanisms underlying these diseases. Evidence is mounting that liquid-liquid phase separation (LLPS) (1) underlies the formation of various subcellular structures, such as membraneless bodies, heterochromatin (2), and the transport channel in the nuclear pore complex (3). LLPS has emerged as a new concept to elaborate the organization of living cells (4). Hundreds of genes (5) were considered involved in the dynamic process of LLPS in the form of protein or RNA molecules (6). The emerging evidence indicated that aberrant forms of LLPS are associated with many human diseases, including cancer (7). For instance, the FET protein family is involved in phase transitions at sites of RNA storage (8, 9) and assembles into higher-order structures by a process that is stimulated by RNA (10, 11). Notably, these functions are often impaired in human diseases, such as cancer and neurodegenerative diseases (12, 13).
Epithelial ovarian cancer (EOC) is the most lethal gynecological cancer with 46% survival five years after the diagnosis (14). A risk score system help in identifying the patients at high risk and decision-making for treatment. Thus, we hypothesized that the LLPS-related genes way be potential prognostic signature in EOC. To test our hypothesis, an LLPS-related gene signature was constructed in a discovery data set and tested in another independent data set.
Materials and Methods
Data Processing
The LLPS-related genes were obtained from PhaSepDB (http://db.phasep.pro/) (5). Three epithelial ovarian cancer (EOC)-related processed gene expression data sets were downloaded from Gene Expression Omnibus (GEO, https://www.ncbi.nlm.nih.gov/geo/) using the “GEOquery” package (15). The data set GSE26712 (16) based on the GPL96 platform contains the gene expression profiles of 185 EOC and 10 normal ovarian surface epithelium and was used to screen the differentially expressed genes (DEGs) in EOC compared to normal ovarian surface epithelium. The data set GSE17260 (17) based on the GPL6480 platform contains the gene expression profiles of 110 EOC samples and prognosis information of the corresponding patients. The gene expression profiles of 260 EOC samples based on GPL6480 from GSE32062 (18) were also downloaded from GEO. The GSE17260 and GSE32062 were combined as the discovery set, and then the batch effects were removed using the ComBat function in the “sva” package (19). Principal component analysis was performed to visualize the results of removing batch effects. The discovery set was used to generate an LLPS-related gene signature in EOC. Another EOC-related data set (20), including gene expression profiles based on Affymetrix Human Genome U133 Plus 2.0 Array platform (Affymetrix; Thermo Fisher Scientific Inc., Waltham, MA, USA) and the clinical data The Cancer Genome Atlas (TCGA, https://portal.gdc.cancer.gov/) was downloaded from UCSC Xena (http://xena.ucsc.edu/) and used as the test set to validate the LLPS-related gene signature. In the above data sets, if one gene matched multiple probes, the average value of the probes was calculated as the expression of the corresponding gene. The workflow of the present was showed in Figure 1.
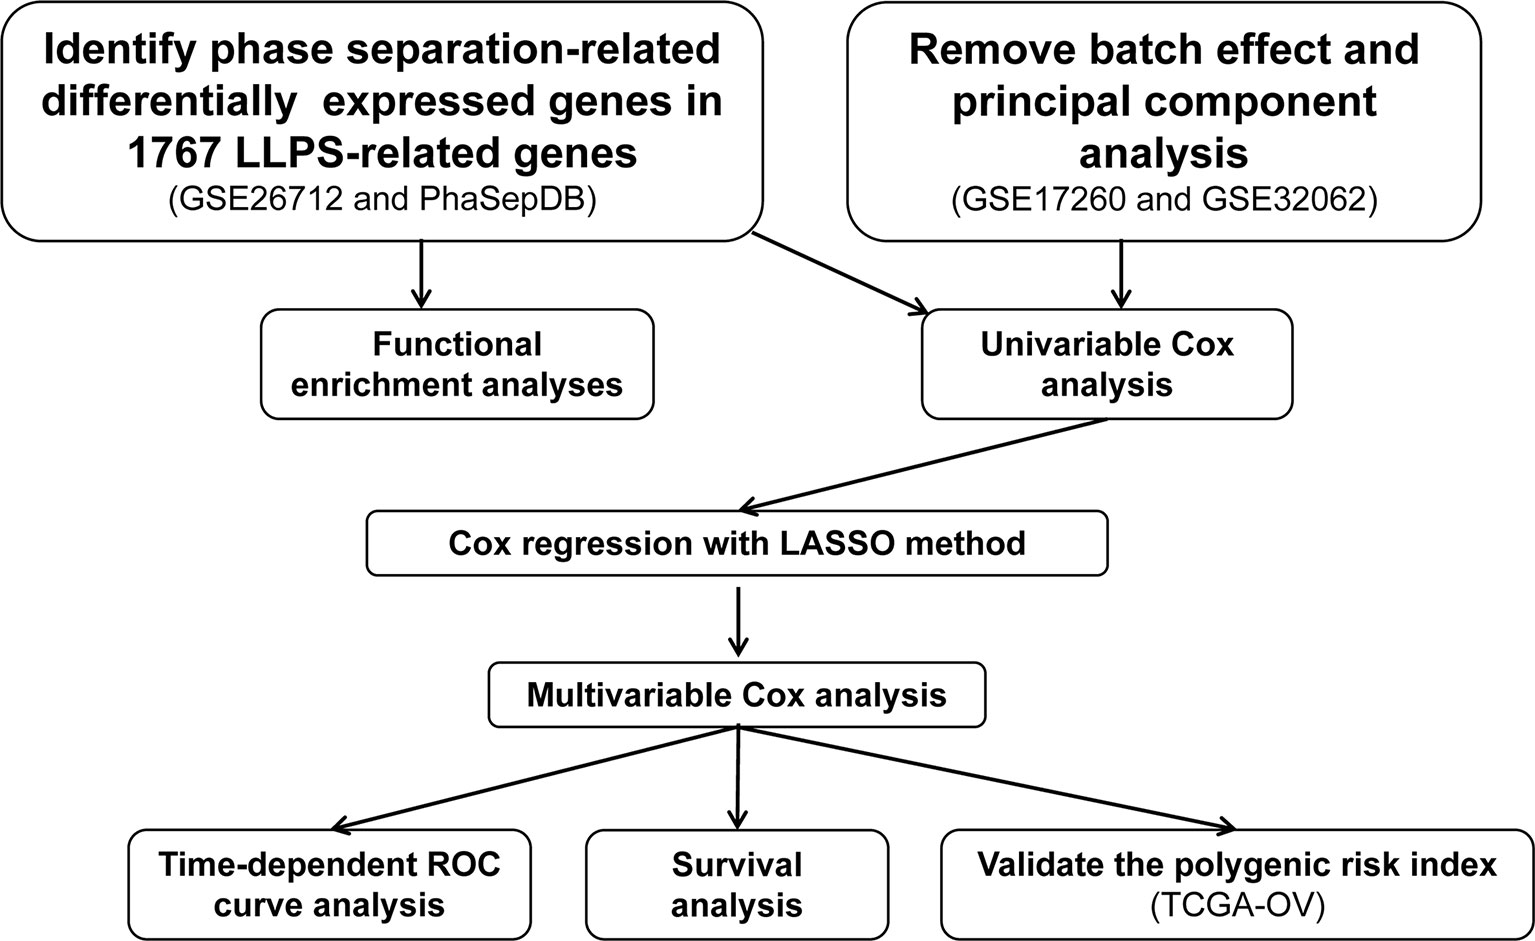
Figure 1 The workflow of the present study.
Screen the Differentially Expressed Genes in EOC
The expression profiles of the LLPS genes were extracted from GSE26712. The DEGs between EOC and normal ovarian surface epithelium were screened using the “limma” package (21) in R. The fold changes (FCs) of individual genes were calculated, and DEGs with FCs > 1.5 and P (adjusted by false discovery rate) value < 0.05 were considered significant.
Functional Enrichment Analysis
Functional enrichment analysis was performed to reveal the potential biological functions of the DEGs using clusterProfiler (22) package, including gene ontology (GO) and Kyoto Encyclopedia of Genes and Genomes (KEGG) pathways. P adjusted by Benjamini & Hochberg method < 0.01 and q value < 0.05 was considered significant.
Construction of an LLPS-Related Gene Signature
In our present study, a three-step analysis was carried out to construct a robust LLPS-related gene signature for predicting prognosis in the discovery set. Firstly, univariate Cox regression analysis was performed to identify overall survival (OS)-related DEGs. A DEG with a P < 0.05 was considered a OS-related gene. Secondly, the gene expression profiles of the OS-related DEGs were subjected to least absolute shrinkage and selection operator (LASSO) Cox regression analysis using the “glmnet” package (https://CRAN.R-project.org/package=glmnet). In this analysis, the OS-related DEGs with non-zero regression coefficients were identified in 10-fold cross-validation. The relevant parameters were set to “family=“cox”,” “maxit = 1000”, and “nfolds=10”. Third, the expression profiles of the OS-related DEGs with non-zero coefficients were used to perform multivariate Cox regression analysis. The LLPS-related gene signature was constructed as the formula:
The “Expr” represents the expression value of a gene with P < 0.05 in the multivariate Cox regression analysis. The “Coef” represents the coefficient of the corresponding gene. Each individual was assigned the LLPS-related gene signature index. The patients were divided into high- and low-risk group, and the OS between the two groups were compared.
Validation of the LLPS-Related Gene Signature in the Test Set
As it was in the discovery set, each individual in the test set was assigned an LLPS-related gene signature index according to the above formula. Moreover, the prognostic value of the LLPS-related gene signature and the routine clinical features was compared using multivariate Cox regression analysis.
Gene Set Enrichment Analysis
In order to reveal the biological functions of candidate genes in EOC, we performed gene set enrichment analysis (GSEA) (23, 24). We use the median expression value of each candidate gene as a threshold, and divide the EOC in TCGA into high- and low-expression groups. The canonical pathways of Kyoto Encyclopedia of Genes and Genomes gene sets derived from the Molecular Signatures Database (25) were selected as the reference gene sets. The P value adjusted by Benjamini & Hochberg method < 0.05 was set as the cut-off criteria. GSEA was performed using the clusterProfiler package and visualized using enrichplot package (https://github.com/YuLab-SMU/enrichplot).
Statistical Analysis
In the present study, all these analyses were performed in R (version 4.0.2) (https://www.r-project.org). The DEGs were screened using unpaired t-tests provided by “limma” package. The OS was compared using Kaplan-Meier curve with log-rank method. The predictive value of the LLPS-related gene signature was evaluated by time-dependent receiver operating characteristic (tROC) curve analysis using the timeROC package (https://CRAN.R-project.org/package=timeROC). All tests were two-sided and P < 0.05, unless otherwise stated, was considered statistically significant.
Results
Multiple LLPS-Related Genes Aberrantly Expressed in EOC
PhaSepDB database includes 2957 eligible genes, however, a total of 1767 LLPS-related genes were found in the GSE26712, among them, 252 genes were down-regulated and 248 were up-regulated in EOC compared to the normal ovarian surface epithelium (Figure S1A). These DEGs showed clearly different expression patterns in EOC and normal ovarian surface epithelium (Figure S1B). This indicates that the abnormal state of liquid-liquid phase separation may contribute to EOC.
Biological Functions Involved in Differentially Expressed LLPS-Related Genes
The GO enrichment analysis included cellular component (CC), biological process (BP), and molecular function (MF). The top significant (ranked by P value) 15 GO terms were showed in Figure S2. In CC (Figure S2A), the DEGs mainly involved in the composition of macromolecules and organelles, such as spliceosomal complex, ribonucleoprotein granule, and preribosome. In BP (Figure S2B), the DEGs significantly involved in RNA processing, such as RNA splicing, regulation of mRNA metabolic process, and RNA catabolic process. In MF (Figure S2C), the DEGs involve the activity of multiple enzymes, such as helicase activity, phosphatase activity, and DNA-dependent ATPase activity. The DEGs involved in several cancer-related pathways (Figure S2D), including MAPK signaling pathway, cell cycle, and DNA replication.
The LLPS-Related Gene Signature in the Discovery Set
The results of PCA showed the GSE17260 and GSE32062 had obvious batch effects (Figure 2A, left), which was removed by “sva” package for the subsequent analysis (Figure 2A, right). Sixty differentially expressed LLPS-related genes were identified as OS-related genes by univariate Cox analysis (Table 1), and 32 LLPS-related genes were identified with non-zero regression coefficients by LASSO analysis (Table 1). Finally, 11 LLPS-related genes (EIF3J, BYSL, NRGN, SAP18, PACSIN2, DUSP10, EIF6, HMBOX1, UTP3, HOMER2, and KIAA0355) remained significantly associated with OS in multivariate Cox analysis (Table 1) and were selected to construct the LLPS-related gene signature risk index (RI) (Figure 2B). The RI was significant associated with poor prognosis (hazard ratio {HR] = 2.771, 95% confidence interval [CI] for HR = 2.272-3.379, P < 2.2e-16). The tROC curve analysis showed the predictive value of the RI was high with area under the ROC curve (AUC) = 0.7–0.8 (Figure 2C), and the AUC of 5-year tROC curve was 0.793 (Figure 2D). The patients with high RI had significantly shorter OS than those with low RI (Figure 2E).
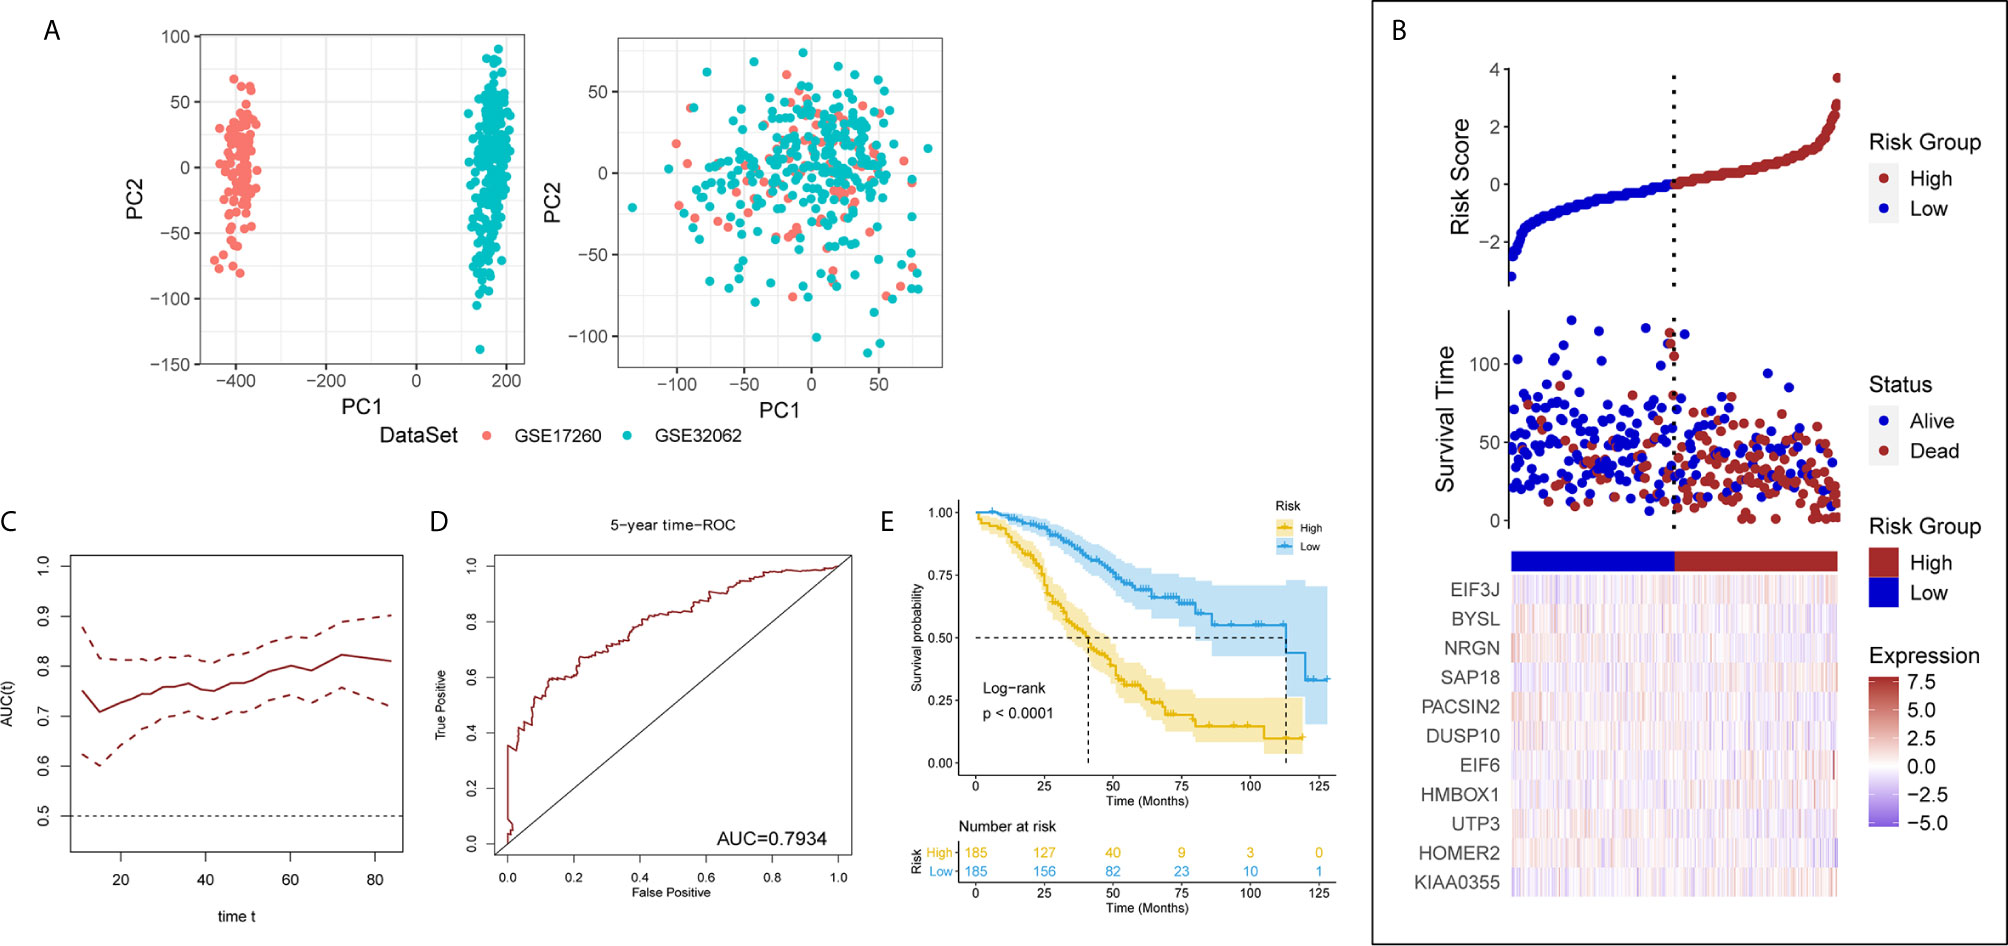
Figure 2 The liquid-liquid phase separation-related gene signature in the discovery set. (A) PCA results before (left) and after (after) removing batches between GSE17260 and GSE32062. PC, principal component. (B) The 11 genes of interest constitute the liquid-liquid phase separation-related gene signature. (C) The time receiver operating characteristic curve (ROC) analysis in the discovery set. (D) The five-year time ROC in the discovery set. (E) The patients with high risk index had significantly shorter overall survival than those with low risk index.
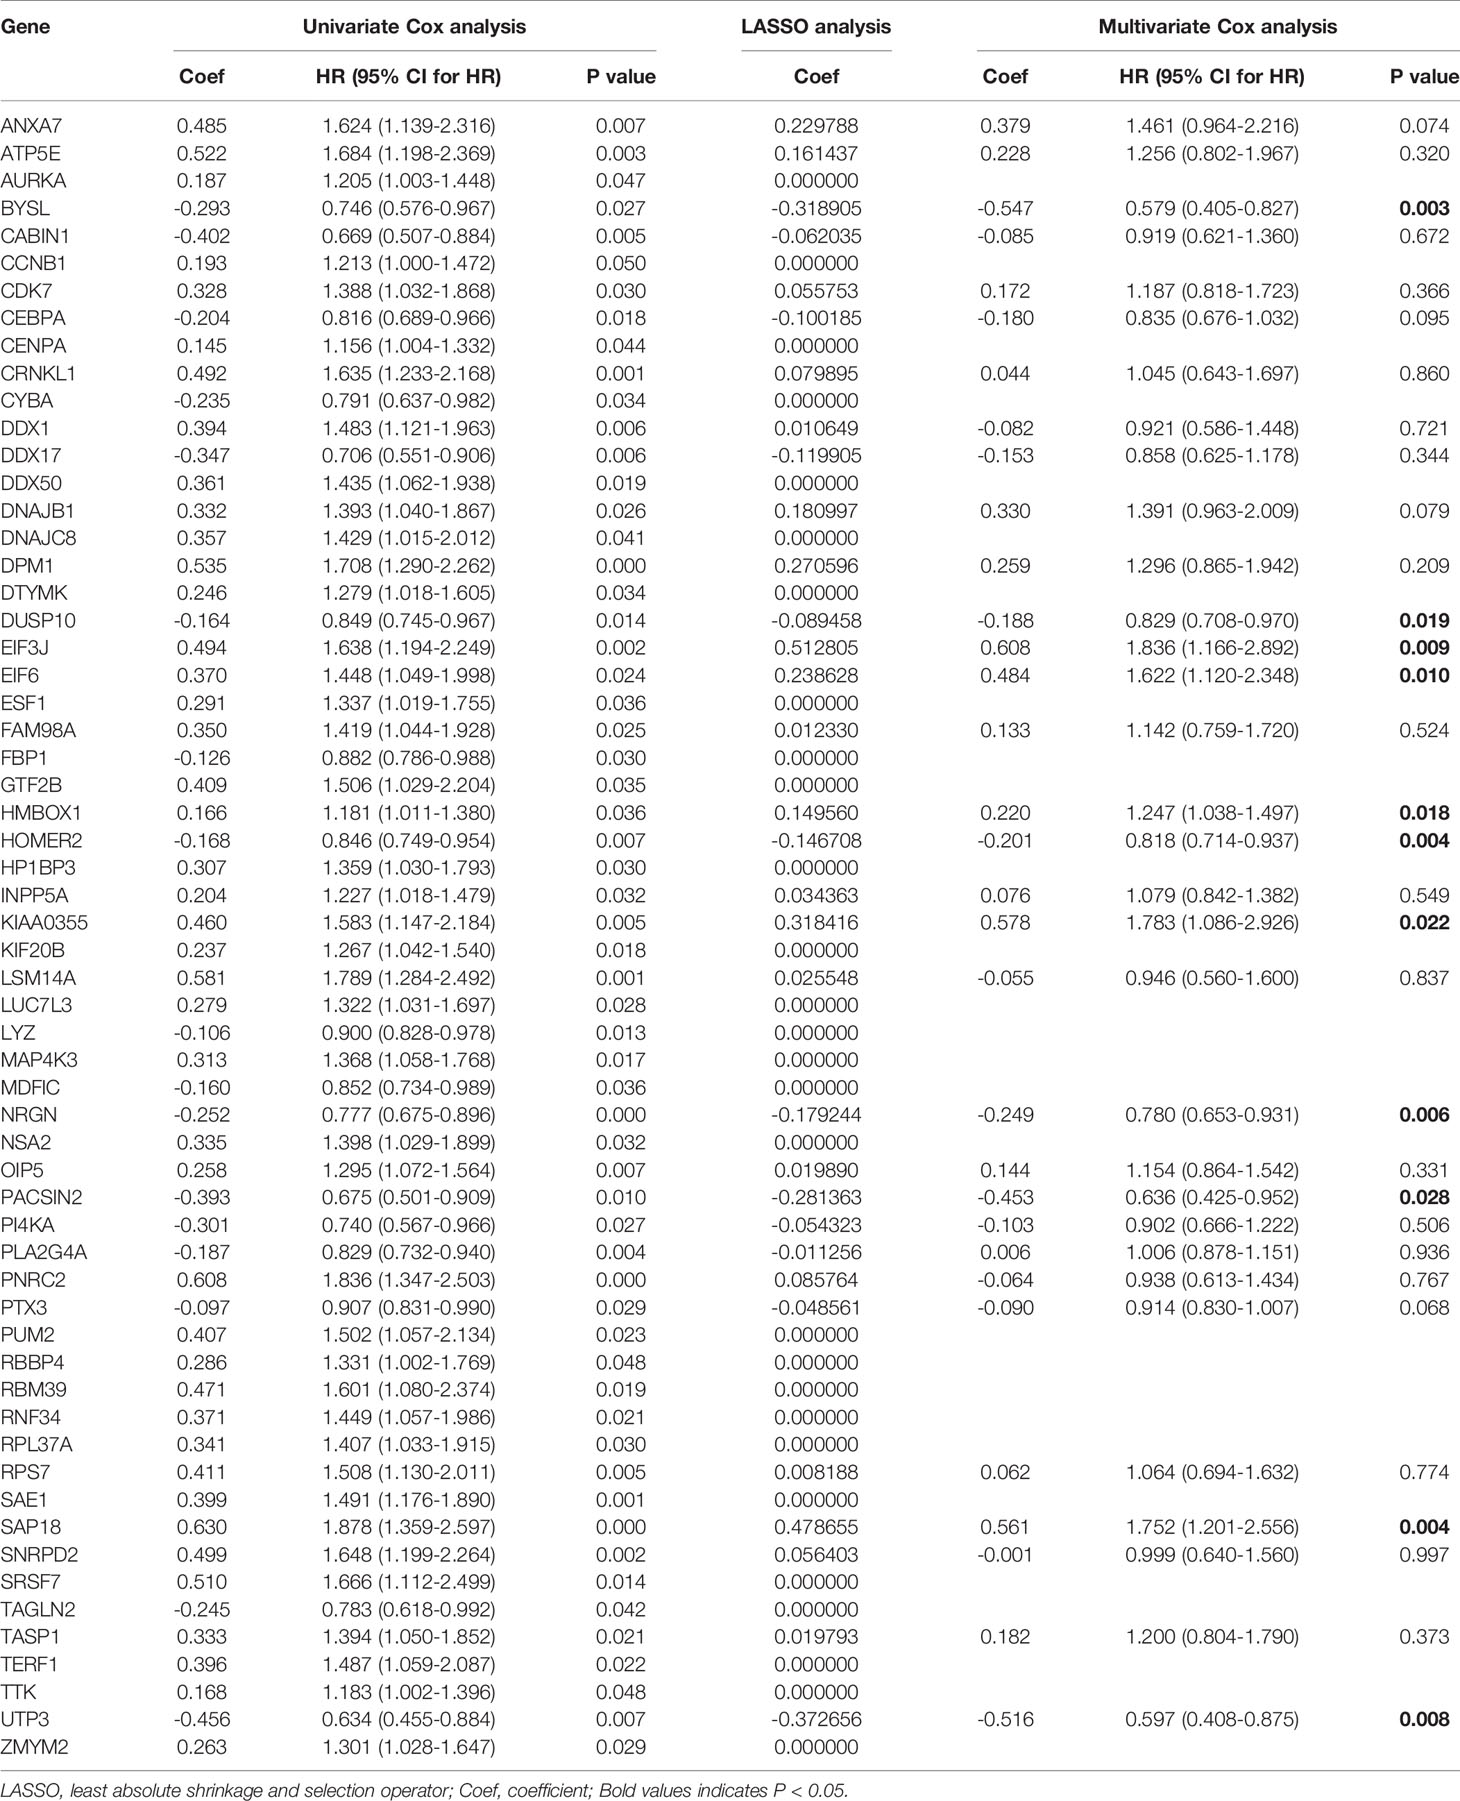
Table 1 The overall survival-related genes and their coefficients.
The LLPS-Related Gene Signature Was Validated in the Test Set
After removing the TCGA-OV patients without survival information, and a total of 566 patients remained in the test set (Table S1). Each individual in the test set was also assigned a RI according to the formula (Figure 3A). It is exciting that the RI remained associated with poor prognosis (HR = 1.211, 95% CI for HR = 1.070–1.372, P = 0.003). It also successfully divided patients into high- and low-risk groups, the patients with high RI had significantly shorter OS than those with low RI (Figure 3B). Moreover, the LLPS-related gene signature RI is an independent prognostic factor adjusted by some clinical features (Figure 3C).
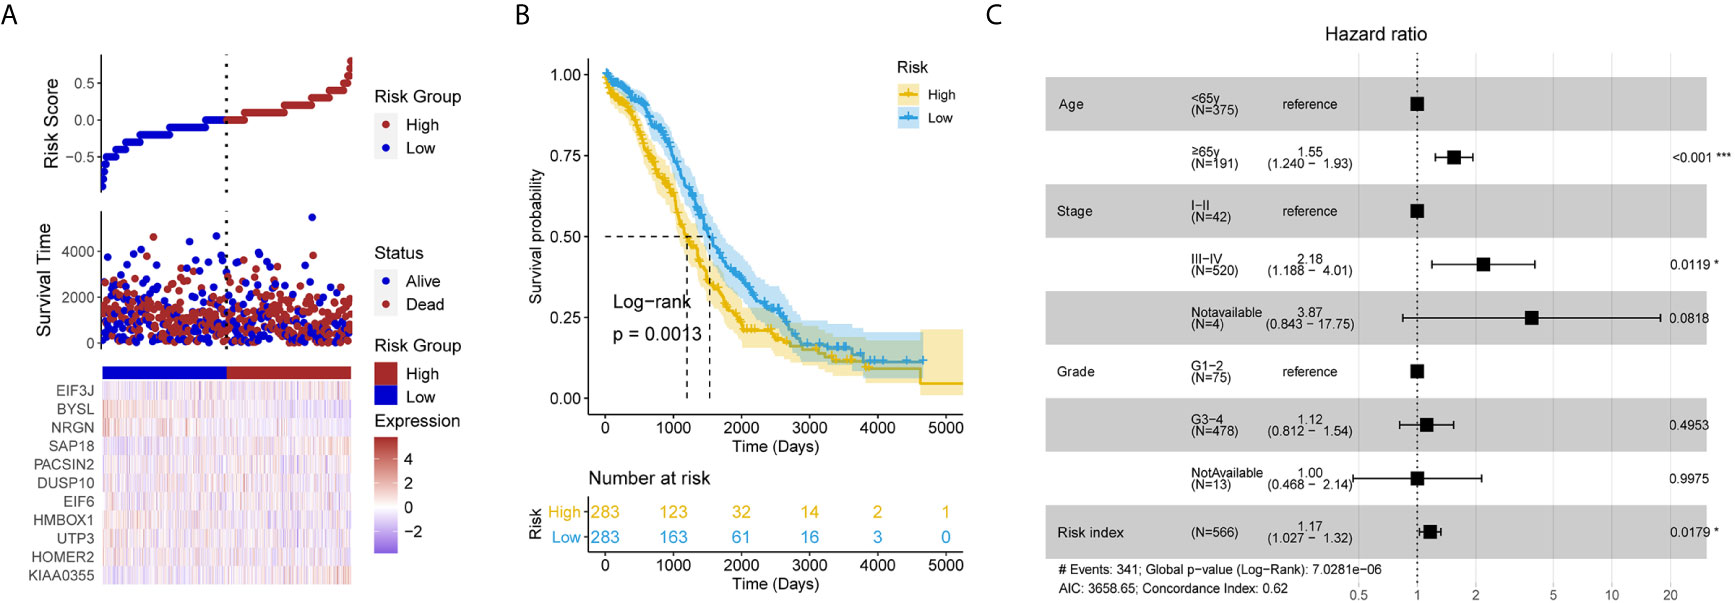
Figure 3 The liquid-liquid phase separation-related gene signature was validated in the test set. (A) The risk plot of test set based the 11 liquid-liquid phase separation-related gene signature. (B) The patients with high risk index had significantly shorter overall survival than those with low risk index in the test set. (C) The risk index remains significant compared routine clinical features.
Pathways Involved in These 11 Candidate Genes
According to the GSEA results, the 11 candidate genes may involve in various pathways (Figure 4). For instance, the high expression of BYSL may associate with activation of DNA replication, Mismatch repair, and Proteasome. However, LLPS is the introduction of physical and chemical concepts to explain biological phenomena, the specific link between these pathways and LLPS remains to be further elucidated.
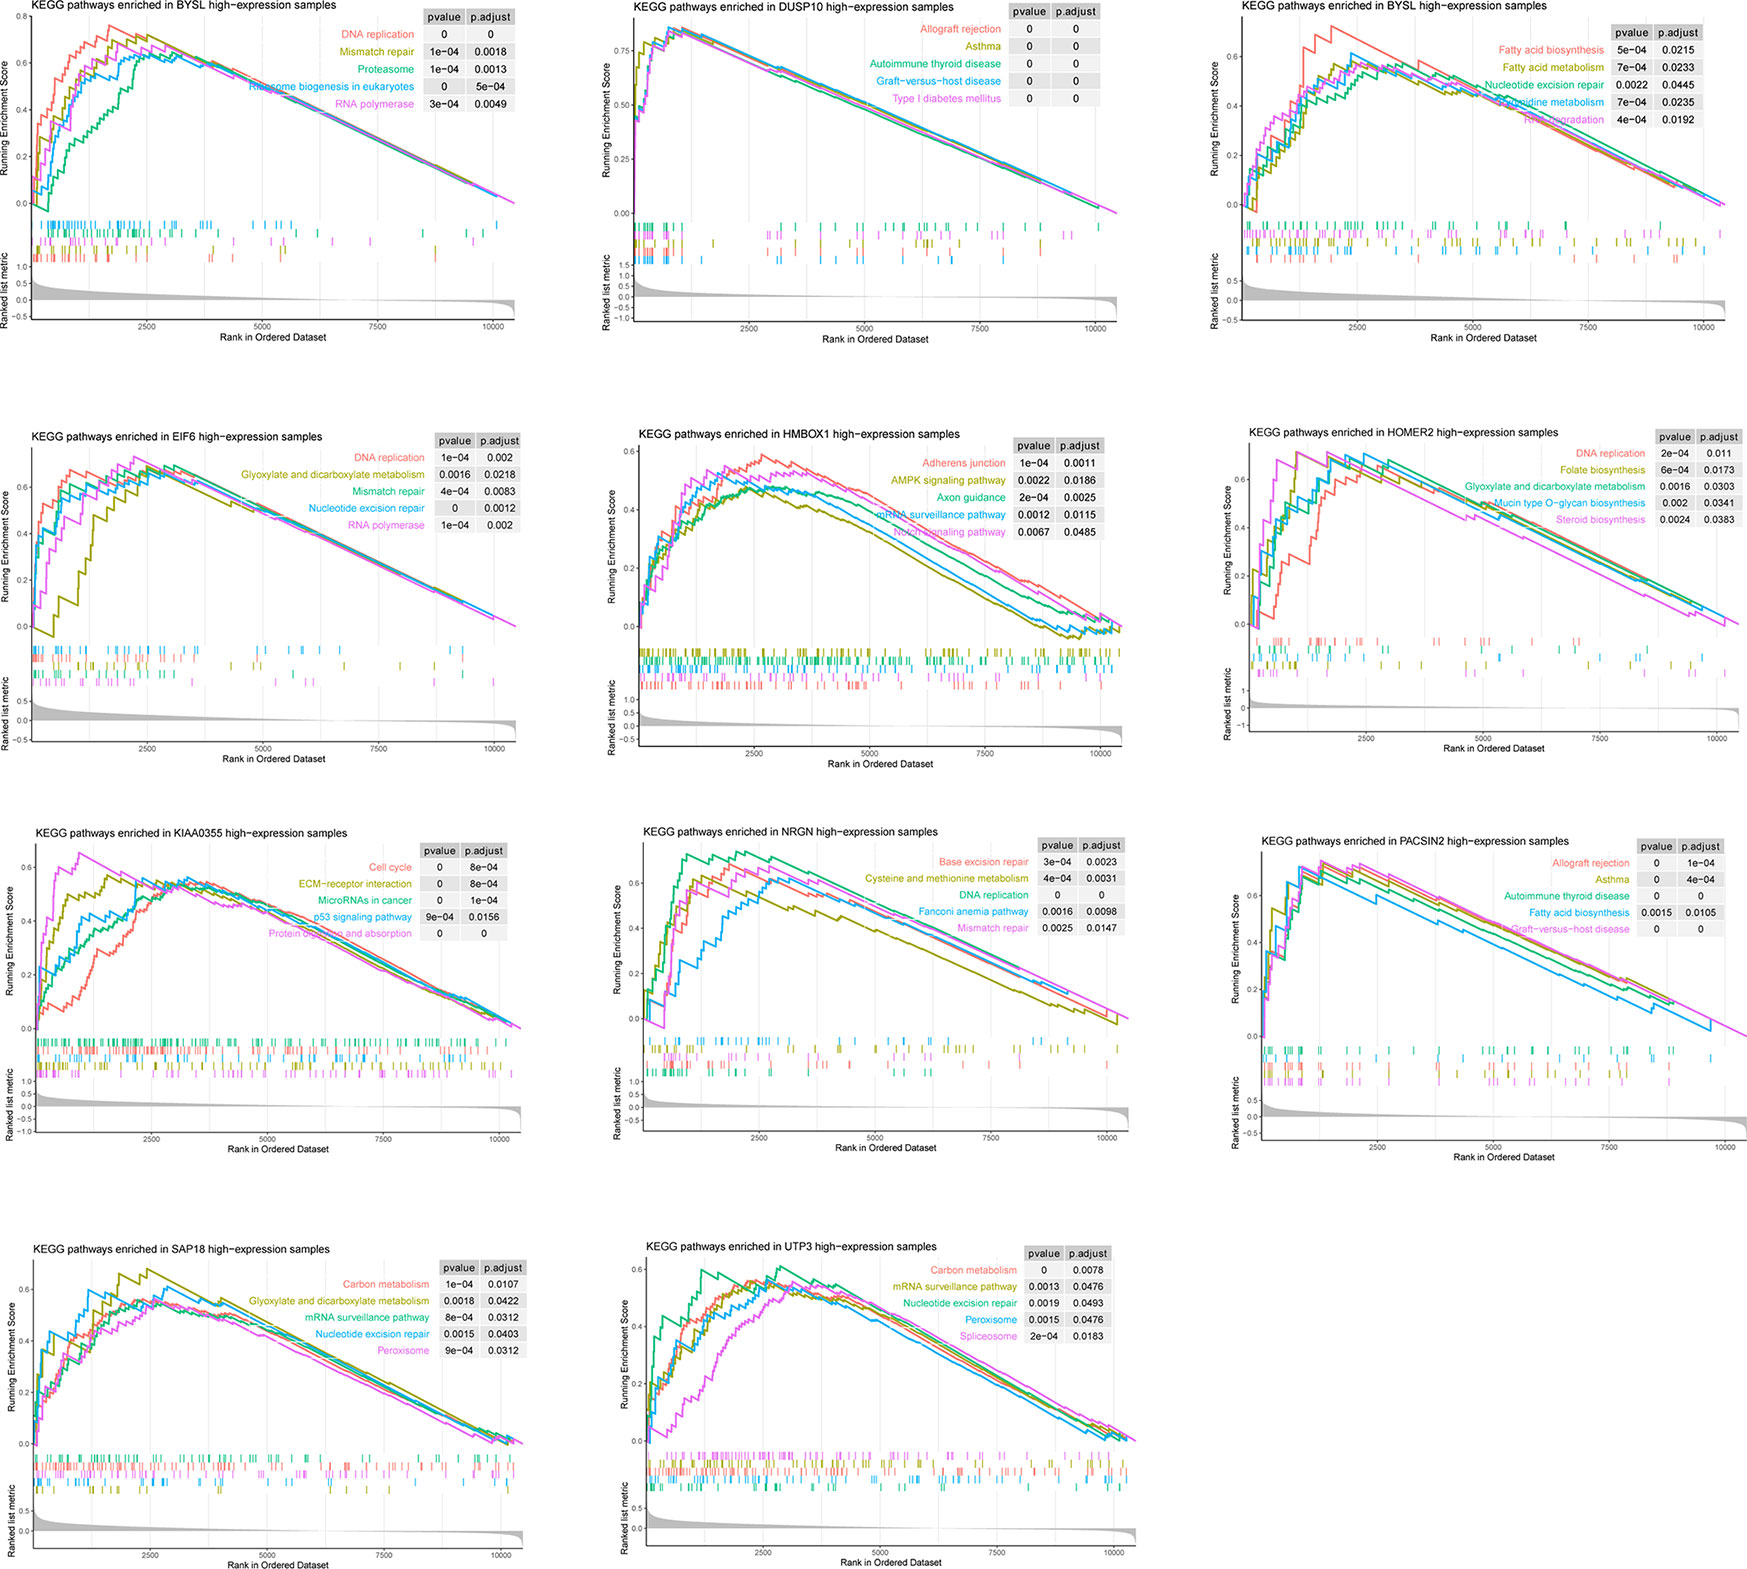
Figure 4 Pathways involved in these 11 candidate genes.
Discussion
LLPS provides a new framework to understand and interpret cancer, with potentially new way for treatment. The mutation of LLPS-related gene may lead to aberrant forms of LLPS (26–28), the aberrant forms of LLPS contribute to the abnormal activity in cancer-related pathways (29). In the present study, we found that differentially expressed LLPS-related genes in EOC were involved in multiple cancer-related pathways, such as MAPK signaling pathway, cell cycle, and DNA replication. This indicated that LLPS in EOC was complicated. We also found that the expression patterns of LLPS-related genes were associated with prognosis in EOC and proposed an LLPS-related gene signature for predicting prognosis. Our LLPS-related gene signature was constructed and validated in two independent data sets based on different platforms. Thus, this might indicate that this LLPS-related gene signature is still robust in different populations and suitable for different platforms. In some previous studies (30, 31), univariate and multivariate Cox regression analyses were used but lack of LASSO analysis to create the prognostic gene signatures. However, these previous studies may encounter overfitting problems and not validated in independent data sets. The LASSO method was used for the optimal selection of features in high-dimensional data with a robust predictive value and low correlation between each other to prevent overfitting (32). Thus, our LLPS-related gene signature was validated in independent data sets. Moreover, the LLPS-related gene signature is independent prognostic factor compared clinical features, including age, pathological staging, and grade. According to the risk score system, the patients at high risk may be followed up more frequently and accept more active management than those at low risk.
The present LLPS-related gene signature consists of 11 LLPS-related genes. Unsurprisingly, some of the 11 LLPS-related genes were reported associated with EOC, such as a previous study proposed that altered EIF6 expression is associated with clinicopathological features in EOC (33), and low expression level of HMBOX1 in EOC may accelerate cell proliferation by inhibiting cell apoptosis (34). BYSL may be an oncogene in various cancer, including hepatocellular carcinoma (35), glioblastoma (36), and diffuse large B-cell lymphoma (37). NRGN was reported as a tumor suppressor in glioma cells (38), and we found that it is also associated with good prognosis in EOC. SAP18 was reportedly associated with the promotion of cell invasion and angiogenesis in virus oncogenic (39). PACSIN2 polymorphism was associated with thiopurine metabolism in children with acute lymphoblastic leukemia (40). The role of DUSP10 in cancer may be related to specific cancer types, some studies indicated that it is an oncogene, while in other studies indicated that it is a tumor suppressor (41). Although further molecular experiments are required, our GSEA results may help reveal the biological functions of these 11 candidate genes in EOC.
Although the present study may provide new insight into the risk stratification in EOC, several limitations should be noticed. First, the LLPS-related gene signature was proposed through retrospective study, prospective study is needed before it is used in clinical practice. Second, molecular function experiments were lacking in our present study, thus, it is not clear whether these genes are causal or merely prognostic markers in EOC.
In conclusion, we found significantly different expression patterns of LLPS-related genes in EOC compared to normal ovarian surface epithelium, and constructed and validated an LLPS-related gene signature as a prognosis tool in EOC through integrated analysis of multiple data sets.
Data Availability Statement
Publicly available data sets were analyzed in this study. These data can be found here: https://www.ncbi.nlm.nih.gov/geo/, https://portal.gdc.cancer.gov/.
Author Contributions
YQ designed the study. YQ analyzed the data and wrote the manuscript. MP and XC participated in analysis and interpretation of the data and reviewed the article. All authors contributed to the article and approved the submitted version.
Funding
This work was supported by Science and Technology Plan Project of Maoming (grant number: 2019369) and High-level Hospital Construction Research Project of Maoming People’s Hospital.
Conflict of Interest
The authors declare that the research was conducted in the absence of any commercial or financial relationships that could be construed as a potential conflict of interest.
Supplementary Material
The Supplementary Material for this article can be found online at: https://www.frontiersin.org/articles/10.3389/fonc.2021.671892/full#supplementary-material
Supplementary Figure 1 | The differentially expressed liquid-liquid phase separation-related genes in epithelial ovarian cancer. (A) The vocano plot of the liquid-liquid phase separation-related genes. Red represents up-regulated genes, blue represents down-regulated genes, and grey represents not significantly differential expression. (B) The expression heatmap of the differentially expressed liquid-liquid phase separation-related genes.
Supplementary Figure 2 | Gene ontology terms and pathways involved in differentially expressed liquid-liquid phase separation-related genes. (A) cellular component, (B) biological process, (C) molecular function, and (D) Kyoto Encyclopedia of Genes and Genomes pathways. Log2FC, log2 (fold change).
References
1. Hyman AA, Weber CA, Julicher F. Liquid-Liquid Phase Separation in Biology. Annu Rev Cell Dev Biol (2014) 30:39–58. doi: 10.1146/annurev-cellbio-100913-013325
2. Larson AG, Elnatan D, Keenen MM, Trnka MJ, Johnston JB, Burlingame AL, et al. Liquid Droplet Formation by HP1alpha Suggests a Role for Phase Separation in Heterochromatin. Nature (2017) 547(7662):236–40. doi: 10.1038/nature22822
3. Schmidt HB, Gorlich D. Transport Selectivity of Nuclear Pores, Phase Separation, and Membraneless Organelles. Trends Biochem Sci (2016) 41(1):46–61. doi: 10.1016/j.tibs.2015.11.001
4. Brangwynne CP, Eckmann CR, Courson DS, Rybarska A, Hoege C, Gharakhani J, et al. Germline P Granules Are Liquid Droplets That Localize by Controlled Dissolution/Condensation. Science (2009) 324(5935):1729–32. doi: 10.1126/science.1172046
5. You K, Huang Q, Yu C, Shen B, Sevilla C, Shi M, et al. PhaSepDB: A Database of Liquid-Liquid Phase Separation Related Proteins. Nucleic Acids Res (2020) 48(D1):D354–D9. doi: 10.1093/nar/gkz847
6. Aguzzi A, Altmeyer M. Phase Separation: Linking Cellular Compartmentalization to Disease. Trends Cell Biol (2016) 26(7):547–58. doi: 10.1016/j.tcb.2016.03.004
7. Alberti S, Dormann D. Liquid-Liquid Phase Separation in Disease. Annu Rev Genet (2019) 53:171–94. doi: 10.1146/annurev-genet-112618-043527
8. Han TW, Kato M, Xie S, Wu LC, Mirzaei H, Pei J, et al. Cell-Free Formation of RNA Granules: Bound RNAs Identify Features and Components of Cellular Assemblies. Cell (2012) 149(4):768–79. doi: 10.1016/j.cell.2012.04.016
9. Kato M, Han TW, Xie S, Shi K, Du X, Wu LC, et al. Cell-Free Formation of RNA Granules: Low Complexity Sequence Domains Form Dynamic Fibers Within Hydrogels. Cell (2012) 149(4):753–67. doi: 10.1016/j.cell.2012.04.017
10. Schwartz JC, Wang X, Podell ER, Cech TR. RNA Seeds Higher-Order Assembly of FUS Protein. Cell Rep (2013) 5(4):918–25. doi: 10.1016/j.celrep.2013.11.017
11. Schwartz JC, Cech TR, Parker RR. Biochemical Properties and Biological Functions of FET Proteins. Annu Rev Biochem (2015) 84:355–79. doi: 10.1146/annurev-biochem-060614-034325
12. Sankar S, Lessnick SL. Promiscuous Partnerships in Ewing’s Sarcoma. Cancer Genet (2011) 204(7):351–65. doi: 10.1016/j.cancergen.2011.07.008
13. Deng H, Gao K, Jankovic J. The Role of FUS Gene Variants in Neurodegenerative Diseases. Nat Rev Neurol (2014) 10(6):337–48. doi: 10.1038/nrneurol.2014.78
14. Doherty JA, Peres LC, Wang C, Way GP, Greene CS, Schildkraut JM. Challenges and Opportunities in Studying the Epidemiology of Ovarian Cancer Subtypes. Curr Epidemiol Rep (2017) 4(3):211–20. doi: 10.1007/s40471-017-0115-y
15. Davis S, Meltzer PS. GEOquery: A Bridge Between the Gene Expression Omnibus (GEO) and Bioconductor. Bioinformatics (2007) 23(14):1846–7. doi: 10.1093/bioinformatics/btm254
16. Bonome T, Levine DA, Shih J, Randonovich M, Pise-Masison CA, Bogomolniy F, et al. A Gene Signature Predicting for Survival in Suboptimally Debulked Patients With Ovarian Cancer. Cancer Res (2008) 68(13):5478–86. doi: 10.1158/0008-5472.CAN-07-6595
17. Yoshihara K, Tajima A, Yahata T, Kodama S, Fujiwara H, Suzuki M, et al. Gene Expression Profile for Predicting Survival in Advanced-Stage Serous Ovarian Cancer Across Two Independent Datasets. PloS One (2010) 5(3):e9615. doi: 10.1371/journal.pone.0009615
18. Yoshihara K, Tsunoda T, Shigemizu D, Fujiwara H, Hatae M, Fujiwara H, et al. High-Risk Ovarian Cancer Based on 126-Gene Expression Signature Is Uniquely Characterized by Downregulation of Antigen Presentation Pathway. Clin Cancer Res (2012) 18(5):1374–85. doi: 10.1158/1078-0432.CCR-11-2725
19. Leek JT, Johnson WE, Parker HS, Jaffe AE, Storey JD. The Sva Package for Removing Batch Effects and Other Unwanted Variation in High-Throughput Experiments. Bioinformatics (2012) 28(6):882–3. doi: 10.1093/bioinformatics/bts034
20. Cancer Genome Atlas Research N. Integrated Genomic Analyses of Ovarian Carcinoma. Nature (2011) 474(7353):609–15. doi: 10.1038/nature10166
21. Ritchie ME, Phipson B, Wu D, Hu Y, Law CW, Shi W, et al. Limma Powers Differential Expression Analyses for RNA-sequencing and Microarray Studies. Nucleic Acids Res (2015) 43(7):e47. doi: 10.1093/nar/gkv007
22. Yu G, Wang LG, Han Y, He QY. clusterProfiler: An R Package for Comparing Biological Themes Among Gene Clusters. OMICS (2012) 16(5):284–7. doi: 10.1089/omi.2011.0118
23. Subramanian A, Tamayo P, Mootha VK, Mukherjee S, Ebert BL, Gillette MA, et al. Gene Set Enrichment Analysis: A Knowledge-Based Approach for Interpreting Genome-Wide Expression Profiles. Proc Natl Acad Sci USA (2005) 102(43):15545–50. doi: 10.1073/pnas.0506580102
24. Mootha VK, Lindgren CM, Eriksson KF, Subramanian A, Sihag S, Lehar J, et al. PGC-1alpha-Responsive Genes Involved in Oxidative Phosphorylation are Coordinately Downregulated in Human Diabetes. Nat Genet (2003) 34(3):267–73. doi: 10.1038/ng1180
25. Liberzon A, Birger C, Thorvaldsdottir H, Ghandi M, Mesirov JP, Tamayo P. The Molecular Signatures Database (MSigDB) Hallmark Gene Set Collection. Cell Syst (2015) 1(6):417–25. doi: 10.1016/j.cels.2015.12.004
26. Lemmon MA, Schlessinger J. Cell Signaling by Receptor Tyrosine Kinases. Cell (2010) 141(7):1117–34. doi: 10.1016/j.cell.2010.06.011
27. Su X, Ditlev JA, Hui E, Xing W, Banjade S, Okrut J, et al. Phase Separation of Signaling Molecules Promotes T Cell Receptor Signal Transduction. Science (2016) 352(6285):595–9. doi: 10.1126/science.aad9964
28. Boulay G, Sandoval GJ, Riggi N, Iyer S, Buisson R, Naigles B, et al. Cancer-Specific Retargeting of BAF Complexes by a Prion-Like Domain. Cell (2017) 171(1):163–78 e19. doi: 10.1016/j.cell.2017.07.036
29. Du M, Chen ZJ. DNA-Induced Liquid Phase Condensation of cGAS Activates Innate Immune Signaling. Science (2018) 361(6403):704–9. doi: 10.1126/science.aat1022
30. Gan Z, Zou Q, Lin Y, Huang X, Huang Z, Chen Z, et al. Construction and Validation of a Seven-microRNA Signature as a Prognostic Tool for Lung Squamous Cell Carcinoma. Cancer Manag Res (2019) 11:5701–9. doi: 10.2147/CMAR.S191637
31. Xie M, Lv Y, Liu Z, Zhang J, Liang C, Liao X, et al. Identification and Validation of a Four-miRNA (miRNA-21-5p, miRNA-9-5p, miR-149-5p, and miRNA-30b-5p) Prognosis Signature in Clear Cell Renal Cell Carcinoma. Cancer Manag Res (2018) 10:5759–66. doi: 10.2147/CMAR.S187109
32. Friedman JH, Hastie T, Tibshirani R. Regularization Paths for Generalized Linear Models Via Coordinate Descent. J Stat Softw (2010) 33: (1):22. doi: 10.18637/jss.v033.i01
33. Flavin RJ, Smyth PC, Finn SP, Laios A, O’Toole SA, Barrett C, et al. Altered eIF6 and Dicer Expression is Associated With Clinicopathological Features in Ovarian Serous Carcinoma Patients. Mod Pathol (2008) 21(6):676–84. doi: 10.1038/modpathol.2008.33
34. Yu YL, Diao NN, Li YZ, Meng XH, Jiao WL, Feng JB, et al. Low Expression Level of HMBOX1 in High-Grade Serous Ovarian Cancer Accelerates Cell Proliferation by Inhibiting Cell Apoptosis. Biochem Biophys Res Commun (2018) 501(2):380–6. doi: 10.1016/j.bbrc.2018.04.203
35. Wang H, Xiao W, Zhou Q, Chen Y, Yang S, Sheng J, et al. Bystin-Like Protein Is Upregulated in Hepatocellular Carcinoma and Required for Nucleologenesis in Cancer Cell Proliferation. Cell Res (2009) 19(10):1150–64. doi: 10.1038/cr.2009.99
36. Sha Z, Zhou J, Wu Y, Zhang T, Li C, Meng Q, et al. BYSL Promotes Glioblastoma Cell Migration, Invasion, and Mesenchymal Transition Through the GSK-3beta/beta-Catenin Signaling Pathway. Front Oncol (2020) 10:565225. doi: 10.3389/fonc.2020.565225
37. Kasugai Y, Tagawa H, Kameoka Y, Morishima Y, Nakamura S, Seto M. Identification of CCND3 and BYSL as Candidate Targets for the 6p21 Amplification in Diffuse Large B-Cell Lymphoma. Clin Cancer Res (2005) 11(23):8265–72. doi: 10.1158/1078-0432.CCR-05-1028
38. Yang J, Yu D, Liu X, Changyong E, Yu S. Linc00641/miR-4262/NRGN Axis Confines Cell Proliferation in Glioma. Cancer Biol Ther (2020) 21(8):758–66. doi: 10.1080/15384047.2020.1776581
39. Ding X, Xu J, Wang C, Feng Q, Wang Q, Yang Y, et al. Suppression of the SAP18/HDAC1 Complex by Targeting TRIM56 and Nanog is Essential for Oncogenic Viral FLICE-inhibitory Protein-Induced Acetylation of P65/RelA, NF-kappaB Activation, and Promotion of Cell Invasion and Angiogenesis. Cell Death Differ (2019) 26(10):1970–86. doi: 10.1038/s41418-018-0268-3
40. Choi R, Sohn I, Kim MJ, Woo HI, Lee JW, Ma Y, et al. Pathway Genes and Metabolites in Thiopurine Therapy in Korean Children With Acute Lymphoblastic Leukaemia. Br J Clin Pharmacol (2019) 85(7):1585–97. doi: 10.1111/bcp.13943
Keywords: epithelial ovarian cancer, liquid-liquid phase separation, risk stratification, prognostic biomarker, gynecologic oncology
Citation: Qiu Y, Pan M and Chen X (2021) A Liquid-Liquid Phase Separation-Related Gene Signature as Prognostic Biomarker for Epithelial Ovarian Cancer. Front. Oncol. 11:671892. doi: 10.3389/fonc.2021.671892
Received: 24 February 2021; Accepted: 12 May 2021;
Published: 08 June 2021.
Edited by:
Nicholas Pavlidis, University of Ioannina, GreeceReviewed by:
Elena Teodorico, Agostino Gemelli University Polyclinic, ItalySharad Purohit, Augusta University, United States
Copyright © 2021 Qiu, Pan and Chen. This is an open-access article distributed under the terms of the Creative Commons Attribution License (CC BY). The use, distribution or reproduction in other forums is permitted, provided the original author(s) and the copyright owner(s) are credited and that the original publication in this journal is cited, in accordance with accepted academic practice. No use, distribution or reproduction is permitted which does not comply with these terms.
*Correspondence: Yan Qiu, NjU3MjkwMjU3QHFxLmNvbQ==