 Shusheng Leng1,2
 Tianfu Wen
- 1Department of Liver Surgery and Liver Transplantation Center, West China Hospital of Sichuan University, Chengdu, China
- 2General Surgery Department, Affiliated Hospital/Clinical Medical College of Chengdu University, Chengdu, China
- 3Department of Hepatobiliary, Pancreatic and Splenic Surgery, The First People’s Hospital of Neijiang City, Neijiang, China
- 4Central Laboratory, Affiliated Hospital/Clinical Medical College of Chengdu University, Chengdu, China
Background: Lethal giant larvae (Lgl), scaffolding proteins, regulate the epithelial cell apicobasal polarity in Drosophila. They play important roles in asymmetric cell division, cell migration, and progenitor cells self-renewal as tumor suppressors. One of Lgl mammalian homologues proteins, LLGL2 overexpression has been reported in ER+ breast cancer and promotes tumor proliferation through regulating leucine uptake. Nonetheless, the role of LLGL2 in hepatocellular carcinoma (HCC) is still unknown.
Methods: TCGA dataset mining, qRT-PCR, Western blot along with immunohistochemistry assays were employed to explore LLGL2 expression in human HCC samples and cell lines. Moreover, the clinical value of LLGL2 was investigated in 156 HCC patients. Furthermore, the role as well as the molecular mechanism of LLGL2 in the progression of HCC was explored through a series of in vitro and in vivo experiments.
Results: LLGL2 was up-regulated in HCC tissues, which was related with certain clinicopathological features including tumor number, vascular invasion as well as advanced stage. High expression of LLGL2 predicted poor prognosis after hepatectomy. LLGL2 promoted HCC cells proliferation, migration and invasion through PI3K/ATK signaling by promoting calcium ion influx.
Conclusion: Our study identified that LLGL2 is a tumor promoter in HCC for the first time, which could potentially be utilized as a new biomarker and a therapeutic target for HCC.
Introduction
Hepatocellular carcinoma(HCC) is the 7th leading most frequent cancer as well as the 3rd leading cause of cancer mortalities globally in 2018, and about 841,080 new cases and 781,631 fatalities yearly (1). In China, HCC accounts for almost 50% of new cases and deaths annually (2). Despite the progress in operative techniques and targeted therapies, HCC prognosis has remained very poor. It is mainly because of high rates of relapse and metastasis after the treatments (3, 4). Understanding the pathogenesis and molecular mechanisms of HCC progression is essential for the development of novel and effective treatments for HCC.
Cell polarity is one of the most fundamental properties of normal cells (5, 6). It is essential for regulating multitude biological processes, including differentiation, proliferation, migration, adhesion, transformation and tumor formation (7, 8). Lethal giant larvae (Lgl), one of scaffolding proteins, which is a component of the epithelial apico-basal cell polarity machinery, controls the self-renewal and differentiation properties in progenitor cells acting as a tumor suppressor (9–12). The human homologues of Lgl are known as LLGL1 and LLGL2 (13). LLGL1 protein contains several conserved functional domains highly homologous to some regions of Lgl, which indicates that LLGL1 and Lgl proteins may have closely related functions (14, 15). Emerging evidences have shown that LLGL1 is a tumor suppressor in multiple human cancers, including hepatocellular carcinoma (12, 14, 16–20). LLGL2 is also associated with cancer progression. It has a vital function in the asymmetric cell division, cell migration and is essential for the development of placental labyrinth layer morphogenesis (21–23). Loss of LLGL2 in normal epithelium induced a mesenchymal phenotype (24). LLGL2 can suppress Snail-induced epithelial-mesenchymal transition (EMT), as a tumor suppressor preventing the dissemination of breast cancer (25). LLGL2 expression is either aberrantly localized or lost in gastric epithelial dysplasia and adenocarcinoma, as well as in pancreatic intraepithelial neoplasia and pancreatic ductal adenocarcinoma (26, 27). Apical membrane localization of LLGL2 was associated with lymphatic invasion and lymph node metastasis in lung adenocarcinoma (28). LLGL2 knockout causes epidermal cells tumorigenesis, which facilitate EMT by active ErbB signaling pathway (29). Nevertheless, LLGL2 does not always serve as a typical tumor-suppressor gene in mammalian (30). In human ER+ breast cancer, LLGL2 functions as a promoter of tumor growth, rather than a tumor repressor (31). Nonetheless, the biological as well as the clinical implications of LLGL2 in HCC are still unknown.
In our study, the expression of LLGL2 in HCC was investigated and its clinical significance for HCC prognosis was determined. Furthermore, LLGL2 was shown to enhance the intracellular calcium ion level, which in turn influences PI3K/AKT pathway signaling.
Materials and Methods
Bioinformatic Analysis
LLGL2 expression in HCC from TCGA database was performed by using online analysis tool GEPIA (32).
Patient Specimens
Total 156 HCC samples were collected from Bio-bank of West China Hospital of Sichuan University, Affiliated Hospital/Clinical Medical College of Chengdu University and The First People’s Hospital of Neijiang between 2010 and 2017. All patients had not been subjected to any treatment before hepatectomy. All patients involved in our study were HBV (hepatitis B virus) associated HCC. Additionally, HCV (hepatitis C virus) or alcohol associated HCC were excluded. A total of 30 fresh HCC tissues and adjacent non-tumor liver tissue (ANLT) samples, which were acquired from West China Hospital of Sichuan University, were investigated using qRT-PCR. HCC histopathology was diagnosed by at least two independent pathologists. Paraffin-embedded tissues were employed to establish tissue microarray (TMA). All patients provided prior informed consent. Moreover, the Ethics Committee of West China Hospital of Sichuan University approved the study.
Follow-Up and Prognostic Study
All subjects after hepatectomy were followed-up regularly by experienced researchers. The latest follow-up date was March, 2020. Alpha-fetpprotein (AFP) and ultrasonography were used to monitor HCC recurrence and metastasis every 3 month. When relapse was suspected, MRI (magnetic resonance imaging) and/or CT (computed tomography) scan were conducted. Overall survival (OS) along with Disease-free survival (DFS) was as the time from the date of hepatectomy to the date of mortality from HCC or to the date of local relapse or detection of distant metastasis. The detailed clinicopathological characteristics of these subjects are listed in detail in Table 1.

Table 1 Correlations between LLGL2 and clinicopathologic variables of HCC.
Cell Lines and Cell Culture
Normal liver cell line L02 and human HCC cell lines including HepG2, Hep3B and Huh7 were supplied by the American Type Culture Collection (ATCC Rockville, MA). HCCLM3 and SMMC7721 were supplied by Shanghai Institute of Cell Biology, Liver Cancer Institute of Fudan University. We cultured the cell lines in DMEM added 10% fetal bovine serum, 1% penicillin as well as 1% streptomycin (Sijiqing, Hangzhou, China) at 37°C under 5% CO2.
RNA Extraction and qRT-PCR
The TRIzol® Reagent (Life Technologies, Carlsbad, CA) was employed to extract total RNAs from cells and frozen HCC tissues as outlined in the manufacturer protocol. cDNA was generated from the total RNA using the cDNA synthesis kit (ThermoFish Scientific, Shanghai, China). Thereafter, the SuperReal PreMix Plus kit (TIANGEN, Beijing, China) was employed to conduct the qRT-PCR following the protocol provided by the manufacturer. Sangon (Shanghai, China) synthesized the primers. GAPDH served as the internal control. The sequences of the primers are indicated in the Supplementary Table S1. The assays were replicated thrice.
Western Blot Assessment
The RIPA lysis buffer (Solarbio, Beijing, China) was employed to extract proteins from the HCC cells as well as tissues. After that, the proteins were fractionated via SDS-PAGE. Then, the protein samples were transfer-embedded onto PVDF membranes (Millipore, Bedford, Mass). Afterwards, 5% skimmed milk was employed to block the membranes, followed by inoculation with the specified antibodies. Subsequently, enhanced chemiluminescence reagents (Thermo Scientific, Waltham, MA) were employed to explore the antigen-antibody complex. The primary antibodies: mouse LLGL2(1:500, Santa Cruz, CA, USA), Rabbit AKT (1:1000, Santa Cruz), Rabbit p-AKT(1:1000, Santa Cruz), Rabbit PI3K(1:2000, Santa Cruz) and Rabbit p-PI3K(1:2000, Santa Cruz) antibodies. mouse actin (1:3000, Sigma). HuaAn Biotechnology (Huaan, Hangzhou, China) supplied the corresponding secondary antibodies.
Immunohistochemical Analysis
Human HCC tissue microarrays (TMA) slides consisted of 156 pairs of primary tumor tissues and ANLT specimens. The immunohistochemical-staining assay for LLGL2(1:50), Vimentin(1:100), E-cadherin(1:100) was conducted using a 2-step detection kit (Zhongshan Golden Bridge Biotechnology, Beijing, China).Antibody Vimentin and E-cadherin purchased from HuaAn Biotechnology (Huaan, Hangzhou, China). We evaluated LLGL2 expression with an inverted microscope (Olympus, Japan). The levels of LLGL2 expression were scored on the basis of the percentage of the positively stained tumor cells. The grading score were; 4 indicates >80% positive, 3 indicates 51-80% positive, 2 indicates 31-50% positive, 1 indicates 5-30% positive, and 0 indicates ≤5% positive. The level of LLGL2 protein expression was classified into a high expression group (2 - 4) and a low expression group (0 - 1) for downstream analyses (33).
Vector Construction of LLGL2
GeneChem (Shanghai, China) supplied the LLGL2 knockdown lentivirus and the relative negative control (NC) lentivirus. To generate LLGL2 shRNA–resistant plasmids, synonymous mutations were introduced into the shRNA2 and shRNA3 which targeted region of WT LLGL2 cDNA clone, purchased from GeneChem (Shanghai, China) (pEGFP-N1-shRNAR-LLGL2).The sequences of the 3 candidate hairpin loops and pEGFP-N1-shRNAR-LLGL2 were indicated in the Supplementary Table S2. Transfection of the lentiviral harboring the short hairpin RNAs (shRNA) targeting LLGL2 into Hep3B as well as HCCLM3 cells was performed as per the protocol provided by the manufacturer. The Hep3B and HCCLM3 cells transfected with an empty vector served as the controls. The lentivirus transfection efficiency herein was >90%. The stably transfected lentivirus cell cells were utilized in the downstream experiments. Hep3Bsh2 and HCCLM3sh3 cells were transiently transfected shRNA resistant-LLGL2 plasmid by using Lipofectamine 2000 (Invitrogen, Carlsbad, CA, USA) and analyzed 48h after transfection.Hep3BNC and Hep3Bsh2 cells were tested by genome sequencing (GeneChem, Shanghai, China).
MTT and Colony Formation Assessments
To explore the cell proliferation level, we inoculated 5×10³ cells/well of Hep3B as well as HCCLM3 infected cells into 96-well plates. Six wells of every group were assessed daily. We treated the cells with 100μl fresh medium added MTT 0.5 mg/ml (Sigma, USA), followed by incubation at 37°C for 4 hours. After wards, the cells were suspended in 100μl of DMSO and subsequently shaken for 10 minutes at room temperature. The absorbance was determined at 570 nm. In the colony formation assessment, cells were planted into 35mm dishes (5×10² cells/dish) and incubated at 37°C for 2 weeks. Crystal violet staining was performed to examine the colony formation.
For rescue assays, Hep3Bsh2 and HCCLM3sh3 cells transiently transfected shRNA resistant-LLGL2 plasmid (Hep3Bsh2+LLGL2-shR, HCCLM3sh3+LLGL2-shR). Cells were seeded as above. The proliferation capacity was detected by MTT and colony formation.
The intracellular Ca2+ chelator BAPTA/AM and PI3K inhibitor ADZ8186 was purchased from Selleckchem (Houston, TX, USA). Hep3BNC and HCCLM3NC cells were treated with BAPTA/AM (20 μM) or ADZ8186 (30μM), and then the proliferation capacity was detected by MTT and colony formation. Experiments were conducted in triplicate.
Wound Healing and Transwell Assessment In Vitro
Wound Healing and Transwell invasion assessments were employed to determine the migration capacity of HCC cells knockdown LLGL2. In the Wound Healing assessment, Hep3B and HCCLM3 infected cells were inoculated into dishes and allowed to grow for 1 day. The cells grew to 90% confluence and then three scratch lines were made with a 10ul pipette tip. After wards, the rate of closure was explored after cultured for 24 or 48 hours. In the Transwell invasion analysis, we planted 1×10⁵ cells into the upper compartment of the insert with Matrigel coated membrane (BD Biosciences, Franklin Lakes, NJ), followed by incubation at 37°C for 24 hours. Thereafter, the cells as well as the gel in the upper compartment were carefully removed and staining of the cells which adhered to the underside of the membrane was performed using 0.1% crystal violet as well as 20% methanol. We counted the cell numbers using an inverted microscope (Olympus, Japan). For rescue assays, the migration capacity of Hep3Bsh2+LLGL2-shR and HCCLM3sh3+LLGL2-shR cells was detected as above. The migration capacity of HCC cells treated with BAPTA/AM or ADZ8186 was evaluated. The assays were replicated thrice in each experimental group.
Tumor Formation and Metastasis Assessment In Vivo
The orthotopic HCC mouse model was developed as described before (34). Briefly, Hep3Bsh2, Hep3BNC and HCCLM3sh3, HCCLM3NC were administered subcutaneously into the left upper flank areas of the nude mouse (male, BALB/c, 3-4 weeks old). The size of the subcutaneous tumor was computed and recorded weekly using a Vernier caliper as indicated: tumor volume (mm3) = (L × W2)/2, (L: long axis; W: short axis), the measurements were repeated thrice. After 1 month, the subcutaneous tumor tissues were harvested and sectioned into commensurate segments of about 1 mm3. After that, we implanted each segment into the liver (n=5 mice/group). Following the elapse of 6 weeks after implantation, we sacrificed the mice, and the size for the tumors was computed at autopsy and volume (V) was computed via the formula: V=(L × W2)/2. Harvesting of the livers as well as the lungs from the sacrificed mice was done, followed by fixation using phosphate-buffered neutral formalin. Thereafter, histopathological analysis of the serial segments was performed via H&E (hematoxylin and eosin) staining, and the specialized pathologists recorded the metastatic foci. Subsequently, the tumor metastasis rate was compared between the groups of each panel. The mice were housed and manipulated as per the protocols which were approved by the Medical Experimental Animal Care Commission of West China Hospital of Sichuan University.
Transcriptome Sequencing
RNA samples of Hep3BNC and Hep3Bsh2 cells were subjected to transcriptome sequencing. The transcriptome sequencing experiments were performed by GeneChem (Shanghai, China).
Intracellular Calcium Measurements
Due to Hep3B and HCCLM3 cells were transfected with green fluorescence protein (GFP), the Rhodamine 2 indicator Rhod2 (YEASEN, Shanghai, China) was used to measure intracellular calcium. It emited an extensive fluorescence (λ = 578 nm) when it binded to the ion and after having been subjected to excitation λ = 549 nm. According to the manufacturer protocols, Hep3BNC, Hep3Bsh2,HCCLM3NC and HCCLM3sh3 cells were exposed to Rhod2 (5μM)for 30min at 37°C and protected from light. Then, a fluorescence microscope (Olympus BX 60 fluorescence microscope, Japan) was employed to acquire the images. And fluorescence intensity measured by Ultra Multifunctional Microplate Reader at 549nm and 578 nm. For rescue assays, the fluorescence intensity of Hep3Bsh2+LLGL2-shR and HCCLM3sh3+LLGL2-shR cells was detected as above.
Statistical Analyses
SPSS 21.0 software along with GraphPad Prism software were used to statistical analyses. Data were indicated as the mean ± SEM from at least three independent experiments. The Student’s t test was employed to assess the differences between two groups and variables data were assessed by Pearson χ2 or Fish exact test. The Kaplan-Meier approach was employed to generate the OS as well as DFS curves, and the log-rank test was employed to explore the survival differences between the high-LLGL2 expression group and low-LLGL2 expression group. Univariate along with the multivariate analyses were assessed using the Cox proportional hazards regression model to validate the independent risk factors. P< 0.05 signified statistical significance.
Results
LLGL2 Was Overexpression in HCC Cell Lines and HCC Tissues
The GEPIA online analysis tool was utilized to explore the mRNA expression of LLGL2 in 369 HCC tissues as well as 50 normal liver tissues derived from the TCGA web data resource. The box plots demonstrated that mRNA expression of LLGL2 in HCC was overexpressed in contrast with their normal tissues (Figure 1A). To explore the expression of LLGL2 in HCC tissues and cells, qRT-PCR assays were conducted. Compared with L02 cells, which are immortalized human normal liver cells, LLGL2 mRNA was overexpressed in HCC cells (Figure 1B). To confirm the up-regulation of LLGL2, qRT-PCR was applied to analyze the LLGL2 expression in 30 pairs of HCC tissues and their matching ANLTs. LLGL2 expression was remarkably higher in the HCC tissues in contrast with that of ANLTs. Moreover, the median fold-change was 4.25 (Figure 1C). Furthermore, western blot was employed to analyze the levels of LLGL2 proteins in cell lines and tissues. Consistent with the results of qRT-PCR analysis, LLGL2 protein was overexpressed in HCC cells than in L02 cells (Figure 1D). It was also remarkably up-regulated in HCC tissues in contrast with ANLTs (Figure 1E).
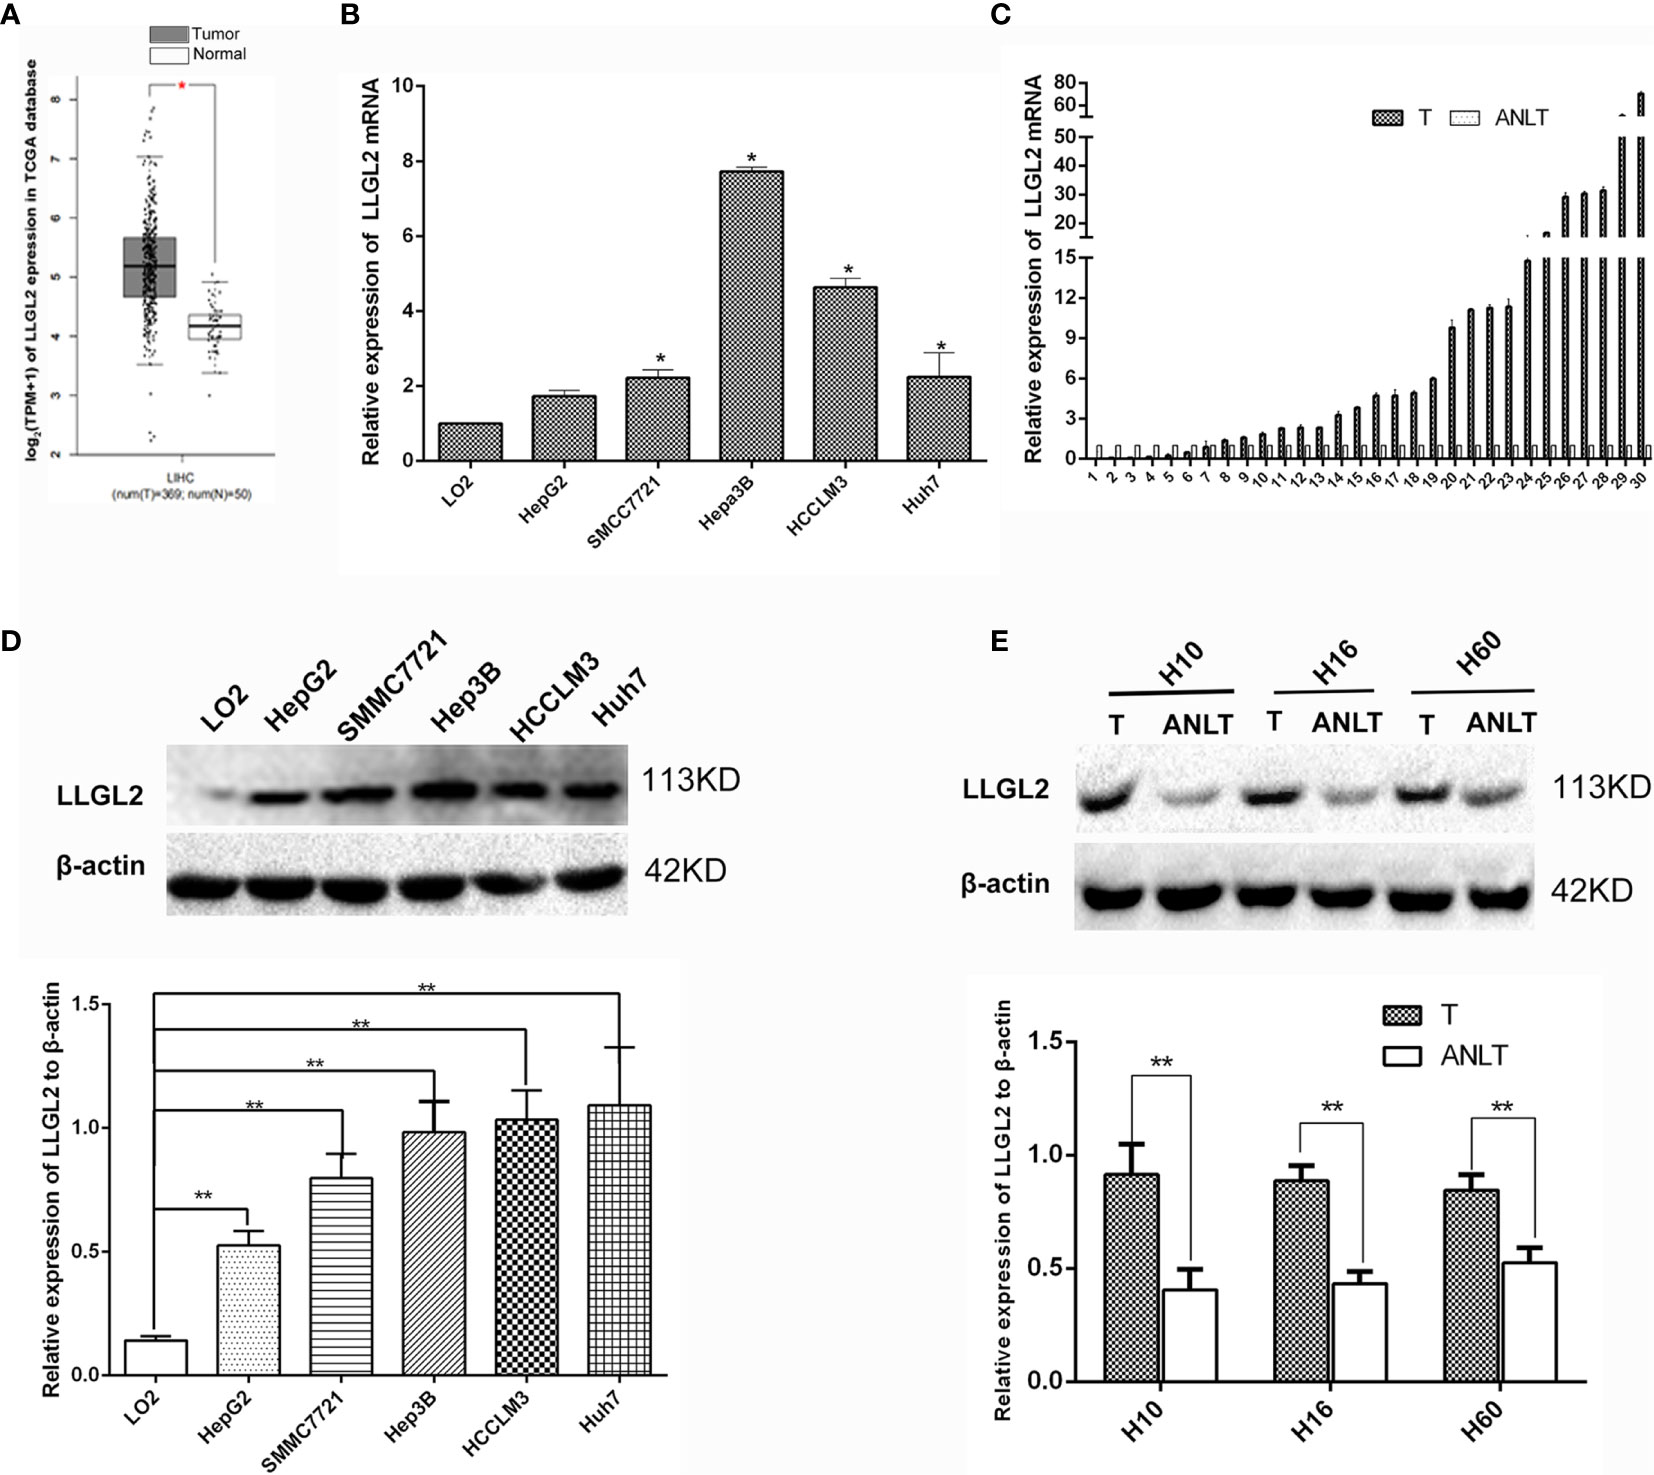
Figure 1 LLGL2 was highly expressed in HCC tissues and cells. (A) LLGL2 mRNA level of HCC patients from TCGA database were analyzed by using the GEPIA web tool. (B) The expression levels of LLGL2 mRNA in HCC cell lines were detected by quantitative real-time PCR (qRT-PCR). (C) LLGL2 mRNA expression levels were up-regulated compared with the adjacent nontumorous liver tissues (ANLTs) in 30 pairs of HCC tissues. Fold change was analyzed using the formula 2-(ΔΔCT). (D) LLGL2 protein expression in HCC cell lines was detected by western blot. (E) LLGL2 protein expression in HCC tissues and ANLTs. GAPDH and β-actin was used as a loading control. * P<0.05; **P<0.01.
LLGL2 Was Related to Poor Clinicopathologic Features and Prognosis in HCC Patients
In order to further confirm this finding, we used 156 HCC samples from three centers to analyze LLGL2 expression levels by immunohistochemistry (IHC) assay. The findings demonstrated that LLGL2 was overexpressed in HCC tissues in contrast with the matched ANLTs (adjacent nontumorous liver tissues) and LLGL2 protein was located in the cytoplasmic (Figures 2A–D).Then, on the basis of the IHC results, the patients were cluster in to the high expression group (n=98) as well as the low expression group (n=58). We evaluated the relationship of LLGL2 expression with clinicopathologic characteristics of HCC patients. The data demonstrated that LLGL2 expression is linked to tumor number (P<0.001), vascular infiltration (P<0.001), Edmondson-Steiner grade (P=0.013), Barcelona Clinic Liver Cancer (BCLC) Stage (P<0.001) (Table 1). The univariate analysis and subsequent multivariate survival assessment via the Cox proportional hazards model identified tumor number (Hazard ratios (HR): 2.378 P=0.012), vascular infiltration (HR:3.218, P=0.029), and LLGL2 expression (HR: 3.018, P=0.025) as independent risk indicators of Overall Survival (OS) (Table 2). The tumor number (HR: 3.375, P=0.013), vascular infiltration (HR: 4.129, P=0.017) and LLGL2 expression (HR: 3.010; P=0.037) were validated as independent risk indicators for Disease Free Survival (DFS) (Table 3).
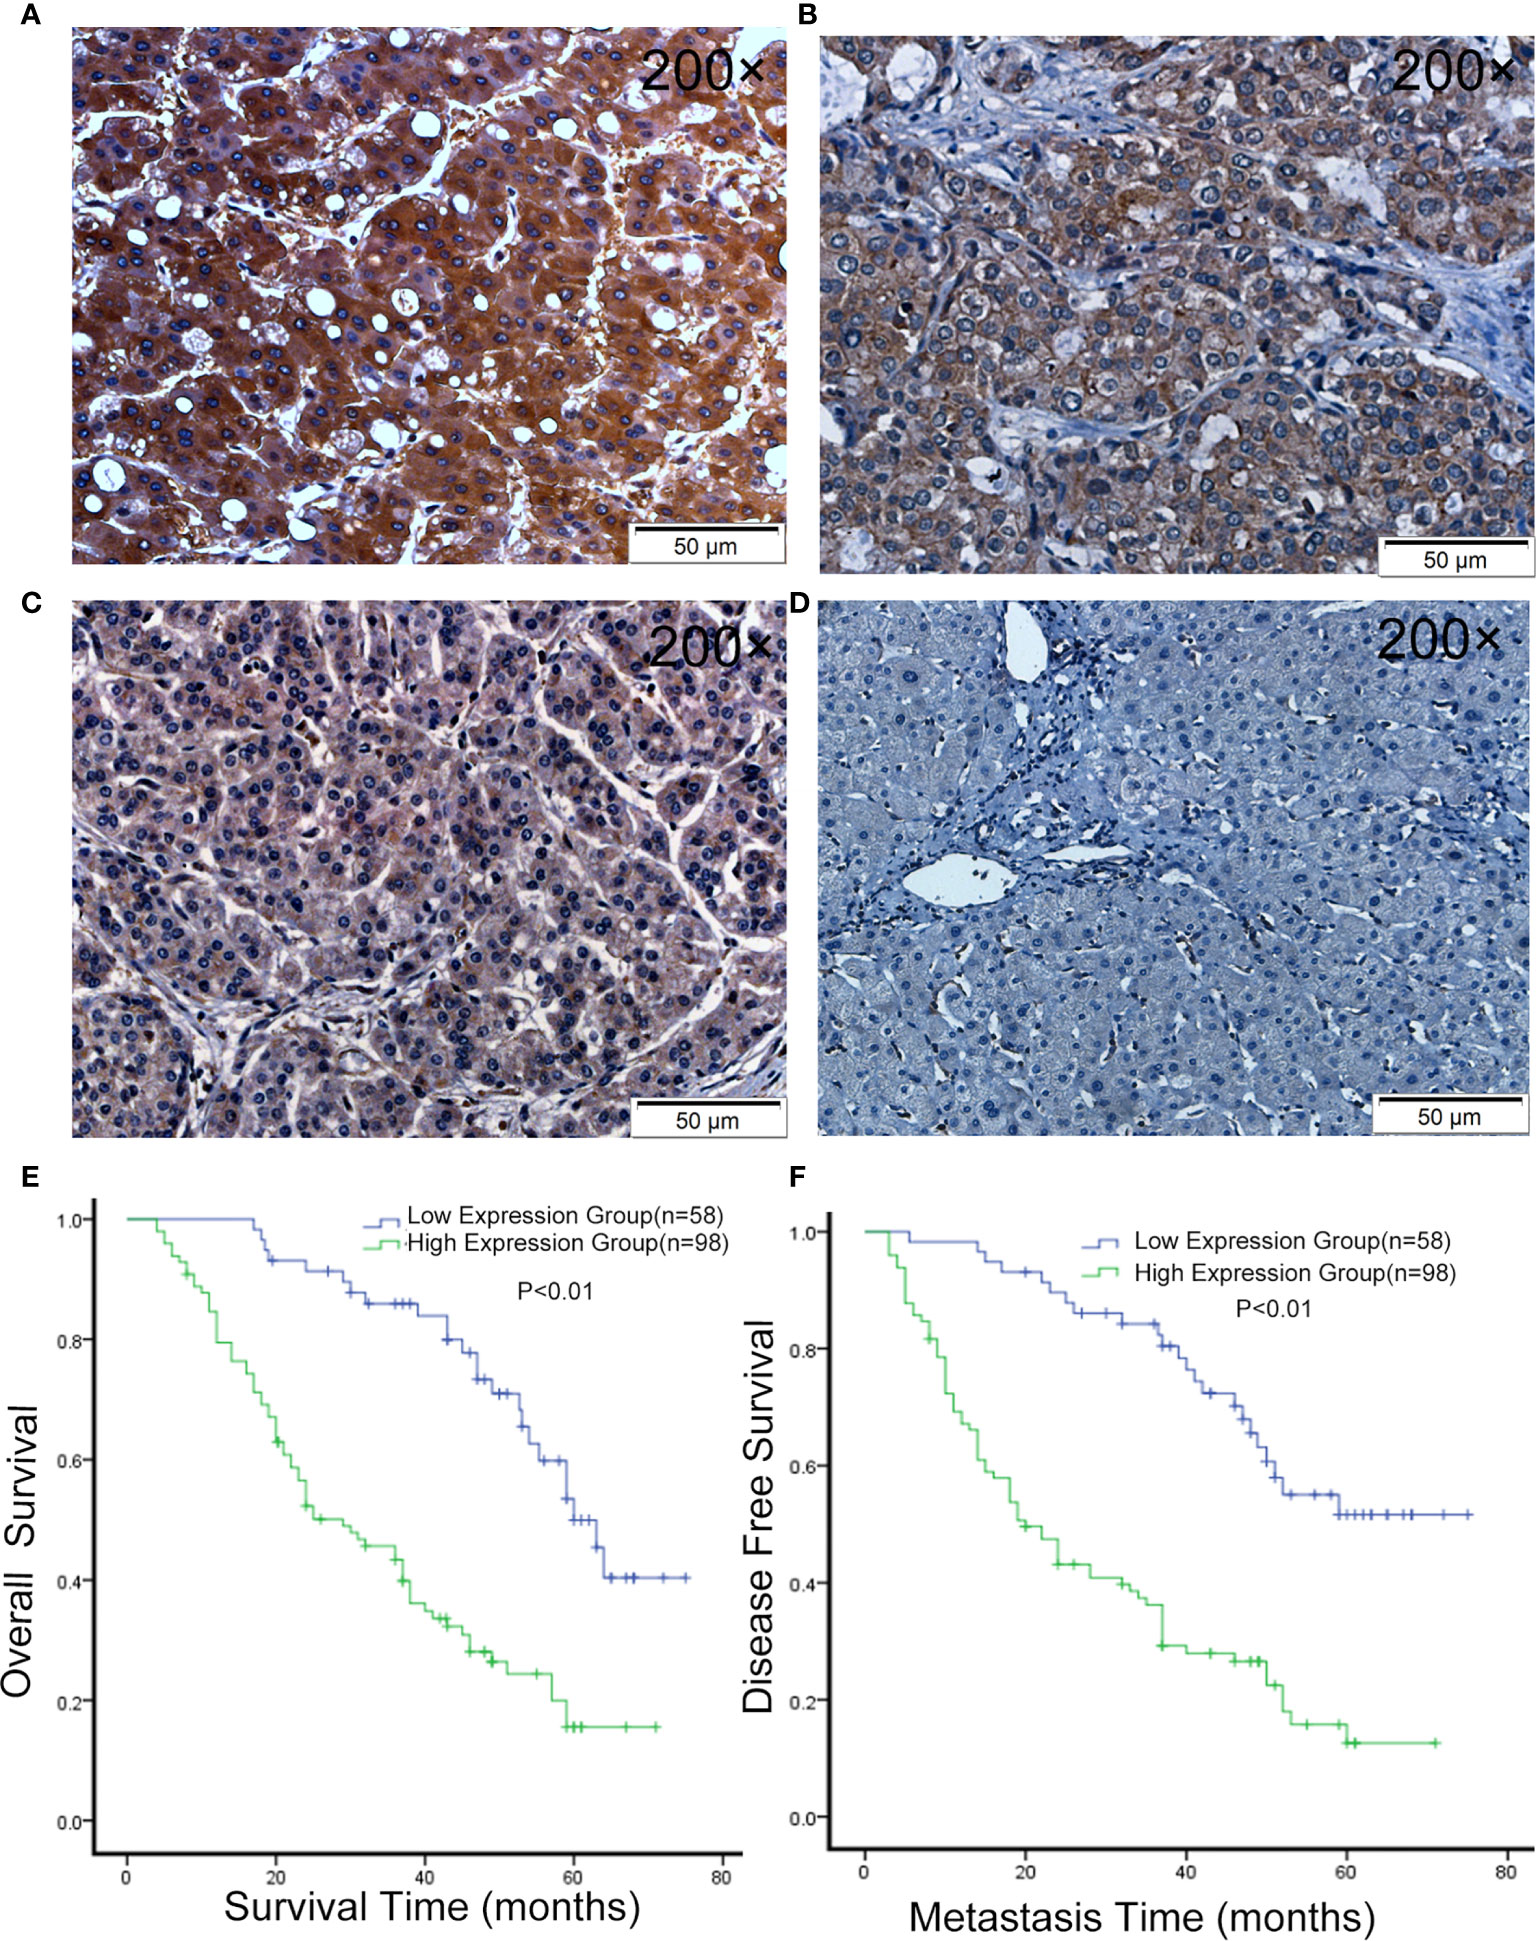
Figure 2 LLGL2 expression was up-regulated in HCC and was associated with poor prognosis. (A–C) Representative IHC images of LLGL2 expression in HCC tissues. (D) Representative IHC images of LLGL2 in ANLT. (E) The overall survival time of LLGL2 high expression group was significantly poorer than LLGL2 low expression group (P<0.01). (F) LLGL2 high expression group also had poorer disease-free survival than LLGL2 low expression group (P<0.01).
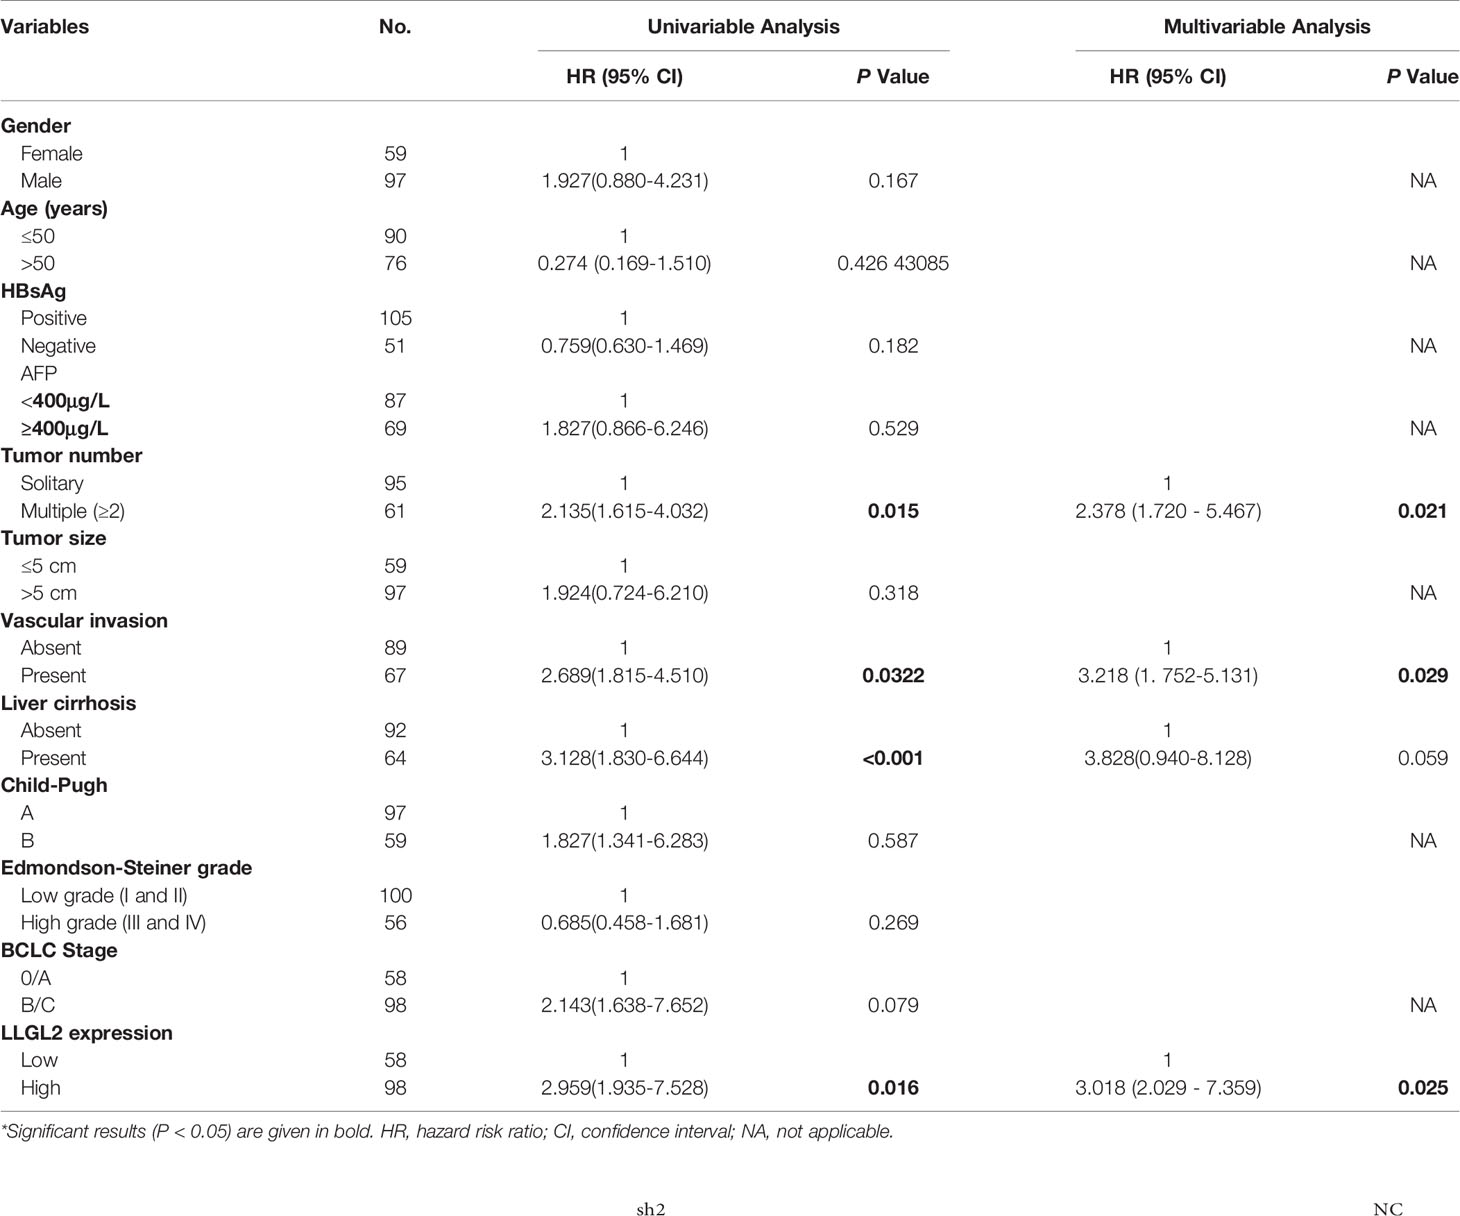
Table 2 Univariable and multivariable analysis of overall survival (OS) and LLGL2 by Cox proportional hazards regression Model.

Table 3 Univariable and multivariable analysis of disease-free survival (DFS) and LLGL2 by Cox proportional hazards regression model.
Herein, the tumor relapse rate was 65.4%(102/156). Kaplan-Maier assessment demonstrated that OS rate was remarkably lower in HCC patients overexpressing LLGL2 relative to those with low expression of this protein (Figure 2E). DFS rates were similarly lower in the LLGL2 high expression group (Figure 2F). Meanwhile, the one-, three-, five-year OS rates in LLGL2 high-expression group was remarkably lower compared to the LLGL2 low-expression group (56% vs. 93%;28% vs. 74%;17% vs. 36%,respectively, P<0.01), and the 1, 3, 5 years DFS rates in the LLGL2 high-expression group was also lower in contrast with that of the low-expression group (47% vs. 90%; 26% vs. 62%; 10% vs. 45%, P<0.01).
LLGL2 Promoted HCC Cell Proliferation, Invasion and Metastasis In Vitro
To further investigate the role of LLGL2 in the cell growth, invasion as well as metastasis in vitro and in vivo, Hep3B cells was infected with control (shRNA control) or LLGL2 silencing lentivirus (shRNA1,shRNA2,shRNA3). qRT-PCR along with the western blot analysis were employed to validate the knockdown efficiency. The results showed that the LLGL2-shRNA2 and LLGL2-shRNA3 could significantly reduce LLGL2 expression (Figure 3A). Then, we focused on characterizing the function on LLGL2 on proliferation as well as the migration of HCC cells.
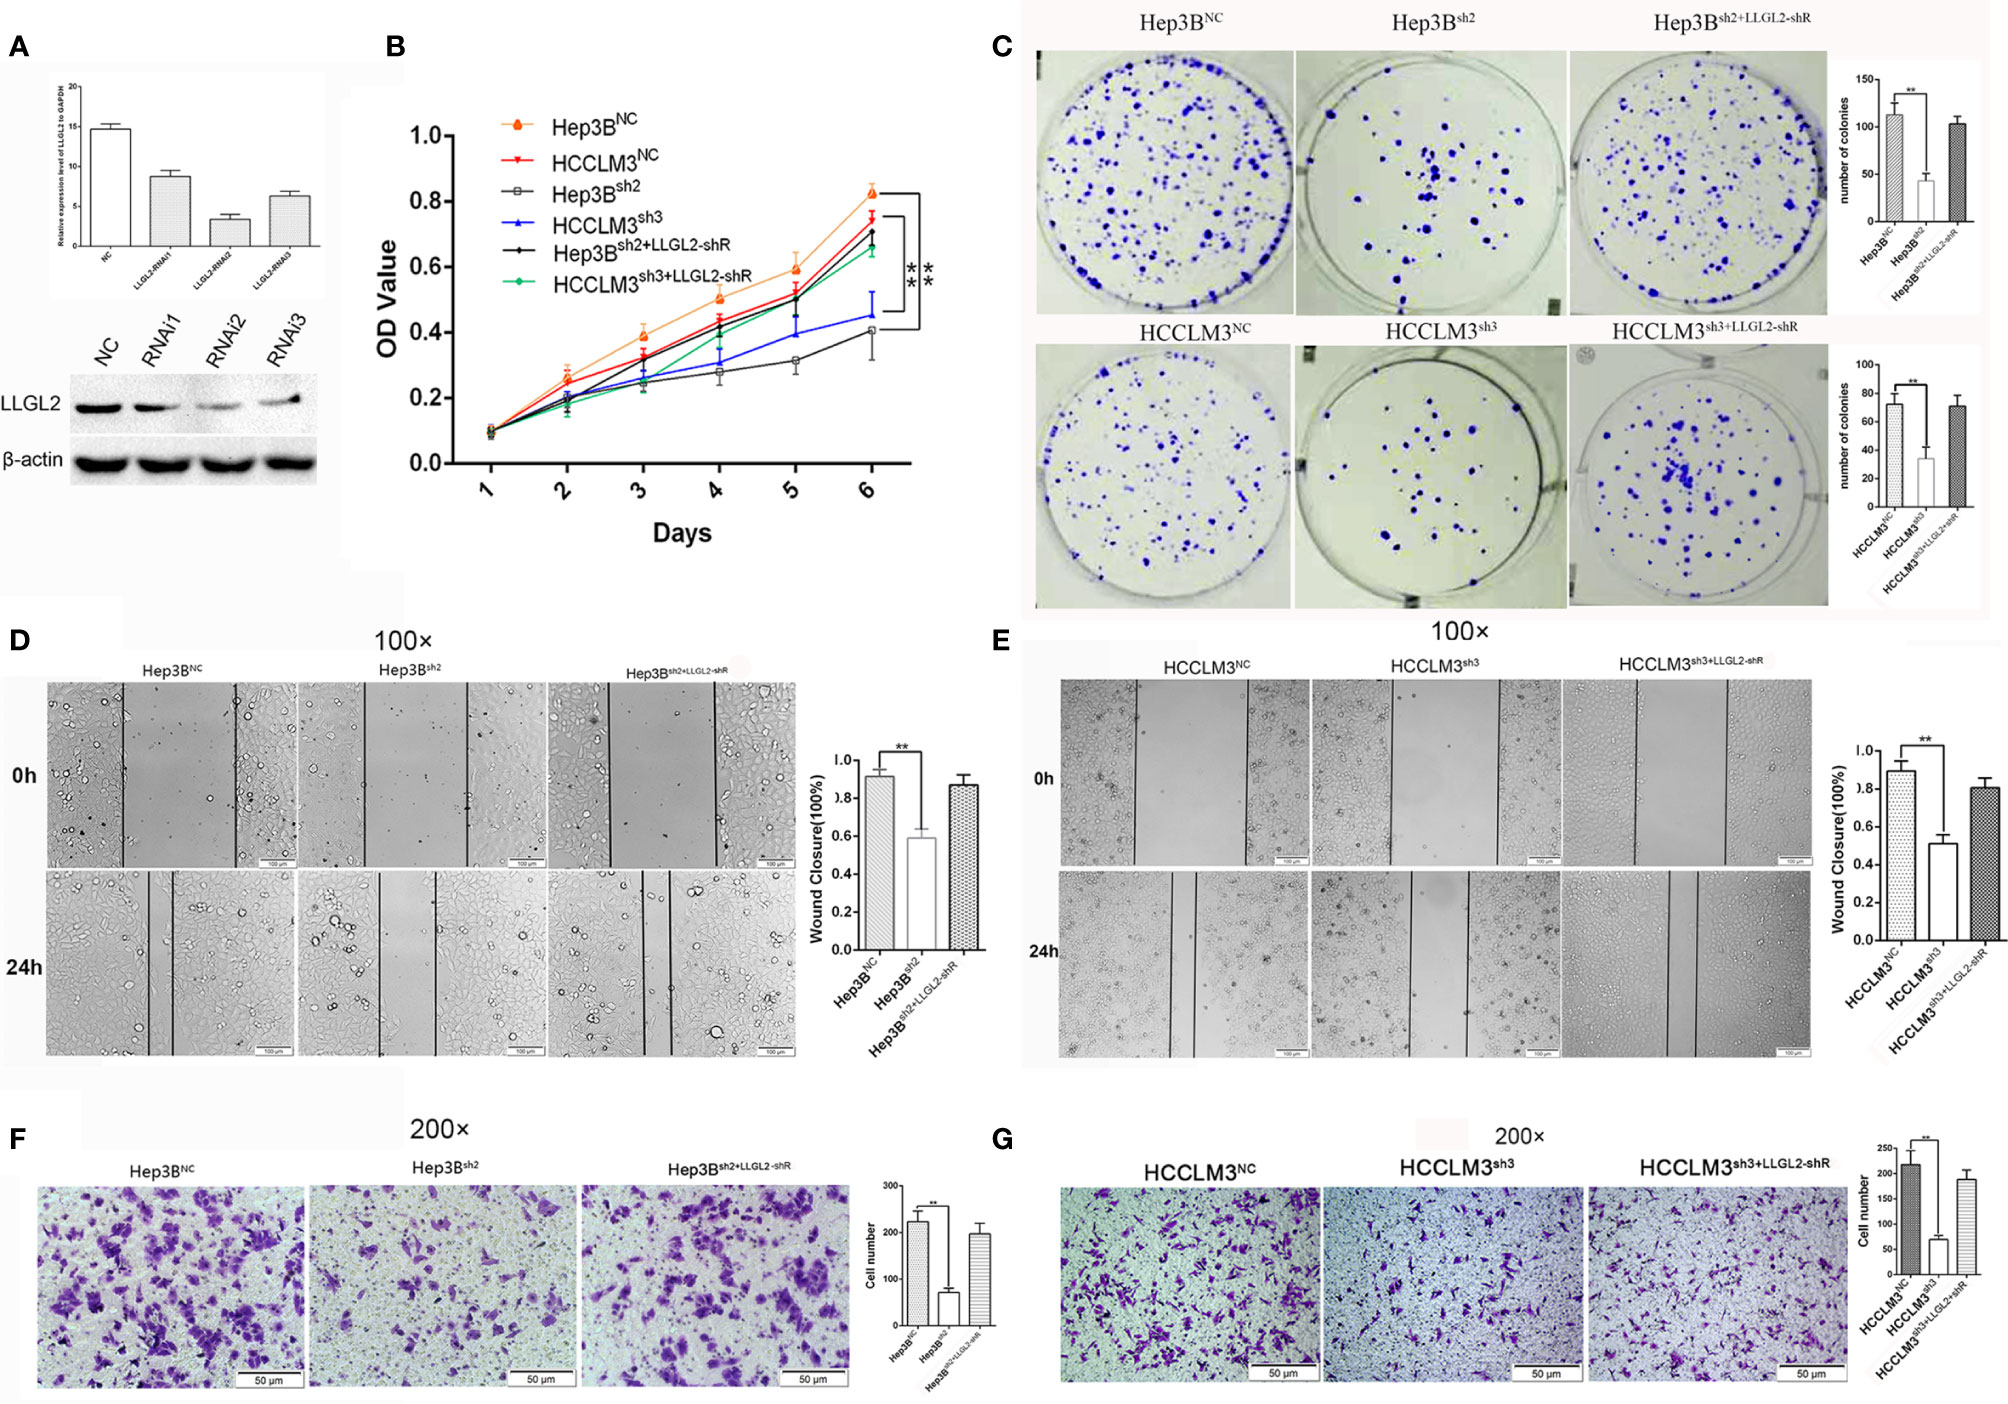
Figure 3 LLGL2 promoted proliferation and migration of HCC in vitro. HCC cells infected with or without LLGL2 knockdown lentivirus and then co-transfected with shRNA-resistant LLGL2 (LLGL2-shR). (A) The efficiency of LLGL2 knockdown in HCC Hep3B cells was assessed by qRT-PCR and western blot. LLGL2sh2 and LLGL2sh3 were selected for further study. (B, C).The proliferation capacity of HCC cells were detected by MTT and colony formation assays The proliferation of Hep3Bsh2 and HCCLM3sh3 were significantly weaker compared to control Re-expression of LLGL2-shR restored HCC cells proliferation capacity.(D, E) The closure of Hep3Bsh2 and HCCLM3sh3 were significantly slower compared to control, and Re-expression of LLGL2-shR restored HCC cells migration capacity (F, G) The migration capacity of Hep3Bsh2 and HCCLM3sh3 were weaker than control, and The migration capacity was restored after re-expression of LLGL2-shR. **P<0.01 based on the Students test. Error bars, standard deviation.
The cell proliferation was evaluated via the MTT assay as well as colony formation assay. Compared to Hep3BNC or HCCLM3NC cells, LLGL2 knockdown decreased the proliferation of Hep3B or HCCLM3 cells (Figure 3B). Similar to the cell growth data, LLGL2 knockdown cells formed markedly fewer as well as smaller colonies in contrast with the control cells as indicated in Figure 3C. Then, we explored the influences of LLGL2 on cell migration by wound healing and transwell analyses. The results revealed that Hep3Bsh2 or HCCLM3sh3 cells closed at a much slower rate and were less invasive relative to that of Hep3BNC or HCCLM3NC cells as indicated in Figures 3D–G. Next, we tested whether overexpression of shRNA-resistant LLGL2 restored proliferation and migration capacity in HCC/shLLGL2 cells by transfecting HCC/shLLGL2 cells with pEGFP-N1-shRNAR-LLGL2 or pEGFP-N1. The results showed that overexpression of shRNA-resistant LLGL2 restored HCC/shLLGL2 capacity of proliferation and migration (Figures 3D–G). These data implied that LLGL2 might facilitate the proliferation as well as the invasion potentialities of HCC cells.
LLGL2 Promoted Tumorigenicity In Vivo Xenograft Tumor Model
To further verify our results in vitro, we constructed models of orhtotopic xenograft tumors. Consequently, the tumors derived from the Hep3Bsh2 cells were smaller, at the same time grew at a slower rate in contrast with the Hep3BNC cell-derived tumors (Figure 4A). The tumors derived from the HCCLM3sh3 cells were also smaller and similarly grew at a slower rate in contrast with the control (Figure 4B). More significantly, in contrast with the control group, the intrahepatic and lung metastasis rates were decreased (Figures 4C, D). These data implied that LLGL2 could facilitate the metastatic potential of HCC in vivo.
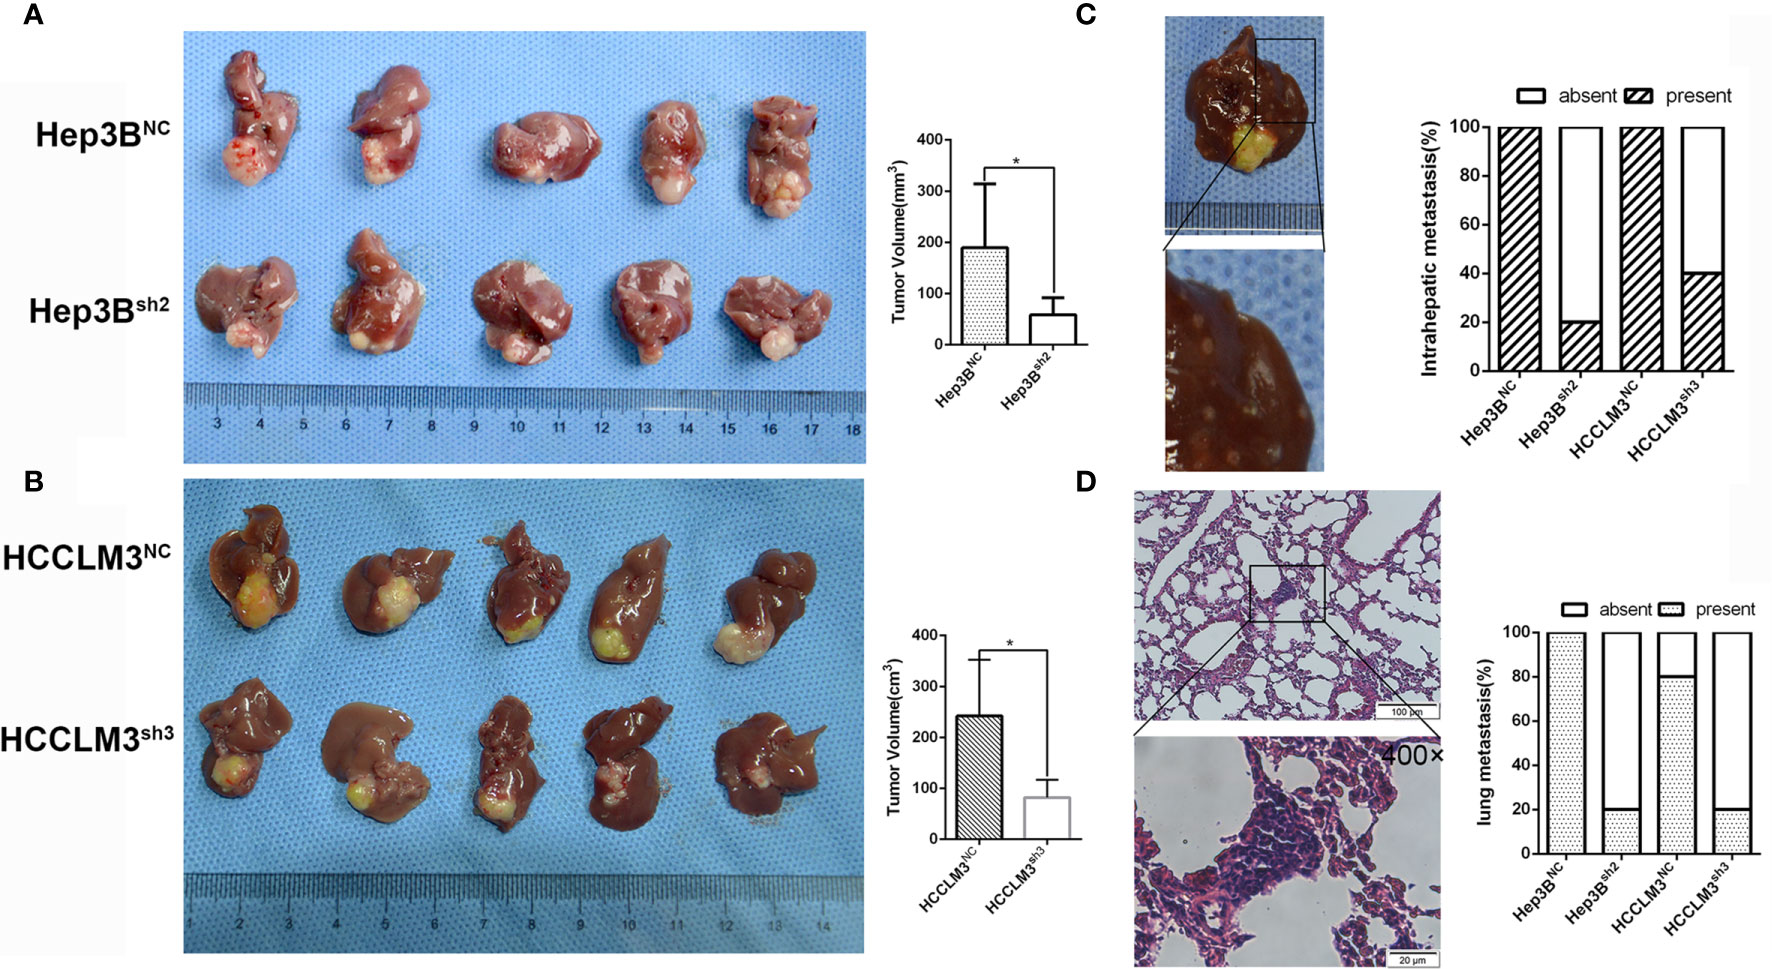
Figure 4 LLGL2 promoted HCC progression in vivo. The orthotopic HCC tumors transplantation model was established by using Hep3Bsh2, HCCLM3sh3 cells and control cells. (A) The results showed that tumor volumes of Hep3Bsh2 group were significantly smaller than that of Hep3BNC group. (B) The results showed that tumor volumes of HCCLM3sh3 group were significantly smaller than that of HCCLM3NC group. (C, D) Representative pictures of intrahepatic, lung metastasis; metastatic nodules proportion or lungs was calculated and compared. The rate of intrahepatic and lung metastasis in experiment groups were higher compared to control group. *P<0.05 based on the Students test. Error bars, standard deviation.
LLGL2 Was Linked to the PI3K/Akt Signaling Cascade by Enhancing Ca2+ Influx in HCC
Previous studies reported that LLGL2 participates in the epithelial-mesenchymal transition (EMT) (25).We analyzed the LLGL2 and EMT markers (Vimentin and E-cadherin) expression in the same human HCC tissue microarrays slides. The data demonstrated that LLGL2 expression was irrelevant with EMT in HCC (Figure 5A). To determine the molecular pathways associated with LLGL2-deficiency, we decided to investigate the gene expression profiles of Hep3B cells with LLGL2-deficiency through transcriptome sequencing (RNA-seq). Among the 19296 genes analyzed, 107 genes were up-regulated, whereas 281 genes was down-regulated (Figure 5B). The pathway analyses of these genes that were differentially expressed with the Kyoto Encyclopedia of Genes and Genomes (KEGG) point to the enrichment of the genes in the pathways associated with calcium ion binding, transmembrane signaling receptor activity (Figure 5C). Furthermore, PathCards data and literature reviews suggested that LLGL2 was involved in PI3K/AKT signaling pathway (35–37). Therefore, we speculated that LLGL2 might promote HCC progression through PI3K/AKT signaling cascade by enhancing Ca2+ influx in HCC. To confirm this hypothesis, we analyzed the Hep3B and HCCLM3 intracellular Ca2+ by using calcium indicator Rhod2-AM. Compared to the Hep3B or HCCLM3 control cells, the fluorescence intensity in the Hep3Bsh2 and HCCLM3sh3cells were weaker (Figure 5D). After Rhod2 treatment, the fluorescence intensity of the Hep3Bsh2 and HCCLM3sh3 cells was lower in contrast with that of the control (Figure 5E). Next, we detected fluorescence intensity of HCC/shLLGL2 cells which transiently transfected shRNA-resistant LLGL2.The results showed that the fluorescence intensity was restored in overexpression of shRNA-resistant LLGL2 HCC cells (Figures 5D, E).These results indicated that LLGL2 could increase Ca2+ influx in HCC cells. Then, we tested the AKT, p-AKT, PI3K and p-PI3K expressions via western blotting. The results demonstrated that p-PI3K and p-AKT expressions were significantly reduced in the LLGL2 knockdown Hep3B and HCCLM3 cells (Figure 5F). Furthermore, we treated HCC control cells with intracellular chelator BAPTA/AM or PI3K inhibitor ADZ8186. The results showed that the proliferation and migration ability of HCC cells decreased after treated with BAPTA/AM or ADZ8186 (Figures 6A–E). Overexpression of shRNA-resistant LLGL2 restored p-PI3K and p-AKT expressions via western blotting (Figure 6F). p-PI3K and p-AKT expressions were significantly reduced after treated with BAPTA/AM or ADZ8186 (Figure 6F). Taken together, these data showed that LLGL2 might be linked to the PI3K/Akt signaling axis by facilitating Ca2+ influx in HCC.
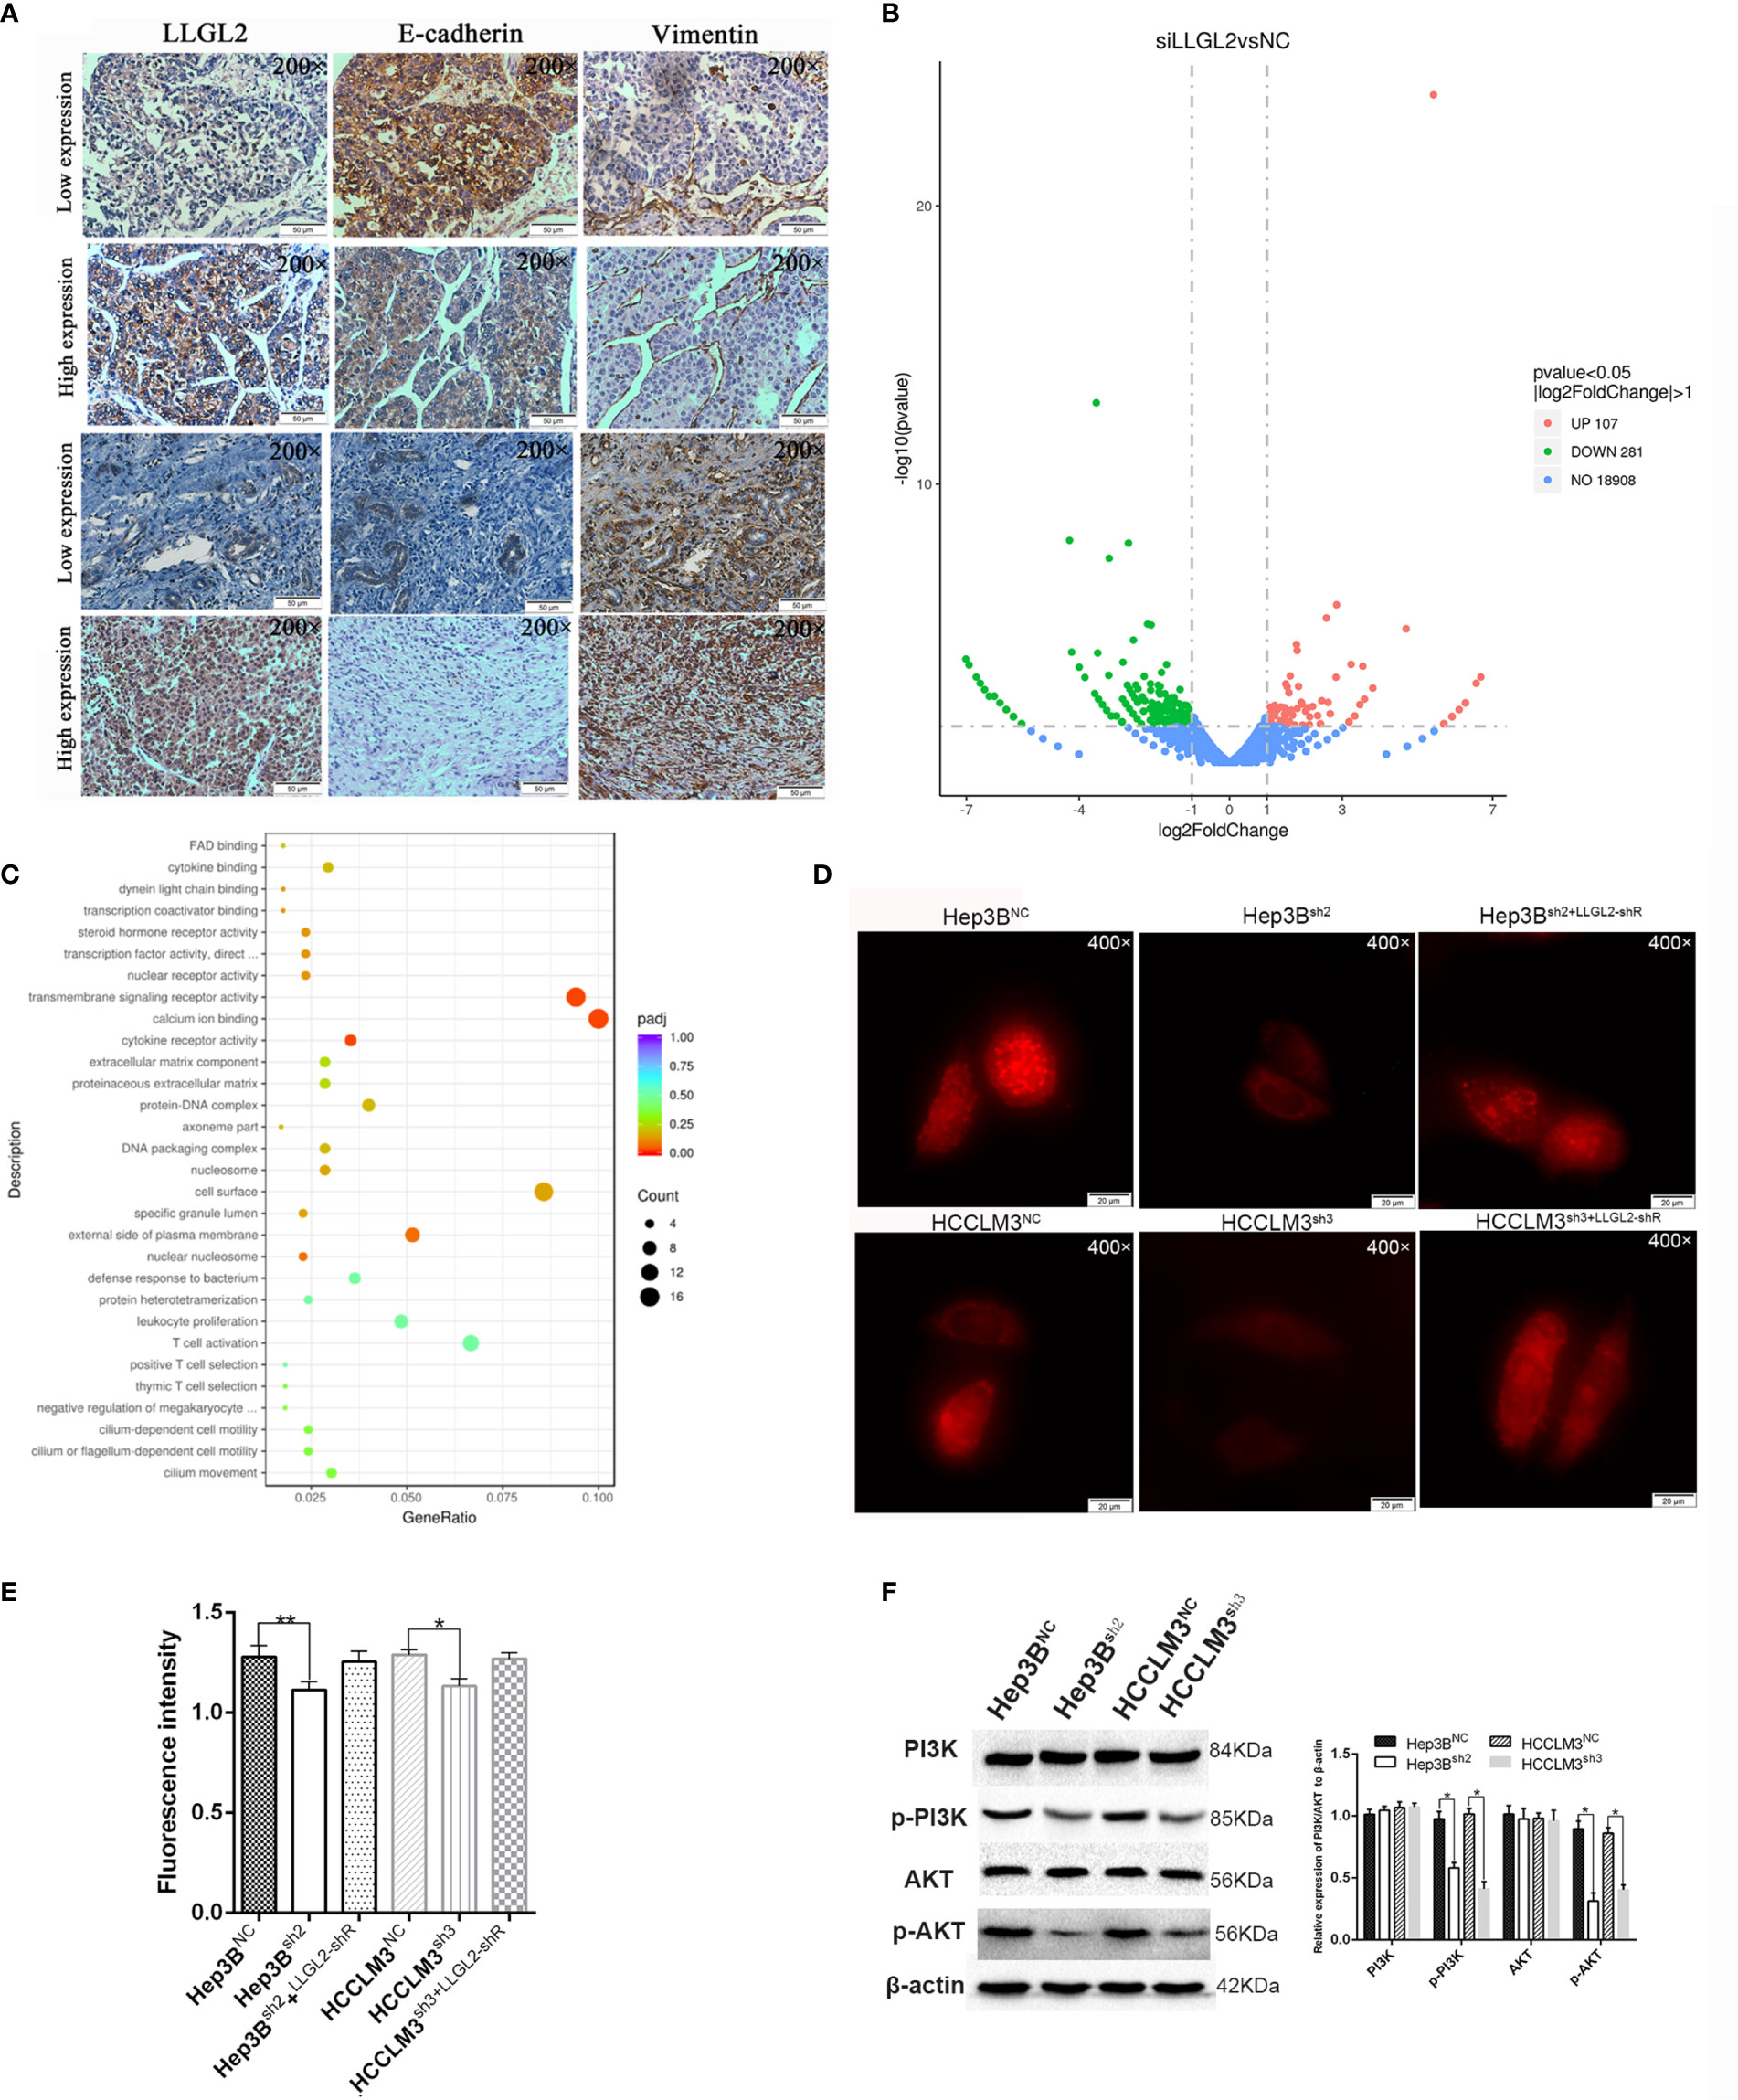
Figure 5 LLGL2 activated the Ca2+/PI3K/AKT signing pathway in HCC. (A) The expression of LLGL2 in HCC was not correlated with EMT in HCC tissues. LLGL2 and EMT biomarkers (E-cadherin, vimentin) were detected by IHC in HCC tissue microarrays. (B) Gene expression analysis of Hep3B cells in response to siRNA mediated depletion of LLGL2. (C) Transcriptome sequencing analysis for LLGL2 knockdown HCC cells. Relevant signaling pathways modulated by LLGL2 were assessed using Kyoto Encyclopedia of Genes and Genomes (KEGG) pathway enrichment analysis. (D) The concentration of Ca2+ in Hep3B and HCCLM3 cells measured with Rhod2,Images (×400) were captured on fluorescence microscope (Olympus BX 60 fluorescence microscope, Japan).(E) Quantification of Hep3BNC, HCCLM3NC or Hep3Bsh2, HCCLM3sh3 fluorescence intensity measured by Ultra Multifunctional Microplate Reader at 549 and 578 nm. (F) PI3K/AKT signaling pathway was suppressed by knockdown of LLGL2 through Western blotting. *P < 0.05. **P < 0.01.
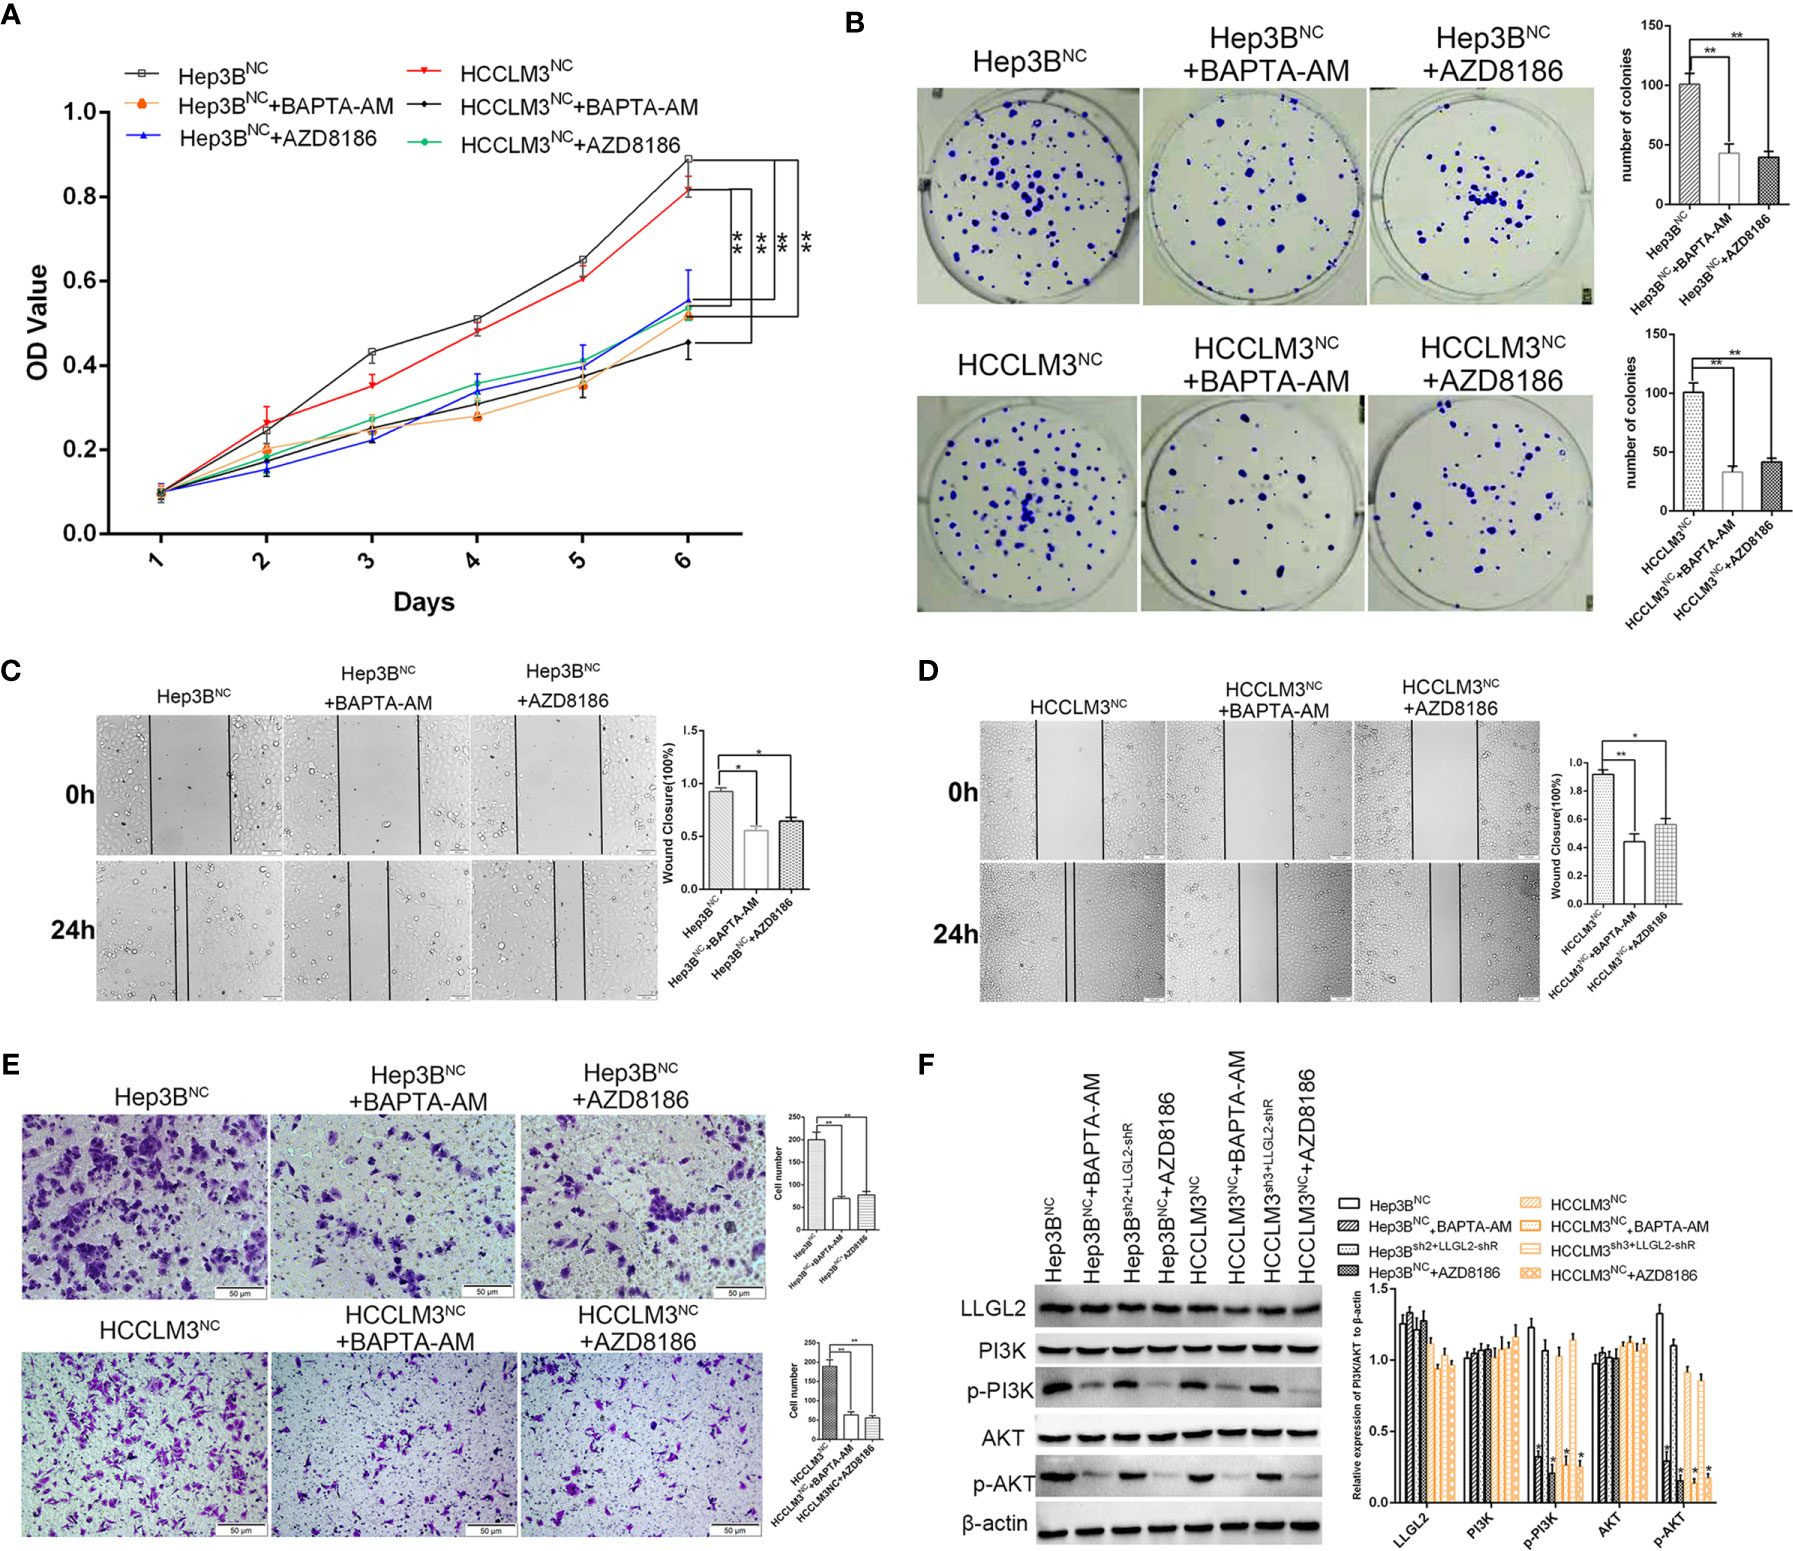
Figure 6 Molecular mechanism studies of LLGL2 roles in Ca2+/PI3K/AKT signing pathway combined inhibition. HCC cells of negative control treated with calcium chelators BAPTA-AM or with PI3K inhibitor AZD8186. (A, B)The proliferation capacity of HCC cells were detected by MTT and colony formation assays. The proliferation capacity of Hep3BNC and HCCLM3NC became weaker after treated with BAPTA-AM or AZD8186. (C, D) HCC cells treated with BAPTA-AM or AZD8186, the closure of cells were significantly slower compared to control. (E) The migration capacity of HCC cells treated with BAPTA-AM or AZD8186 were weaker than control. (F) HCC negative control cells co-transfected with shRNA-resistant LLGL2 (LLGL2-shR).The Western blotting results showed that LLGL2 activated Ca2+/PI3K/AKT signaling pathway. *P<0.05; **P<0.01 based on the Students test. Error bars, standard deviation.
Discussion
The results from this study suggest that LLGL2, the polarity gene, is a potential metastasis promoter of HCC, which may activate PI3K/Akt signaling by increasing intracellular calcium ions. We established for the first time that LLGL2 mRNA and protein were remarkably overexpressed in the HCC tissues as well as liver cancer cell lines. Overexpression of LLGL2 was linked to aggressive clinicopathological characteristics consisting of tumor number, vascular infiltration as well as advanced stage, and it was one of the independent risk indicators of OS and DFS in HCC. We also found that LLGL2 facilitated HCC cell proliferation, migration in vitro. In xenograft tumor model, LLGL2 acted as a tumor promoter in Hep3B grafts and promoted the lung dissemination of HCC cells. Notably, LLGL2 was not correlated with EMT. By performing transcriptome sequencing and PathCards analysis, we found that LLGL2 might be involved in Ca2+/PI3K/AKT signaling cascade. Re-expression of shRNA resistant LLGL2 rescued the proliferation and migration capacity of HCC/shLLGL2 cells, and reactivated Ca2+/PI3K/AKT signaling pathway. Therefore, our data indicated that LLGL2 might functioned as a tumor promoter in HCC through activating PI3K/AKT signaling cascade by enhancing Ca2+ influx.
Previous studies have concluded that LLGL2 is an apical-basal polarity scaffold protein, which performs diverse biological functions including cell division, migration, proliferation, and progenitor cells self-renewal in metazoans (9–12, 21, 38, 39). Mammalian LLGL2 is required for proper branching morphogenesis during placental development, but it does not function as a tumor suppressor gene (30). In the human breast cancer, LLGL2 serves as a promoter of tumor growth by aiding breast cancer cells to overcome nutrition stress (31). Consistent with this study, our results confirmed that LLGL2 was overexpressed in the human HCC and was linked to dismal prognosis of individuals with HCC. We also established that LLGL2 facilitated proliferation, migration as well as metastasis in vitro and in vivo. Thus, LLGL2 might be valuable for the prognosis along with targeted therapy of HCC.
Cell morphology and especially EMT is closely correlated with cancer progression and metastasis (34, 40, 41). Previous studies show that LLGL2 suppresses EMT via ErbB signaling, and pen/lgl2 mutant epidermal cells results in the development of epidermal tumors (29). LLGL2 upregulates epithelial proteins, E-cadherin and CK18, and suppresses Snail-induced EMT and metastasis (25). So we detected LLGL2 and EMT markers (Vimentin and E-cadherin) in the same human HCC tissue microarrays slides. Whereas we established that LLGL2 expression was not related to EMT in HCC. For further studying the molecular mechanism of LLGL2 promoting HCC progress, transcriptome sequencing analysis showed that LLGL2 might be involved in calcium ion signaling pathway. Intracellular calcium ions (Ca2+) as second messenger regulate gene transcription (42, 43). Accumulating evidences have indicated that Ca2+ signaling plays key roles in the tumor initiation, proliferation, migration, angiogenesis and metastasis (44–47). In this study, we found that LLGL2 could increase the concentration of intracellular Ca2+. The intracellular Ca2+chelator, BAPTA-AM, significantly blocked HCC cells proliferation and migration effects. These data indicated that LLGL2 promoted Ca2+ influx, and Ca2+ signal pathway might be a critical mechanism underlying LLGL2 promoted HCC progression. Intracellular calcium is associated with various signaling pathways (44). Previous studies show that intracellular calcium can promote HCC progression by activating PI3K/AKT pathway (35, 48). It is widely recognized that PI3K/AKT signaling cascade has a vital role in tumor initiation and progression (37, 49, 50). Through analyzing PathCards data, we found that LLGL2 is involved in PI3K/AKT pathway. The p-PI3K as well as p-AKT expressions were significantly reduced after LLGL2 knockdown in Hep3B cells. Furthermore, in this study, we used PI3Kβ inhibitor AZD8186 to treat HCC cells. We showed that AZD8186 inhibited PI3K-dependent activation of AKT and exerted as anti-tumor function in HCC (Figure 6).
Taken together, our study reveals that LLGL2 function as a tumor promoter by activating PI3K/AKT signaling through promoting Ca2+ influx in HCC. Further studies are needed to deeply explore this mechanism. Our study indicated that LLGL2 might be valuable prognostic marker as well as a promising therapeutic target in HCC.
Data Availability Statement
The datasets presented in this study can be found in online repositories. The names of the repository/repositories and accession number(s) can be found in the article/Supplementary Material.
Ethics Statement
The studies involving human participants were reviewed and approved by Ethics Committee of West China Hospital of Sichuan University. The patients/participants provided their written informed consent to participate in this study. The animal study was reviewed and approved by Ethics Committee of West China Hospital of Sichuan University.
Author Contributions
Conception/design: SL, TW, and JL. Data collection and analysis: SL, TW, GQ, JS, and FX. Manuscript writing and polishing: SL, TW, and JS. All authors contributed to the article and approved the submitted version.
Funding
This study was supported by grants from the State Key Scientific and Technological Research Programs (2017ZX10203207-003-0020), the Science and Technological Supports Project of Sichuan Province (2018SZ0204 and 2019YJ0149), the Health and Family Planning Commission of Sichuan Province (17PJ393), the Science and Technology Project of Chengdu (2018-YF05-01460-SN).
Conflict of Interest
The authors declare that the research was conducted in the absence of any commercial or financial relationships that could be construed as a potential conflict of interest.
Acknowledgments
We are very grateful to Professor Jian Li for making a major contribution to the revision of the manuscript. We thank colleagues in the Pathology Department for their intellectual technical assistance.
Supplementary Material
The Supplementary Material for this article can be found online at: https://www.frontiersin.org/articles/10.3389/fonc.2021.683629/full#supplementary-material
References
1. Bray F, Ferlay J, Soerjomataram I, Siegel RL, Torre LA, Jemal A. Global Cancer Statistics 2018: GLOBOCAN Estimates of Incidence and Mortality Worldwide for 36 Cancers in 185 Countries. CA Cancer J Clin (2018) 68:394–424. doi: 10.3322/caac.21492.
2. Chen W, Zheng R, Baade PD, Zhang S, Zeng H, Bray F, et al. Cancer Statistics in China, 2015. CA Cancer J Clin (2016) 66:115–32. doi: 10.3322/caac.21338
3. Llovet JM, Zucman-Rossi J, Pikarsky E, Sangro B, Schwartz M, Sherman M, et al. Hepatocellular Carcinoma. Nat Rev Dis Primers (2016) 2:16018. doi: 10.1038/nrdp.2016.18
4. Llovet JM, Montal R, Villanueva A. Randomized Trials and Endpoints in Advanced HCC: Role of PFS as a Surrogate of Survival. J Hepatol (2019) 70:1262–77. doi: 10.1016/j.jhep.2019.01.028
5. Nelson WJ. Adaptation of Core Mechanisms to Generate Cell Polarity. Nature (2003) 422:766–74. doi: 10.1038/nature01602
6. Rodriguez-Boulan E, Nelson WJ. Morphogenesis of the Polarized Epithelial Cell Phenotype. Science (1989) 245:718–25. doi: 10.1126/science.2672330
7. Saito Y, Desai RR, Muthuswamy SK. Reinterpreting Polarity and Cancer: The Changing Landscape From Tumor Suppression to Tumor Promotion. Biochim Biophys Acta Rev Cancer (2018) 1869:103–16. doi: 10.1016/j.bbcan.2017.12.001
8. Martin-Belmonte F, Perez-Moreno M. Epithelial Cell Polarity, Stem Cells and Cancer. Nat Rev Cancer (2011) 12:23–38. doi: 10.1038/nrc3169
9. Mechler BM, McGinnis W, Gehring WJ. Molecular Cloning of Lethal(2)Giant Larvae, a Recessive Oncogene of Drosophila Melanogaster. EMBO J (1985) 4:1551–7. doi: 10.1002/j.1460-2075.1985.tb03816.x
10. Albertson R, Doe CQ. Dlg, Scrib and Lgl Regulate Neuroblast Cell Size and Mitotic Spindle Asymmetry. Nat Cell Biol (2003) 5:166–70. doi: 10.1038/ncb922
11. Betschinger J, Mechtler K, Knoblich JA. The Par Complex Directs Asymmetric Cell Division by Phosphorylating the Cytoskeletal Protein Lgl. Nature (2003) 422:326–30. doi: 10.1038/nature01486
12. Grifoni D, Garoia F, Bellosta P, Parisi F, De Biase D, Collina G, et al. aPKCzeta Cortical Loading is Associated With Lgl Cytoplasmic Release and Tumor Growth in Drosophila and Human Epithelia. Oncogene (2007) 26:5960–5. doi: 10.1038/sj.onc.1210389
13. Bilder D. Epithelial Polarity and Proliferation Control: Links From the Drosophila Neoplastic Tumor Suppressors. Genes Dev (2004) 18:1909–25. doi: 10.1101/gad.1211604
14. Grifoni D, Garoia F, Schimanski CC, Schmitz G, Laurenti E, Galle PR, et al. The Human Protein Hugl-1 Substitutes for Drosophila Lethal Giant Larvae Tumour Suppressor Function In Vivo. Oncogene (2004) 23:8688–94. doi: 10.1038/sj.onc.1208023
15. Strand D, Jakobs R, Merdes G, Neumann B, Kalmes A, Heid HW, et al. The Drosophila Lethal(2)Giant Larvae Tumor Suppressor Protein Forms Homo-Oligomers and is Associated With Nonmuscle Myosin II Heavy Chain. J Cell Biol (1994) 127:1361–73. doi: 10.1083/jcb.127.5.1361
16. Lu X, Feng X, Man X, Yang G, Tang L, Du D, et al. Aberrant Splicing of Hugl-1 is Associated With Hepatocellular Carcinoma Progression. Clin Cancer Res (2009) 15:3287–96. doi: 10.1158/1078-0432.CCR-08-2078
17. Kuphal S, Wallner S, Schimanski CC, Bataille F, Hofer P, Strand S, et al. Expression of Hugl-1 is Strongly Reduced in Malignant Melanoma. Oncogene (2006) 25:103–10. doi: 10.1038/sj.onc.1209008
18. Song J, Peng XL, Ji MY, Ai MH, Zhang JX, Dong WG. Hugl-1 Induces Apoptosis in Esophageal Carcinoma Cells Both In Vitro and In Vivo. World J Gastroenterol (2013) 19:4127–36. doi: 10.3748/wjg.v19.i26.4127
19. Biesterfeld S, Kauhausen A, Kost C, Gockel I, Schimanski CC, Galle PR. Preservation of HUGL-1 Expression as a Favourable Prognostic Factor in Pancreatic Carcinoma. Anticancer Res (2012) 32:3153–9. doi: 10.1038/onc.2011.550
20. Schimanski CC, Schmitz G, Kashyap A, Bosserhoff AK, Bataille F, Schafer SC, et al. Reduced Expression of Hugl-1, the Human Homologue of Drosophila Tumour Suppressor Gene Lgl, Contributes to Progression of Colorectal Cancer. Oncogene (2005) 24:3100–9. doi: 10.1038/sj.onc.1208520
21. Peng CY, Manning L, Albertson R, Doe CQ. The Tumour-Suppressor Genes Lgl and Dlg Regulate Basal Protein Targeting in Drosophila Neuroblasts. Nature (2000) 408:596–600. doi: 10.1038/35046094
22. Ohshiro T, Yagami T, Zhang C, Matsuzaki F. Role of Cortical Tumour-Suppressor Proteins in Asymmetric Division of Drosophila Neuroblast. Nature (2000) 408:593–6. doi: 10.1038/35046087
23. Prehoda KE. Polarization of Drosophila Neuroblasts During Asymmetric Division. Cold Spring Harb Perspect Biol (2009) 1:a001388. doi: 10.1101/cshperspect.a001388
24. Russ A, Louderbough JM, Zarnescu D, Schroeder JA. Hugl1 and Hugl2 in Mammary Epithelial Cells: Polarity, Proliferation, and Differentiation. PLoS One (2012) 7:e47734. doi: 10.1371/journal.pone.0047734
25. Kashyap A, Zimmerman T, Ergul N, Bosserhoff A, Hartman U, Alla V, et al. The Human Lgl Polarity Gene, Hugl-2, Induces MET and Suppresses Snail Tumorigenesis. Oncogene (2013) 32:1396–407. doi: 10.1038/onc.2012.162
26. Lisovsky M, Dresser K, Baker S, Fisher A, Woda B, Banner B, et al. Cell Polarity Protein Lgl2 is Lost or Aberrantly Localized in Gastric Dysplasia and Adenocarcinoma: An Immunohistochemical Study. Mod Pathol (2009) 22:977–84. doi: 10.1038/modpathol.2009.68
27. Lisovsky M, Dresser K, Woda B, Mino-Kenudson M. Immunohistochemistry for Cell Polarity Protein Lethal Giant Larvae 2 Differentiates Pancreatic Intraepithelial Neoplasia-3 and Ductal Adenocarcinoma of the Pancreas From Lower-Grade Pancreatic Intraepithelial Neoplasias. Hum Pathol (2010) 41:902–9. doi: 10.1016/j.humpath.2009.12.004
28. Imamura N, Horikoshi Y, Matsuzaki T, Toriumi K, Kitatani K, Ogura G, et al. Localization of aPKC Lambda/Iota and its Interacting Protein, Lgl2, is Significantly Associated With Lung Adenocarcinoma Progression. Tokai J Exp Clin Med (2013) 38:146–58.
29. Reischauer S, Levesque MP, Nusslein-Volhard C, Sonawane M. Lgl2 Executes its Function as a Tumor Suppressor by Regulating ErbB Signaling in the Zebrafish Epidermis. PLoS Genet (2009) 5:e1000720. doi: 10.1371/journal.pgen.1000720
30. Sripathy S, Lee M, Vasioukhin V. Mammalian Llgl2 is Necessary for Proper Branching Morphogenesis During Placental Development. Mol Cell Biol (2011) 31:2920–33. doi: 10.1128/MCB.05431-11
31. Saito Y, Li L, Coyaud E, Luna A, Sander C, Raught B, et al. LLGL2 Rescues Nutrient Stress by Promoting Leucine Uptake in ER(+) Breast Cancer. Nature (2019) 569:275–9. doi: 10.1038/s41586-019-1126-2
32. Tang Z, Kang B, Li C, Chen and Z. Zhang T. GEPIA2: An Enhanced Web Server for Large-Scale Expression Profiling and Interactive Analysis. Nucleic Acids Res (2019) 47:W556–60. doi: 10.1093/nar/gkz430
33. Xiao S, Chang RM, Yang MY, Lei X, Liu X, Gao WB, et al. Actin-Like 6A Predicts Poor Prognosis of Hepatocellular Carcinoma and Promotes Metastasis and Epithelial-Mesenchymal Transition. Hepatology (2016) 63:1256–71. doi: 10.1002/hep.28417
34. Leng S, Yang M, Zhao Y, Zhao J, Zeng Z, Yang Y, et al. PTIP Promotes Recurrence and Metastasis of Hepatocellular Carcinoma by Regulating Epithelial-Mesenchymal Transition. Oncotarget (2017) 8:58184–98. doi: 10.18632/oncotarget.16436
35. Zhang Y, Zhang T, Wu C, Xia Q, Xu D. ASIC1a Mediates the Drug Resistance of Human Hepatocellular Carcinoma Via the Ca(2+)/PI3-kinase/AKT Signaling Pathway. Lab Invest (2017) 97:53–69. doi: 10.1038/labinvest.2016.127
36. Zimmermann T, Kashyap A, Hartmann U, Otto G, Galle PR, Strand S, et al. Cloning and Characterization of the Promoter of Hugl-2, the Human Homologue of Drosophila Lethal Giant Larvae (Lgl) Polarity Gene. Biochem Biophys Res Commun (2008) 366:1067–73. doi: 10.1016/j.bbrc.2007.12.084
37. Hamzehzadeh L, Atkin SL, Majeed M, Butler AE, Sahebkar A. The Versatile Role of Curcumin in Cancer Prevention and Treatment: A Focus on PI3K/AKT Pathway. J Cell Physiol (2018) 233:6530–7. doi: 10.1002/jcp.26620
38. Raman R, Damle I, Rote R, Banerjee S, Dingare C, Sonawane M. aPKC Regulates Apical Localization of Lgl to Restrict Elongation of Microridges in Developing Zebrafish Epidermis. Nat Commun (2016) 7:11643. doi: 10.1038/ncomms11643
39. Sonawane M, Carpio Y, Geisler R, Schwarz H, Maischein HM, Nuesslein-Volhard C. Zebrafish Penner/Lethal Giant Larvae 2 Functions in Hemidesmosome Formation, Maintenance of Cellular Morphology and Growth Regulation in the Developing Basal Epidermis. Development (2005) 132:3255–65. doi: 10.1242/dev.01904
40. Thiery JP, Acloque H, Huang RY, Nieto MA. Epithelial-Mesenchymal Transitions in Development and Disease. Cell (2009) 139:871–90. doi: 10.1016/j.cell.2009.11.007
41. Savagner P. The Epithelial-Mesenchymal Transition (EMT) Phenomenon. Ann Oncol (2010) 21(Suppl 7):vii89–92. doi: 10.1093/annonc/mdq292
42. Berridge MJ, Bootman MD, Roderick HL. Calcium Signalling: Dynamics, Homeostasis and Remodelling. Nat Rev Mol Cell Biol (2003) 4:517–29. doi: 10.1038/nrm1155
43. Cui C, Merritt R, Fu L, Pan Z. Targeting Calcium Signaling in Cancer Therapy. Acta Pharm Sin B (2017) 7:3–17. doi: 10.1016/j.apsb.2016.11.001
44. Monteith GR, Prevarskaya N, Roberts-Thomson SJ. The Calcium-Cancer Signalling Nexus. Nat Rev Cancer (2017) 17:367–80. doi: 10.1038/nrc.2017.18
45. Praitis V, Simske J, Kniss S, Mandt R, Imlay L, Feddersen C, et al. The Secretory Pathway Calcium ATPase Pmr-1/SPCA1 has Essential Roles in Cell Migration During Caenorhabditis Elegans Embryonic Development. PLoS Genet (2013) 9:e1003506. doi: 10.1371/journal.pgen.1003506
46. Reczek CR, Chandel NS. Ros Promotes Cancer Cell Survival Through Calcium Signaling. Cancer Cell (2018) 33:949–51. doi: 10.1016/j.ccell.2018.05.010
47. Liang JQ, Teoh N, Xu L, Pok S, Li X, Chu ESH, et al. Dietary Cholesterol Promotes Steatohepatitis Related Hepatocellular Carcinoma Through Dysregulated Metabolism and Calcium Signaling. Nat Commun (2018) 9:4490. doi: 10.1038/s41467-018-06931-6
48. Dou C, Zhou Z, Xu Q, Liu Z, Zeng Y, Wang Y, et al. Hypoxia-Induced TUFT1 Promotes the Growth and Metastasis of Hepatocellular Carcinoma by Activating the Ca(2+)/PI3K/AKT Pathway. Oncogene (2019) 38:1239–55. doi: 10.1038/s41388-018-0505-8
49. Chamcheu JC, Roy T, Uddin MB, Banang-Mbeumi S, Chamcheu RN, Walker AL, et al. Role and Therapeutic Targeting of the PI3K/Akt/mTOR Signaling Pathway in Skin Cancer: A Review of Current Status and Future Trends on Natural and Synthetic Agents Therapy. Cells (2019) 8:2073–4409. doi: 10.3390/cells8080803
Keywords: LLGL2, Hepatocellular Carcinoma, PI3K/AKT signaling, Calcium influx, Progression
Citation: Leng S, Xie F, Liu J, Shen J, Quan G and Wen T (2021) LLGL2 Increases Ca2+ Influx and Exerts Oncogenic Activities via PI3K/AKT Signaling Pathway in Hepatocellular Carcinoma. Front. Oncol. 11:683629. doi: 10.3389/fonc.2021.683629
Received: 21 March 2021; Accepted: 20 May 2021;
Published: 10 June 2021.
Edited by:
Emanuela Grassilli, University of Milano Bicocca, ItalyReviewed by:
Advait Subramanian, University of California, San Francisco, United StatesWon-Jing Wang, National Yang Ming Chiao Tung University, Taiwan
Copyright © 2021 Leng, Xie, Liu, Shen, Quan and Wen. This is an open-access article distributed under the terms of the Creative Commons Attribution License (CC BY). The use, distribution or reproduction in other forums is permitted, provided the original author(s) and the copyright owner(s) are credited and that the original publication in this journal is cited, in accordance with accepted academic practice. No use, distribution or reproduction is permitted which does not comply with these terms.
*Correspondence: Tianfu Wen, d2VudGlhbmZ1QHNjdS5lZHUuY24=