 Giorgia Simonetti1*
 Davide Angeli2
 Elisabetta Petracci2
 Eugenio Fonzi2
 Susanna Vedovato3
 Alessandra Sperotto4
 Antonella Padella1Martina Ghetti1Anna Ferrari1Valentina Robustelli5,6
 Rosa Di Liddo7Maria Teresa Conconi7
 Cristina Papayannidis5
 Claudio Cerchione8Michela Rondoni9
 Annalisa Astolfi10,11Emanuela Ottaviani5
 Giovanni Martinelli12Michele Gottardi13
- 1Biosciences Laboratory, IRCCS Istituto Romagnolo per lo Studio dei Tumori (IRST) “Dino Amadori”, Meldola, Italy
- 2Unit of Biostatistics and Clinical Trials, IRCCS Istituto Romagnolo per lo Studio dei Tumori (IRST) “Dino Amadori”, Meldola, Italy
- 3Department of Clinical and Experimental Medicine, University of Padova, Padua, Italy
- 4Hematology and Transplant Center Unit, Dipartimento di Area Medica (DAME), Udine University Hospital, Udine, Italy
- 5IRCCS Azienda Ospedaliero-Universitaria di Bologna, Istituto di Ematologia “Seràgnoli”, Bologna, Italy
- 6Dipartimento di Medicina Specialistica, Diagnostica e Sperimentale, Università di Bologna, Bologna, Italy
- 7Department of Pharmaceutical and Pharmacological Sciences, University of Padova, Padua, Italy
- 8Hematology Unit, IRCCS Istituto Romagnolo per lo Studio dei Tumori (IRST) “Dino Amadori”, Meldola, Italy
- 9Hematology Unit & Romagna Transplant Network, Ravenna Hospital, Ravenna, Italy
- 10“Giorgio Prodi” Cancer Research Center, University of Bologna, Bologna, Italy
- 11Department of Morphology, Surgery and Experimental Medicine, University of Ferrara, Ferrara, Italy
- 12Scientific Directorate, IRCCS Istituto Romagnolo per lo Studio dei Tumori (IRST) “Dino Amadori”, Meldola, Italy
- 13Onco Hematology, Department of Oncology, Veneto Institute of Oncology IOV, IRCCS, Padua, Italy
Adrenomedullin (ADM) is a hypotensive and vasodilator peptide belonging to the calcitonin gene-related peptide family. It is secreted in vitro by endothelial cells and vascular smooth muscle cells, and is significantly upregulated by a number of stimuli. Moreover, ADM participates in the regulation of hematopoietic compartment, solid tumors and leukemias, such as acute myeloid leukemia (AML). To better characterize ADM involvement in AML pathogenesis, we investigated its expression during human hematopoiesis and in leukemic subsets, based on a morphological, cytogenetic and molecular characterization and in T cells from AML patients. In hematopoietic stem/progenitor cells and T lymphocytes from healthy subjects, ADM transcript was barely detectable. It was expressed at low levels by megakaryocytes and erythroblasts, while higher levels were measured in neutrophils, monocytes and plasma cells. Moreover, cells populating the hematopoietic niche, including mesenchymal stem cells, showed to express ADM. ADM was overexpressed in AML cells versus normal CD34+ cells and in the subset of leukemia compared with hematopoietic stem cells. In parallel, we detected a significant variation of ADM expression among cytogenetic subgroups, measuring the highest levels in inv(16)/t(16;16) or complex karyotype AML. According to the mutational status of AML-related genes, the analysis showed a lower expression of ADM in FLT3-ITD, NPM1-mutated AML and FLT3-ITD/NPM1-mutated cases compared with wild-type ones. Moreover, ADM expression had a negative impact on overall survival within the favorable risk class, while showing a potential positive impact within the subgroup receiving a not-intensive treatment. The expression of 135 genes involved in leukemogenesis, regulation of cell proliferation, ferroptosis, protection from apoptosis, HIF-1α signaling, JAK-STAT pathway, immune and inflammatory responses was correlated with ADM levels in the bone marrow cells of at least two AML cohorts. Moreover, ADM was upregulated in CD4+ T and CD8+ T cells from AML patients compared with healthy controls and some ADM co-expressed genes participate in a signature of immune tolerance that characterizes CD4+ T cells from leukemic patients. Overall, our study shows that ADM expression in AML associates with a stem cell phenotype, inflammatory signatures and genes related to immunosuppression, all factors that contribute to therapy resistance and disease relapse.
Introduction
Adrenomedullin (ADM) is a 52-amino acid hormone belonging to the amylin/calcitonin gene-related peptide (CGRP) super-family, that has been originally identified in the extracts of human pheochromocytoma (1). It is produced by cleavage of an immature precursor that is synthesized by the ADM gene. ADM binds to calcitonin receptor-like (CALCRL), associated with modulating proteins with a single transmembrane domain, named receptor activity-modifying protein 2 (RAMP-2) or RAMP-3 (2).
ADM has been detected in many human tissues, including the endothelium, the nervous, cardiovascular, digestive, excretory, respiratory systems, the endocrine and reproductive organs (3). Despite its original definition as a hypotensive and vasodilator agent (1, 4), ADM is involved in a number of physiological processes, including angiogenesis (5), cell proliferation, migration (6), apoptosis (7, 8) and differentiation (9), with potential promoting and inhibitory functions depending on the cell type. Moreover, ADM production increases during infection, since it acts as an anti-microbial peptide against Gram-positive and Gram-negative bacteria (10), and during inflammation. Indeed, inflammatory molecules, as lipopolysaccharide (LPS) and 12-O-Tetradecanoylphorbol-13-acetate (TPA), and cytokines, including TNF-α and IL-1α force ADM secretion (11), and NF-κB binding sites have been identified on the ADM promoter (12). Once released, ADM can exert local and systemic anti-inflammatory actions by regulating cytokine secretion (13) and immune system properties, with beneficial effects on inflammatory conditions as gastric ulcers (14) and bowel diseases (15). Additional stimuli, as cell-to-cell interaction (16), growth factors, steroids, hormones, and physical factors, including oxidative stress and hypoxia, can induce ADM expression (3).
In the hematopoietic system, ADM is produced and secreted by peripheral blood monocytes, monocyte-derived macrophages and granulocytes (17). Moreover, mononuclear hematopoietic cells of the cord blood express ADM transcript (18) and ADM, in combination with growth-promoting cytokines, was able to enhance clonal growth and expansion of cord blood hematopoietic stem cells (18–20) and progenitor cells, respectively (20).
In contrast with the protective and therapeutic activity demonstrated in different diseases, ADM has pro-tumorigenic functions. It is over-expressed in a number of malignancies, including breast cancer, melanoma, tumors of the eye, of the respiratory, nervous, urogenital and gastroenteric system (21). Despite its relevance in hematopoietic stem cells and in the myeloid lineage, little is known about ADM in acute myeloid leukemia (AML). Previous studies on AML cellular models showed that HL60 (22) and THP1 cells produce ADM, though at low levels, and respond to a number of stimuli, including TPA, LPS, TNF-α by increasing its expression (17, 23). The elevated ADM production was associated with increased expression of markers of monocyte/macrophage differentiation (17). Conversely, exposure to exogenous ADM had no evident effects on cell differentiation that was instead induced by treatment with an ADM receptor antagonist. Exogenous ADM promoted AML cell proliferation through the ERK/MAPK pathway and induced CD31 upregulation, which could enhance their transendothelial migration capacity.
Here we analyzed the expression of the ADM gene across human hematopoietic cell differentiation and in AML, including its morphological, cytogenetic and molecular subtypes, cell subpopulations and T cell subsets from leukemic patients, and we investigated ADM impact on prognosis and its related transcriptional network.
Materials and Methods
Sample Collection and Cell Preparation
Samples were obtained from AML and acute lymphoblastic leukemia (ALL) patients after written informed consent, as approved by the institutional ethics committees (Comitato Etico Indipendente di Area Vasta Emilia Centro, protocol 112/2014/U/Tess and Comitato Etico della Romagna, protocol 5805/2019), in accordance with the Declaration of Helsinki. Mononuclear cells from bone marrow (n = 7) or peripheral blood (n = 5) of adult (non-M3) AML patients at diagnosis were collected by density gradient centrifugation using Lymphosep (Biowest). CD34+ leukemic blasts were enriched by immunomagnetic separation (CD34 MicroBead Kit, Miltenyi Biotec). Healthy hematopoietic stem-progenitor cells (CD34+) from bone marrow specimens (n = 3) were obtained by STEMCELL Technologies Inc.
Gene Expression Datasets
Gene expression data were obtained from the BLUEPRINT consortium (http://dcc.blueprint-epigenome.eu/#/home) (24) and the Gene Expression Omnibus (GEO) repository [https://www.ncbi.nlm.nih.gov/gds, GSE98791 (25), GSE24759 (26), GSE24006 (27), GSE63270 (28), GSE158596 (29), GSE117090 (30), GSE14924 (31), GSE14468 (32), GSE6891 (33), GSE13159 (34)]. Array data from 61 AML bone marrow samples (blasts ≥80%) and 29 Philadelphia-negative (Ph−) B-ALL have been generated by the Next Generation Sequencing platform for targeted Personalized Therapy of Leukemia (NGS-PTL) project, as previously described (35, 36). The Beat AML (37) and The Cancer Genome Atlas (TCGA) project on AML (38) transcriptomic cohorts were obtained from https://portal.gdc.cancer.gov (projects BEATAML1.0-COHORT and TCGA-LAML), respectively. The datasets used in the manuscript are described in Supplementary Table 1.
Transcriptomic Data Analysis
Data quality control and normalization (signal space transformation robust multi-array average) of NGS-PTL data (Affymetrix Human Transcriptome Array 2.0) were carried out by Expression Console software (version 1.4.1, Affymetrix, Thermo Fisher Scientific). Raw data from GSE24006, GSE14468, GSE6891, GSE13159 (all Affymetrix U133 Plus 2.0 array), were normalized by Transcriptome Analysis Console Software (version 4.0.1) using robust multi-array average normalization. Normalized data from GSE98791 (Agilent-021441 NCode Human Long Non-coding RNA), GSE117090 (Affymetrix Human Transcriptome Array 2.0), GSE14924, GSE63270 (Affymetrix U133 Plus 2.0 array) and GSE24759 (Affymetrix HT-HG-U133A Early Access) were retrieved from GEO. BLUEPRINT RNA-seq data were normalized in Transcript Per Million (TPM) by RSEM (39). RNA-Seq data from TCGA-LAML and Beat AML are available in the form of HTSeq read counts. Those were transformed into Counts Per Million (CPM) with Trimmed Mean of M values (TMM), using calcNormFactors (method = “TMM”) function in edgeR (40) (v3.24.1), then log2-transformed. RNA-seq data from GSE158596 were normalized using the median of ratios method of DESeq2 (41). Supervised gene expression analysis was performed by Student’s t-test or Welch’s t-test [R package stats, v3.4.1 (42)—python v3.6.5 (43) package scipy v1.5.2 (44)] in order to compare expression of ADM, its co-expressed and interacting genes. ADM interacting proteins were identified by STRING (version 11.0). Pathway enrichment analysis was carried out by Enrich R (45) on Gene Ontology Biological Processes, KEGG and Reactome annotations. The ClueGO package (version 2.5.7) from the Cytoscape software platform (version 3.8.1) was used for functional network analysis. Gene set enrichment analysis (GSEA) was performed with GSEA software (Broad Institute) (46).
qRT-PCR
After TRIzol extraction, RNA was reverse transcribed into cDNA (PrimeScript Reag Kit with gDNA Eraser, Takara). TaqMan gene expression for ADM mRNA (Hs00181605_m1, ThermoFisher Scientific) was performed on CD34+ cells from AML and control samples, using HPRT1 (Hs02800695_m1) as reference gene, on the Applied Biosystems 7500 Real-Time PCR System (ThermoFisher Scientific). Gene expression was quantified by the 2−ΔΔCt method, using the average expression of healthy CD34+ cells as calibrator.
Statistical Analyses
Data were reported as median and minimum-to-maximum values for continuous variables and as natural frequencies and percentages for categorical ones. The Shapiro–Wilk test was used to assess if continuous variables were normally distributed. The association between one continuous and one categorical variable was performed using the Student t-test or the Analysis of Variance (ANOVA) or the analogous Wilcoxon–Mann–Whitney test or Kruskal–Wallis test, as appropriate. In case of a significant result (p-value ≤0.05) from an omnibus test for the comparison of more than two categories, post-hoc test p-values were adjusted using the Bonferroni method. The association between two categorical variables was assessed by means of the Chi-square test or the Fisher’s exact test, as appropriate. Correlation among genes was studied through the Pearson correlation coefficient. To investigate the association between ADM expression and overall survival (OS), a Cox proportional hazards model was used. Hazard ratios (HRs) and 95% confidence intervals (CIs) were reported. To assess the presence of outliers or influential observations as well as the functional form of ADM in relation to the hazard function, the Deviance and the Martingale residuals were used, respectively. Overall survival analysis was performed firstly on each cohort separately and then on an integrated dataset to explore the prognostic role of ADM in specific subgroups otherwise characterized by very low frequency. Such integrated dataset was obtained applying the Blom transformation to the normalized expression data of ADM (47). Such rank-based transformation backtransforms the uniformly distributed ranks to a standard normal distribution. Statistical analyses were performed using R statistical language version 3.6.1 and STATA 12.0 (College Station).
Results
ADM Expression Is a Characteristic of the Myeloid Differentiation Program
To deeply investigate ADM expression in the hematopoietic system, we analyzed its mRNA levels at different stages of hematopoiesis and in the microenvironment in the BLUEPRINT dataset. ADM transcript was barely detectable in hematopoietic stem cells (HSC) and almost undetectable in hematopoietic multipotent progenitor cells (MPP) (Figure 1A). In the myeloid differentiation program, ADM was not expressed by common myeloid progenitor cells (CMP) and granulocyte-monocyte progenitor cells (GMP). It was barely detectable in megakaryocytes and erythroblasts, while increasing in dendritic cells (DC) and, especially, during neutrophilic differentiation and in monocytes (Figure 1A). Monocyte-derived macrophages showed low ADM levels. However, ADM expression was significantly enhanced by LPS stimulation (Supplementary Figure 1), in line with previous reports (49). In the lymphoid lineage, ADM was not expressed by common lymphoid progenitors (CLP) and by T cells at any stage of differentiation (thymocytes, memory T cells and regulatory T cells, Figure 1A). ADM expression remained close to undetectable during B lymphocyte differentiation (naïve, germinal center and memory B cells), while increasing in terminally-differentiated plasma cells (Figure 1A). Of note, ADM was highly expressed by cells populating the hematopoietic niche and/or interacting with the hematopoietic system, including endothelial progenitor and mature cells, bone marrow mesenchymal stem cells (MSC) and osteoclasts (Figure 1A).
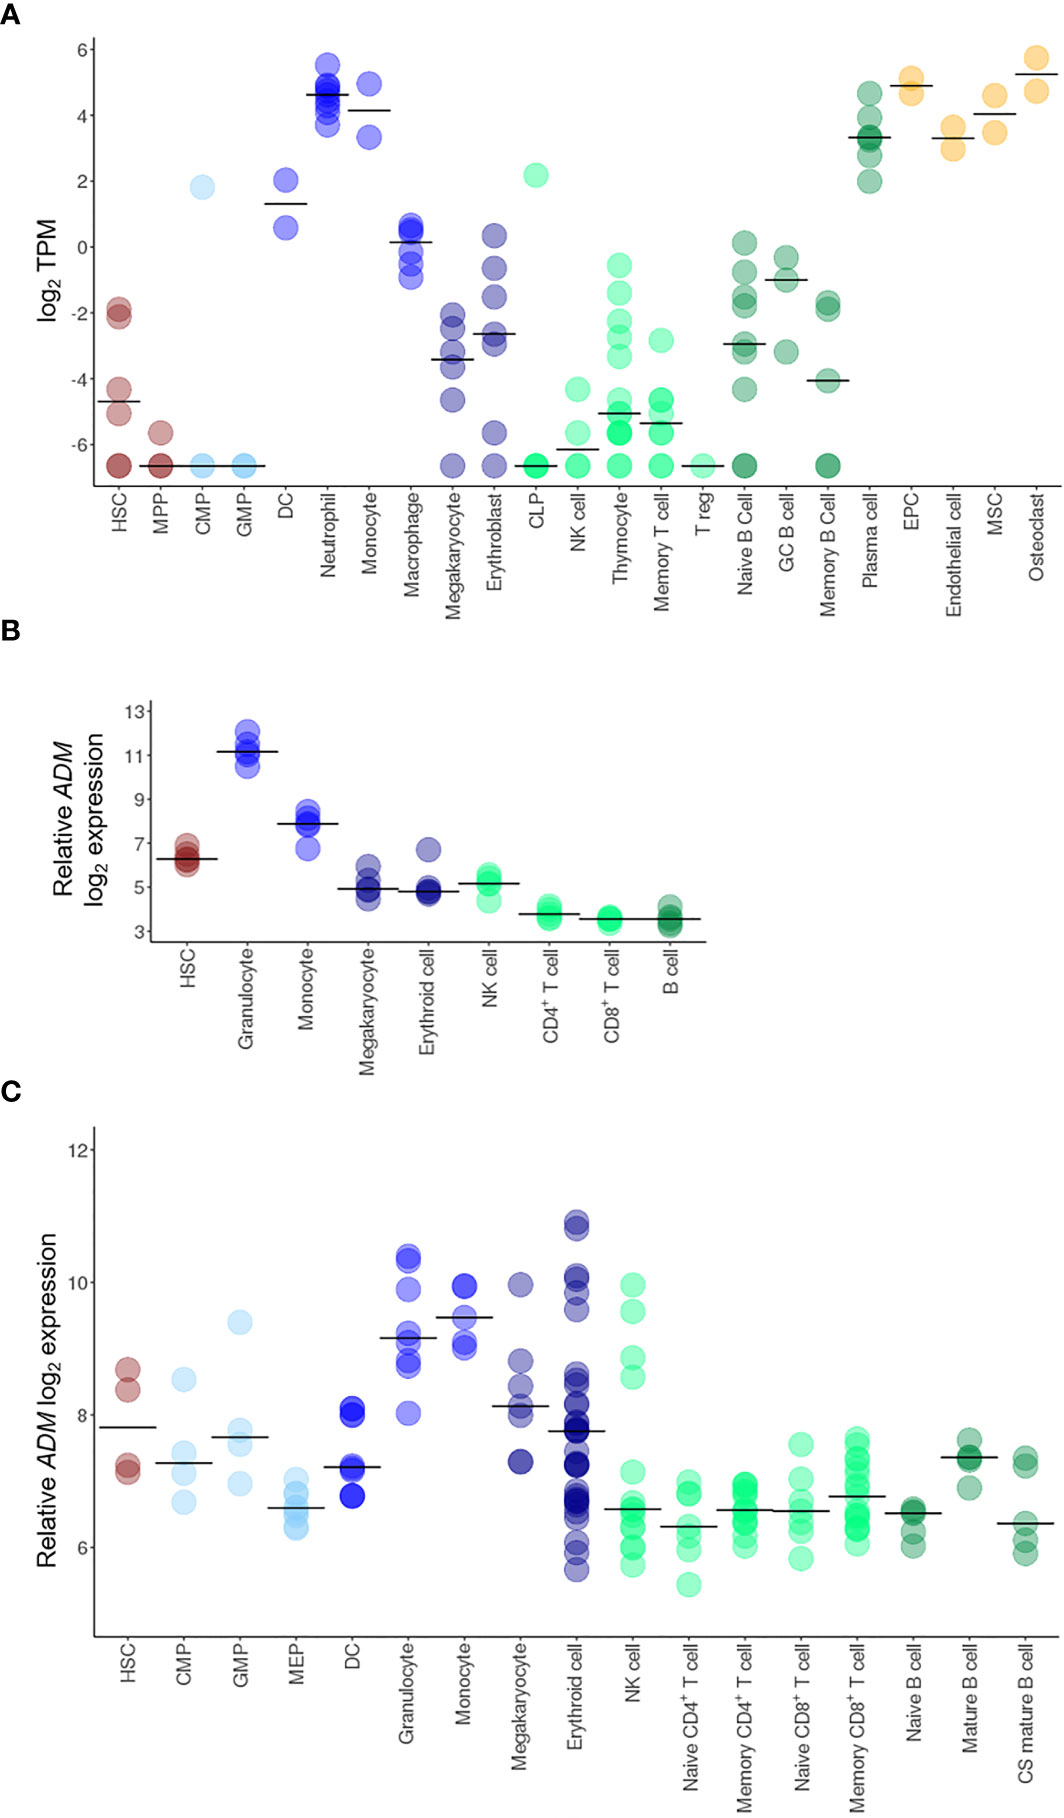
Figure 1 ADM expression in HSC and in the hematopoietic system. Transcriptional analysis of ADM expression in hematopoietic cells from the BLUEPRINT (A), the GSE98791 (B) and the GSE24759 (C) datasets. Scatter plots were generated with the R package ggplot2 (48) (version 3.3.1). Each dot indicates one sample and the bar represents the median value (HSC, hematopoietic stem cells; MPP, hematopoietic multipotent progenitor cells; CMP, common myeloid progenitors; GMP, granulocyte–monocyte progenitors; DC, conventional dendritic cells, CLP, common lymphoid progenitors; NK, natural killer; T reg, regulatory T cells; GC, germinal center; EPC, endothelial progenitor cells; MSC, mesenchymal stem cells; MEP, megakaryocyte-erythroid progenitors; CS, class-switched; TPM, Transcripts Per Million).
To validate these data in independent cohorts, we analyzed the GSE98791 and GSE24759 datasets, containing hematopoietic and immune cell populations. The results were largely overlapping, showing very low ADM levels in CMP, GMP, B cells, CD4+ and CD8+ T lymphocytes (naïve, mature and memory), low expression in HSC, erythroid cells and megakaryocytes and higher ADM transcript in monocytes and granulocytes (Figures 1B, C).
Taken together, these data indicate that in the normal hematopoietic system, ADM expression is a hallmark of mature myeloid cells.
Leukemia Stem Cells Express ADM
It was previously reported that the expression of the ADM binding receptor CALCRL is a prognostic marker in AML (50). However, both CGRP and ADM bind to the same receptor. To understand whether ADM may be involved in CALCRL signaling in AML, we analyzed its expression in three different datasets of leukemic and hematopoietic cells at different stages of differentiation, including stem and progenitor cells, defined on a surface phenotype base (GSE24006, GSE117190 and GSE63270).
ADM was overexpressed in leukemic stem cells (LSC) compared with HSC (GSE24006, p = 0.017; GSE117190, p = 0.023, GSE63270, p = 0.052) or MPP (GSE24006, p = 0.018; GSE63270, p = 0.002, Figures 2A–C). Elevated levels were also detected in leukemic compared with hematopoietic progenitor cells (GSE24006, p = 0.051; GSE117190, p <0.001, GSE63270, p = 0.003; Figures 2A–C). Moreover, ADM expression was maintained in AML blast cells that showed similar levels compared with more undifferentiated AML cells (GSE24006, Figure 2A). The elevated ADM expression in AML was confirmed in our qRT-PCR analysis of CD34+ AML cells versus bone marrow hematopoietic stem-progenitor cells (HSPC, p = 0.017, Figure 2D) and in the GSE158596 dataset, by comparing leukemic blasts with G-CSF mobilized HSPC (p <0.001, Figure 2E).
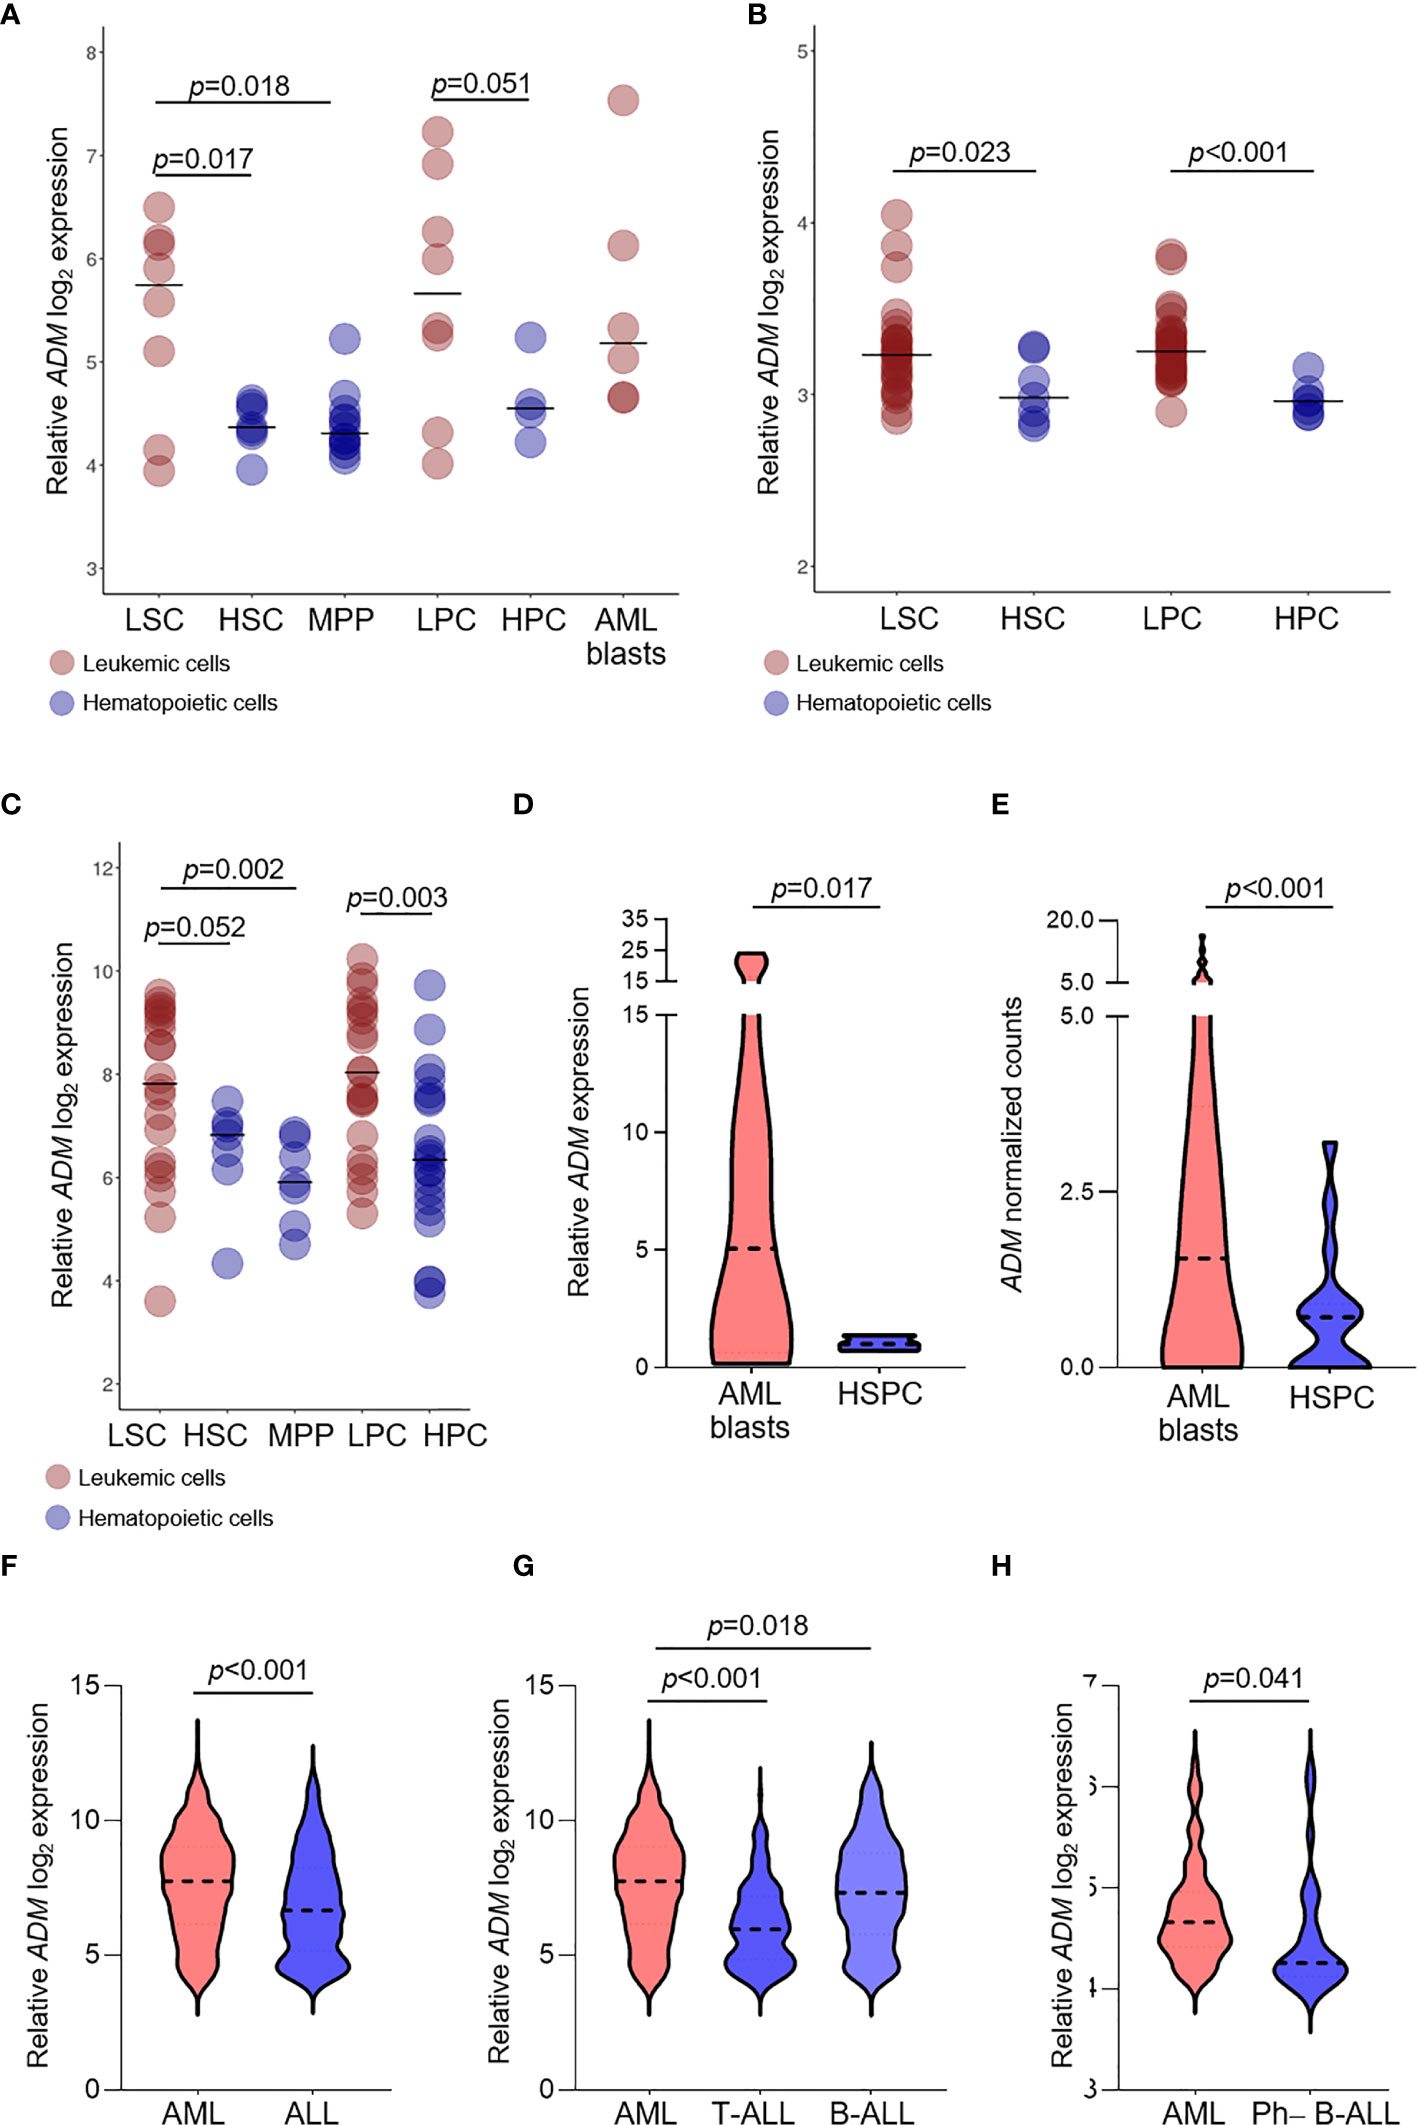
Figure 2 ADM expression is elevated in leukemic compared with hematopoietic stem and progenitor cells and in AML compared with ALL. (A–C) Comparison of ADM levels between leukemic cells subpopulations and normal stem and progenitor cells in the GSE24006 (A), the GSE117090 (B) and the GSE63270 (C) datasets. Subpopulations according to their surface phenotype: leukemia stem cells (LSC): (Lin−)CD34+CD38−(CD90−), hematopoietic stem cells (HSC): Lin−CD34+CD38−CD90+(CD45RA+/−), hematopoietic multipotent progenitor cells (MPP): Lin−CD34+CD38−CD90−CD45RA−, leukemia progenitor cells (LPC): (Lin−)CD34+CD38+(CD90−), hematopoietic progenitor cells (HPC): Lin−CD34+CD38+(CD90+), AML blasts: Lin−CD34−. Scatter plots were generated with the R package ggplot2 (48) (version 3.3.1). Each dot indicates one sample and the bar represents the median value. (D) Comparison of ADM levels between AML blasts (n = 12) and healthy CD34+ bone marrow cells (n = 3, hematopoietic stem-progenitor cells, HSPC, qRT-PCR) and (E) between AML blasts (n = 60) and healthy G-CSF mobilized HSPC (n = 16) from the GSE158596 dataset. (F) ADM transcript levels in AML (n = 505) and ALL (n = 784, GSE13159), (G) separated in T-ALL (n = 173) and B-ALL (n = 441) and (H) in AML (n = 61) versus Ph−B-ALL (n = 29, NGS-PTL). Violin plots were generated with GraphPad Prims (version 8.4.3). The plots represent the frequency distribution of ADM levels (from minimum to maximum) and the dotted line indicates the median value.
We then asked whether ADM expression differs between AML and ALL. We observed higher ADM expression in AML versus ALL (GSE13159, p <0.001, Figure 2F). This result was confirmed by comparing AML with T-ALL (p <0.001, Figure 2G) or B-ALL (p = 0.018, Figure 2G), separately. When analyzing the NGS-PTL B-ALL cohort, we observed that ADM expression was increased in AML compared with Ph-negative (Ph−) B-ALL (NGS-PTL, p = 0.041, Figure 2H). Overall, these data suggest that ADM is generally higher in AML compared with ALL.
High ADM Expression Associates With Specific Cytogenetic Features in AML
We then asked whether ADM expression levels changed among AML molecular and biological subgroups and investigated the association between ADM levels and disease features, including age, morphology, cytogenetics, and genomic lesions. To this aim, we analyzed six independent datasets of newly-diagnosed AML (excluding M3 cases, age ≥18 years) and focused on bone marrow samples (GSE6891, n = 68; Beat AML, n = 142; TCGA-LAML, n = 135, GSE13159, n = 458, NGS-PTL, n = 61), except for GSE14468 cohort that included mixed bone marrow and peripheral blood samples (n = 459, tissue not specified, Table 1 and Supplementary Table 2).
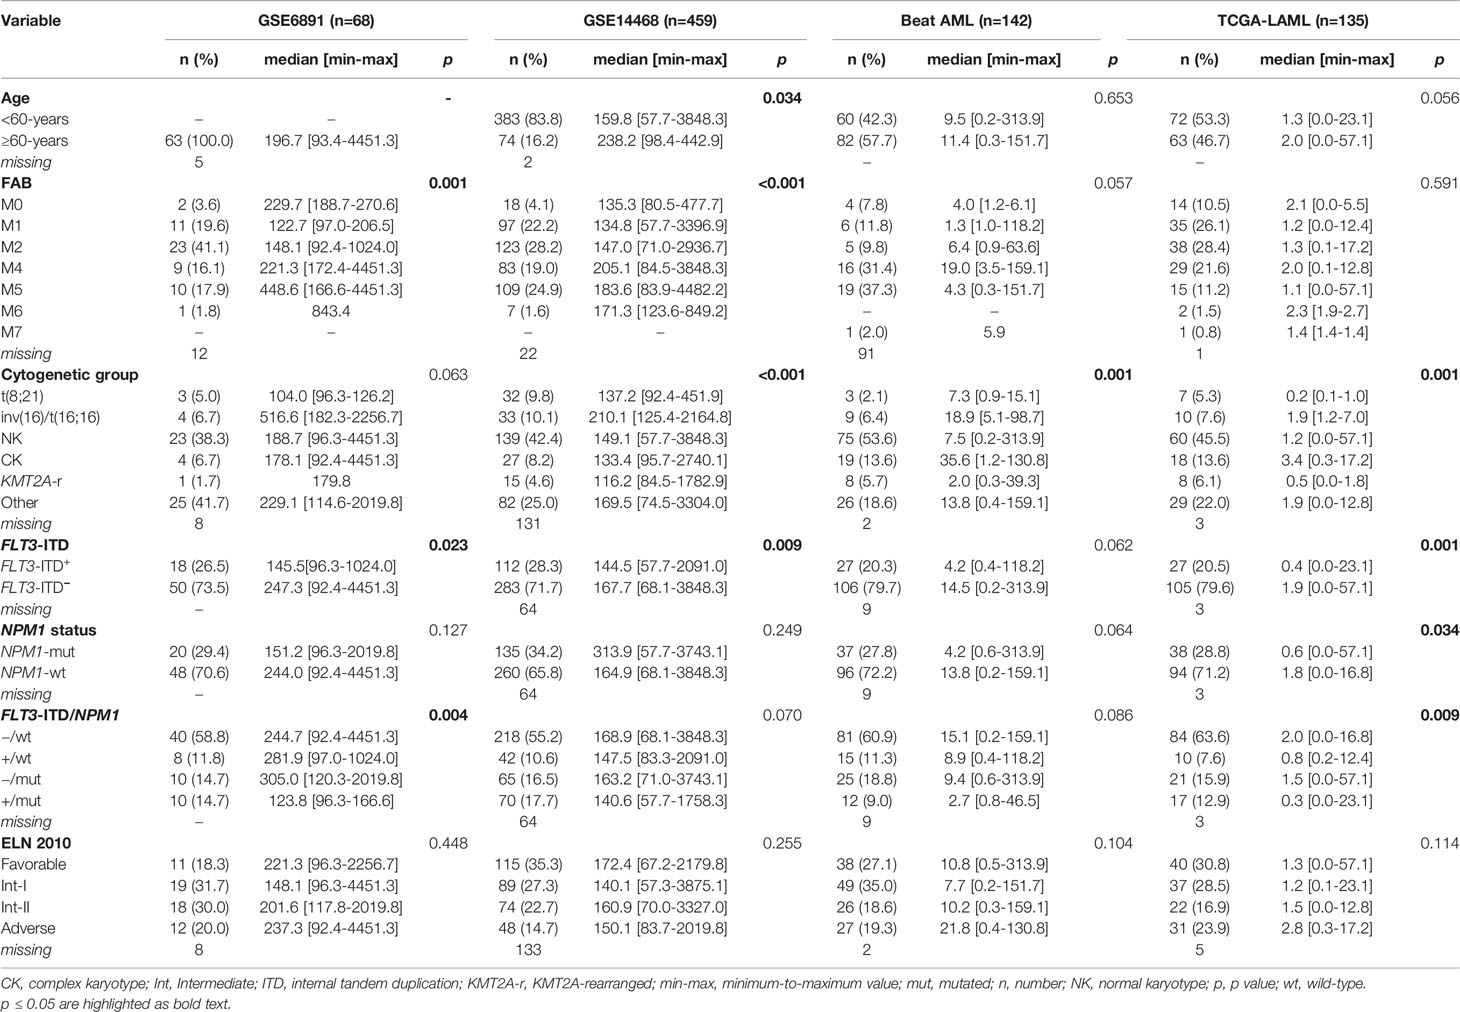
Table 1 Association between ADM expression levels and clinical/molecular data across public datasets.
Elderly patients (aged ≥60 years) expressed significantly higher ADM transcript in the GSE14468 cohort (p = 0.034) and this comparison was close to significance in the TCGA-LAML dataset (p = 0.056). ADM expression showed a significant variation according to French–American–British classification (GSE6891, p = 0.001, GSE14468, p <0.001), with high levels in the immature M0 cytomorphology, in the monocytic types (FAB M4/M5) and in erythroid leukemia (M6). Moreover, we observed a significant variation among cytogenetic subgroups (Beat AML, p = 0.001; TCGA-LAML, p = 0.001, GSE14468, p <0.001; GSE13159, p <0.001), with elevated levels in complex karyotype and inv(16)/t(16;16) AML and low expression in t(8;21) cases.
The analysis of ADM expression according to genetic alteration of AML-related genes revealed no association with the mutational status of IDH1, IDH2, KRAS/NRAS, RUNX1, ASXL1, DNMT3A and TP53. Moreover, no significant differences were observed among ELN 2010 risk categories (Table 1). Conversely, we detected lower expression in FLT3-ITD AML (GSE6891, p = 0.023; TCGA-LAML, p = 0.001; GSE144468, p = 0.009) compared with FLT3-ITD-negative AML and in NPM1-mutated versus wild-type cases in the TCGA-LAML dataset (p = 0.034). Accordingly, when considering FLT3-ITD and NPM1 mutation simultaneously, we observed a significant difference among the subgroups, with the wild-type cases expressing the highest ADM levels and the FLT3-ITD/NPM1-mutated ones expressing the lowest ones (GSE6891, p = 0.004; TCGA-LAML, p = 0.009).
We then asked whether ADM may have a prognostic role in terms of OS, but no statistically significant association was observed. This analysis was performed on the Beat AML, TCGA-LAML, GSE6891 and NGS-PTL cohorts that had the information related to the OS. Bone marrow and peripheral blood samples were included in order to increase the cohort size and allow subgroup analyses. Considering the integrated dataset, the associations between ADM and AML molecular and biological features observed on the single cohorts were confirmed (Table 2). Moreover, the integrated dataset suggested the association with ELN 2010 risk classification (p = 0.006, Table 2). In details, ADM expression was elevated in the favorable and adverse risk categories, compared with the intermediate ones, in line with the cytogenetic features. Additional analyses showed that high ADM expression had a negative impact on OS within the patients’ subgroup characterized by favorable ELN 2010 risk (HR for a one-unit increase in ADM = 1.28; 95% CI: 1.02–1.61, p = 0.031, Figure 3A). Adjusting for age (<60, ≥60 years) that resulted either significantly associated to ADM and to affect the OS, the HR for a one-unit increase in ADM was equal to 1.22 (95% CI: 0.97–1.53, p = 0.083). Conversely, high ADM expression seemed to have a positive impact on OS within the subgroup receiving a not-intensive treatment (azacytidine, decitabine, targeted therapies; HR = 0.65, 95% CI: 0.43–0.97 p = 0.037, Figure 3A). In this cohort, the prognostic role of ADM was independent from other biological and clinical factors.
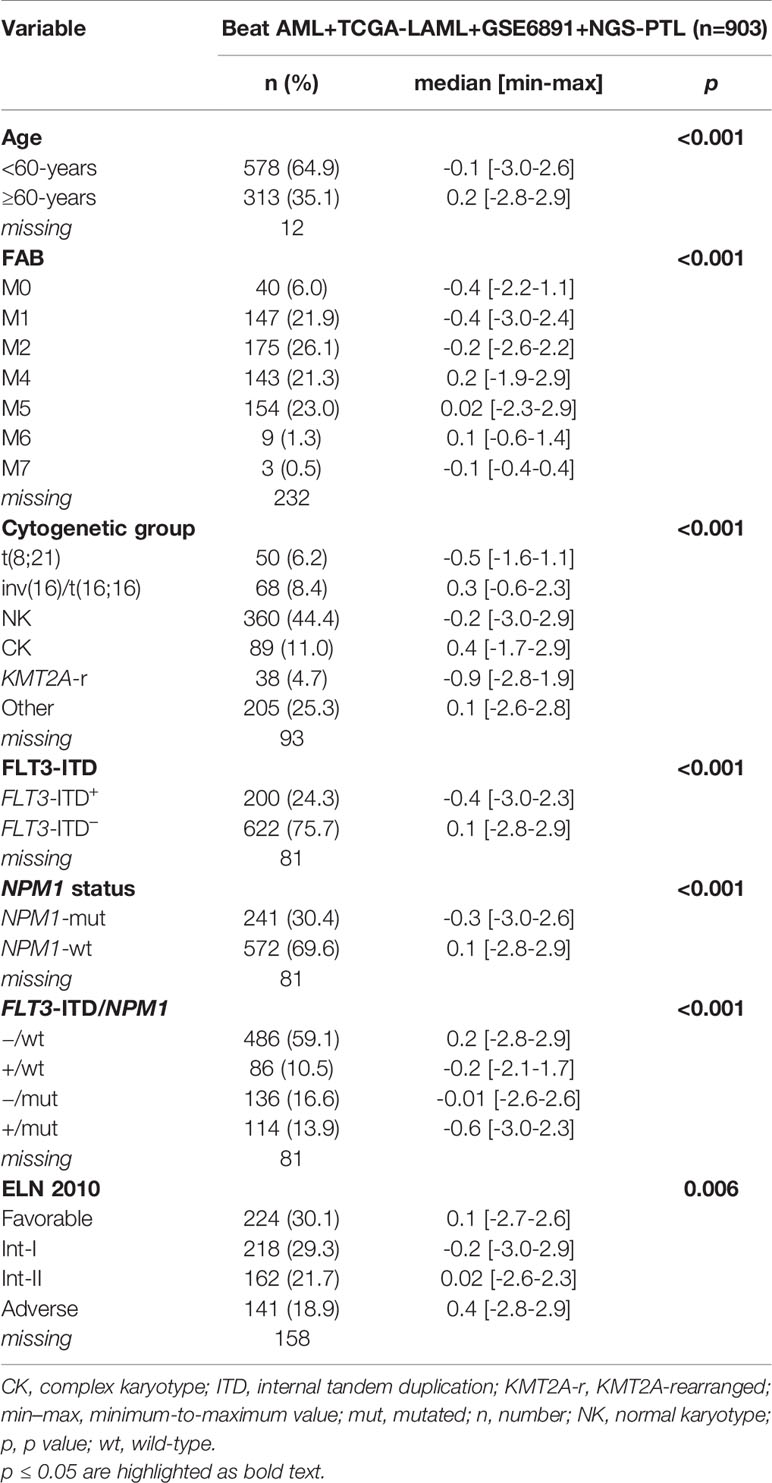
Table 2 Association between ADM expression levels and clinical/molecular data in the overall AML cohort after normalization.
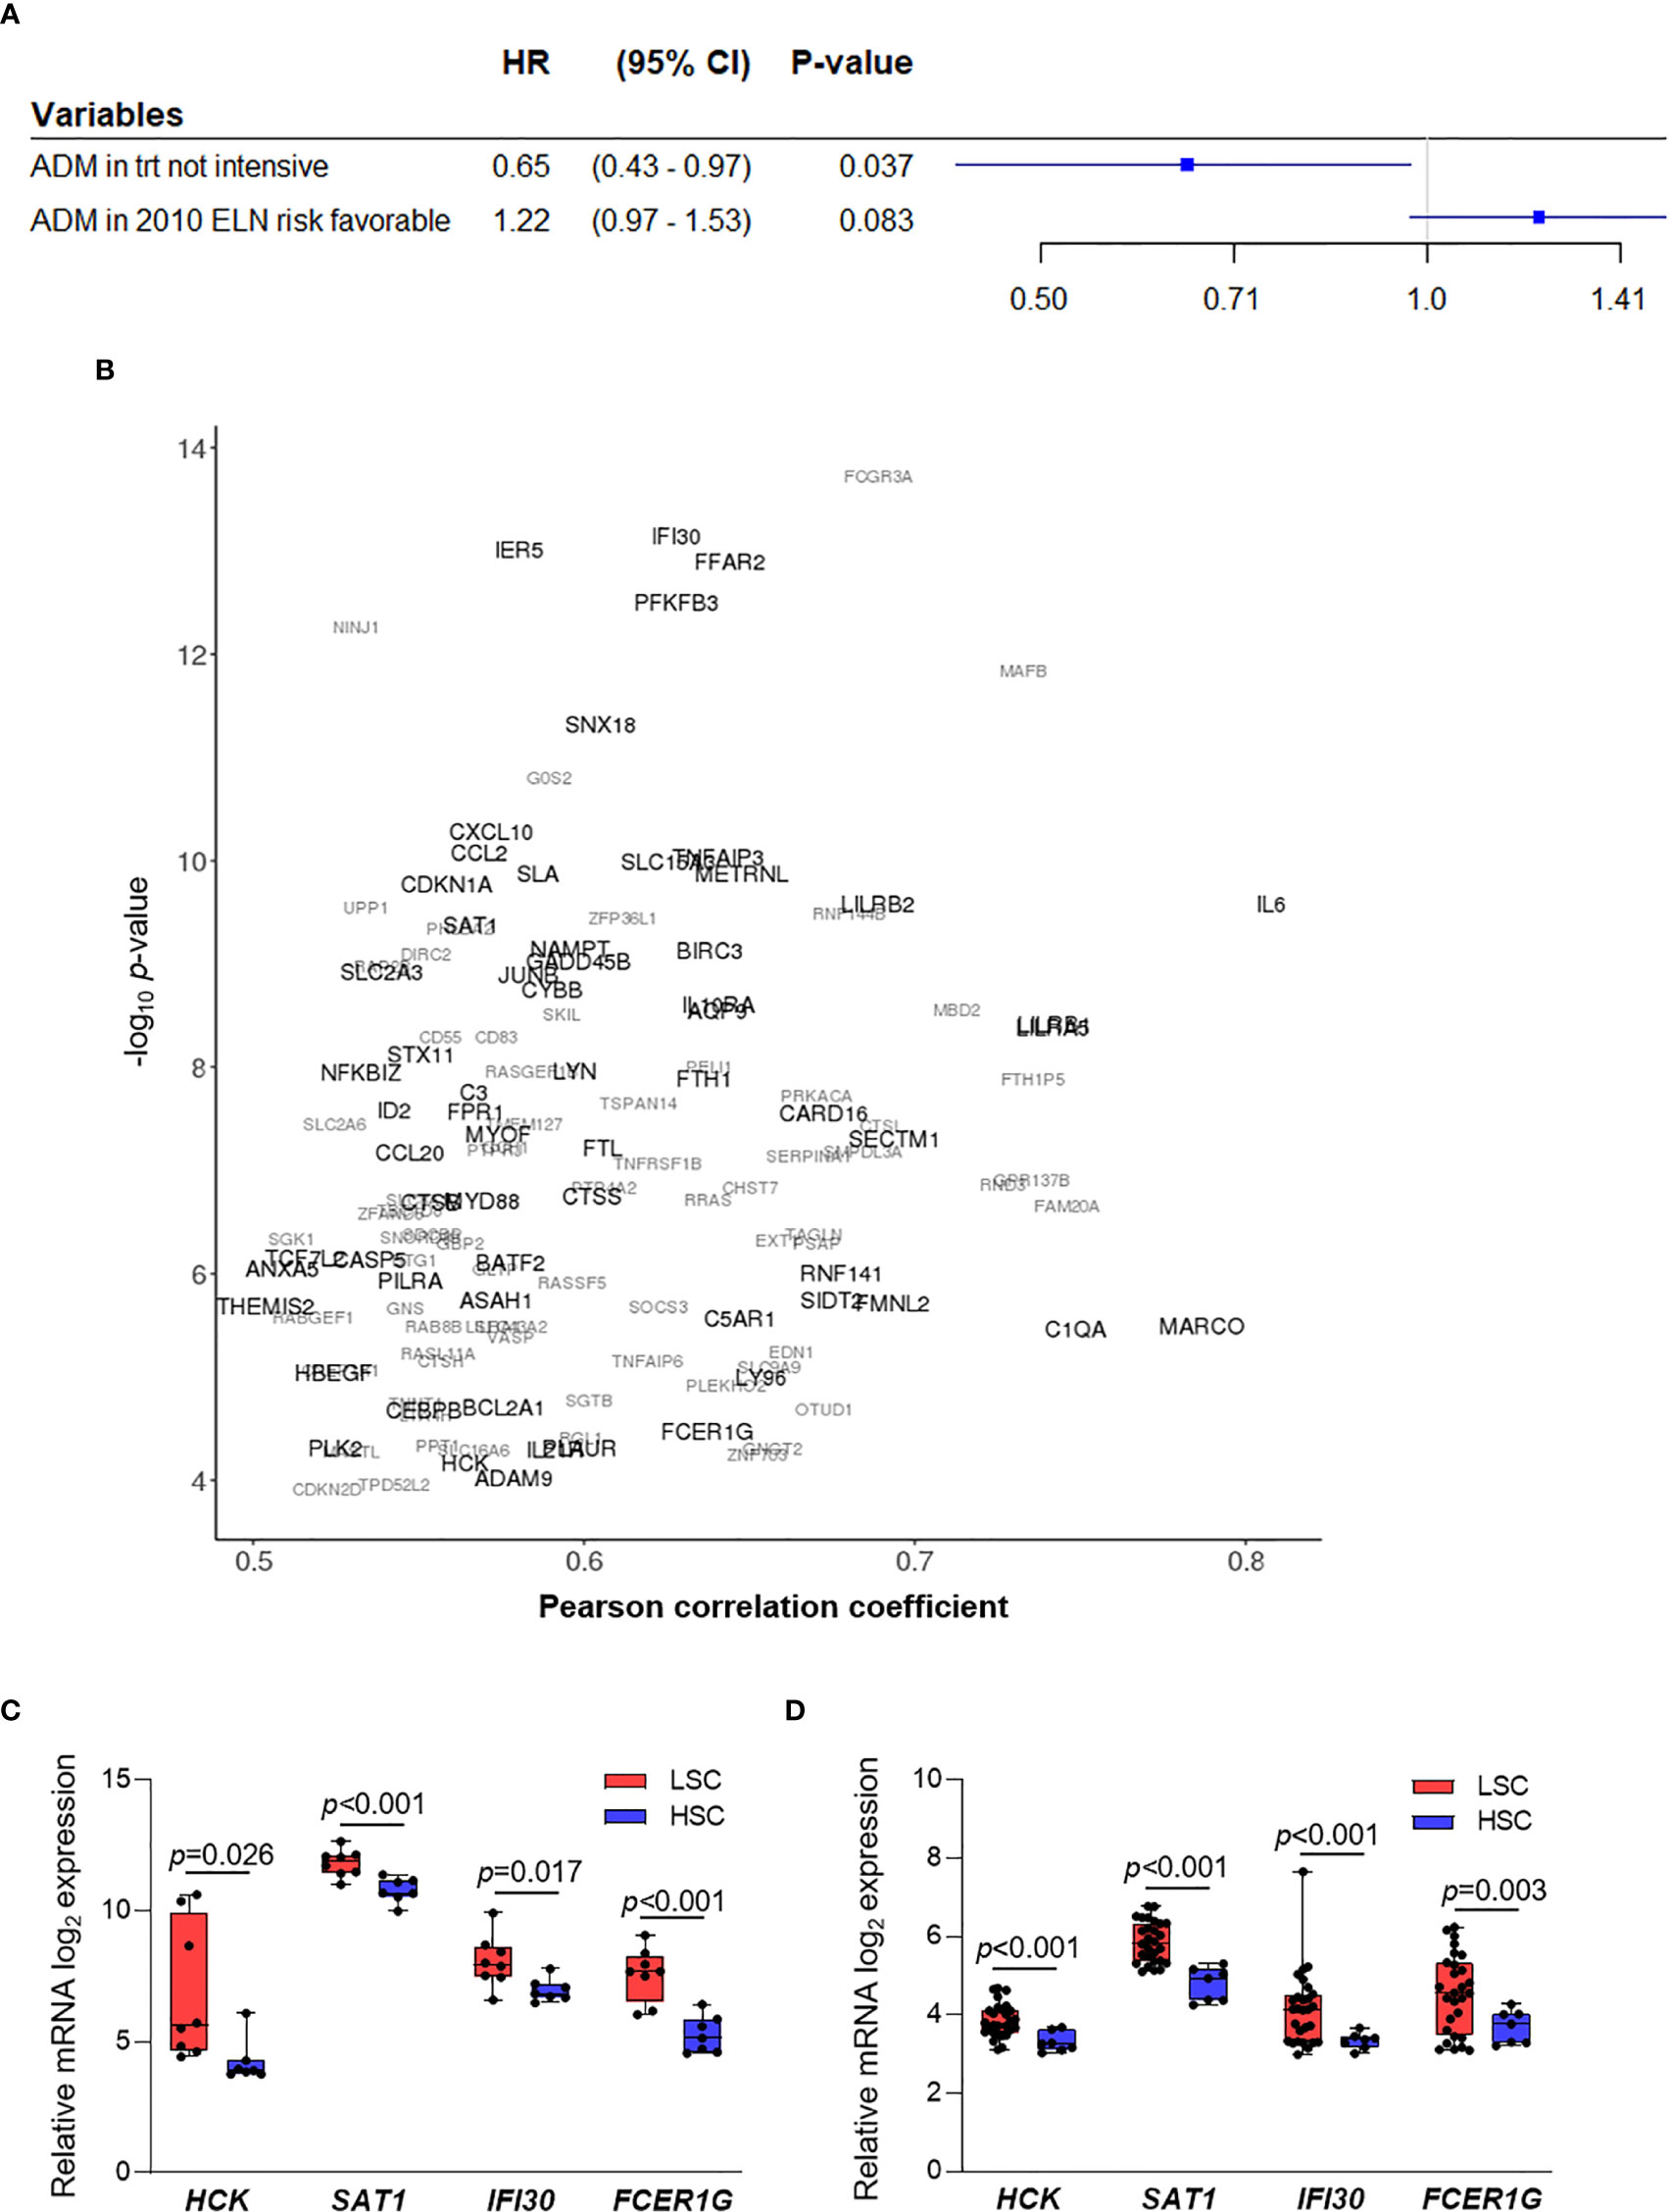
Figure 3 ADM prognostic role and co-expressed genes in AML. (A) Results from two separate Cox regression models within the subgroup with 2010 ELN favorable risk (adjusting for age, n = 214) and within the subgroup receiving a not-intensive treatment (n = 64, HR, Hazard ratio, CI, confidence interval, trt, treatment). (B) Correlation analysis between ADM expression and the AML transcriptome across bone marrow samples from five AML datasets (GSE6891, GSE13159, Beat AML, TCGA-LAML, NGS-PTL). Genes showing an absolute value of Pearson correlation coefficient ≥0.50 and a p value ≤0.05 in at least two cohorts were reported. Genes are represented according to the weighted arithmetic mean of the correlation coefficient and p value across the datasets. The scatter plot was generated with the R package ggplot2 (48) (version 3.3.1). (C) Transcriptional analysis of ADM co-expressed genes in LSC compared with HSC in the GSE24006 and (D) in the GSE117090 datasets (fold change ≥1.5 and p ≤0.05 were set as cut off). The boxes extend from minimum to maximum values, each individual value is plotted and the line represents the median value.
The ADM Gene Network Is Enriched of Inflammatory Signatures in Leukemic Cells and of Immunomodulatory Genes in T Cells From AML Patients
To understand the biological features associated with ADM expression in AML, we analyzed genes co-expressed and interacting with it. We defined 135 genes whose expression positively correlated with ADM (absolute value of Pearson correlation coefficient ≥0.5 and p value ≤0.05) in at least two out of the five cohorts of bone marrow samples (Figure 3B and Supplementary Table 3). Moreover, we identified the top-scoring ADM interactors (protein–protein interaction enrichment p <1.0e−16, Supplementary Figure 2), that are mainly involved in G protein-coupled receptor signaling.
Genes co-expressed with ADM were involved in regulation of cell growth and proliferation (e.g. CDKN2D, SDCBP, BTG1, PTPRJ, SGK1), ferroptosis (FTH1, CYBB, SAT1, FTL), protection from apoptosis (e.g. HCK, RNF144B, BCL2A1, BIRC3), HIF-1α signaling (e.g. CDKN1A, EDN1, PFKFB3, CYBB), JAK-STAT pathway (SOCS3, IL6, CDKN1A, IL10RA, IL21R) and response to stimuli, including lipids, LPS, cytokines and chemokines (Supplementary Table 4). Three of these genes were confirmed in four out of five cohorts, thus representing high-fidelity ADM co-expressed genes. They were the p53 transcriptional target SAT1, that is involved in polyamine metabolism and functions as a metabolic mediator of ferroptotic cell death (51), the BCL2 family member BCL2A1, that has been recently shown to confer resistance to Venetoclax treatment (52, 53), and IER5, that regulates LPC proliferation (54) (Figure 3B and Supplementary Table 3).
Four ADM co-expressed genes were also upregulated in LSC compared with HSC in two analyzed datasets (GSE24006, Figure 3C and GSE117090, Figure 3D). The Src family kinase HCK is strongly expressed in a significant proportion of AML patients (55), is known to be upregulated in leukemic compared to normal stem cells and is a potential therapeutic target (56, 57). Along with the metabolic mediator SAT1, an additional gene functions as regulator of cell homeostasis, namely the lysosomal thiol reductase IFI30, that facilitates degradation of unfolded proteins, thus controlling endoplasmic-reticulum stress. IFI30 is also a predictor of response to combined Mitoxantrone, Etoposide, Cytarabine and the proteasome inhibitor Ixazomib in relapsed/refractory AML (58). Moreover, FCER1G is an immune regulator. Indeed, it is an adapter protein that transduces activation signals from various immunoreceptors and has been shown to prime T cells toward T-helper 2 and T-helper 17 cell subtypes (59).
Remarkably, network analysis of the ADM co-expressed genes across AML datasets highlighted the enrichment of transcripts involved in immune and inflammatory response, including myeloid leukocyte activation, regulation of their differentiation, neutrophil migration, toll-like receptor signaling, mononuclear cell migration, regulation of leukocyte proliferation (Figure 4 and Supplementary Table 4), suggesting an association between high ADM levels and an inflammatory status in leukemic cells.
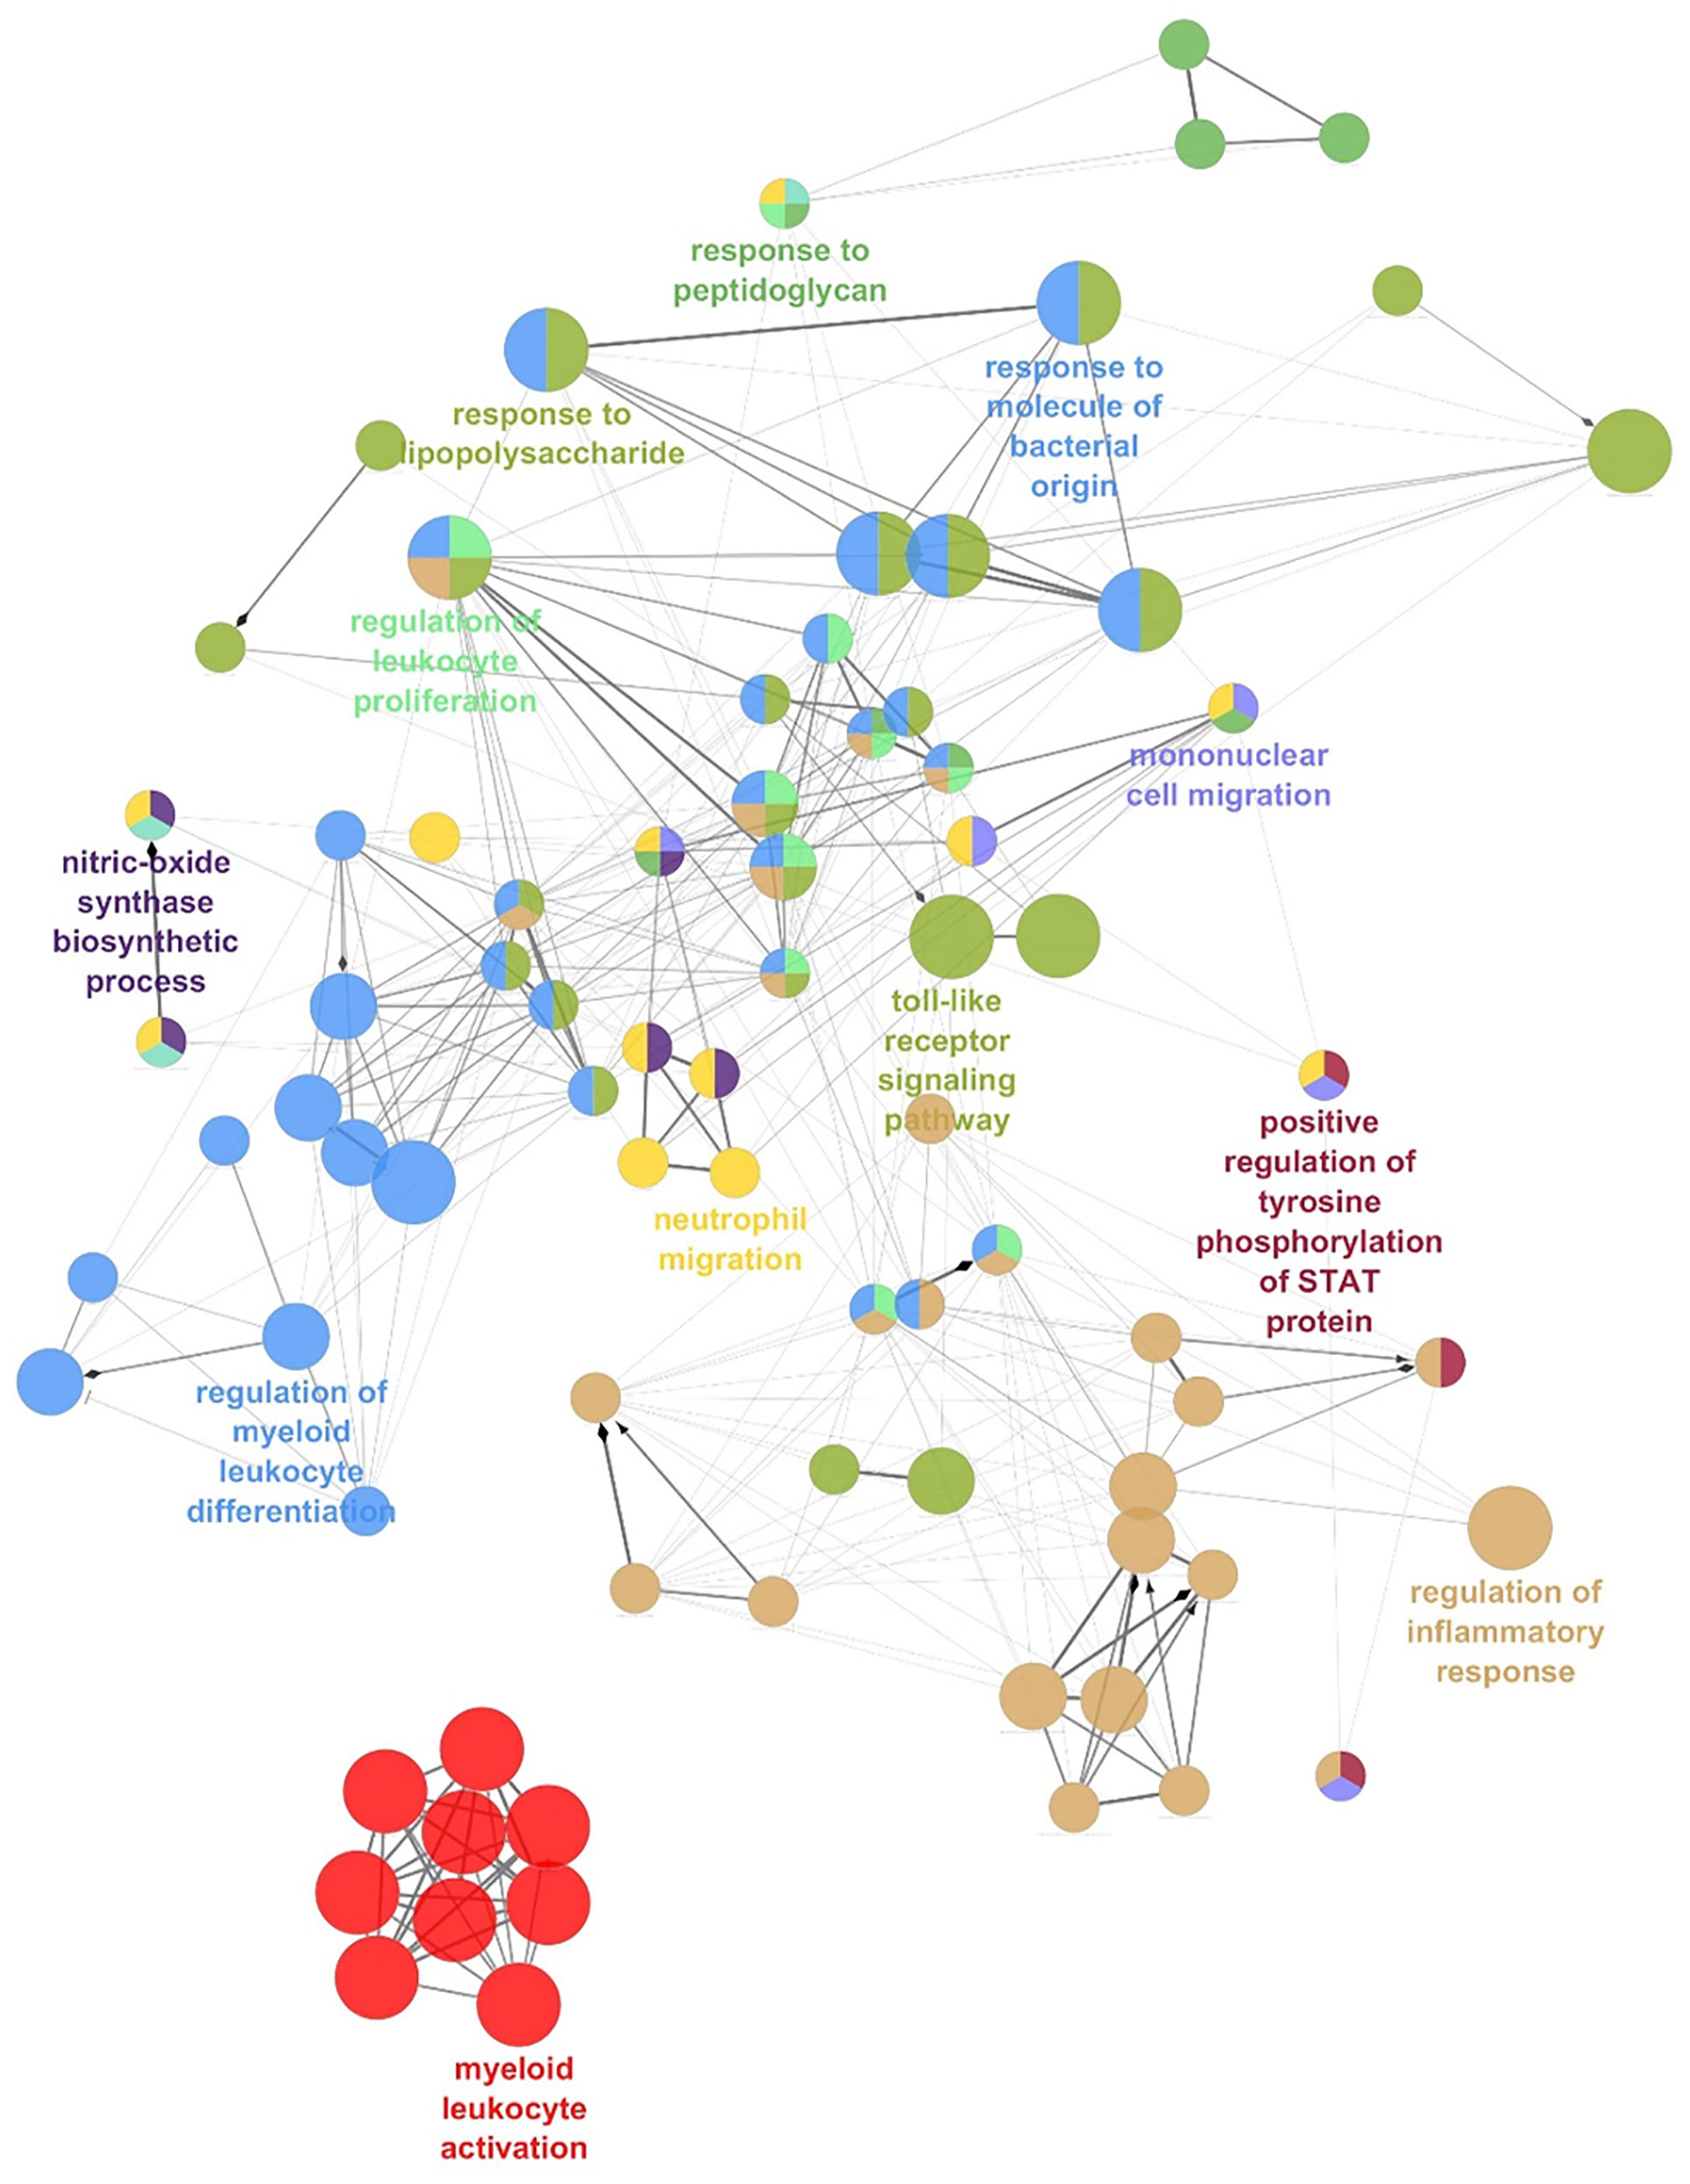
Figure 4 The network of ADM co-expressed genes in AML. Network analysis of the Gene Ontology Biological Processes pathways enriched by ADM co-expressed genes in AML (ClueGO). Colors indicate functionally-related pathways; one representative pathway for each subnetwork is specified.
Since ADM has been previously linked with immune response under physiological and pathological conditions (60–63), we compared its expression in T cell subsets from AML patients and healthy controls. We observed increased ADM expression in CD4+ T cells (GSE14924, p <0.001, Figure 5A) and in CD8+ T lymphocytes (GSE117090, p <0.001, Figure 5B) from AML patients. Moreover, 40 and six ADM co-expressed genes were upregulated in CD4+ T (Figure 5C) and CD8+ T cells (Figure 5D) from AML patients compared with cells from healthy controls, respectively. When studied by GSEA, CD4+ T cells from AML patients were enriched of signatures related to regulatory T (Treg) cells (Figure 5E). Of note, some ADM co-expressed genes, including JUNB, CDKN1A, ANXA5, CYBB, NFKBIZ, that were upregulated in CD4+ T cells from AML patients compared with cells from healthy controls (Figure 5B), are known to participate to the Treg phenotype (65–69).
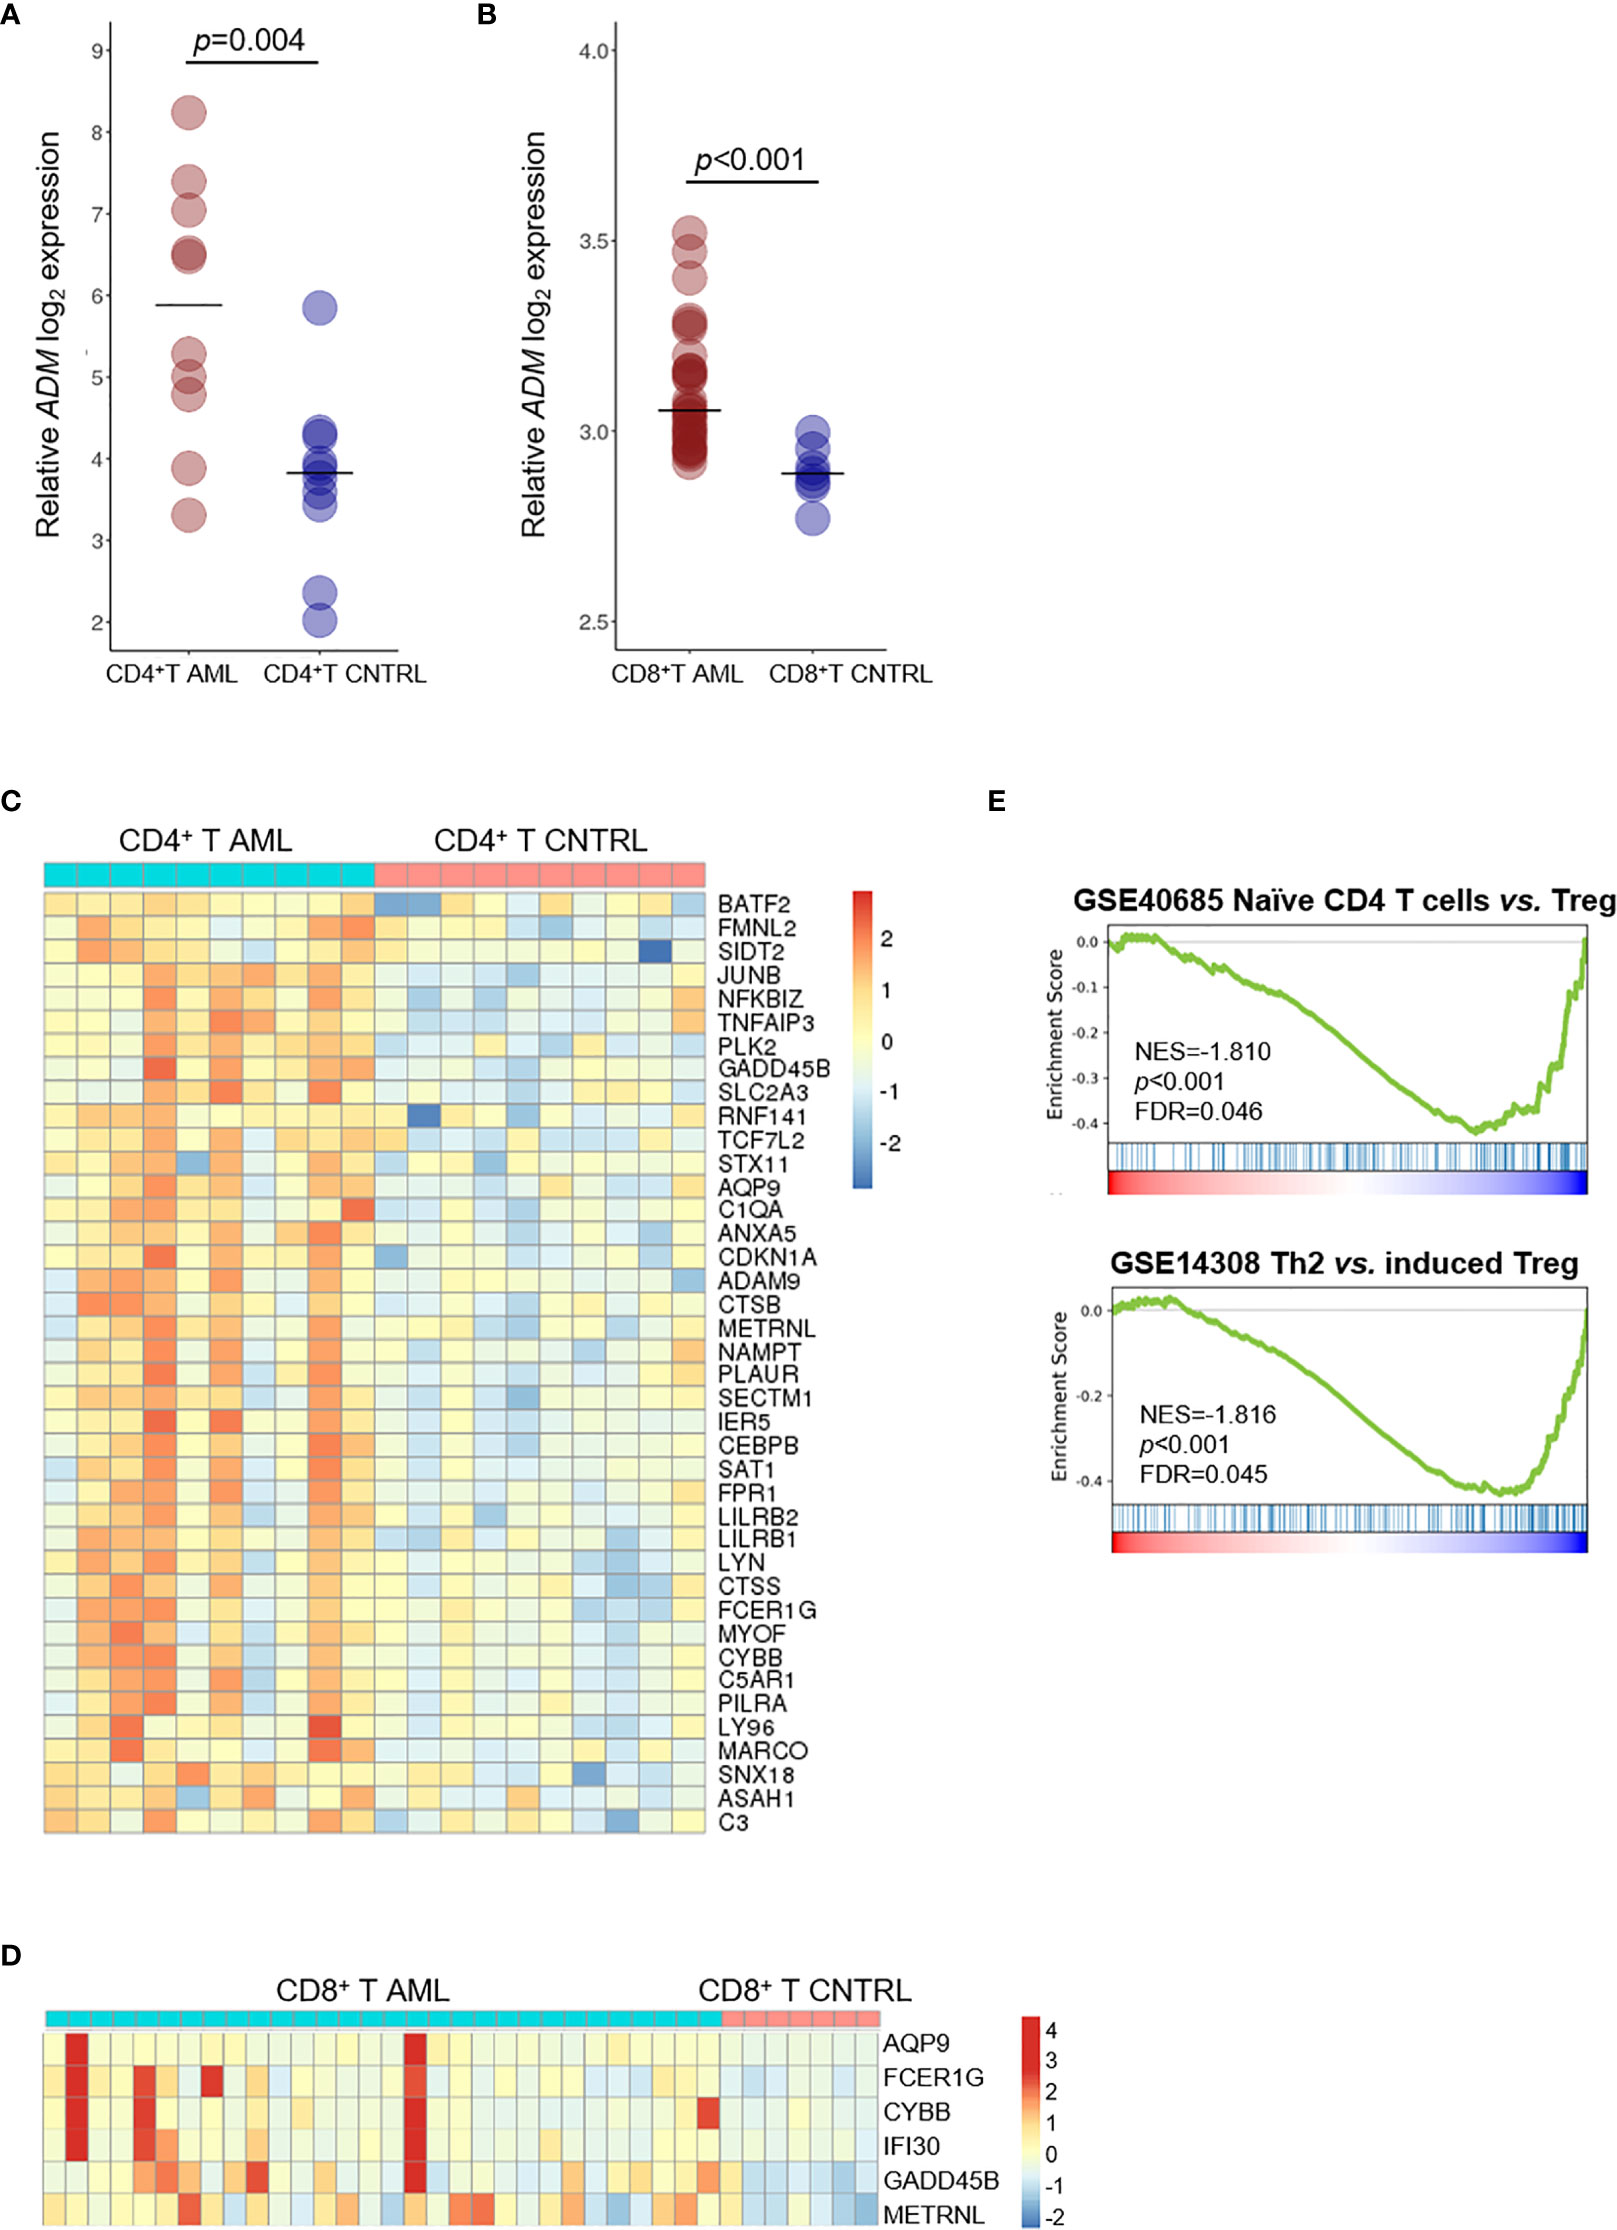
Figure 5 ADM is overexpressed in the T cell compartment of AML patients and associates with a tolerogenic gene signature. (A) Comparison of ADM levels between CD4+ T cells from AML patients and healthy subjects (GSE14924) and (B) between CD8+ T cells from AML patients and healthy subjects (GSE117090). Scatter plots were generated with the R package ggplot2 (48) (version 3.3.1). Each dot indicates one sample and the bar represents the median value (CNTRL: healthy subjects). (C) Heatmap of ADM co-expressed genes that are differentially expressed between CD4+ or (D) CD8+ T lymphocytes isolated from AML patients and from healthy subjects. Columns represent patients/subjects. Data were standardized through a z-score transformation. Color changes within a row indicate expression levels relative to the mean and rescaled on the transcript standard deviation. Genes are grouped according to average linkage hierarchical clustering. Heatmaps were built with R package pheatmap (64) (version 1.0.12). (E) GSEA of CD4+ T cells from AML patients compared with healthy subjects showing the enrichment of tolerance signatures (NES, normalized enrichment score, FDR, false discovery rate; Th2, T-helper 2, Treg, regulatory T cells).
Discussion
ADM is a circulating hormone that also functions as a local paracrine and autocrine mediator, with involvement in a number of different cellular responses. We here studied ADM expression in the hematopoietic system and in AML and analyzed the transcriptional program associated with it both in leukemic cells and the immune microenvironment.
ADM is upregulated in a variety of human cancers compared with normal tissues and its mRNA expression correlated with high protein expression in the majority of them (21). In AML, we observed elevated levels in cell subpopulation defined, on the basis of their surface phenotype, as LSC and LPC compared with their normal counterparts that showed undetectable-to-barely-detectable levels.
ADM expression is also elevated in AML compared with ALL, in line with the observation that ADM expression is a main feature of the myeloid differentiation program. Accordingly, among AML FAB subtypes, monocytic (M4/M5) and erythroid (M6) leukemia had the highest expression, together with the immature M0 phenotype. These data reflect the distribution of ADM expression across the cytogenetic subgroups, with complex karyotypes, that frequently have an undifferentiated phenotype and inv(16)/t(16;16) AML, that characterizes the myelomonocytic cytomorphology, showing the strongest ADM positivity. This feature may also explain the lack of prognostic relevance of ADM in AML in general, that has been reported in other solid tumors (70–76). Conversely, high ADM levels showed a potential negative impact on overall survival in the favorable ELN 2010 risk class, that also includes inv(16)/t(16;16) cases. In AML, ADM expression is related to the disease molecular features, both in terms of genomic rearrangements and mutational status. Indeed, FLT3-ITD or NPM1-mutated cases displayed lower ADM levels compared with the wild-type ones and the expression was particularly low when the two alterations co-occurred. Several lines of evidence may explain this observation. First, two tyrosine kinases, namely LYN and HCK, show a positive correlation with ADM, suggesting alternative ways of signaling activation. Moreover, ADM is co-expressed with SLAP, that binds to FLT3 and modulates receptor stability and downstream signaling (77), likely favoring its activation even in the absence of the internal tandem duplication. Regarding NPM1-mutated AML, an inflammatory transcriptional program, characterized by enrichment of genes belonging to IFN-γ response, IL6 signaling and complement cascade (78) has been already associated with this genomic subgroup, and PRDM16 upregulation contributes to it (79). Functional studies on AML genomic subtypes will clarify in the future the role of ADM in specific leukemic cell contexts, thus overcoming the limitation of the currently available studies that analyzed generic AML models. Moreover, some of the identified associations and ADM function in AML cells under the pressure of not-intensive treatment regimens (e.g. hypomethylating agents), deserve further validation and investigation.
Our data suggest that the ADM-related transcriptional network has a role in cell proliferation, it negatively regulates apoptosis and, remarkably, it is involved in the inflammatory response. Moreover, some of the ADM co-expressed genes are already known for their leukemia-related role, including the anti-apoptotic gene BIRC3, the signaling molecules HCK, LYN (tyrosine kinases), SLA (Src kinase-like-adapter protein) and PLAUR (urokinase plasminogen activator surface receptor), the transcriptional regulators TCF7L2 (WNT pathway) and ID2, the metabolism-related genes FTH1, FTL (ferritin heavy and light chain, respectively), PFKFB3 (glycolytic regulator), NAMPT (NAD biosynthesis pathway), SLC15A3 (solute carriers transporting histidine) and FFAR2 (free fatty acid receptor). Among ADM interacting genes, EDN1, that mediates VEGF-C-induced proliferation and chemoresistance in AML (80), showed a positive correlation with ADM expression. Several co-expressed genes and enriched pathways point towards an AML inflammatory phenotype, characterized by expression of IL6, IL10RA, CXCL10, THEMIS2, TNFAIP3, LILRA5, LILRB2. ADM was also upregulated in the CD4+ and CD8+ T cell subsets from AML patients compared with healthy controls and ADM correlating genes that were identified in AML, participate in a signature of immune tolerance in CD4+ T cells. We could not perform the correlation analysis on the CD4+ and CD8+ T cells due to the low number of samples, which would have hampered data significance and robustness.
In our analysis, none of the genes belonging to the ADM receptor complex (CALCRL, RAMP2, RAMP3) showed a correlation with endogenous ADM expression. However, it has been recently reported that CALCRL, the receptor of ADM and CGRP, is also overexpressed in LSC and its genomic ablation impaired the clonogenic capacity of AML cell lines (50) and the frequency of chemotherapy-resistant cells able to initiate leukemia relapse in preclinical models (81). In contrast to ADM, CALCRL was highly expressed in NPM1-mutated cases also carrying the FLT3-ITD (50). This difference reinforces the notion that the receptor expression is not controlled by the basal ADM levels, rather by changes in the extracellular ADM availability (22). We can therefore hypothesize an intrinsic capacity of leukemic cells to respond to ADM-mediated microenvironmental and self-stimulation, as also supported by the high level of ADM expression observed in MSC and osteoclasts.
Overall, our results suggest multiple biological roles of ADM in AML. Indeed, it may support LSC and may be involved in the maintenance of a leukemic cell inflammatory phenotype via autocrine and paracrine signaling, thus contributing to drug resistance and relapse. Moreover, ADM may exert an anti-inflammatory action when released in the blood and may promote immune tolerance by direct expression in the CD4+ T cell subset and by uptake from the tumor microenvironment, as indicated by data from murine models of autoimmune disorders (63). This evidence, along with the observation that an antagonistic ADM peptide induced differentiation of leukemic cell lines (22), suggest that targeting ADM may carry therapeutic potentials in AML. However, given the pleiotropic effects of ADM, a therapeutic strategy to deplete it may have serious side effects and toxicities. Therefore, encapsulated formulations aimed to deliver ADM neutralizing antibodies in targeted cells may be required. Alternatively, combination strategies blocking the ADM-related network (e.g. HCK, LYN, NAMPT inhibitors) may be investigated for their effect on AML cases expressing high ADM levels.
Data Availability Statement
TThe NGS-PTL gene expression array AML dataset is available in the Gene Expression Omnibus repository under the accession number GSE161532.
Ethics Statement
The studies involving human participants were reviewed and approved by Comitato Etico Indipendente di Area Vasta Emilia Centro (CE-AVEC), Bologna, Italy, and Comitato Etico della Romagna (CEROM), Meldola (FC), Italy. The patients provided their written informed consent to participate in this study.
Author Contributions
GS designed the research, analyzed the data and wrote the manuscript. DA and EF analyzed transcriptomic data and prepared the figures. EP performed statistical analysis and revised the manuscript. SV and AS analyzed the data and revised the manuscript. AP, MGh, AF, VR, AA, and EO performed experiments. RL and MC helped in data interpretation. CP, CC, and MC provided patients’ specimens and data. GM supported the study design and data interpretation. MGo designed the research, analyzed the data and revised the manuscript. All authors contributed to the article and approved the submitted version.
Funding
This study was supported by TrevisoAIL.
Conflict of Interest
The authors declare that the research was conducted in the absence of any commercial or financial relationships that could be construed as a potential conflict of interest.
Acknowledgments
We thank the HOVON study group for sharing clinical data.
Supplementary Material
The Supplementary Material for this article can be found online at: https://www.frontiersin.org/articles/10.3389/fonc.2021.684396/full#supplementary-material
References
1. Kitamura K, Kangawa K, Kawamoto M, Ichiki Y, Nakamura S, Matsuo H, et al. Adrenomedullin: A Novel Hypotensive Peptide Isolated From Human Pheochromocytoma. Biochem Biophys Res Commun (1993) 192:553–60. doi: 10.1006/bbrc.1993.1451
2. McLatchie LM, Fraser NJ, Main MJ, Wise A, Brown J, Thompson N, et al. RAMPS Regulate the Transport and Ligand Specificity of the Calcitonin- Receptor-Like Receptor. Nature (1998) 393:333–9. doi: 10.1038/30666
3. Schönauer R, Els-Heindl S, Beck-Sickinger AG. Adrenomedullin – New Perspectives of a Potent Peptide Hormone. J Pept Sci (2017) 23:472–85. doi: 10.1002/psc.2953
4. Nuki C, Kawasaki H, Kitamura K, Takenaga M, Kangawa K, Eto T, et al. Vasodilator Effect of Adrenomedullin and Calcitonin Gene-Related Peptide Receptors in Rat Mesenteric Vascular Beds. Biochem Biophys Res Commun (1993) 196:245–51. doi: 10.1006/bbrc.1993.2241
5. Nikitenko LL, MacKenzie IZ, Rees MCP, Bicknell R. Adrenomedullin Is an Autocrine Regulator of Endothelial Growth in Human Endometrium. Mol Hum Reprod (2000) 6:811–9. doi: 10.1093/molehr/6.9.811
6. Miyashita K, Itoh H, Sawada N, Fukunaga Y, Sone M, Yamahara K, et al. Adrenomedullin Promotes Proliferation and Migration of Cultured Endothelial Cells. Hypertens Res (2003) 26:S93–8. doi: 10.1291/hypres.26.S93
7. Uzan B, Ea H-K, Launay J-M, Garel J-M, Champy R, Cressent M, et al. A Critical Role for Adrenomedullin-Calcitonin Receptor-Like Receptor in Regulating Rheumatoid Fibroblast-Like Synoviocyte Apoptosis. J Immunol (2006) 176:5548–58. doi: 10.4049/jimmunol.176.9.5548
8. Uzan B, Villemin A, Garel JM, Cressent M. Adrenomedullin Is Anti-Apoptotic in Osteoblasts Through CGRP1 Receptors and MEK-ERK Pathway. J Cell Physiol (2008) 215:122–8. doi: 10.1002/jcp.21294
9. Hinson JP, Kapas S, Smith DM. Adrenomedullin, a Multifunctional Regulatory Peptide. Endocr Rev (2000) 21:138–67. doi: 10.1210/er.21.2.138
10. Allaker RP, Grosvenor PW, McAnerney DC, Sheehan BE, Srikanta BH, Pell K, et al. Mechanisms of Adrenomedullin Antimicrobial Action. Peptides (2006) 27:661–6. doi: 10.1016/j.peptides.2005.09.003
11. Sugo S, Minamino N, Shoji H, Kangawa K, Kitamura K, Eto T, et al. Interleukin-1, Tumor Necrosis Factor and Lipopolysaccharide Additively Stimulate Production of Adrenomedullin in Vascular Smooth Muscle Cells. Biochem Biophys Res Commun (1995) 207:25–32. doi: 10.1006/bbrc.1995.1148
12. Ishimitsu T, Kojima M, Kangawa K, Hino J, Matsuoka H, Kitamura K, et al. Genomic Structure of Human Adrenomedullin Gene. Biochem Biophys Res Commun (1994) 203:631–9. doi: 10.1006/bbrc.1994.2229
13. Wu R, Zhou M, Wang P. Adrenomedullin and Adrenomedullin Binding Protein-1 Downregulate TNF-Alpha in Macrophage Cell Line and Rat Kupffer Cells. Regul Pept (2003) 112:19–26. doi: 10.1016/S0167-0115(03)00018-1
14. Fukuda K, Tsukada H, Oya M, Onomura M, Kodama M, Nakamura H, et al. Adrenomedullin Promotes Epithelial Restitution of Rat and Human Gastric Mucosa in Vitro. Peptides (1999) 20:127–32. doi: 10.1016/S0196-9781(98)00146-6
15. Ashizuka S, Kita T, Inatsu H, Kitamura K. Adrenomedullin: A Novel Therapy for Intractable Ulcerative Colitis. Inflammation Bowel Dis (2013) 19:E26–7. doi: 10.1002/ibd.22891
16. Hojo Y, Ikeda U, Ohya K, Ichida M, Kario K, Takahashi M, et al. Interaction Between Monocytes and Vascular Endothelial Cells Induces Adrenomedullin Production. Atherosclerosis (2001) 155:381–7. doi: 10.1016/S0021-9150(00)00607-9
17. Kubo A, Minamino N, Isumi Y, Kangawa K, Dohi K, Matsuo H. Adrenomedullin Production Is Correlated With Differentiation in Human Leukemia Cell Lines and Peripheral Blood Monocytes. FEBS Lett (1998) 426:233–7. doi: 10.1016/S0014-5793(98)00349-4
18. Del Pup L, Belloni AS, Carraro G, De Angeli S, Parnigotto PP, Nussdorfer GG. Adrenomedullin Is Expressed in Cord Blood Hematopoietic Cells and Stimulates Their Clonal Growth. Int J Mol Med (2003) 11:157–60. doi: 10.3892/ijmm.11.2.157
19. De Angeli S, Del Pup L, Febas E, Conconi MT, Tommasini M, Di Liddo R, et al. Adrenomedullin and Endothelin-1 Stimulate in Vitro Expansion of Cord Blood Hematopoietic Stem Cells. Int J Mol Med (2004) 14:1083–6. doi: 10.3892/ijmm.14.6.1083
20. Chute JP, Muramoto GG, Dressman HK, Wolfe G, Chao NJ, Lin S. Molecular Profile and Partial Functional Analysis of Novel Endothelial Cell-Derived Growth Factors That Regulate Hematopoiesis. Stem Cells (2006) 24:1315–27. doi: 10.1634/stemcells.2005-0029
21. Larráyoz IM, Martínez-Herrero S, García-Sanmartín J, Ochoa-Callejero L, Martínez A. Adrenomedullin and Tumour Microenvironment. J Transl Med (2014) 12:339–53. doi: 10.1186/s12967-014-0339-2
22. Di Liddo R, Bridi D, Gottardi M, De Angeli S, Grandi C, Tasso A, et al. Adrenomedullin in the Growth Modulation and Differentiation of Acute Myeloid Leukemia Cells. Int J Oncol (2016) 48:1659–69. doi: 10.3892/ijo.2016.3370
23. Nakayama M, Takahashi K, Kitamuro T, Murakami O, Shirato K, Shibahara S. Transcriptional Control of Adrenomedullin Induction by Phorbol Ester in Human Monocytic Leukemia Cells. Eur J Biochem (2000) 267:3559–66. doi: 10.1046/j.1432-1327.2000.01384.x
24. Stunnenberg HG, Abrignani S, Adams D, de Almeida M, Altucci L, Amin V, et al. The International Human Epigenome Consortium: A Blueprint for Scientific Collaboration and Discovery. Cell (2016) 167:1145–9. doi: 10.1016/j.cell.2016.11.007
25. Schwarzer A, Emmrich S, Schmidt F, Beck D, Ng M, Reimer C, et al. The Non-Coding RNA Landscape of Human Hematopoiesis and Leukemia. Nat Commun (2017) 8:218–34. doi: 10.1038/s41467-017-00212-4
26. Novershtern N, Subramanian A, Lawton LN, Mak RH, Haining WN, McConkey ME, et al. Densely Interconnected Transcriptional Circuits Control Cell States in Human Hematopoiesis. Cell (2011) 144:296–309. doi: 10.1016/j.cell.2011.01.004
27. Gentles AJ, Plevritis SK, Majeti R, Alizadeh AA. Association of a Leukemic Stem Cell Gene Expression Signature With Clinical Outcomes in Acute Myeloid Leukemia. JAMA - J Am Med Assoc (2010) 304:2706–15. doi: 10.1001/jama.2010.1862
28. Jung N, Dai B, Gentles AJ, Majeti R, Feinberg AP. An LSC Epigenetic Signature Is Largely Mutation Independent and Implicates the HOXA Cluster In AML Pathogenesis. Nat Commun (2015) 6:8489–500. doi: 10.1038/ncomms9489
29. Lux S, Blätte TJ, Gillissen B, Richter A, Cocciardi S, Skambraks S, et al. Deregulated Expression of Circular Rnas in Acute Myeloid Leukemia. Blood Adv (2021) 5:1490–503. doi: 10.1182/bloodadvances.2020003230
30. Radpour R, Riether C, Simillion C, Höpner S, Bruggmann R, Ochsenbein AF. CD8+ T Cells Expand Stem and Progenitor Cells in Favorable But Not Adverse Risk Acute Myeloid Leukemia. Leukemia (2019) 33:2379–92. doi: 10.1038/s41375-019-0441-9
31. Le Dieu R, Taussig DC, Ramsay AG, Mitter R, Miraki-Moud F, Fatah R, et al. Peripheral Blood T Cells in Acute Myeloid Leukemia (AML) Patients At Diagnosis Have Abnormal Phenotype and Genotype and Form Defective Immune Synapses With AML Blasts. Blood (2009) 114:3909–16. doi: 10.1182/blood-2009-02-206946
32. Wouters BJ, Löwenberg B, Erpelinck-Verschueren CAJ, Van Putten WLJ, Valk PJM, Delwel R. Double CEBPA Mutations, But Not Single CEBPA Mutations, Define a Subgroup of Acute Myeloid Leukemia With a Distinctive Gene Expression Profile That Is Uniquely Associated With a Favorable Outcome. Blood (2009) 113:3088–91. doi: 10.1182/blood-2008-09-179895
33. Verhaak RGW, Wouters BJ, Erpelinck CAJ, Abbas S, Beverloo HB, Lugthart S, et al. Prediction of Molecular Subtypes in Acute Myeloid Leukemia Based on Gene Expression Profiling. Haematologica (2009) 94:131–4. doi: 10.3324/haematol.13299
34. Kohlmann A, Kipps TJ, Rassenti LZ, Downing JR, Shurtleff SA, Mills KI, et al. An International Standardization Programme Towards the Application of Gene Expression Profiling in Routine Leukaemia Diagnostics: The Microarray Innovations in Leukemia Study Prephase. Br J Haematol (2008) 142:802–7. doi: 10.1111/j.1365-2141.2008.07261.x
35. Simonetti G, Padella A, do Valle IF, Fontana MC, Fonzi E, Bruno S, et al. Aneuploid Acute Myeloid Leukemia Exhibits a Signature of Genomic Alterations in the Cell Cycle and Protein Degradation Machinery. Cancer (2018) 125:712–25. doi: 10.1002/cncr.31837
36. Salvestrini V, Ciciarello M, Pensato V, Simonetti G, Laginestra MA, Bruno S, et al. Denatonium as a Bitter Taste Receptor Agonist Modifies Transcriptomic Profile and Functions of Acute Myeloid Leukemia Cells. Front Oncol (2020) 10:1225. doi: 10.3389/fonc.2020.01225
37. Tyner JW, Tognon CE, Bottomly D, Wilmot B, Kurtz SE, Savage SL, et al. Functional Genomic Landscape of Acute Myeloid Leukaemia. Nature (2018) 562:526–31. doi: 10.1038/s41586-018-0623-z
38. The Cancer Genome Atlas. Genomic and Epigenomic Landscapes of Adult De Novo Acute Myeloid Leukemia the Cancer Genome Atlas Research Network. N Engl J Med (2013) 368:2059–74. doi: 10.1056/NEJMoa1301689
39. Li B, Dewey CN. RSEM: Accurate Transcript Quantification From RNA-Seq Data With or Without a Reference Genome. BMC Bioinf (2011) 12:323–38. doi: 10.1186/1471-2105-12-323
40. Robinson MD, McCarthy DJ, Smyth GK. Edger: A Bioconductor Package for Differential Expression Analysis of Digital Gene Expression Data. Bioinformatics (2009) 26:139–40. doi: 10.1093/bioinformatics/btp616
41. Love MI, Huber W, Anders S. Moderated Estimation of Fold Change and Dispersion for RNA-Seq Data With Deseq2. Genome Biol (2014) 15:550–70. doi: 10.1186/s13059-014-0550-8
42. R Core Team 2019. R: A Language and Environment for Statistical Computing. R Found Stat Comput Vienna Austria (2019). http://www.R-project.org/.
44. Virtanen P, Gommers R, Oliphant TE, Haberland M, Reddy T, Cournapeau D, et al. Scipy 1.0: Fundamental Algorithms for Scientific Computing in Python. Nat Methods (2020) 17:261–72. doi: 10.1038/s41592-019-0686-2
45. Kuleshov MV, Jones MR, Rouillard AD, Fernandez NF, Duan Q, Wang Z, et al. Enrichr: A Comprehensive Gene Set Enrichment Analysis Web Server 2016 Update. Nucleic Acids Res (2016) 44:W90–7. doi: 10.1093/nar/gkw377
46. Subramanian A, Tamayo P, Mootha VK, Mukherjee S, Ebert BL, Gillette MA, et al. Gene Set Enrichment Analysis: A Knowledge-Based Approach for Interpreting Genome-Wide Expression Profiles. Proc Natl Acad Sci USA (2005) 102:15545–50. doi: 10.1073/pnas.0506580102
47. Zwiener I, Frisch B, Binder H. Transforming RNA-Seq Data to Improve the Performance of Prognostic Gene Signatures. PloS One (2014) 9:e85150–62. doi: 10.1371/journal.pone.0085150
48. Ginestet C. Ggplot2: Elegant Graphics for Data Analysis. J R Stat Soc Ser A (2011) 174:245–6. doi: 10.1111/j.1467-985X.2010.00676_9.x
49. Nakayama M, Takahashi K, Murakami O, Murakami H, Sasano H, Shirato K, et al. Adrenomedullin in Monocytes and Macrophages: Possible Involvement of Macrophage-Derived Adrenomedullin in Atherogenesis. Clin Sci (1999) 97:247–51. doi: 10.1042/CS19990108
50. Angenendt L, Bormann E, Pabst C, Alla V, Görlich D, Braun L, et al. The Neuropeptide Receptor Calcitonin Receptor-Like (CALCRL) Is a Potential Therapeutic Target in Acute Myeloid Leukemia. Leukemia (2019) 33:2830–41. doi: 10.1038/s41375-019-0505-x
51. Ou Y, Wang SJ, Li D, Chu B, Gu W. Activation of SAT1 Engages Polyamine Metabolism With P53-Mediated Ferroptotic Responses. Proc Natl Acad Sci USA (2016) 113:E6806–12. doi: 10.1073/pnas.1607152113
52. Zhang H, Nakauchi Y, Köhnke T, Stafford M, Bottomly D, Thomas R, et al. Integrated Analysis of Patient Samples Identifies Biomarkers for Venetoclax Efficacy and Combination Strategies in Acute Myeloid Leukemia. Nat Cancer (2020) 1:826–39. doi: 10.1038/s43018-020-0103-x
53. Bisaillon R, Moison C, Thiollier C, Krosl J, Bordeleau ME, Lehnertz B, et al. Genetic Characterization of ABT-199 Sensitivity in Human AML. Leukemia (2020) 34:63–74. doi: 10.1038/s41375-019-0485-x
54. Nakamura S, Nagata Y, Tan L, Takemura T, Shibata K, Fujie M, et al. Transcriptional Repression of Cdc25B by IER5 Inhibits the Proliferation of Leukemic Progenitor Cells Through NF-YB and P300 in Acute Myeloid Leukemia. PloS One (2011) 6:e28011–25. doi: 10.1371/journal.pone.0028011
55. Dos Santos C, Demur C, Bardet V, Prade-Houdellier N, Payrastre B, Récher C. A Critical Role for Lyn in Acute Myeloid Leukemia. Blood (2008) 111:2269–79. doi: 10.1182/blood-2007-04-082099
56. Dos Santos C, Mcdonald T, Ho YW, Liu H, Lin A, Forman SJ, et al. The Src and C-Kit Kinase Inhibitor Dasatinib Enhances P53-Mediated Targeting of Human Acute Myeloid Leukemia Stem Cells by Chemotherapeutic Agents. Blood (2013) 122:1900–13. doi: 10.1182/blood-2012-11-466425
57. Roversi FM, Pericole FV, Machado-Neto JA, da Silva Santos Duarte A, Longhini AL, Corrocher FA, et al. Hematopoietic Cell Kinase (HCK) Is a Potential Therapeutic Target for Dysplastic and Leukemic Cells Due to Integration of Erythropoietin/PI3K Pathway and Regulation of Erythropoiesis: HCK in Erythropoietin/PI3K Pathway. Biochim Biophys Acta - Mol Basis Dis (2017) 1863:450–61. doi: 10.1016/j.bbadis.2016.11.013
58. Advani AS, Cooper B, Visconte V, Elson P, Chan R, Carew J, et al. A Phase I/II Trial of MEC (Mitoxantrone, Etoposide, Cytarabine) in Combination With Ixazomib for Relapsed Refractory Acute Myeloid Leukemia. Clin Cancer Res (2019) 25:4231–37. doi: 10.1158/1078-0432.CCR-18-3886
59. Liang Y, Yu B, Chen J, Wu H, Xu Y, Yang B, et al. Thymic Stromal Lymphopoietin Epigenetically Upregulates Fc Receptor Γ Subunit–Related Receptors on Antigen-Presenting Cells and Induces TH2/TH17 Polarization Through Dectin-2. J Allergy Clin Immunol (2019) 144:1025–35. doi: 10.1016/j.jaci.2019.06.011
60. Makino Y, Nakamura H, Ikeda E, Ohnuma K, Yamauchi K, Yabe Y, et al. Hypoxia-Inducible Factor Regulates Survival of Antigen Receptor-Driven T Cells. J Immunol (2003) 171:6534–40. doi: 10.4049/jimmunol.171.12.6534
61. Rullé S, Ah Kioon MD, Asensio C, Mussard J, Ea HK, Boissier MC, et al. Adrenomedullin, a Neuropeptide With Immunoregulatory Properties Induces Semi-Mature Tolerogenic Dendritic Cells. Immunology (2012) 136:252–64. doi: 10.1111/j.1365-2567.2012.03577.x
62. Pedreño M, Morell M, Robledo G, Souza-Moreira L, Forte-Lago I, Caro M, et al. Adrenomedullin Protects From Experimental Autoimmune Encephalomyelitis At Multiple Levels. Brain Behav Immun (2014) 37:152–63. doi: 10.1016/j.bbi.2013.11.021
63. Gonzalez-Rey E, Chorny A, O’Valle F, Delgado M. Adrenomedullin Protects From Experimental Arthritis by Down-Regulating Inflammation and Th1 Response and Inducing Regulatory T Cells. Am J Pathol (2007) 170:263–71. doi: 10.2353/ajpath.2007.060596
64. Kolde R. Package ‘Pheatmap’. Bioconductor (2012), 1–6. https://mran.microsoft.com/snapshot/2017-09-01/web/packages/pheatmap/pheatmap.pdf.
65. Bollinger AL, Bollinger T, Rupp J, Shima K, Gross N, Padayachy L, et al. Annexin V Expression on CD4+ T Cells With Regulatory Function. Immunology (2020) 159:205–20. doi: 10.1111/imm.13140
66. Katagiri T, Yamazaki S, Fukui Y, Aoki K, Yagita H, Nishina T, et al. Junb Plays a Crucial Role in Development of Regulatory T Cells by Promoting IL-2 Signaling. Mucosal Immunol (2019) 12:1104–17. doi: 10.1038/s41385-019-0182-0
67. Price JG, Idoyaga J, Salmon H, Hogstad B, Bigarella CL, Ghaffari S, et al. CDKN1A Regulates Langerhans Cell Survival and Promotes Treg Cell Generation Upon Exposure to Ionizing Irradiation. Nat Immunol (2015) 16:1060–8. doi: 10.1038/ni.3270
68. Lee K, Won HY, Bae MA, Hong JH, Hwang ES. Spontaneous and Aging-Dependent Development of Arthritis in NADPH Oxidase 2 Deficiency Through Altered Differentiation of CD11b+ and Th/Treg Cells. Proc Natl Acad Sci USA (2011) 108:9548–53. doi: 10.1073/pnas.1012645108
69. MaruYama T, Kobayashi S, Ogasawara K, Yoshimura A, Chen W, Muta T. Control of IFN-Γ Production and Regulatory Function by the Inducible Nuclear Protein Iκb-Zeta in T Cells. J Leukoc Biol (2015) 98:385–93. doi: 10.1189/jlb.2a0814-384r
70. Dai X, Ma W, He XJ, Jha RK. Elevated Expression of Adrenomedullin Is Correlated With Prognosis and Disease Severity in Osteosarcoma. Med Oncol (2013) 30:347. doi: 10.1007/s12032-012-0347-0
71. Park SC, Yoon JH, Lee JH, Yu SJ, Myung SJ, Kim W, et al. Hypoxia-Inducible Adrenomedullin Accelerates Hepatocellular Carcinoma Cell Growth. Cancer Lett (2008) 271:314–22. doi: 10.1016/j.canlet.2008.06.019
72. Nakata T, Seki N, Miwa S, Kobayashi A, Soeda J, Nimura Y, et al. Identification of Genes Associated With Multiple Nodules in Hepatocellular Carcinoma Using Cdna Microarray: Multicentric Occurrence or Intrahepatic Metastasis? Hepatogastroenterology (2008) 55:865–72.
73. Deville JL, Bartoli C, Berenguer C, Fernandez-Sauze S, Kaafarani I, Delfino C, et al. Expression and Role of Adrenomedullin in Renal Tumors and Value of Its Mrna Levels as Prognostic Factor in Clear-Cell Renal Carcinoma. Int J Cancer (2009) 125:2307–15. doi: 10.1002/ijc.24568
74. Uemura M, Yamamoto H, Takemasa I, Mimori K, Mizushima T, Ikeda M, et al. Hypoxia-Inducible Adrenomedullin in Colorectal Cancer. Anticancer Res (2011) 31:507–14.
75. Rocchi P, Boudouresque F, Zamora AJ, Muracciole X, Lechevallier E, Martin PM, et al. Expression of Adrenomedullin and Peptide Amidation Activity in Human Prostate Cancer and in Human Prostate Cancer Cell Lines. Cancer Res (2001) 61:1196–206.
76. Ouafik L, Sauze S, Boudouresque F, Chinot O, Delfino C, Fina F, et al. Neutralization of Adrenomedullin Inhibits the Growth of Human Glioblastoma Cell Lines in Vitro and Suppresses Tumor Xenograft Growth in Vivo. Am J Pathol (2002) 160:1279–92. doi: 10.1016/S0002-9440(10)62555-2
77. Kazi JU, Rönnstrand L. Src-Like Adaptor Protein (SLAP) Binds to the Receptor Tyrosine Kinase Flt3 and Modulates Receptor Stability and Downstream Signaling. PloS One (2012) 7:e53509–16. doi: 10.1371/journal.pone.0053509
78. Tripodo C, Burocchi A, Piccaluga PP, Chiodoni C, Portararo P, Cappetti B, et al. Persistent Immune Stimulation Exacerbates Genetically Driven Myeloproliferative Disorders Via Stromal Remodeling. Cancer Res (2017) 77:3685–99. doi: 10.1158/0008-5472.CAN-17-1098
79. Corrigan DJ, Luchsinger LL, De Almeida MJ, Williams LJ, Strikoudis A, Snoeck HW. PRDM16 Isoforms Differentially Regulate Normal and Leukemic Hematopoiesis and Inflammatory Gene Signature. J Clin Invest (2018) 128:3250–64. doi: 10.1172/JCI99862
80. Hua KT, Lee WJ, Yang SF, Chen CK, Hsiao M, Ku CC, et al. Vascular Endothelial Growth Factor-C Modulates Proliferation and Chemoresistance in Acute Myeloid Leukemic Cells Through an Endothelin-1-Dependent Induction of Cyclooxygenase-2. Biochim Biophys Acta - Mol Cell Res (2014) 1843:387–97. doi: 10.1016/j.bbamcr.2013.10.015
Keywords: acute myeloid leukemia, adrenomedullin, hematopoiesis, inflammation, leukemia stem cells
Citation: Simonetti G, Angeli D, Petracci E, Fonzi E, Vedovato S, Sperotto A, Padella A, Ghetti M, Ferrari A, Robustelli V, Di Liddo R, Conconi MT, Papayannidis C, Cerchione C, Rondoni M, Astolfi A, Ottaviani E, Martinelli G and Gottardi M (2021) Adrenomedullin Expression Characterizes Leukemia Stem Cells and Associates With an Inflammatory Signature in Acute Myeloid Leukemia. Front. Oncol. 11:684396. doi: 10.3389/fonc.2021.684396
Received: 23 March 2021; Accepted: 23 April 2021;
Published: 02 June 2021.
Edited by:
Alessandro Isidori, AORMN Hospital, ItalyReviewed by:
Adrián Mosquera Orgueira, University Hospital of Santiago de Compostela, SpainSara Galimberti, University of Pisa, Italy
Paolo Sportoletti, University of Perugia, Italy
Copyright © 2021 Simonetti, Angeli, Petracci, Fonzi, Vedovato, Sperotto, Padella, Ghetti, Ferrari, Robustelli, Di Liddo, Conconi, Papayannidis, Cerchione, Rondoni, Astolfi, Ottaviani, Martinelli and Gottardi. This is an open-access article distributed under the terms of the Creative Commons Attribution License (CC BY). The use, distribution or reproduction in other forums is permitted, provided the original author(s) and the copyright owner(s) are credited and that the original publication in this journal is cited, in accordance with accepted academic practice. No use, distribution or reproduction is permitted which does not comply with these terms.
*Correspondence: Giorgia Simonetti, Z2lvcmdpYS5zaW1vbmV0dGlAaXJzdC5lbXIuaXQ=