 Farhad Dastmalchi
 Loic P. Deleyrolle
 Aida Karachi
 Duane A. Mitchell
 Maryam Rahman
- Department of Neurosurgery, Preston A. Wells, Jr. Center for Brain Tumor Therapy, University of Florida, Gainesville, FL, United States
Immunotherapy has revolutionized care for many solid tissue malignancies, and is being investigated for efficacy in the treatment of malignant brain tumors. Identifying a non-invasive monitoring technique such as metabolomics monitoring to predict patient response to immunotherapy has the potential to simplify treatment decision-making and to ensure therapy is tailored based on early patient response. Metabolomic analysis of peripheral immune response is feasible due to large metabolic shifts that immune cells undergo when activated. The utility of this approach is under investigation. In this review, we discuss the metabolic changes induced during activation of an immune response, and the role of metabolic profiling to monitor immune responses in the context of immunotherapy for malignant brain tumors. This review provides original insights into how metabolomics monitoring could have an important impact in the field of tumor immunotherapy if achievable.
Introduction
Immunotherapy for cancer has gained increasing enthusiasm with certain high-profile examples of success in traditionally resistant solid tissue tumors (1–5). Immunotherapy can be delivered with various platforms and all of them lead to anti-tumor adaptive immune responses systemically and within the tumor microenvironment. These strategies include but not limited to dendritic cell (DC) vaccines (6, 7), peptide vaccines (EGFRVIII and heat shock protein) (8), chimeric antigen receptor (CAR)-T cells (9), use of hematopoietic stem cells (10), and of course immune checkpoint inhibitors [e.g. programmed cell death protein 1 (PD-1)/programmed death-ligand 1 (PD-L1) (11, 12) and CTLA-4 (13)]. However, the efficacy of these therapies relies on the ability to induce an adaptive immune response. Early determination of an effective immune response during the treatment course would allow identification of non-responders prior to tumor progression and an early change in treatment. This approach would prevent patients from receiving ineffective treatment, and potentially result in better clinical outcomes.
Several methods have been developed to evaluate adaptive antigen responses including delayed-type hypersensitivity (14, 15), tetramer analysis (16), ELISA (15, 17) (enzyme-linked immunosorbent assay) for measuring bulk cytokine production, ELISPOT (18) (enzyme-linked immune absorbent spot assay) for measuring individual cytokine-producing T cells, flow cytometry-based (19) analysis of cytokine expression, and PCR (20) (polymerase chain reaction) based detection of T-cell receptor gene usage or cytokine production (21). Limitations to these approaches are the magnitude of T cell proliferation necessary to measure response, and measurement of only antigen specific T cell responses. Moreover, these measures have not been shown to have robust and reproducible correlations with patient outcomes (16, 21–23).
An alternative to traditional immune assays is the use of metabolomics to assess the dynamic immune related changes that ensue after immunotherapy. In the last decade, most cancer-related metabolomic studies focused on the tumor microenvironment for use as a diagnostic or prognostic tool (24, 25). Using metabolomic profiling to evaluate immune responses is a novel area of cancer research with the potential to develop methods for measurement of global dynamic changes that may correlate with treatment response or overall outcome. This review will discuss metabolomics methodology, changes in the metabolism of immune cell subsets that can be measured in the context of malignant brain tumors, and the use of metabolomics to evaluate patients receiving immunotherapy for brain tumors.
Metabolomics Methodology
Metabolites are most commonly measured using mass spectrometry (MS) or nuclear magnetic resonance spectroscopy (NMR). Less common techniques include Fourier transform infrared spectroscopy (FT-IR), ultraviolet-visible spectroscopy (UV) and Raman spectroscopy.
● Nuclear magnetic resonance spectroscopy (NMR)
NMR is a spectroscopic technique that uses spin properties of the nucleus of atoms to detect metabolites. NMR is fast and ideal for screening. It requires minimum sample preparation and generates structural information (25). NMR has been used in brain tumor studies to identify the tumor related and treatment related metabolic shifts in patients body fluids including urine and blood (26–28).
● Gas chromatography/mass spectrometry (GC/MS)
GC/MS is more sensitive compared to NMR, but is also more time intensive and expensive. GC/MS allows for detection of small concentrations. GC/MS is often used for more detailed analysis after initial screening with NMR (29). GC/MS has been used in brain tumor studies to identify the tumor-associated metabolites in serum (30), Cerebrospinal fluid (CSF) (31), extracellular fluid (32) and tumor (33) samples.
● Liquid chromatography-mass spectrometry (LC-MS)
LC is the most versatile separation method. LC-MS can separate compounds in a broad spectrum of polarity with less hassle in sample preparation. Liquid chromatography is used to separate metabolites to overcome problems associated with direct mass spectrometry analysis of complex biological samples. LC-MS was used for metabolomics analysis in brain tumors to phenotyping the glioma tumors (34).
● Seahorse XF technology
Seahorse XF measures dissolved oxygen and proton excretion to calculate rate of mitochondrial respiration and glycolysis. This technology allowing real time functional monitoring of the metabolic profile of cells, represent an innovative tool to interrogate T cell proliferation, activation and phenotype for example (35, 36).
● Sample preparation
Sample preparation is incredibly important for metabolomics and can impact overall conclusions. In all biological systems, metabolites of a broad spectrum of chemical diversity exist in a variable range of concentrations. A typical biological cell contains about 5000 metabolites at varying concentrations, which can make identification of most of the metabolites challenging (37). Therefore, the quality of sample preparation technique, environment, and quantity of prepared sample may significantly affect the spectrum of the detected metabolome (38). One strategy to improve sample preparation includes sequential extractions and concentrations to favor a particular class of compound that may be of interest (37). Attention to sample preparation is key to identifying the metabolomic changes as these responses may be of small overall magnitude within the host.
Overview of Cellular Metabolism
Immune cells undergo large metabolic shifts as they mature and activate during an immune response. These changes can be profound during a robust immune response and can be detected from blood, urine or tumor samples. Cellular energy production is achieved through metabolism of fats, sugars and proteins in the mitochondria in the presence of oxygen or through the breakdown of just sugars in the absence of oxygen in the cytoplasm. Oxidative metabolism in the mitochondria produces 20 times more ATP compared to anaerobic metabolism (39). The mitochondria uses three enzymatic processes to generate ATP: the tricarboxylic acid (TCA) cycle, oxidative phosphorylation (OXPHOS), and fatty acid-beta oxidation (FAO). Generation of acetyl-CoA through glycolysis and FAO leads to intermediates necessary for the TCA cycle and ultimately OXPHOS. On the other hand, anaerobic glycolysis in the cytoplasm is often utilized by cells that are actively proliferating or acquiring effector function. Glycolysis is characterized by high utilization of glucose and glutamine, and shunting of pyruvate to produce lactate in the cytosol, even in the presence of abundant oxygen. This program requires high nutrient input but also allows metabolic intermediates to be used for biosynthesis. Overall, aerobic glycolysis is less efficient for ATP production than OXPHOS however it is a faster process supporting cell proliferation and activation (40) (Figure 1).
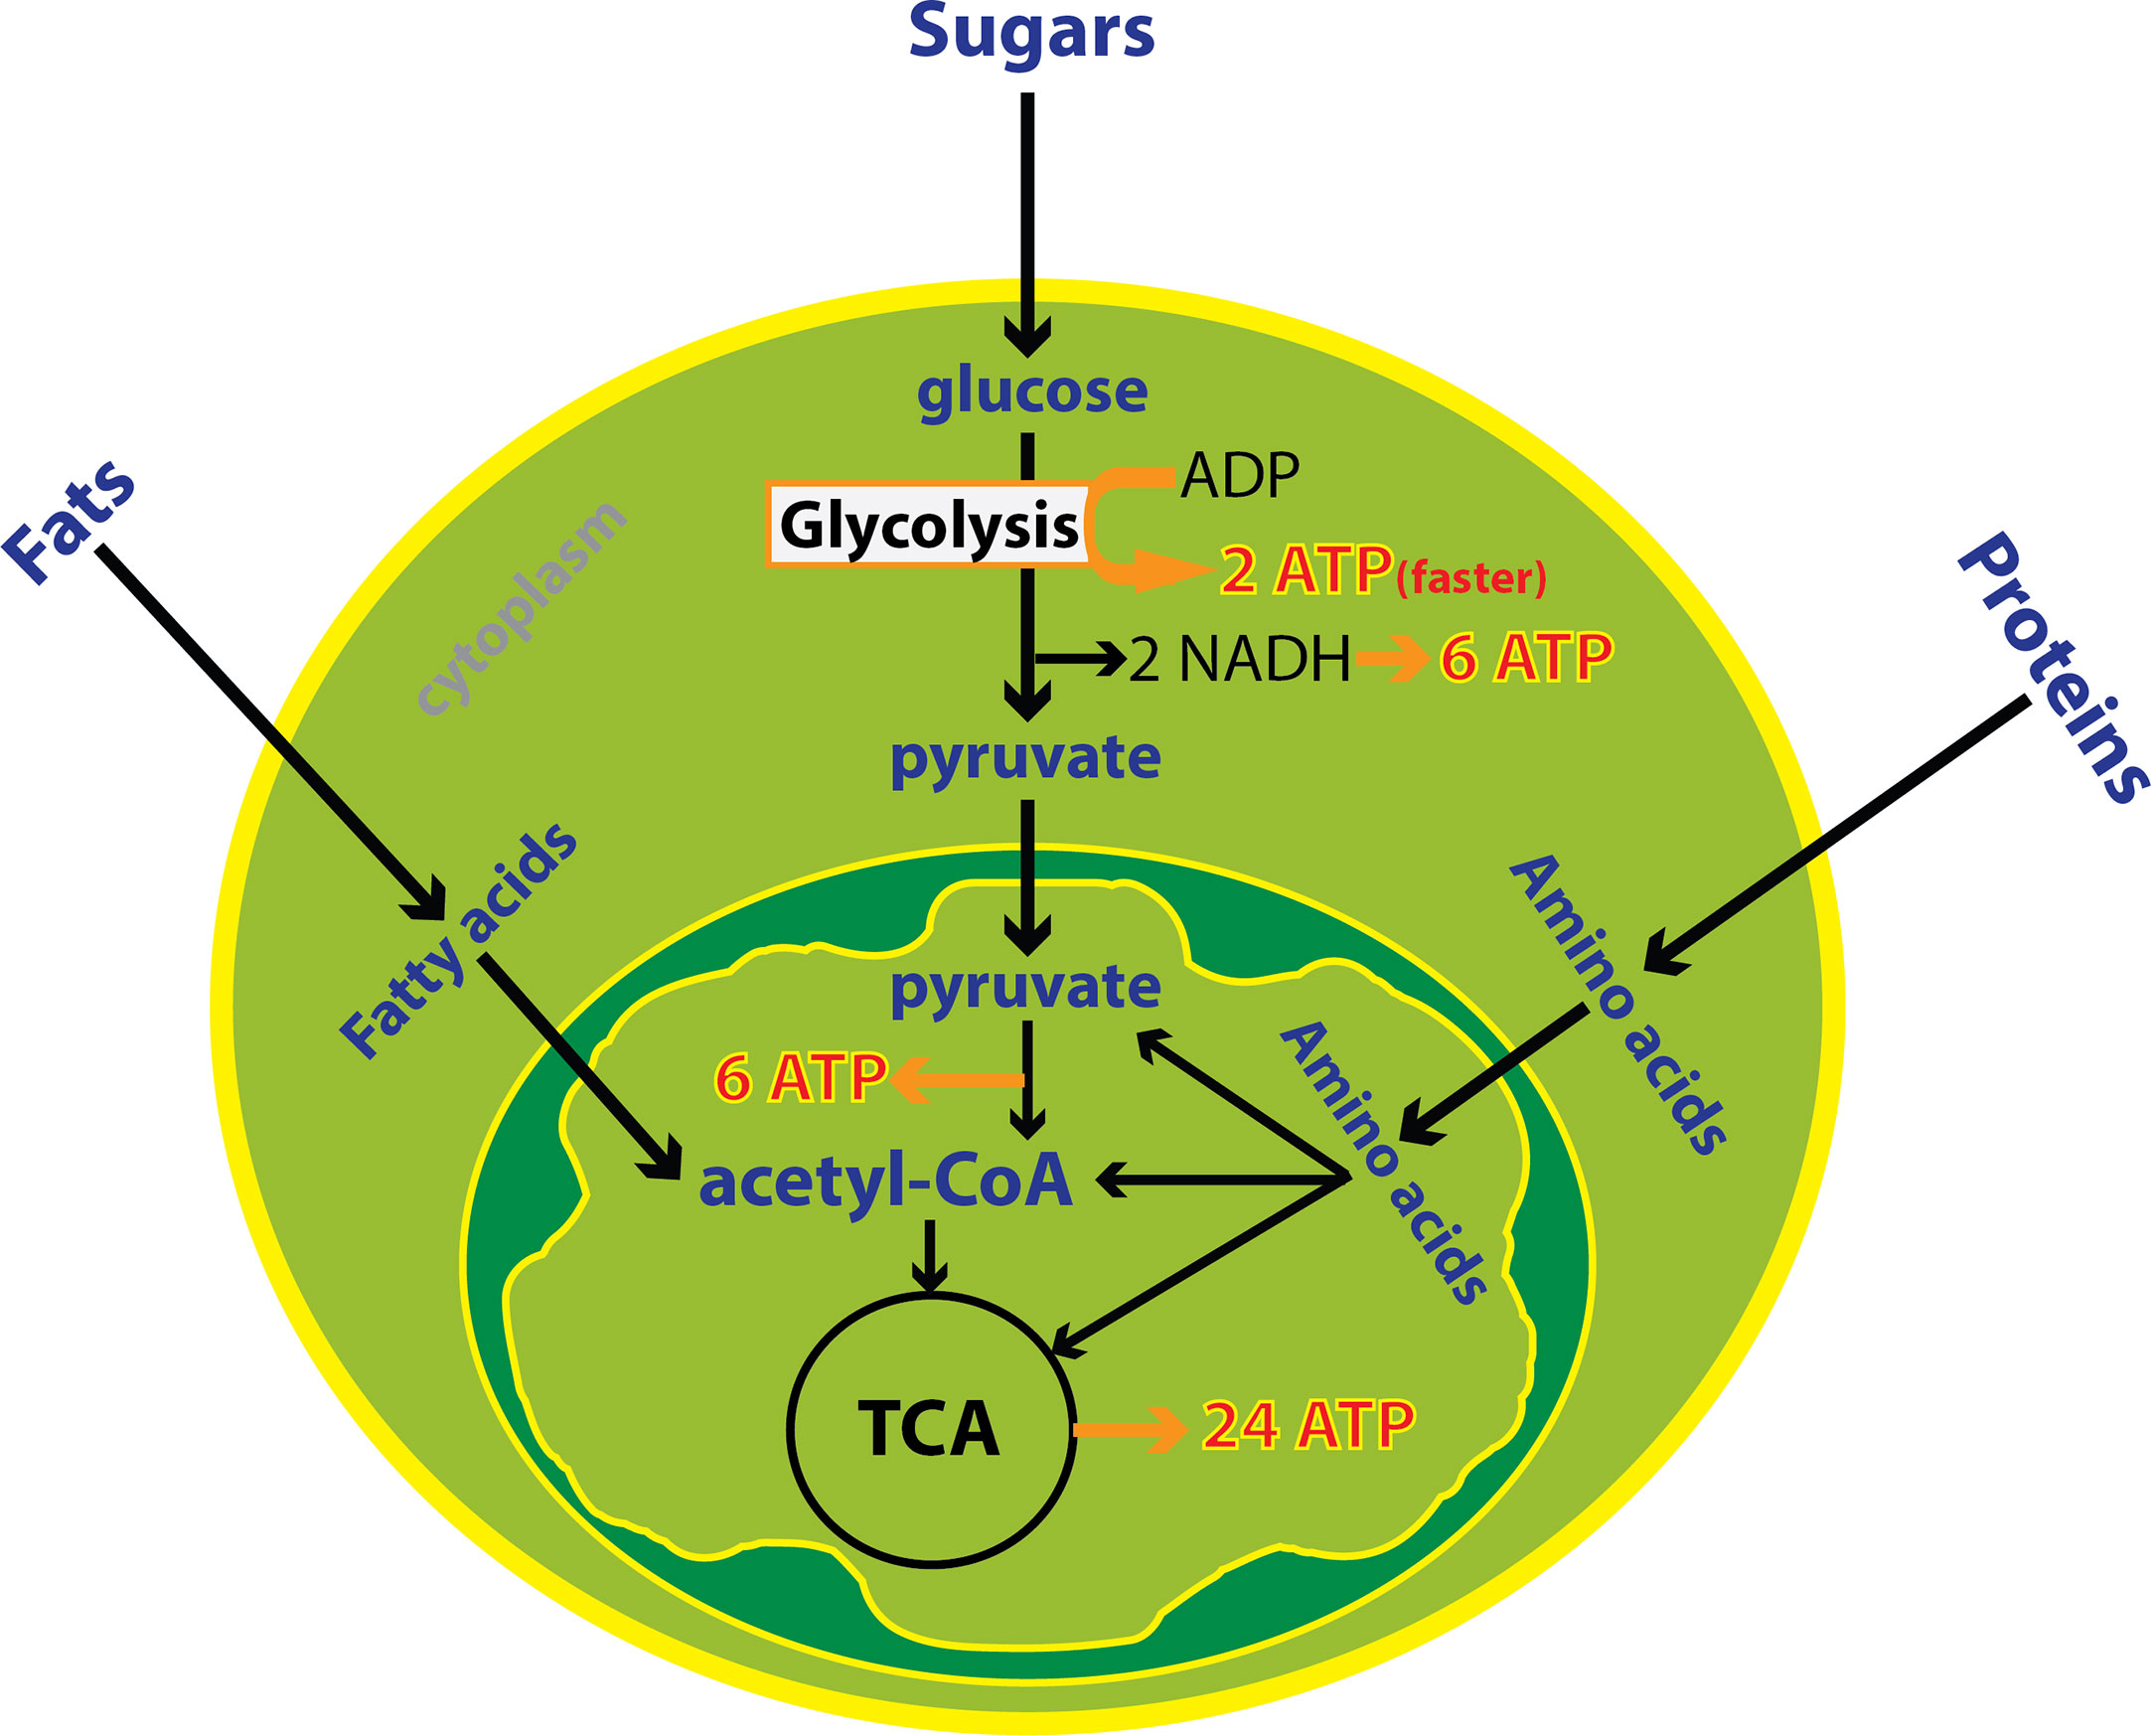
Figure 1 Cytoplasmic and mitochondrial metabolic pathways. Cellular energy is produced through metabolism of fats, sugars and proteins in the mitochondria in the presence of oxygen or the breakdown of glucose in the absence of oxygen in the cytoplasm. Oxidative metabolism in the mitochondria produces more ATP compared to anaerobic metabolism. Despite, glycolysis is less efficient but it is one hundred times faster than oxidative metabolism. In total, 38 ATP is derived from one molecule of glucose including 8 ATP from cytoplasmic metabolism and 30 ATPs from mitochondrial metabolism.
Generally, cells have the ability to switch cellular metabolism between oxidative and anaerobic based on their metabolic demands. The metabolic demands of immune cell subsets in circulation and within the tumor microenvironment shift depending on their functional status. Cells important for innate and adaptive immunity produce metabolites that can be detected in the peripheral blood or urine using metabolomic analysis.
Metabolomics of Innate Immunity
Tumor-Associated Macrophages
Tumor-associated macrophages (TAMs) represent the majority of tumor-infiltrating myeloid cells in most solid malignancies and are identified by CD68 (41, 42). TAMs support tumor progression and provide an environment that promotes tumor growth (41, 43). Macrophages can be polarized to an M1 (pro-inflammatory, infection-response) or M2 (anti-inflammatory, tissue-repair) state (44). In general, M1- macrophages are characterized by a glycolytic metabolism with high lactate secretion as well as biosynthesis of NADPH, lipids, and nucleotides. M1 macrophages also vigorously produce reactive oxygen species (ROS) (40) that leads to cytocidal function. Alternatively, M2 macrophages use oxidative metabolism for bioenergetics purposes, which allows for tissue repair (40) (Figure 2). M2 macrophages have elevated glutamine and fatty acid consumption. Interestingly, TAMs have alternative metabolic programs including lipid metabolism that results from dysregulated enzymes including acetyl-CoA dehydrogenase medium chain and monoglyceride lipase (45–47). This lipid metabolism is a sign of their metabolic fitness.
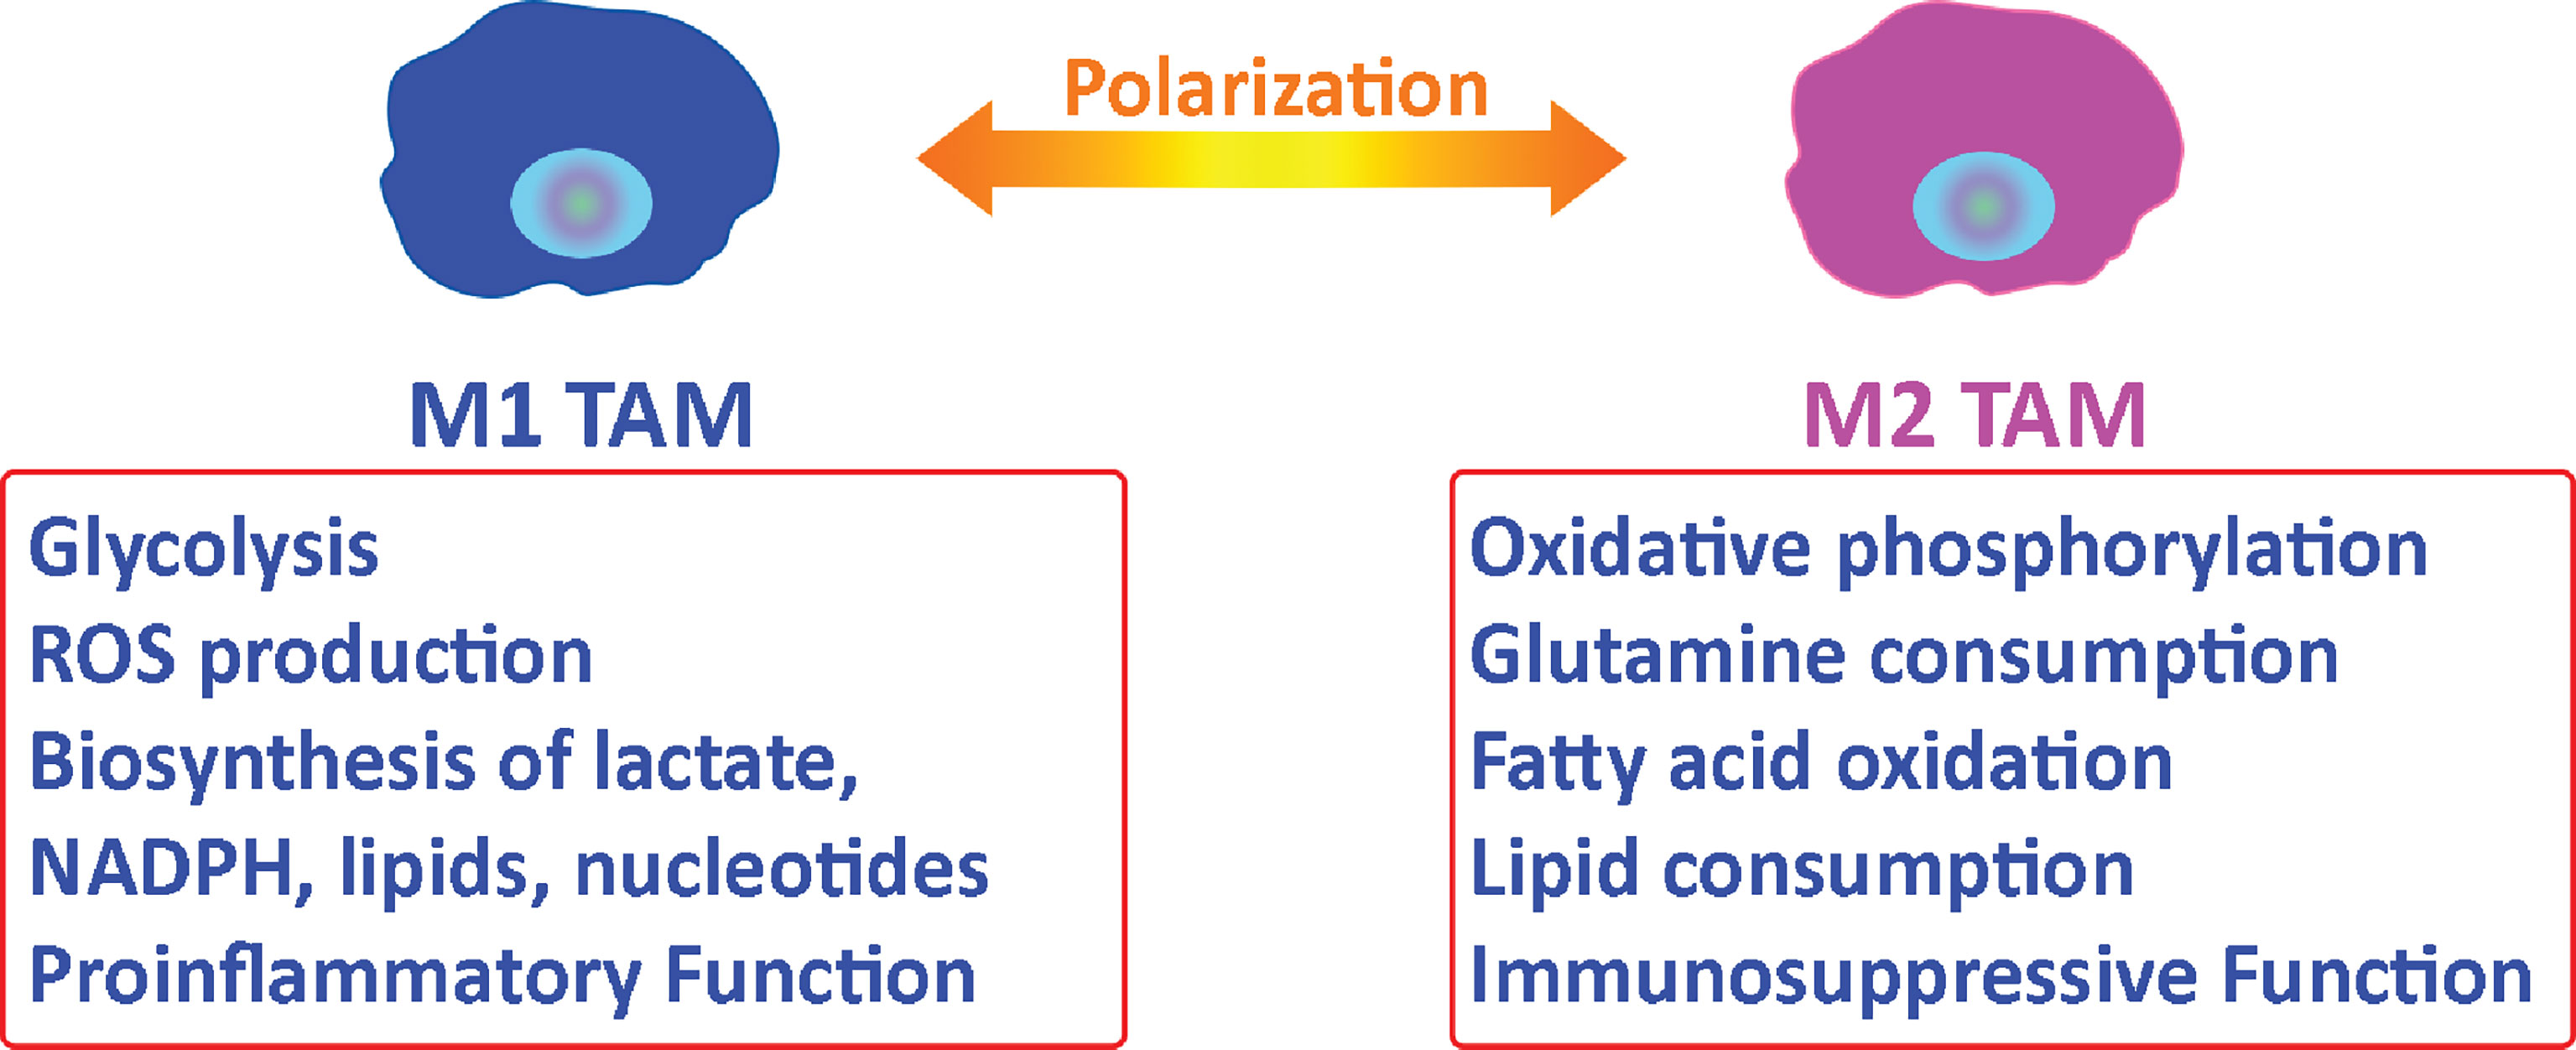
Figure 2 Metabolic relationship between tumor-associated macrophages and tumor cells. Macrophages can be polarized to an M1 or M2 state. M2 tumor-associated macrophages support tumor progression by providing nutritional demands for tumor cells proliferation and suppressing the immune response in the tumor microenvironment.
The data on the metabolism of tumor-infiltrating TAMs is mixed. In some studies, TAMs utilizing OXPHOS was associated with increased immunosuppression and poor patient outcomes (43). In other studies, mostly in in vitro or murine experiments, found that exposure to tumor cells cause TAMs to shift to glycolysis with a more immunosuppressive phenotype. These TAMs secrete lactate, TNF and IL6 (48–50). Moreover, the canonical markers of M1 or M2 activation can be co-expressed by TAMs (43), explaining the conflicting studies on TAM metabolism within the TME. Single-cell RNA sequencing and deconvolution platforms can address these challenges and identify the macrophage clusters (51). However, due to the complexity of macrophage metabolism in patients with cancer, the use of metabolomics to determine macrophage proliferation or effector function has many challenges.
Natural Killer Cells
Natural killer (NK) cells are cytotoxic innate lymphocytes that play a major role in the primary immune response (52). NK cells are a potential source of interferon-gamma (IFN-γ) production and NK cell effector function is directly related to metabolism (53). NK cells utilize low levels of glycolysis and OXPHOS when they are resting (54), which is enough for IFN-γ production. Stimulation of NKs results in significant increases in the level of both glycolysis and OXPHOS (55, 56) along with an increase in mitochondrial mass (57).
When NKs are activated, they produce pyruvates which do not enter the tricarboxylic acid (TCA) cycle (57). These pyruvates are metabolized to mitochondrial-citrate by entering the citrate–malate shuttle (CMS) (57). CMS is an alternative for TCA in the mitochondria to produce NADH as an energy source for OXPHOS and ATP synthesis. CMS also generates cytosolic NAD+, which is a necessary cofactor to increase the rate of glycolysis (57). NK cells are well-known effector lymphocytes against cancer. However, tumor-associated NKs can be dysfunctional due to metabolic derangements. In a lung cancer model, NKs were found to have increased expression of fructose-1,6-bisphosphatase (FBP1) which regulates gluconeogenesis (58) and inhibits glycolysis. Upregulation of FBP1 in tumor-associated NKs decreased glycolysis and resulted in less cytotoxicity and viability. Therefore, metabolic markers of glycolysis and CMS would be signatures of NK activation after immunotherapy, but may be blunted in patients with tumor associated immune dysfunction.
Dendritic Cells
Dendritic cells (DCs) are professional antigen presenting cells (APCs) and regulators of innate and adaptive immunity. The presence of DCs in the TME has been shown to increase the efficacy of immune blockade immunotherapy (59) and adoptive T cell therapy (ACT) (60). These findings demonstrate the importance of DCs in the anti-tumor immune response and support the relevance of their monitoring. DCs recognize pathogens through Toll-like receptors (TLRs) (61), retinoic acid-inducible gene I (RIG−I)−like receptors (RLRs), C−type lectins (62) and nucleotide-binding oligomerization domain (NOD)-like receptors (NLRs) (63). Binding to one of the pathogen recognition receptors causes a cascade of signaling pathways that lead to DC metabolic shifts and activation (63). After activation, DCs mature to present antigen to T cells (64). Immature DCs and tolerogenic DCs use catabolism of proteins and triacylglycerols to synthesize fatty and amino acids or intracellular glycogen for OXPHOS (65, 66). As DCs transition to maturity and activation, they switch their metabolism from OXPHOS to glycolysis and lactic fermentation that generate energy. Inhibition of glycolytic metabolism pathway impairs DC maturation and antigen presenting ability, but other functions of DCs such as phagocytosis are not affected by inhibition of glycolysis (66). Similar to NKs, markers of glycolysis could be used to identify maturing and activated DCs.
Myeloid-Derived Suppressor Cells (MDSCs)
Myeloid cells originate from the bone marrow and when they are found in the brain TME they have profound immunosuppressive functions (67–69). MDSCs inhibit T cell function through three main mechanisms: 1) arginine depletion, 2) reactive oxygen and nitrogen species production and 3) expressing ligands of T cell inhibitory receptors such as programmed death-ligand 1 (PDL-1) (67, 70). Generally, myeloid cells use glycolysis to supply their metabolic demands. However, tumor-associated MDSCs reprogram their metabolism and undergo fatty acid oxidation (FAO) with significantly increased rates of oxygen consumption (67, 69, 71). MDSCs overexpress the lipid uptake receptors such as CD36, Msr1, Fabp5, CD68, Acsl3 and Acsl4 (67, 69, 71). These markers of MDSCs have the potential to serve as biomarkers of MDSC function and can also serve as therapeutic targets (70).
Metabolomics of Adaptive Immunity
T cells need glucose and amino acids during their life cycle to differentiate, proliferate, and activate (72). Naïve T cells uptake glucose as their main source of carbon and through glycolysis produce pyruvate (72). Naïve T cells that do not actively proliferate and shuttle pyruvate through the tricarboxylic acid (TCA) cycle to generate ATP using OXPHOS. Acetyl-CoA undergoes a series of reactions in TCA cycle to generate citrate (72). Citrate undergoes reactions to produce donor electrons, which pass through the electron transport chain by NADH and FADH2. Finally, these electrons undergo the process of OXPHOS to generate ATP. Once T cells are activated, they rely more heavily on an anaerobic pathway to generate ATP resulting in more lactate as a byproduct to replenish metabolite intermediates (i.e. NAD+) (73, 74). This process is less efficient; only two ATP per molecule of glucose but it is one hundred times faster, thereby serving rapidly proliferating T cells (73, 74).
T cell activation is strongly dependent on nutrient uptake and glucose metabolism (75). Decreased availability of glucose or glutamine dramatically reduces T cell expansion and cytokine production (75). Additionally, effector T cell differentiation is suppressed by decreasing glucose or glutamine (75). The uptake of glucose and glutamine and the rate of production of byproducts of their metabolism (e.g. lactate) are directly correlated with T cell activation and growth (73, 74). T cell activation begins with the engagement of T cell receptor (TCR) and its interaction with APCs. TCRs bind specific antigens by interacting with a short fragment of peptide bound to MHC (major histocompatibility complex) class I/II molecules on the surface of APCs. MHC class I and II present endogenous and exogenous antigens respectively. TCR signaling is initiated upon binding to its ligand triggering a cascade of molecular events initiating differentiation of naïve T cell into effector T cells. TCR activation relies on several known co-stimulatory receptors including CD2, CD28, CD4, CD8, and integrin molecules. CD28 binding to B7-1 or B7-2 on APCs allows for T cell binding. CD28 also generates a co-stimulatory signal in T cells to increase IL-2 production, leading to T cell proliferation. Consequently, CD28 and CD45 phosphorylate the linker for activation of T cells (LAT), which leads to phosphorylation and activation of the TCR-CD3 complex (76, 77).
T cell metabolic demands change during the differentiation process. After differentiation, each T cell subset shows different metabolic shifts. Effector T cells which are typically antigen-specific and can cause cytolysis of cells expressing foreign antigens, rely mostly on the glycolytic pathway. The dramatic consumption of glucose and glutamine and high production of lactate has been observed in the early stage of T cells activation in rats (78). This phenomenon is indicated by changes in surface transporters such as GLUT1. CD8+ T effector cells and Th17 cells up-regulate the glycolysis and glucose transporter 1 (GLUT1) (79). Conversely, immunosuppressive regulatory T cells (Tregs) that are a subset of CD4+ T cells have lower needs for glycolysis that leads to less consumption of glucose and glutamine and less production of lactate compared to effector T cells (80). Treg differentiation is not dependent on GLUT1 (81) (Figure 3). Alternatively, memory T cells rely on OXPHOS and increase the consumption of the fatty acids to promote this pathway (82, 83). Memory T cells live longer than other subsets and their survival relies on the metabolites which are synthesized through fatty acid oxidation. Also, these metabolites are essential for the memory T cells prompt recall after infection (82, 83). Instead, exhausted T cells express the inhibitory receptors that are known as exhaustion markers such as PD-1, Lag-3 and Tim-3 (84). In the exhaustion process, glucose uptake is reduced, and fatty acid oxidation, and OXPHOS slow down, resulting in overall reduction of metabolite production (84).

Figure 3 Different T cell subsets and metabolic shifts. Naïve T cells uptake fewer glucose molecules and produce a lower amount of lactate. Tregs uptake more fatty acids compared naïve T cells. Effector T cells express more GLUT1, consume more glucose and glutamine and produce more lactate.
Transitioning from the resting G0 to G1, T cells switch temporarily to an oxidative state and mainly utilize OXPHOS related proteins such as mitochondrial ATPase to produce adequate biomass and ATP (74). During G1 glutamate is highly taken up and citrate is used for phospholipid synthesis, which is needed for cell growth (74). Citrate is also used to produce cholesterol which is used to create the cell membrane (74). In S phase, T cells require increased nucleotide biosynthesis for genome duplication before undergoing cell division. S phase is also marked by increased serine metabolism for generation of N5, N10-methylenetetrahydrofolate, which are key byproducts in the tetrahydrofolate cycle regulating nucleotide biosynthesis (85). Cells need purines to enter into G1 and S phase but pyrimidine synthesis is required only in S phase (86). T cells then pass through phase G2 and M to complete the cell division process. For G2/M phases, T cells increase in cell size and need more energy (Figure 4). Therefore, acetyl-CoA is utilized during these phases. The above-described metabolic shifts can serve as reliable markers of immune responsiveness to treatment. These metabolic changes can indicate the state of host T cells and dominant subsets of T cells after differentiation.
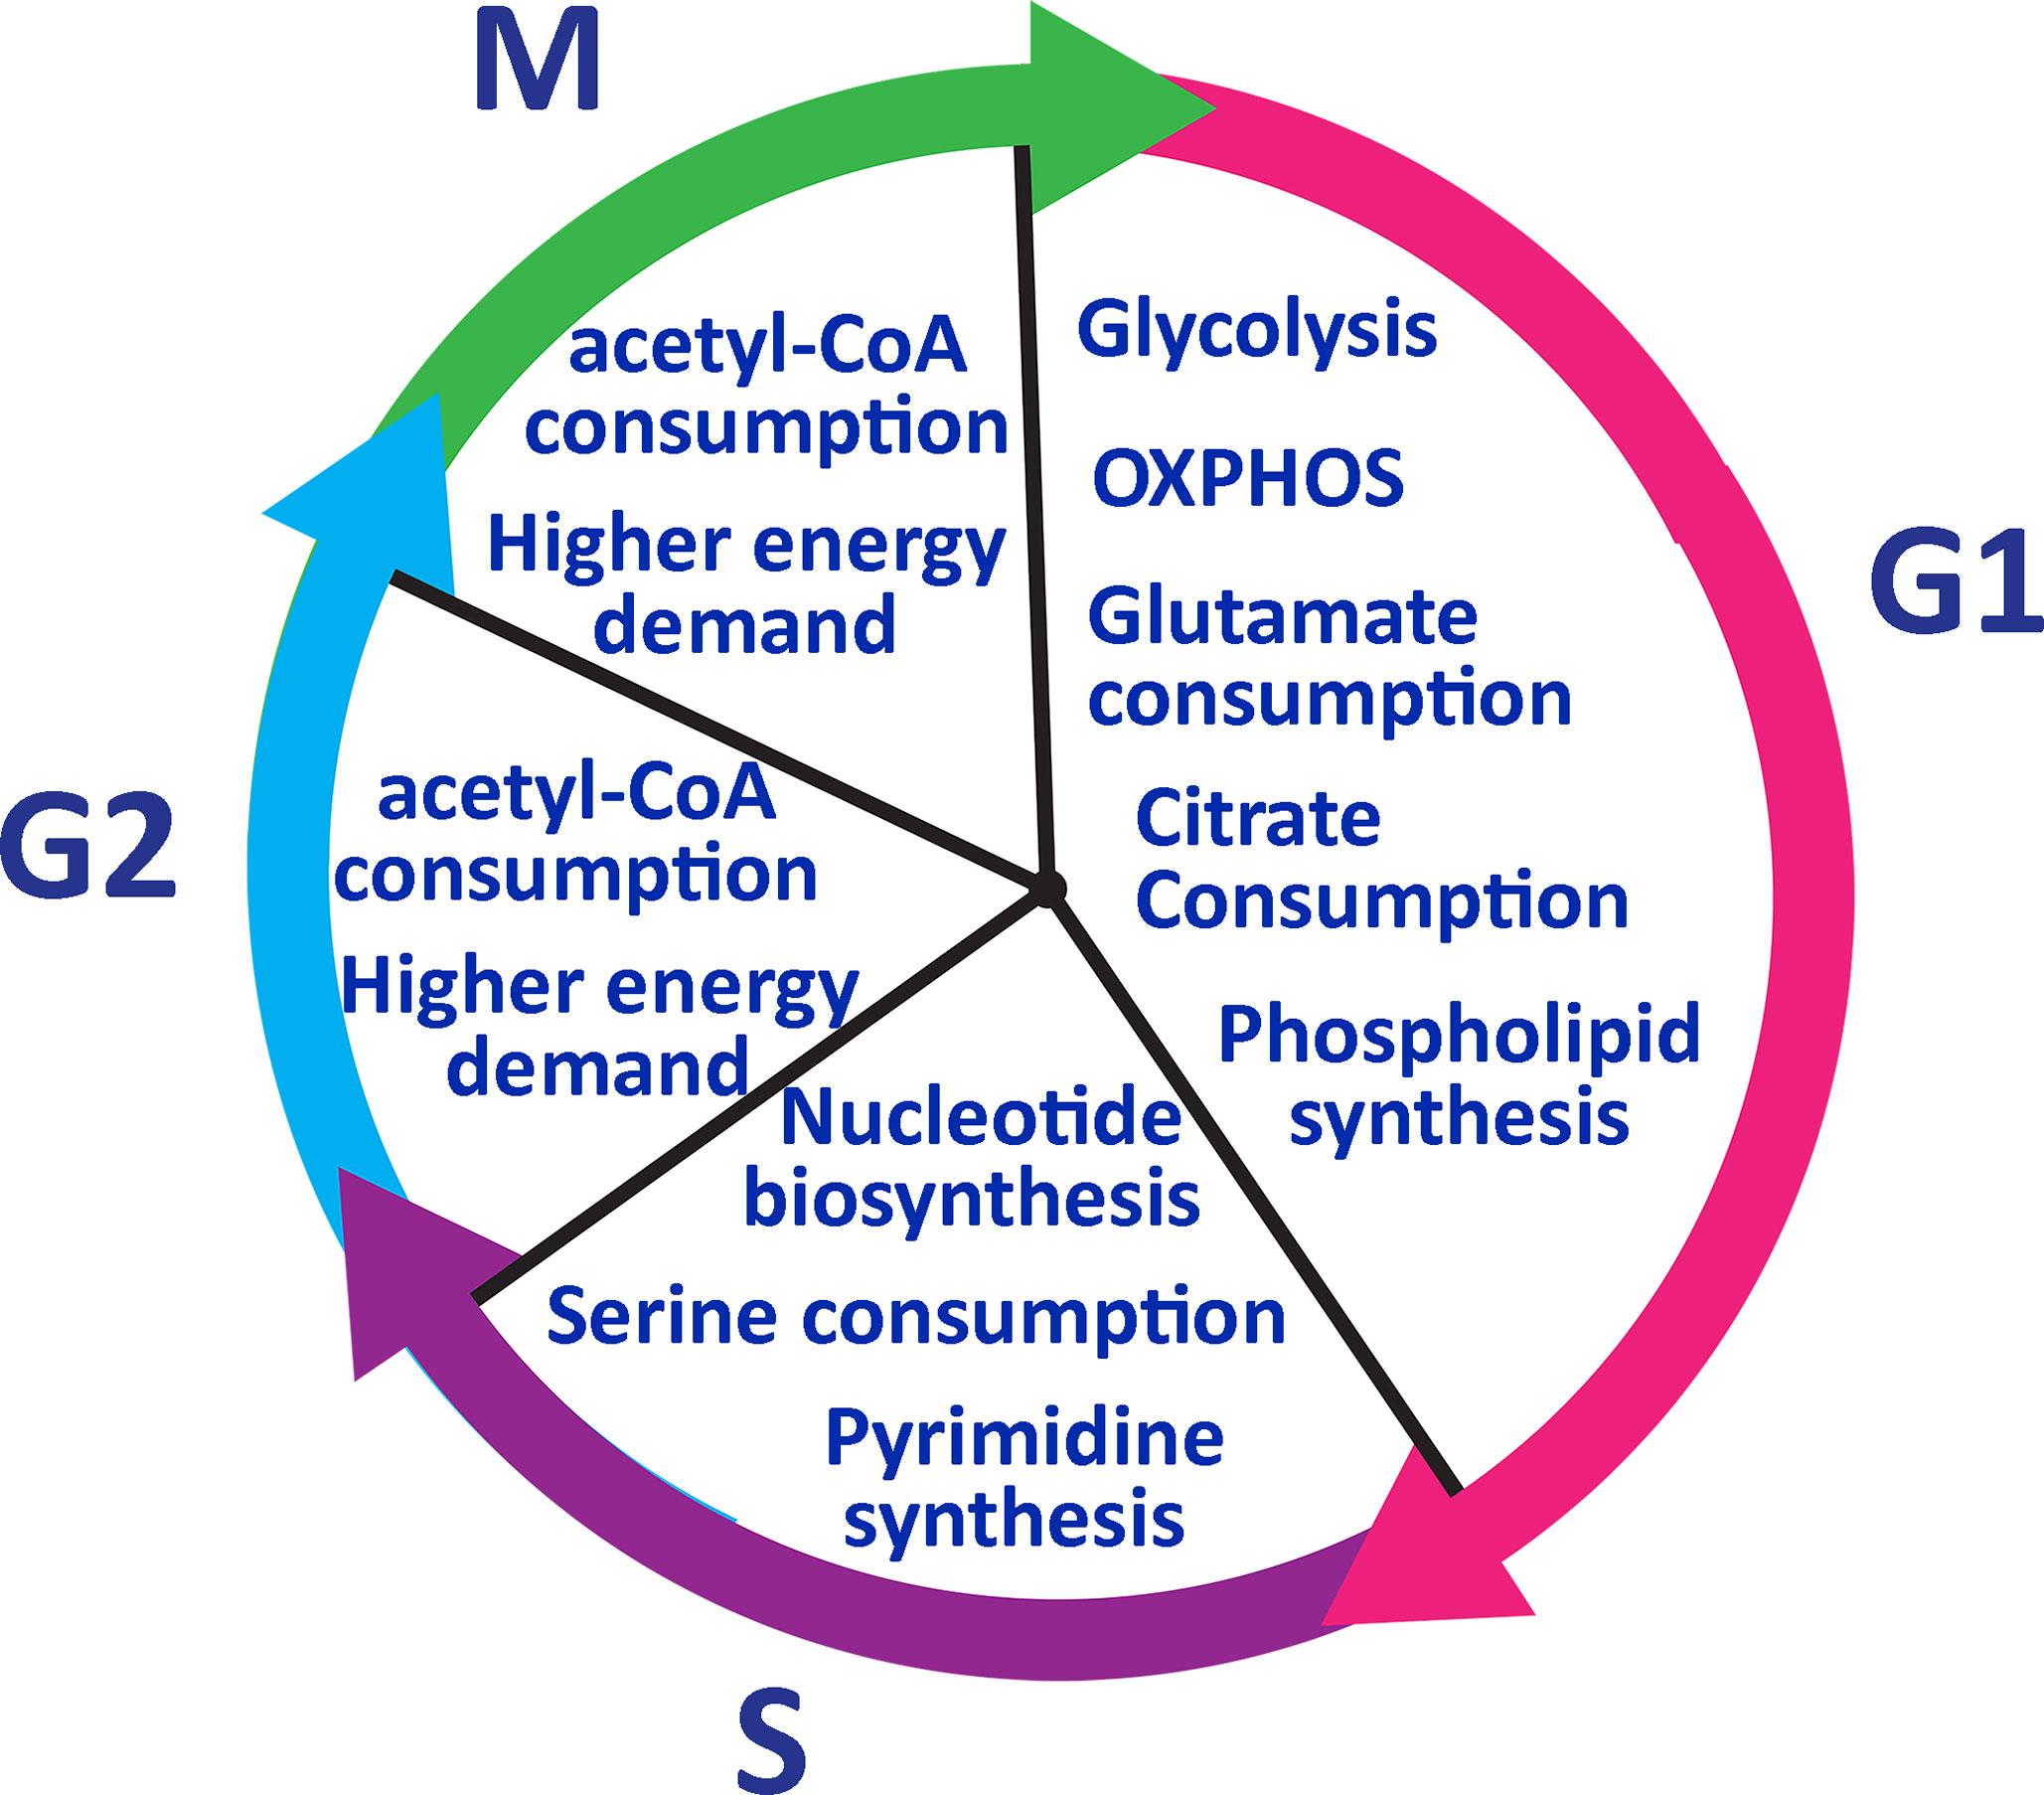
Figure 4 Lymphocyte metabolic pathway during the cell cycle. T cells go through glycolysis metabolic pathway in phase G1 and consume glutamate and citrate to generate phospholipids. In phase S, T cells need to duplicate their genome and serine to synthesize nucleotides. Pyrimidine synthesis occurs only in the S phase and it is required to enter into G2. IN phase G2 and M, T cells need more energy to grow in size and consume acetyl-CoA to generate more ATP.
Clinical Metabolomics and Immunotherapy
As discussed, as immune cell subsets (DCs, NKs and T cells) activate, metabolic shifts to glycolysis are pronounced. These metabolic profile changes have the potential to identify immune responses after treatment with immunotherapy. Metabolomics lends itself to serial analyses as these changes can be detected through NMR analyses of urine or blood samples (87, 88). Therefore, the kinetics of immune responses can be followed. This approach is being tested in human clinical trials. The ATTAC II (NCT02465268) study is a randomized, placebo-controlled trial testing a pp65 CMV RNA DC vaccine platform in patients with newly diagnosed GBM. Part of the analysis includes metabolomic analysis of urine samples over time to correlate with imaging and clinical outcomes.
Most published studies of metabolomics and gliomas revolve around the intra-tumoral metabolic profiles and methods for distinguishing between tumor subtypes and monitoring for recurrence. There are limited studies of the use of metabolomics in the prediction of human patient’s clinical outcomes with brain tumors by using blood samples. A list of several metabolomics studies with a different type of samples and analytical techniques in brain tumor is provided (Table 1). In one study, plasma samples were collected from 70 glioma patients with grade III and grade IV (28). NMR spectra of collected plasma samples were analyzed to identify the metabolomics changes associated with glioma in comparison with healthy subject samples as the control group (28). Twenty metabolites were identified, which are related to the presence of glioma. Glioma was associated with a lower level of isoleucine, leucine, valine, lactate, alanine, glycoprotein, glutamate, citrate, creatine, Myo-inositol, choline, tyrosine, phenylalanine, 1-methylhistidine, α-glucose, β-glucose (28). And the higher concentration of very-low-density lipoprotein (VLDL), low-density lipoprotein (LDL), unsaturated lipid, and pyruvate were identified with a significant correlation to the presence of glioma (28). Metabolomic analysis has also been utilized to differentiate glioma grade. Plasma samples were collected from 87 glioma patients and liquid chromatography triple quadrupole mass spectrometry (LC-QQQ-MS) was used to analyze the metabolomics differences which is applicable as host biomarker candidates to classify glioma in patients (34). Five plasma metabolites significantly differed between high grade and low-grade gliomas including uridine, uracil and ornithine which increased in high-grade gliomas, and N-acetylputrescine and trimethylamine-N-oxide (TMAO) which decreased in high-grade gliomas (34). Of note, TMAO is reduced in patients with IDH1 mutation (34). Arginine/proline metabolism was the pathway with the most significant impact (34). In another study, serum samples were used to identify the metabolomics shifts during radiotherapy in glioma patients (30). Serum samples collected from 11 patients in the initial phase of radiotherapy and serum metabolites were identified by using gas-chromatographic- time-of-flight-mass spectroscopy (30). Patients underwent radiotherapy within 2 to 5 days post-surgery and fasting serum samples were collected just before the first radiotherapy session and at days 1, 2 and 5 after radiotherapy fraction (30). A total of 84 serum metabolites differed significantly in the samples after radiotherapy in comparison to before radiotherapy samples as control samples. Among those metabolites, sixteen metabolites increased after radiotherapy while sixty-eight metabolites decreased after radiotherapy in comparison with before treatment samples (30). Citric acid and dehydroascorbic acid dimer were the top metabolites which showed increased level in serum after treatment and ornithine, tyrosine, glutamine, creatinine and glyceric acid were the top significant metabolites that decreased in serum after radiotherapy (30). Clinically relevant metabolomics signatures were studied in other malignancy with brain metastasis, in melanoma and renal cell carcinoma patients treated with nivolumab (PD-1 inhibitor), blood samples were analyzed with LC-MS. Samples from two phase I trials including 78 patients with advanced melanoma and 91 patients with metastatic renal cell carcinoma (RCC) as well as samples from a large randomized phase III trial in which 394 RCC patients received nivolumab and 349 received everolimus. Post-treatment serum samples were compared to pre-treatment (baseline) serum samples. Kynurenine, which is a product of tryptophan catabolism, was the most significant metabolic difference between groups (96). Kynurenine/tryptophan ratios correlated with worse overall survival for patients treated with nivolumab. The kynurenine pathway (KP) breaks down tryptophan leading to production of NAD+. In the presence of pro-inflammatory cytokines, KP is induced by activation of its first enzyme, indoleamine 2,3-dioxygenase (IDO-1) (97). Increased IDO-1 activity (as reflected by higher K/T ratios) is known to suppress the T-cell mediated response. In disease states where K/T ratio is increased, it is thought that there is T cell-mediated response suppression (97). Glioma patients with Isocitrate dehydrogenase 1 (IDH1) mutation have significantly prolonged median survival in comparison to glioma patients with wild-type IDH1 (98). Previously it was shown that glioma tumor cells with IDH1 mutation highly produce 2-hydroxyglutarate (2HG) and considered as a biomarker for IDH1 mutation (99). Therefore, in vivo detection of 2HG is critical for the prediction of clinical outcomes. In one study, metabolic changes were studied in gliomas patients with IDH1 mutation (89). Surgical resection samples were obtained from ten glioma patients with grades II-IV including IDH1 positive and negative. Samples compared with U87 glioblastoma cells which overexpress IDH1. Metabolomics analysis through Capillary electrophoresis time-of-flight mass spectrometry (CE-TOFMS) revealed that levels of D-2-hydroxyglutarate (D-2HG) were significantly increased in the glioma patients with an IDH1 mutation (89). It is shown that T cells import extracellular 2HG which is exported by IDH mutant glioma cells, resulting in the suppression of T cell activation and penetration in TME (100, 101). Moreover, it is shown that 2HG effectively blocks an ATP-dependent T cell receptor (TCR) signaling pathway, which results in suppression of T cell proliferation and function (100). Despite the immune suppression role of IDH1 mutation, it is still unknown why patients with IDH-mutant glioma have prolonged overall survival and better clinical outcome (100, 101). Therefore, it is important to monitor 2HG as the direct metabolite of IDH1 mutant glioma along with metabolomics monitoring of immune cells in glioma patients.
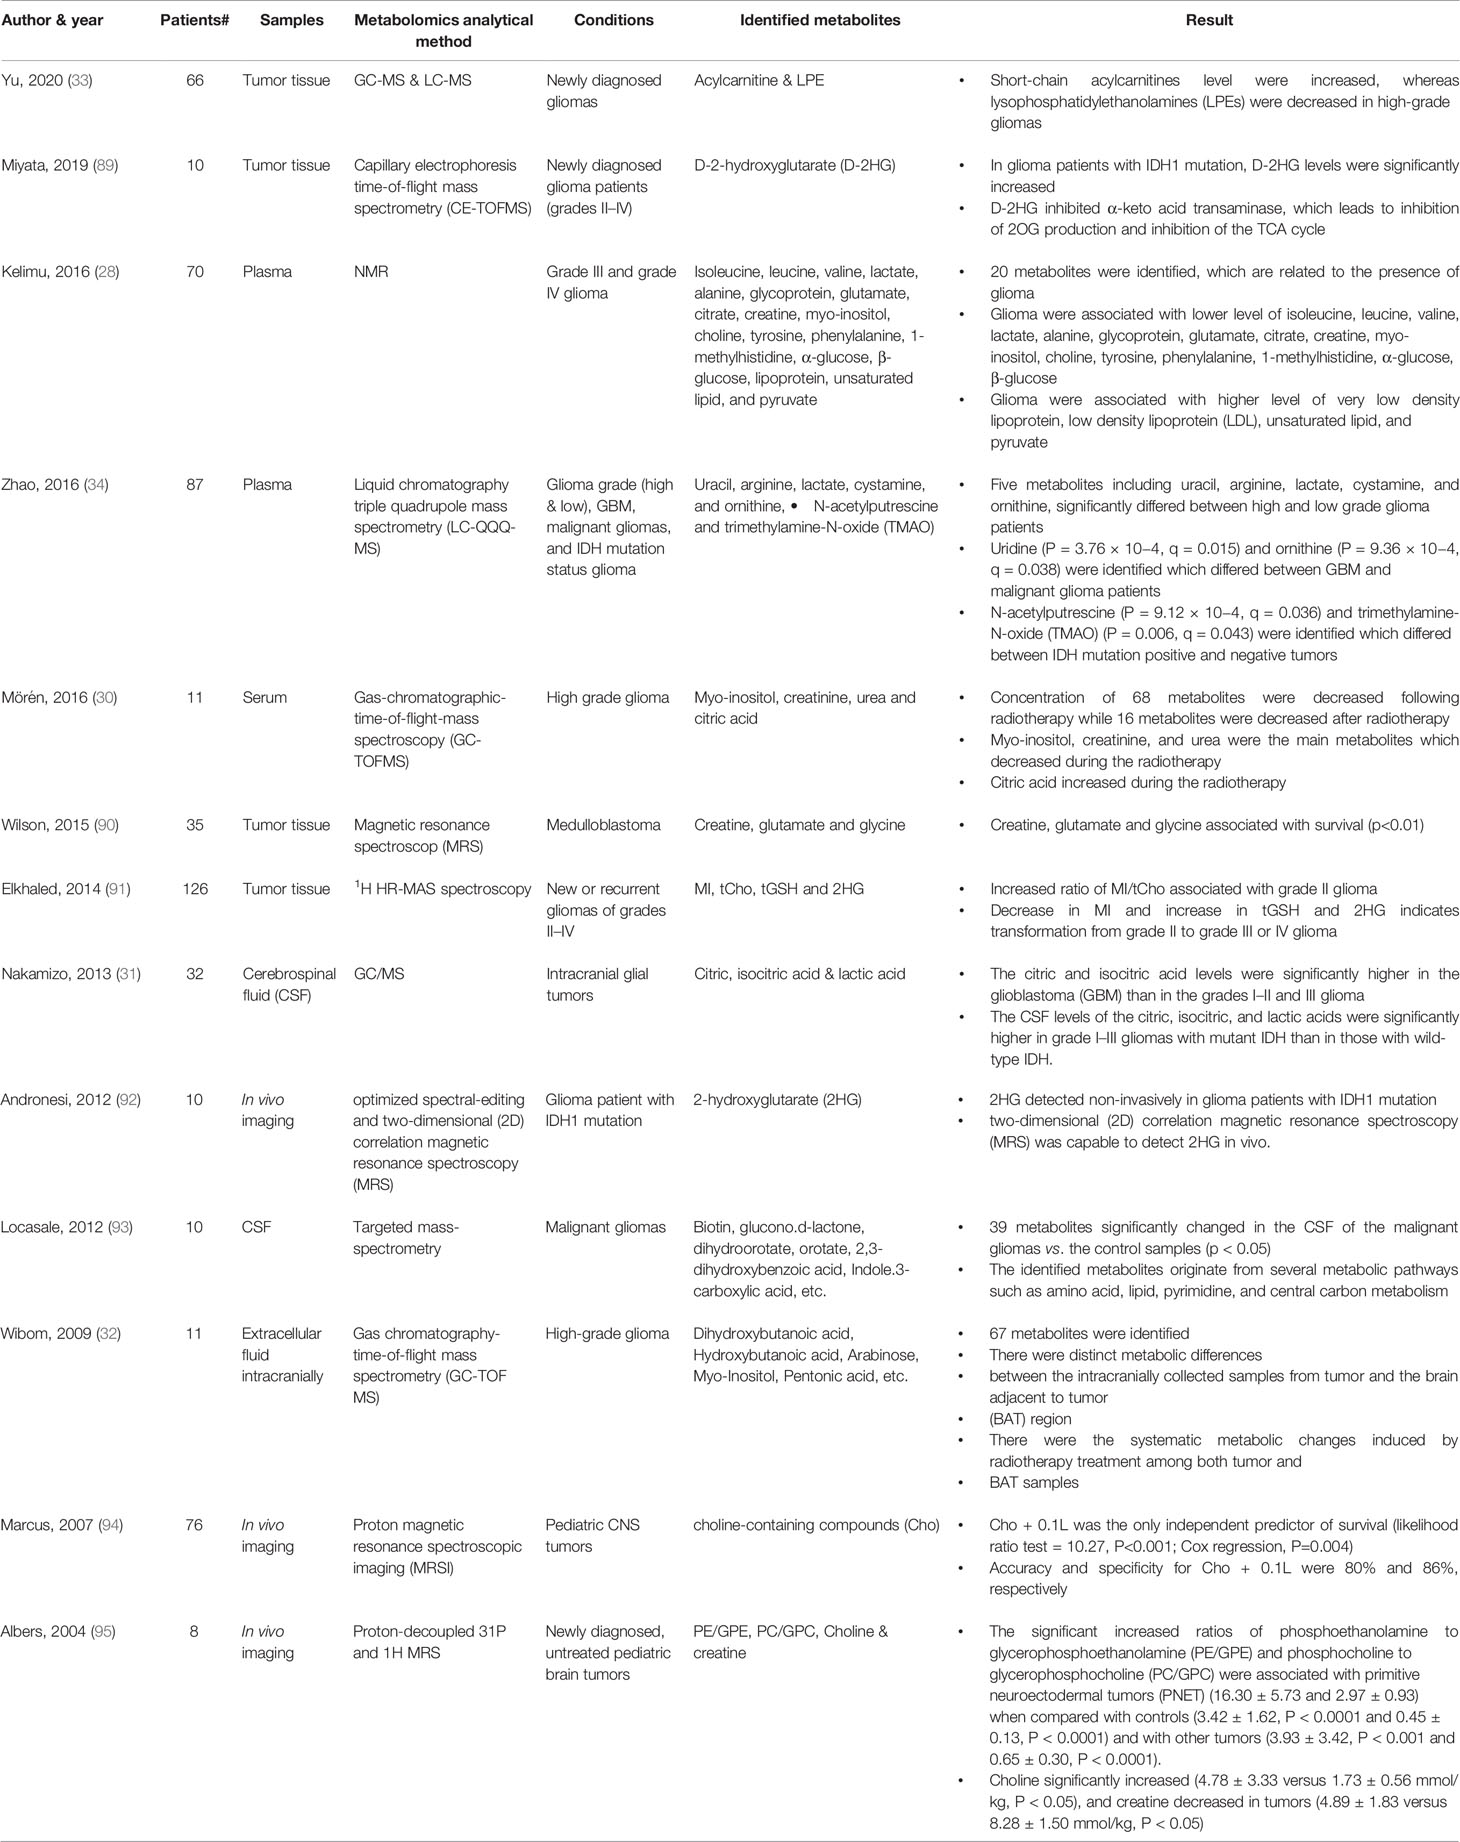
Table 1 In vivo metabolomics studies in brain tumor patients.
Overall, metabolomics has the potential to measure robust immune cell changes from OXPHOS to glycolysis in multiple compartments in a serial fashion. This approach also has the potential for identifying host immune factors that would prevent effective anti-tumor immunity. This field is still in its infancy and further studies in human patients are necessary to determine if the sensitivity and specificity of these techniques will lend themselves to clinical utility.
Conclusion
Metabolomic analysis has the potential to study and monitor immune activation after treatment with immunotherapy. In response to the microenvironment, immune cells undergo metabolic reprogramming regulating their function. Upon activation, M1- macrophages activate glycolytic metabolism and secrete lactate, ROS, NADPH, lipids, and nucleotides. Activated M2 macrophages increase glutamine and fatty acid consumption. Stimulated NKs significantly increase both glycolysis and OXPHOS, and activated NKs produce pyruvates as a key metabolite. Tumor-associated MDSCs undergo fatty acid oxidation. Activated DCs switch catabolic metabolism to glycolysis as well. Similarly, effector T cells produce lactate upon activation. Conversely, regulatory T cells produce less lactate. Memory T cells use OXPHOS and increase the consumption of the fatty acids. Exhausted T cells reduce the glucose uptake and decrease the fatty acid oxidations and OXPHOS (Figure 5). Altogether, these metabolic changes defining specific immune activities may be used to assess and predict the response to therapy. Such strategies hold great promises and warrant further investigations, especially in the context of patients with brain tumors, and could provide insights into future studies about metabolomics monitoring of immune response in murine glioma models or in patients with different types of malignancies.
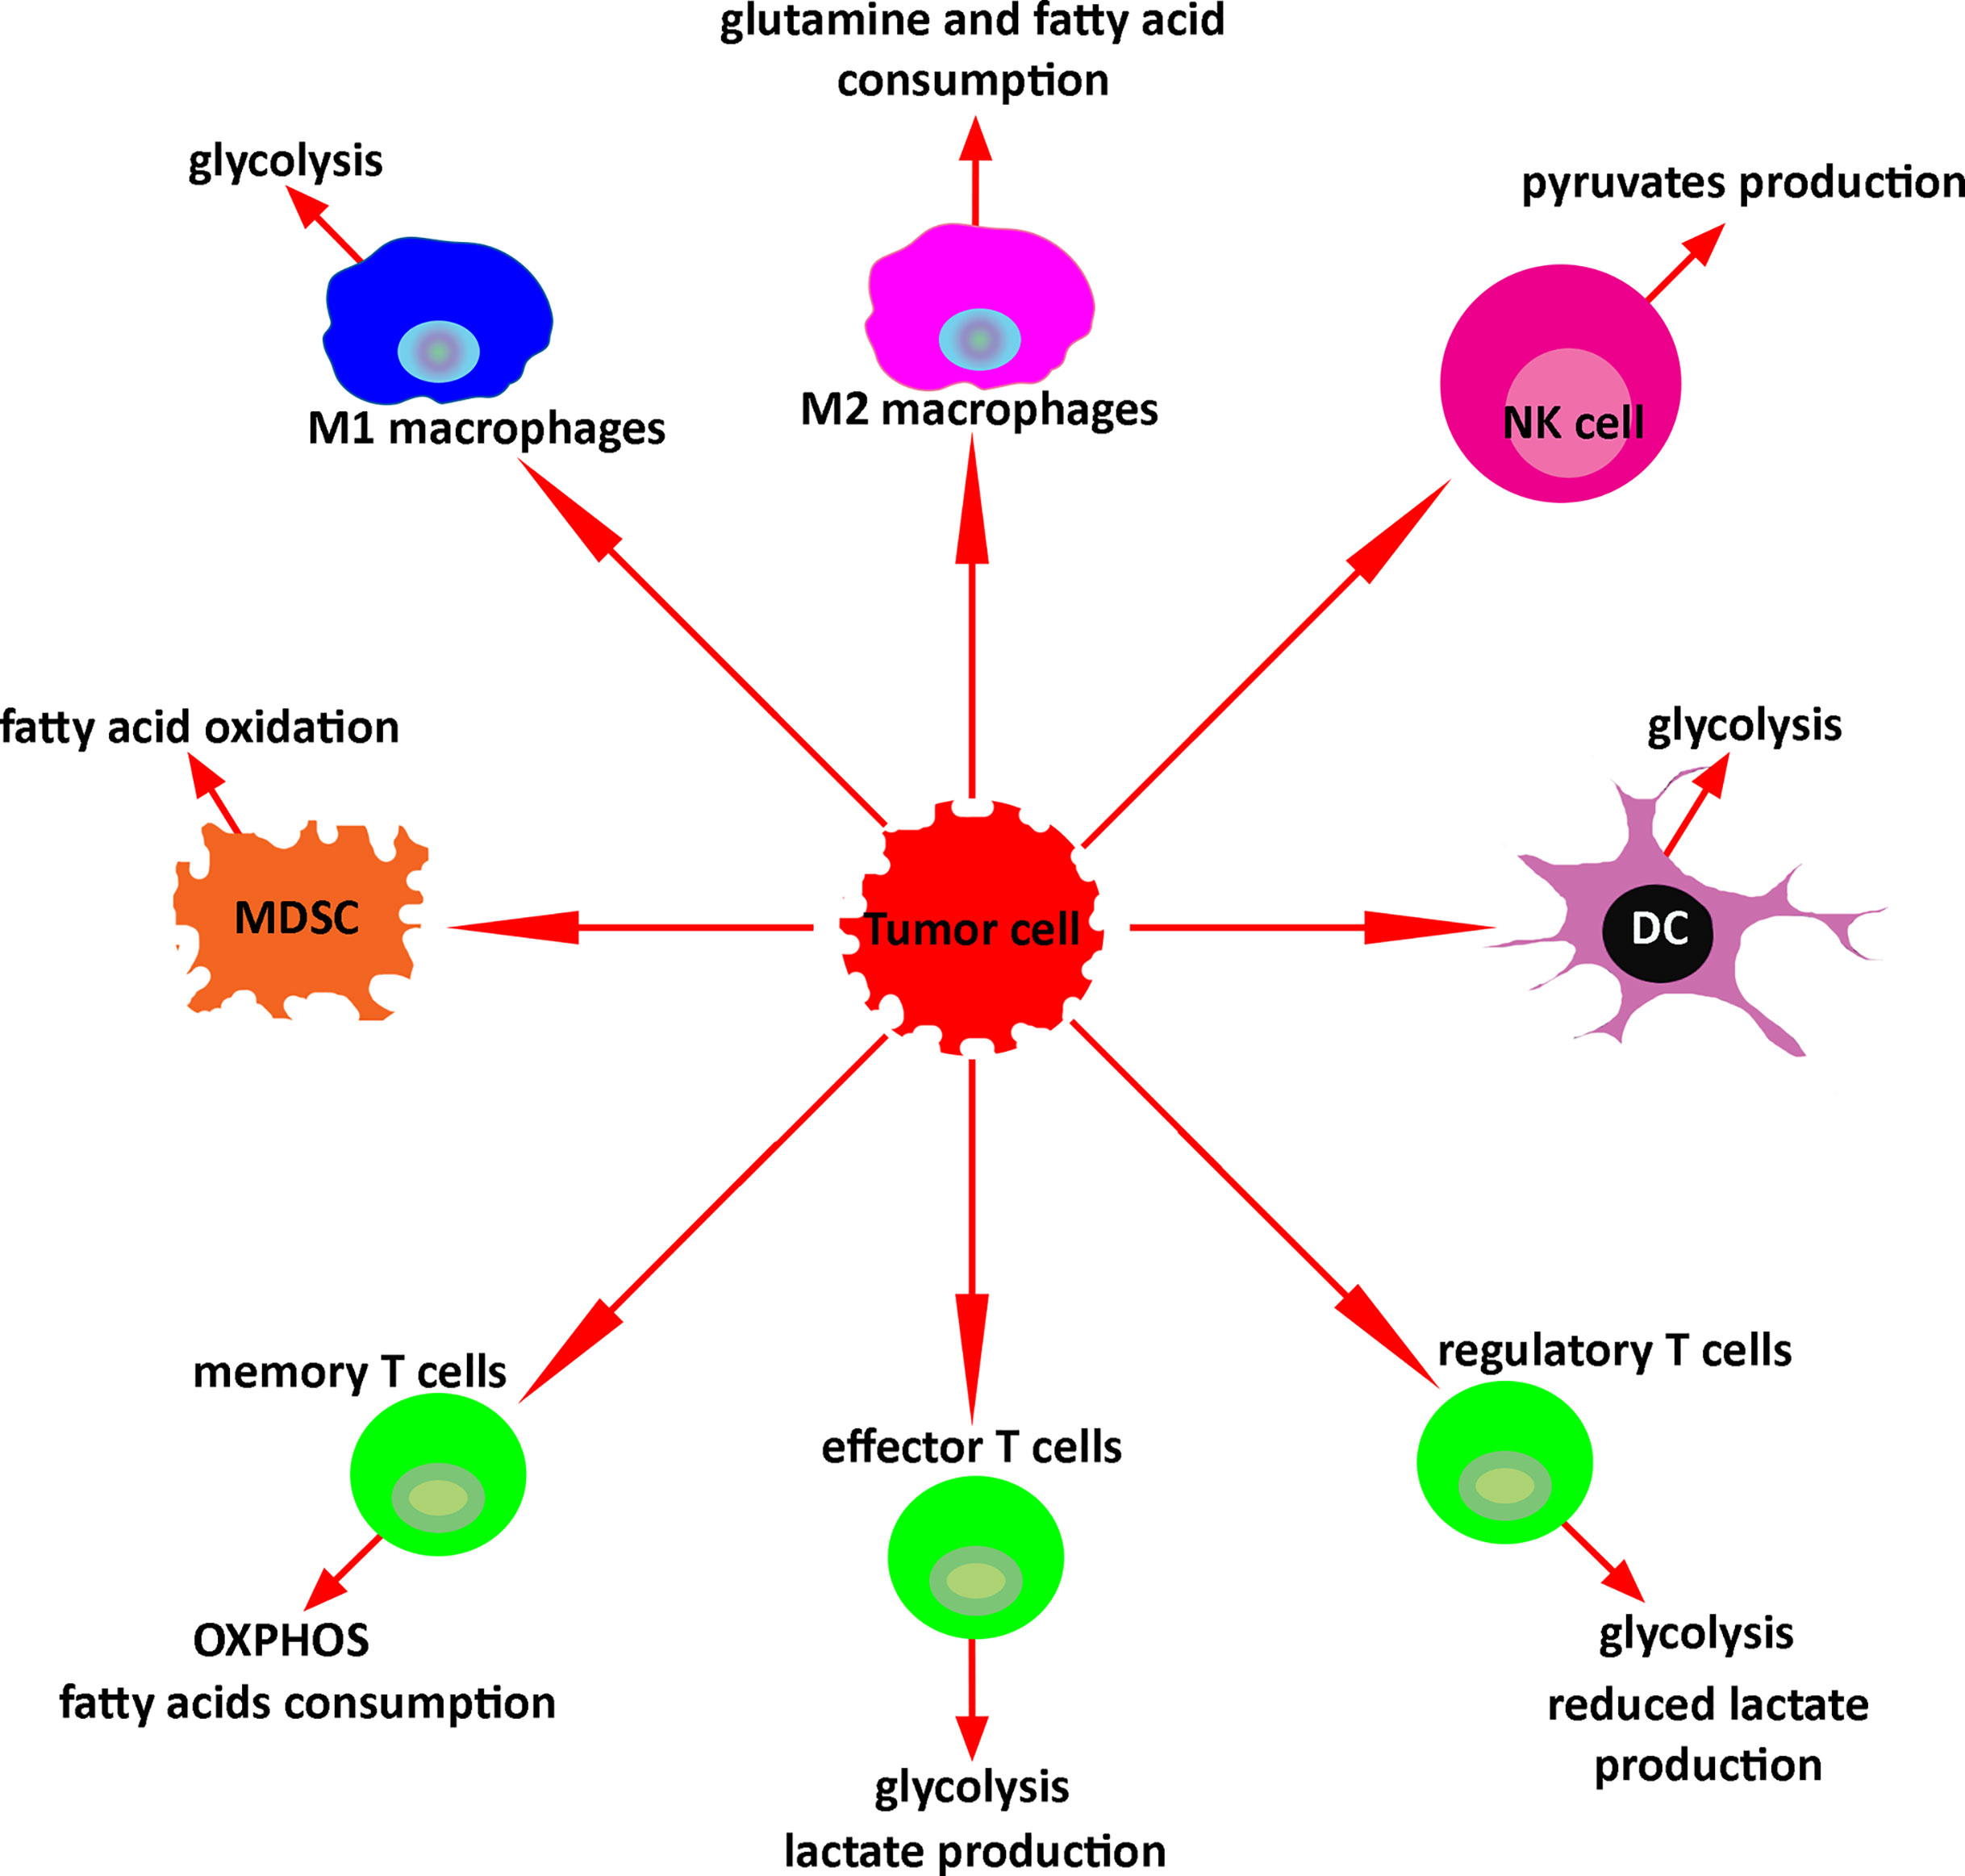
Figure 5 Key metabolism of immune cells in the tumor microenvironment. In response to the tumor microenvironment, immune cells undergo specific metabolic reprogramming regulating their function.
Author Contributions
All authors contributed to the article and approved the submitted version.
Conflict of Interest
The authors declare that the research was conducted in the absence of any commercial or financial relationships that could be construed as a potential conflict of interest.
References
1. Soare GR, Soare CA. Immunotherapy for Breast Cancer: First FDA Approved Regimen. Discov (Craiova) (2019) 7(1):e91. doi: 10.15190/d.2019.4
2. Mavratzas A, Seitz J, Smetanay K, Schneeweiss A, Jager D, Fremd C. Atezolizumab for Use in PD-L1-Positive Unresectable, Locally Advanced or Metastatic Triple-Negative Breast Cancer. Future Oncol (2020) 16(3):4439–53. doi: 10.2217/fon-2019-0468
3. Hodi FS, O’Day SJ, McDermott DF, Weber RW, Sosman JA, Haanen JB, et al. Improved Survival With Ipilimumab in Patients With Metastatic Melanoma. N Engl J Med (2010) 363(8):711–23. doi: 10.1056/NEJMoa1003466
4. Larkin J, Chiarion-Sileni V, Gonzalez R, Grob JJ, Cowey CL, Lao CD, et al. Combined Nivolumab and Ipilimumab or Monotherapy in Untreated Melanoma. N Engl J Med (2015) 373(1):23–34. doi: 10.1056/NEJMoa1504030
5. Weber JS, D’Angelo SP, Minor D, Hodi FS, Gutzmer R, Neyns B, et al. Nivolumab Versus Chemotherapy in Patients With Advanced Melanoma Who Progressed After Anti-CTLA-4 Treatment (CheckMate 037): A Randomised, Controlled, Open-Label, Phase 3 Trial. Lancet Oncol (2015) 16(4):375–84. doi: 10.1016/S1470-2045(15)70076-8
6. Dastmalchi F, Karachi A, Mitchell D, Rahman M. Dendritic Cell Therapy. In: eLS. Chichester: John Wiley & Sons, Ltd. (2018). p. 1–27. doi: 10.1002/9780470015902.a0024243
7. Dastmalchi F, Karachi A, Yang C, Azari H, Sayour EJ, Dechkovskaia A, et al. Sarcosine Promotes Trafficking of Dendritic Cells and Improves Efficacy of Anti-Tumor Dendritic Cell Vaccines Via CXC Chemokine Family Signaling. J Immunother Cancer (2019) 7(1):321. doi: 10.1186/s40425-019-0809-4
8. Del Vecchio CA, Wong AJ. Rindopepimut, A 14-Mer Injectable Peptide Vaccine Against EGFRvIII for the Potential Treatment of Glioblastoma Multiforme. Curr Opin Mol Ther (2010) 12(6):741–54.
9. Brown CE, Alizadeh D, Starr R, Weng L, Wagner JR, Naranjo A, et al. Regression of Glioblastoma After Chimeric Antigen Receptor T-Cell Therapy. N Engl J Med (2016) 375(26):2561–9. doi: 10.1056/NEJMoa1610497
10. Thomas AA, Abrey LE, Terziev R, Raizer J, Martinez NL, Forsyth P, et al. Multicenter Phase II Study of Temozolomide and Myeloablative Chemotherapy With Autologous Stem Cell Transplant for Newly Diagnosed Anaplastic Oligodendroglioma. Neuro Oncol (2017) 19(10):1380–90. doi: 10.1093/neuonc/nox086
11. Cabel L, Riva F, Servois V, Livartowski A, Daniel C, Rampanou A, et al. Circulating Tumor DNA Changes for Early Monitoring of Anti-PD1 Immunotherapy: A Proof-of-Concept Study. Ann Oncol (2017) 28(8):1996–2001. doi: 10.1093/annonc/mdx212
12. Mkrtichyan M, Najjar YG, Raulfs EC, Abdalla MY, Samara R, Rotem-Yehudar R, et al. Anti-PD-1 Synergizes With Cyclophosphamide to Induce Potent Anti-Tumor Vaccine Effects Through Novel Mechanisms. Eur J Immunol (2011) 41(10):2977–86. doi: 10.1002/eji.201141639
13. Royal RE, Levy C, Turner K, Mathur A, Hughes M, Kammula US, et al. Phase 2 Trial of Single Agent Ipilimumab (Anti-CTLA-4) for Locally Advanced or Metastatic Pancreatic Adenocarcinoma. J Immunother (2010) 33(8):828–33. doi: 10.1097/CJI.0b013e3181eec14c
14. Disis ML, Schiffman K, Gooley TA, McNeel DG, Rinn K, Knutson KL. Delayed-Type Hypersensitivity Response Is a Predictor of Peripheral Blood T-Cell Immunity After HER-2/neu Peptide Immunization. Clin Cancer Res (2000) 6(4):1347–50.
15. Salgaller ML, Lodge PA, McLean JG, Tjoa BA, Loftus DJ, Ragde H, et al. Report of Immune Monitoring of Prostate Cancer Patients Undergoing T-Cell Therapy Using Dendritic Cells Pulsed With HLA-A2-Specific Peptides From Prostate-Specific Membrane Antigen (PSMA). Prostate (1998) 35(2):144–51. doi: 10.1002/(SICI)1097-0045(19980501)35:2<144::AID-PROS8>3.0.CO;2-J
16. Jager E, Nagata Y, Gnjatic S, Wada H, Stockert E, Karbach J, et al. Monitoring CD8 T Cell Responses to NY-ESO-1: Correlation of Humoral and Cellular Immune Responses. Proc Natl Acad Sci USA (2000) 97(9):4760–5. doi: 10.1073/pnas.97.9.4760
17. Cama VA, McDonald C, Arcury-Quandt A, Eberhard M, Jenks MH, Smith J, et al. Evaluation of an OV-16 Igg4 Enzyme-Linked Immunosorbent Assay in Humans and Its Application to Determine the Dynamics of Antibody Responses in a Non-Human Primate Model of Onchocerca Volvulus Infection. Am J Trop Med Hyg (2018) 99(4):1041–8. doi: 10.4269/ajtmh.18-0132
18. Miyahira Y, Murata K, Rodriguez D, Rodriguez JR, Esteban M, Rodrigues MM, et al. Quantification of Antigen Specific CD8+ T Cells Using an ELISPOT Assay. J Immunol Methods (1995) 181(1):45–54. doi: 10.1016/0022-1759(94)00327-S
19. Suni MA, Picker LJ, Maino VC. Detection of Antigen-Specific T Cell Cytokine Expression in Whole Blood by Flow Cytometry. J Immunol Methods (1998) 212(1):89–98. doi: 10.1016/S0022-1759(98)00004-0
20. McKee MD, Clay TM, Rosenberg SA, Nishimura MI. Quantitation of T-Cell Receptor Frequencies by Competitive PCR: Generation and Evaluation of Novel TCR Subfamily and Clone Specific Competitors. J Immunother (1999) 22(2):93–102. doi: 10.1097/00002371-199903000-00001
21. Clay TM, Hobeika AC, Mosca PJ, Lyerly HK, Morse MA. Assays for Monitoring Cellular Immune Responses to Active Immunotherapy of Cancer. Clin Cancer Res (2001) 7(5):1127–35.
22. Koido S, Homma S, Takahara A, Namiki Y, Komita H, Nagasaki E, et al. Immunologic Monitoring of Cellular Responses by Dendritic/Tumor Cell Fusion Vaccines. J BioMed Biotechnol (2011) 2011:910836. doi: 10.1155/2011/910836
23. Plebanski M, Katsara M, Sheng KC, Xiang SD, Apostolopoulos V. Methods to Measure T-cell Responses. Expert Rev Vaccines (2010) 9(6):595–600. doi: 10.1586/erv.10.53
24. Chang CH, Qiu J, O’Sullivan D, Buck MD, Noguchi T, Curtis JD, et al. Metabolic Competition in the Tumor Microenvironment Is a Driver of Cancer Progression. Cell (2015) 162(6):1229–41. doi: 10.1016/j.cell.2015.08.016
25. Pandey R, Caflisch L, Lodi A, Brenner AJ, Tiziani S. Metabolomic Signature of Brain Cancer. Mol Carcinog (2017) 56(11):2355–71. doi: 10.1002/mc.22694
26. Srivastava NK, Pradhan S, Gowda GA, Kumar R. In Vitro, High-Resolution 1H and 31P NMR Based Analysis of the Lipid Components in the Tissue, Serum, and CSF of the Patients With Primary Brain Tumors: One Possible Diagnostic View. NMR BioMed (2010) 23(2):113–22. doi: 10.1002/nbm.1427
27. Lehnhardt FG, Bock C, Rohn G, Ernestus RI, Hoehn M. Metabolic Differences Between Primary and Recurrent Human Brain Tumors: A 1H NMR Spectroscopic Investigation. NMR BioMed (2005) 18(6):371–82. doi: 10.1002/nbm.968
28. Kelimu A, Xie R, Zhang K, Zhuang Z, Mamtimin B, Sheyhidin I. Metabonomic Signature Analysis in Plasma Samples of Glioma Patients Based on (1)H-Nuclear Magnetic Resonance Spectroscopy. Neurol India (2016) 64(2):246–51. doi: 10.4103/0028-3886.177606
29. Tsugawa H, Tsujimoto Y, Arita M, Bamba T, Fukusaki E. GC/MS Based Metabolomics: Development of a Data Mining System for Metabolite Identification by Using Soft Independent Modeling of Class Analogy (SIMCA). BMC Bioinf (2011) 12:131. doi: 10.1186/1471-2105-12-131
30. Moren L, Wibom C, Bergstrom P, Johansson M, Antti H, Bergenheim AT. Characterization of the Serum Metabolome Following Radiation Treatment in Patients With High-Grade Gliomas. Radiat Oncol (2016) 11:51. doi: 10.1186/s13014-016-0626-6
31. Nakamizo S, Sasayama T, Shinohara M, Irino Y, Nishiumi S, Nishihara M, et al. GC/MS-Based Metabolomic Analysis of Cerebrospinal Fluid (CSF) From Glioma Patients. J Neurooncol (2013) 113(1):65–74. doi: 10.1007/s11060-013-1090-x
32. Wibom C, Surowiec I, Moren L, Bergstrom P, Johansson M, Antti H, et al. Metabolomic Patterns in Glioblastoma and Changes During Radiotherapy: A Clinical Microdialysis Study. J Proteome Res (2010) 9(6):2909–19. doi: 10.1021/pr901088r
33. Yu D, Xuan Q, Zhang C, Hu C, Li Y, Zhao X, et al. Metabolic Alterations Related to Glioma Grading Based on Metabolomics and Lipidomics Analyses. Metabolites (2020) 10(12):478. doi: 10.3390/metabo10120478
34. Zhao H, Heimberger AB, Lu Z, Wu X, Hodges TR, Song R, et al. Metabolomics Profiling in Plasma Samples From Glioma Patients Correlates With Tumor Phenotypes. Oncotarget (2016) 7(15):20486–95. doi: 10.18632/oncotarget.7974
35. van der Windt GJW, Chang CH, Pearce EL. Measuring Bioenergetics in T Cells Using a Seahorse Extracellular Flux Analyzer. Curr Protoc Immunol (2016) 113:3 16B 1–3 B 4. doi: 10.1002/0471142735.im0316bs113
36. Quinn KM, Hussain T, Kraus F, Formosa LE, Lam WK, Dagley MJ, et al. Metabolic Characteristics of CD8(+) T Cell Subsets in Young and Aged Individuals are Not Predictive of Functionality. Nat Commun (2020) 11(1):2857. doi: 10.1038/s41467-020-16633-7
37. Moco S, Vervoort J, Moco S, Bino RJ, De Vos RCH, Bino R. Metabolomics Technologies and Metabolite Identification. TrAC Trends Anal Chem (2007) 26(9):855–66. doi: 10.1016/j.trac.2007.08.003
38. Deda O, Chatziioannou AC, Fasoula S, Palachanis D, Raikos N, Theodoridis GA, et al. Sample Preparation Optimization in Fecal Metabolic Profiling. J Chromatogr B Anal Technol BioMed Life Sci (2017) 1047:115–23. doi: 10.1016/j.jchromb.2016.06.047
39. Nsiah-Sefaa A, McKenzie M. Combined Defects in Oxidative Phosphorylation and Fatty Acid Beta-Oxidation in Mitochondrial Disease. Biosci Rep (2016) 36(2):e00313. doi: 10.1042/BSR20150295
40. Andrejeva G, Rathmell JC. Similarities and Distinctions of Cancer and Immune Metabolism in Inflammation and Tumors. Cell Metab (2017) 26(1):49–70. doi: 10.1016/j.cmet.2017.06.004
41. Vitale I, Manic G, Coussens LM, Kroemer G, Galluzzi L. Macrophages and Metabolism in the Tumor Microenvironment. Cell Metab (2019) 30(1):36–50. doi: 10.1016/j.cmet.2019.06.001
42. Cassetta L, Pollard JW. Targeting Macrophages: Therapeutic Approaches in Cancer. Nat Rev Drug Discovery (2018) 17(12):887–904. doi: 10.1038/nrd.2018.169
43. Muller S, Kohanbash G, Liu SJ, Alvarado B, Carrera D, Bhaduri A, et al. Single-Cell Profiling of Human Gliomas Reveals Macrophage Ontogeny as a Basis for Regional Differences in Macrophage Activation in the Tumor Microenvironment. Genome Biol (2017) 18(1):234. doi: 10.1186/s13059-017-1362-4
44. Murray PJ, Allen JE, Biswas SK, Fisher EA, Gilroy DW, Goerdt S, et al. Macrophage Activation and Polarization: Nomenclature and Experimental Guidelines. Immunity (2014) 41(1):14–20. doi: 10.1016/j.immuni.2014.06.008
45. Miao H, Ou J, Peng Y, Zhang X, Chen Y, Hao L, et al. Macrophage ABHD5 Promotes Colorectal Cancer Growth by Suppressing Spermidine Production by SRM. Nat Commun (2016) 7:11716. doi: 10.1038/ncomms11716
46. Niu Z, Shi Q, Zhang W, Shu Y, Yang N, Chen B, et al. Caspase-1 Cleaves PPARgamma for Potentiating the Pro-Tumor Action of Tams. Nat Commun (2017) 8(1):766. doi: 10.1038/s41467-017-00523-6
47. Xiang W, Shi R, Kang X, Zhang X, Chen P, Zhang L, et al. Monoacylglycerol Lipase Regulates Cannabinoid Receptor 2-Dependent Macrophage Activation and Cancer Progression. Nat Commun (2018) 9(1):2574. doi: 10.1038/s41467-018-04999-8
48. Arts RJ, Novakovic B, Ter Horst R, Carvalho A, Bekkering S, Lachmandas E, et al. Glutaminolysis and Fumarate Accumulation Integrate Immunometabolic and Epigenetic Programs in Trained Immunity. Cell Metab (2016) 24(6):807–19. doi: 10.1016/j.cmet.2016.10.008
49. Liu Y, Wang X, Zhao Y, Zhao P, Wang L, Zhai Q, et al. Upregulation of Tumor Necrosis Factor-alpha-Induced Protein 8-Like 2 mRNA Is Negatively Correlated With Serum Concentrations of Tumor Necrosis Factor-alpha and Interleukin 6 in Type 2 Diabetes Mellitus. J Diabetes Res (2017) 2017:4802319. doi: 10.1155/2017/4802319
50. Penny HL, Sieow JL, Adriani G, Yeap WH, See Chi Ee P, San Luis B, et al. Warburg Metabolism in Tumor-Conditioned Macrophages Promotes Metastasis in Human Pancreatic Ductal Adenocarcinoma. Oncoimmunology (2016) 5(8):e1191731. doi: 10.1080/2162402X.2016.1191731
51. Van Hove H, Martens L, Scheyltjens I, De Vlaminck K, Pombo Antunes AR, De Prijck S, et al. A Single-Cell Atlas of Mouse Brain Macrophages Reveals Unique Transcriptional Identities Shaped by Ontogeny and Tissue Environment. Nat Neurosci (2019) 22(6):1021–35. doi: 10.1038/s41593-019-0393-4
52. Isaacson B, Mandelboim O. Sweet Killers: Nk Cells Need Glycolysis to Kill Tumors. Cell Metab (2018) 28(2):183–4. doi: 10.1016/j.cmet.2018.07.008
53. O’Brien KL, Finlay DK. Immunometabolism and Natural Killer Cell Responses. Nat Rev Immunol (2019) 19(5):282–90. doi: 10.1038/s41577-019-0139-2
54. Keppel MP, Saucier N, Mah AY, Vogel TP, Cooper MA. Activation-Specific Metabolic Requirements for NK Cell IFN-gamma Production. J Immunol (2015) 194(4):1954–62. doi: 10.4049/jimmunol.1402099
55. Donnelly RP, Loftus RM, Keating SE, Liou KT, Biron CA, Gardiner CM, et al. mTORC1-dependent Metabolic Reprogramming Is a Prerequisite for NK Cell Effector Function. J Immunol (2014) 193(9):4477–84. doi: 10.4049/jimmunol.1401558
56. Keating SE, Zaiatz-Bittencourt V, Loftus RM, Keane C, Brennan K, Finlay DK, et al. Metabolic Reprogramming Supports IFN-Gamma Production by CD56bright Nk Cells. J Immunol (2016) 196(6):2552–60. doi: 10.4049/jimmunol.1501783
57. Assmann N, O’Brien KL, Donnelly RP, Dyck L, Zaiatz-Bittencourt V, Loftus RM, et al. Srebp-Controlled Glucose Metabolism Is Essential for NK Cell Functional Responses. Nat Immunol (2017) 18(11):1197–206. doi: 10.1038/ni.3838
58. Cong J, Wang X, Zheng X, Wang D, Fu B, Sun R, et al. Dysfunction of Natural Killer Cells by FBP1-Induced Inhibition of Glycolysis During Lung Cancer Progression. Cell Metab (2018) 28(2):243–55.e5. doi: 10.1016/j.cmet.2018.06.021
59. Pombo Antunes AR, Scheyltjens I, Duerinck J, Neyns B, Movahedi K, Van Ginderachter JA. Understanding the Glioblastoma Immune Microenvironment as Basis for the Development of New Immunotherapeutic Strategies. Elife (2020) 9:e52176. doi: 10.7554/eLife.52176
60. Wildes TJ, Grippin A, Dyson KA, Wummer BM, Damiani DJ, Abraham RS, et al. Cross-Talk Between T Cells and Hematopoietic Stem Cells During Adoptive Cellular Therapy for Malignant Glioma. Clin Cancer Res (2018) 24(16):3955–66. doi: 10.1158/1078-0432.CCR-17-3061
61. Hemmi H, Akira S. TLR Signalling and the Function of Dendritic Cells. Chem Immunol Allergy (2005) 86:120–35. doi: 10.1159/000086657
62. Osorio F, Reis e Sousa C. Myeloid C-type Lectin Receptors in Pathogen Recognition and Host Defense. Immunity (2011) 34(5):651–64. doi: 10.1016/j.immuni.2011.05.001
63. Kawai T, Akira S. Toll-Like Receptors and Their Crosstalk With Other Innate Receptors in Infection and Immunity. Immunity (2011) 34(5):637–50. doi: 10.1016/j.immuni.2011.05.006
64. Leone RD, Powell JD. Metabolism of Immune Cells in Cancer. Nat Rev Cancer (2020) 20(9):516–31. doi: 10.1038/s41568-020-0273-y
65. Krawczyk CM, Holowka T, Sun J, Blagih J, Amiel E, DeBerardinis RJ, et al. Toll-Like Receptor-Induced Changes in Glycolytic Metabolism Regulate Dendritic Cell Activation. Blood (2010) 115(23):4742–9. doi: 10.1182/blood-2009-10-249540
66. Wculek SK, Khouili SC, Priego E, Heras-Murillo I, Sancho D. Metabolic Control of Dendritic Cell Functions: Digesting Information. Front Immunol (2019) 10:775. doi: 10.3389/fimmu.2019.00775
67. Al-Khami AA, Rodriguez PC, Ochoa AC. Metabolic Reprogramming of Myeloid-Derived Suppressor Cells (MDSC) in Cancer. Oncoimmunology (2016) 5(8):e1200771. doi: 10.1080/2162402X.2016.1200771
68. DeNardo DG, Brennan DJ, Rexhepaj E, Ruffell B, Shiao SL, Madden SF, et al. Leukocyte Complexity Predicts Breast Cancer Survival and Functionally Regulates Response to Chemotherapy. Cancer Discovery (2011) 1(1):54–67. doi: 10.1158/2159-8274.CD-10-0028
69. Wesolowski R, Markowitz J, Carson WE 3rd. Myeloid Derived Suppressor Cells - a New Therapeutic Target in the Treatment of Cancer. J Immunother Cancer (2013) 1:10. doi: 10.1186/2051-1426-1-10
70. Ugel S, De Sanctis F, Mandruzzato S, Bronte V. Tumor-Induced Myeloid Deviation: When Myeloid-Derived Suppressor Cells Meet Tumor-Associated Macrophages. J Clin Invest (2015) 125(9):3365–76. doi: 10.1172/JCI80006
71. Al-Khami AA, Zheng L, Del Valle L, Hossain F, Wyczechowska D, Zabaleta J, et al. Exogenous Lipid Uptake Induces Metabolic and Functional Reprogramming of Tumor-Associated Myeloid-Derived Suppressor Cells. Oncoimmunology (2017) 6(10):e1344804. doi: 10.1080/2162402X.2017.1344804
72. Jacobs SR, Herman CE, Maciver NJ, Wofford JA, Wieman HL, Hammen JJ, et al. Glucose Uptake is Limiting in T Cell Activation and Requires CD28-mediated Akt-Dependent and Independent Pathways. J Immunol (2008) 180(7):4476–86. doi: 10.4049/jimmunol.180.7.4476
73. Warburg O. On the Origin of Cancer Cells. Science (1956) 123(3191):309–14. doi: 10.1126/science.123.3191.309
74. MacPherson S, Kilgour M, Lum JJ. Understanding Lymphocyte Metabolism for Use in Cancer Immunotherapy. FEBS J (2018) 285(14):2567–78. doi: 10.1111/febs.14454
75. Araujo L, Khim P, Mkhikian H, Mortales CL, Demetriou M. Glycolysis and Glutaminolysis Cooperatively Control T Cell Function by Limiting Metabolite Supply to N-Glycosylation. Elife (2017) 6:e21330. doi: 10.7554/eLife.21330
76. Sewell AK. Why Must T Cells Be Cross-Reactive? Nat Rev Immunol (2012) 12(9):669–77. doi: 10.1038/nri3279
77. Courtney AH, Lo WL, Weiss A. TCR Signaling: Mechanisms of Initiation and Propagation. Trends Biochem Sci (2018) 43(2):108–23. doi: 10.1016/j.tibs.2017.11.008
78. Culvenor JG, Weidemann MJ. Phytohaemagglutinin Stimulation of Rat Thymus Lymphocytes Glycolysis. Biochim Biophys Acta (1976) 437(2):354–63. doi: 10.1016/0304-4165(76)90005-2
79. Michalek RD, Gerriets VA, Jacobs SR, Macintyre AN, MacIver NJ, Mason EF, et al. Cutting Edge: Distinct Glycolytic and Lipid Oxidative Metabolic Programs are Essential for Effector and Regulatory CD4+ T Cell Subsets. J Immunol (2011) 186(6):3299–303. doi: 10.4049/jimmunol.1003613
80. Cham CM, Driessens G, O’Keefe JP, Gajewski TF. Glucose Deprivation Inhibits Multiple Key Gene Expression Events and Effector Functions in CD8+ T Cells. Eur J Immunol (2008) 38(9):2438–50. doi: 10.1002/eji.200838289
81. Macintyre AN, Gerriets VA, Nichols AG, Michalek RD, Rudolph MC, Deoliveira D, et al. The Glucose Transporter Glut1 Is Selectively Essential for CD4 T Cell Activation and Effector Function. Cell Metab (2014) 20(1):61–72. doi: 10.1016/j.cmet.2014.05.004
82. O’Sullivan D, van der Windt GJ, Huang SC, Curtis JD, Chang CH, Buck MD, et al. Memory CD8(+) T Cells Use Cell-Intrinsic Lipolysis to Support the Metabolic Programming Necessary for Development. Immunity (2014) 41(1):75–88. doi: 10.1016/j.immuni.2014.06.005
83. van der Windt GJ, Pearce EL. Metabolic Switching and Fuel Choice During T-cell Differentiation and Memory Development. Immunol Rev (2012) 249(1):27–42. doi: 10.1111/j.1600-065X.2012.01150.x
84. Franco F, Jaccard A, Romero P, Yu YR, Ho PC. Metabolic and Epigenetic Regulation of T-cell Exhaustion. Nat Metab (2020) 2(10):1001–12. doi: 10.1038/s42255-020-00280-9
85. Ma EH, Bantug G, Griss T, Condotta S, Johnson RM, Samborska B, et al. Serine Is an Essential Metabolite for Effector T Cell Expansion. Cell Metab (2017) 25(2):345–57. doi: 10.1016/j.cmet.2016.12.011
86. Quemeneur L, Gerland LM, Flacher M, Ffrench M, Revillard JP, Genestier L. Differential Control of Cell Cycle, Proliferation, and Survival of Primary T Lymphocytes by Purine and Pyrimidine Nucleotides. J Immunol (2003) 170(10):4986–95. doi: 10.4049/jimmunol.170.10.4986
87. Duarte IF, Gil AM. Metabolic Signatures of Cancer Unveiled by NMR Spectroscopy of Human Biofluids. Prog Nucl Magn Reson Spectrosc (2012) 62:51–74. doi: 10.1016/j.pnmrs.2011.11.002
88. Duarte IF, Diaz SO, Gil AM. NMR Metabolomics of Human Blood and Urine in Disease Research. J Pharm BioMed Anal (2014) 93:17–26. doi: 10.1016/j.jpba.2013.09.025
89. Miyata S, Tominaga K, Sakashita E, Urabe M, Onuki Y, Gomi A, et al. Comprehensive Metabolomic Analysis of IDH1(R132H) Clinical Glioma Samples Reveals Suppression of Beta-Oxidation Due to Carnitine Deficiency. Sci Rep (2019) 9(1):9787. doi: 10.1038/s41598-019-46217-5
90. Wilson M, Gill SK, MacPherson L, English M, Arvanitis TN, Peet AC. Noninvasive Detection of Glutamate Predicts Survival in Pediatric Medulloblastoma. Clin Cancer Res (2014) 20(17):4532–9. doi: 10.1158/1078-0432.CCR-13-2320
91. Elkhaled A, Jalbert L, Constantin A, Yoshihara HA, Phillips JJ, Molinaro AM, et al. Characterization of Metabolites in Infiltrating Gliomas Using Ex Vivo (1)H High-Resolution Magic Angle Spinning Spectroscopy. NMR BioMed (2014) 27(5):578–93. doi: 10.1002/nbm.3097
92. Andronesi OC, Kim GS, Gerstner E, Batchelor T, Tzika AA, Fantin VR, et al. Detection of 2-Hydroxyglutarate in IDH-Mutated Glioma Patients by In Vivo Spectral-Editing and 2D Correlation Magnetic Resonance Spectroscopy. Sci Transl Med (2012) 4(116):116ra4. doi: 10.1126/scitranslmed.3002693
93. Locasale JW, Melman T, Song S, Yang X, Swanson KD, Cantley LC, et al. Metabolomics of Human Cerebrospinal Fluid Identifies Signatures of Malignant Glioma. Mol Cell Proteomics (2012) 11(6):M111 014688. doi: 10.1074/mcp.M111.014688
94. Marcus KJ, Astrakas LG, Zurakowski D, Zarifi MK, Mintzopoulos D, Poussaint TY, et al. Predicting Survival of Children With CNS Tumors Using Proton Magnetic Resonance Spectroscopic Imaging Biomarkers. Int J Oncol (2007) 30(3):651–7. doi: 10.3892/ijo.30.3.651
95. Albers MJ, Krieger MD, Gonzalez-Gomez I, Gilles FH, McComb JG, Nelson MD Jr., et al. Proton-Decoupled 31P MRS in Untreated Pediatric Brain Tumors. Magn Reson Med (2005) 53(1):22–9. doi: 10.1002/mrm.20312
96. Li H, Bullock K, Gurjao C, Braun D, Shukla SA, Bosse D, et al. Metabolomic Adaptations and Correlates of Survival to Immune Checkpoint Blockade. Nat Commun (2019) 10(1):4346. doi: 10.1038/s41467-019-12361-9
97. Lim CK, Bilgin A, Lovejoy DB, Tan V, Bustamante S, Taylor BV, et al. Kynurenine Pathway Metabolomics Predicts and Provides Mechanistic Insight Into Multiple Sclerosis Progression. Sci Rep (2017) 7:41473. doi: 10.1038/srep41473
98. Yan H, Parsons DW, Jin G, McLendon R, Rasheed BA, Yuan W, et al. IDH1 and IDH2 Mutations in Gliomas. N Engl J Med (2009) 360(8):765–73. doi: 10.1056/NEJMoa0808710
99. Dang L, White DW, Gross S, Bennett BD, Bittinger MA, Driggers EM, et al. Cancer-Associated IDH1 Mutations Produce 2-Hydroxyglutarate. Nature (2009) 462(7274):739–44. doi: 10.1038/nature08617
100. Amankulor NM, Kim Y, Arora S, Kargl J, Szulzewsky F, Hanke M, et al. Mutant IDH1 Regulates the Tumor-Associated Immune System in Gliomas. Genes Dev (2017) 31(8):774–86. doi: 10.1101/gad.294991.116
Keywords: metabolic signature, metabolomics monitoring, biomarker, cancer, brain tumor, immunotherapy
Citation: Dastmalchi F, Deleyrolle LP, Karachi A, Mitchell DA and Rahman M (2021) Metabolomics Monitoring of Treatment Response to Brain Tumor Immunotherapy. Front. Oncol. 11:691246. doi: 10.3389/fonc.2021.691246
Received: 05 April 2021; Accepted: 17 May 2021;
Published: 03 June 2021.
Edited by:
Chris Albanese, Georgetown University, United StatesReviewed by:
Ryusuke Hatae, University of California San Francisco, United StatesSerena Pellegatta, Fondazione IRCCS Istituto Neurologio Carlo Besta, Italy
Copyright © 2021 Dastmalchi, Deleyrolle, Karachi, Mitchell and Rahman. This is an open-access article distributed under the terms of the Creative Commons Attribution License (CC BY). The use, distribution or reproduction in other forums is permitted, provided the original author(s) and the copyright owner(s) are credited and that the original publication in this journal is cited, in accordance with accepted academic practice. No use, distribution or reproduction is permitted which does not comply with these terms.
*Correspondence: Farhad Dastmalchi, RmFyaGFkLkRhc3RtYWxjaGlAbmV1cm9zdXJnZXJ5LnVmbC5lZHU=