 Yaqi Xue
 Ping Wang
 Fei Jiang
 Jing Yu
 Hongmei Ding
 Zengli Zhang
 Hailong Pei
 Bingyan Li
- 1Deparment of Nutrition and Food Hygiene, Medical College of Soochow University, Suzhou, China
- 2Department of Clinical Nutrition, The First Affiliated Hospital of Soochow University, Suzhou, China
- 3Department of Obstetrics and Gynecology, The First Affiliated Hospital of Soochow University, Suzhou, China
- 4State Key Laboratory of Radiation Medicine and Protection, School of Radiation Medicine and Protection, Collaborative Innovation Centre of Radiological Medicine of Jiangsu Higher Education Institutions, Soochow University, Suzhou, China
Long noncoding RNAs (lncRNAs) were identified rapidly due to their important role in many biological processes and human diseases including cancer. 1α,25-dihydroxyvitamin D3 [1α,25(OH)2D3] and its analogues are widely applied as preventative and therapeutic anticancer agents. However, the expression profile of lncRNAs regulated by 1α,25(OH)2D3 in ovarian cancer remains to be clarified. In the present study, we found 606 lncRNAs and 102 mRNAs that showed differential expression (DE) based on microarray data. Gene Ontology (GO) and Kyoto Encyclopedia of Genes and Genomes (KEGG) pathway analysis indicated that the DE genes were mainly enriched in TGF-β, MAPK, Ras, PI3K-Akt, and Hippo signaling pathways, as well as the vitamin D-related pathway. We further assessed the potential lncRNAs that linked vitamin D signaling with EMT, and lncBCAS1-4_1 was identified in the first time. Moreover, we found that the most upregulated lncBCAS1-4_1 showed 75% same transcripts with CYP24A1 (metabolic enzyme of 1α,25(OH)2D3). Finally, the lncBCAS1-4_1 gain-of-function cell model was established, which demonstrated that the knockdown of lncBCAS1-4_1 inhibited the proliferation and migration of ovarian cancer cells. Furthermore, lncBCAS1-4_1 could resist the antitumor effect of 1α,25(OH)2D3, which was associated with upregulated ZEB1. These data provide new evidences that lncRNAs served as a target for the antitumor effect of 1α,25(OH)2D3.
Introduction
Ovarian cancer is the leading cause of death caused by gynecologic malignancies (1). Despite the significant medical advances during the past decades, the 5-year survival rate of ovarian cancer is lower than 50% (2). Long noncoding RNAs (lncRNAs), with transcripts more than 200 nucleotides in length, were suggested to play fundamental roles in the development of tumor (3), due to the fact that lncRNAs may exhibit tumor suppressive or promoting functions through the regulation of transcription, translation, protein modification, and the formation of RNA–protein or protein–protein complexes (4). Therefore, lncRNAs are possible candidates of cancer biomarkers and/or therapeutic targets (5). Recently, 13 published papers investigated the expression of lncRNA in normal ovaries, ovarian cysts, and benign and malignant ovarian cancer (6–18), suggesting the important role of lncRNAs in ovarian cancer development and chemotherapeutic survival outcomes of patients. Thus, it is important to explore the potential of lncRNAs as a therapeutic target of ovarian cancer.
Accumulating evidences supported the role of vitamin D in reducing cancer risk and improving prognosis. The active metabolite of vitamin D, 1α,25 dihydroxyvitamin D3 [1α,25(OH)2D3], has been demonstrated to have an anticancer effect by inhibiting proliferation, inflammation, invasion, metastasis, and angiogenesis. In addition, 1α,25(OH)2D3 could promote apoptosis and differentiation (19, 20) through mitogen-activated protein kinase (MAPK), NF-κB, and PI3K−Akt-dependent signaling pathways (21–23). These findings indicate that 1α,25(OH)2D3 may play an important role in the control of cancer by mediating protein-coding genes. In addition, one and two reports studied vitamin D receptor (VDR)-regulated lncRNAs profiling in skin cancer and breast cancer, respectively (24–26). However, it is not clear which lncRNAs are regulated by 1α,25(OH)2D3 in ovarian cancer.
In the present study, the lncRNA and mRNA networks were constructed using microarray data, which were used to explore the profile of lncRNA in 1α,25(OH)2D3-treated human ovarian cancer SKOV3 cells comprehensively. Moreover, the potential lncRNAs that linked vitamin D signaling with EMT were analyzed, and lncBCAS1-4_1 was identified. Besides, the effect of lncBCAS1-4_1 on the proliferation and migration in 1α,25(OH)2D3-treated ovarian cancer cells was investigated.
Materials and Methods
Microarray Expression Profiling
SKOV3 cells were treated with 1α,25(OH)2D3 (100 nmol/L) or vehicle (the same concentration of ethanol) for 72 h. Total RNA was extracted with a TRIzol reagent (Thermo Fisher Scientific, Scotts Valley, CA, USA) and quantified using NanoDrop™ ND-2000 (Thermo Fisher Scientific). After RNA integrity was assessed using an Agilent Bioanalyzer 2100 (Agilent Technologies, CA, USA), sample labeling, microarray hybridization, and washing were performed based on the manufacturer’s standard protocols (OE Biotech Company, Shanghai, Design ID: 076500). Briefly, total RNA was transcribed to double-stranded cDNA and then synthesized into cRNA, which was labeled with Cyanine-3-CTP. The labeled cRNAs were hybridized onto the microarray. After washing, the arrays were scanned by the Agilent Scanner G2505C (Agilent Technologies).
Differentially Expressed Gene Analysis
Limma (Version 3.8) package in R software was used to identify the differently expressed mRNAs (DE-mRNAs) and -lncRNAs (DE-lncRNAs) with a threshold of |log2 (fold change [FC])| > 2.0 and a false discovery rate [FDR (adjusted p-value)] < 0.05. The heatmap and volcano were constructed by the gplots package in R software.
Functional Enrichment Analysis
To reveal the functions of DE genes, the Enricher database was used to conduct Gene Ontology (GO) annotation and Kyoto Encyclopedia of Genes and Genomes (KEGG) pathway enrichment analyses (27). The GO terms comprised of the following three divisions: biological process (BP), cellular component (CC), and molecular function (MF). A significance level of p < 0.05 was set as the cutoff criterion, and the plots were constructed by the gplots package in R software.
A PPI network of DE mRNAs was constructed using STRING 11.0 (http://string-db.org), with a combined score > 0.9 as the cutoff value. Significant modules in the PPI network were identified using MCODE 1.5.1 (a Cytoscape software plug-in).
Construction of the lncRNA-mRNA Co-Expression Modules
The lncRNAs and mRNAs co-expression modules were further selected using Pearson correlation analysis. The lncRNA–mRNA pairs with a correlation coefficient > 0.9 and p < 0.05 were used for bidirectional clustering.
Enrichment of EMT Signal Pathway in Ovarian Cancer Cells Treated With 1α,25(OH)2D3
Here, 200 EMT-related genes were downloaded from the Molecular Signature Database v7.1 (MSigDB) (http://www.broad.mit.edu/gsea/msigdb/). To identify the EMT pathway involved in 1α,25(OH)2D3-treated ovarian cancer cells, risk signature was used in Gene Set Enrichment Analysis (GSEA), and p < 0.05 and FDR > 2 were considered as statistically significant.
Quantitative Real-Time PCR
Reverse transcription reactions consisted of 1 μg RNA and 2 μL of 5xPrimerScript RT Master Mix (TaKaRa, Japan) with a total volume of 10 μL. The primer sequences of RNA are shown in Table 1. Reactions were performed in a C100 PCR System (Bio-Rad, Hercules, CA, USA) for 15 min at 37°C. GAPDH was used as the internal control. The qPCR was performed using the SYBR Green (Roche, Basel, Switzerland) dye detection method on the ABI 7500 PCR instrument (Applied Biosystem, Foster City, CA, USA) under default conditions: 95°C for 10 s, 40 cycles of 95°C for 5 s, and 55°C for 30 s. The relative gene expression levels were analyzed by the 2-ΔΔCt method, where ΔCt = Ct(target) – Ct(GADPH).
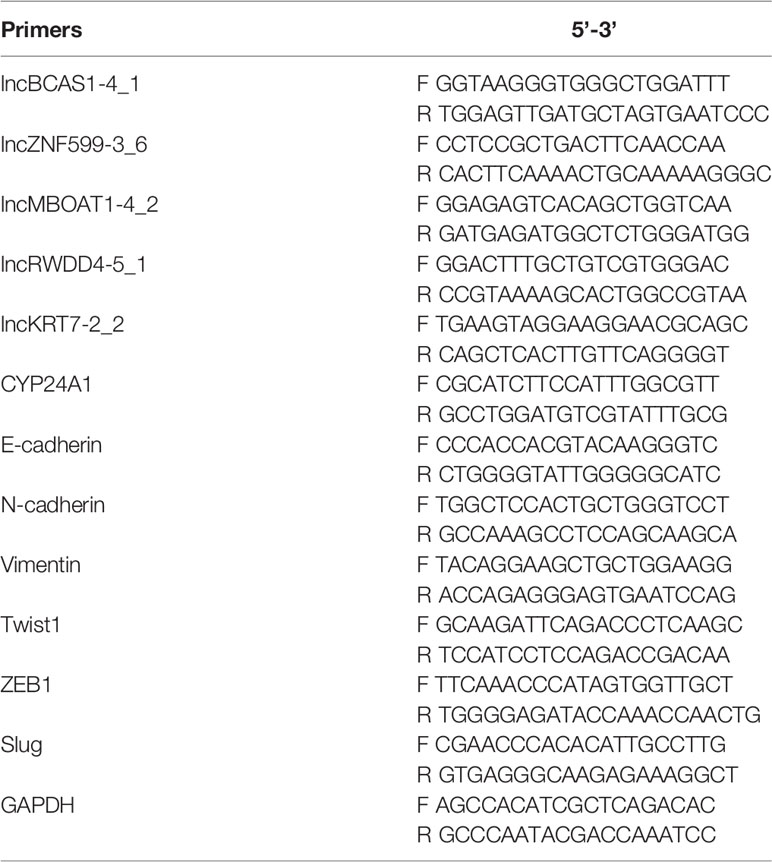
Table 1 Primer sequences for PCR.
Construction of lncBCAS1-4_1 Loss/Gain Cell Model
Overexpression adenoviruses (OE) as well as control adenoviruses (empty vector, EV) of lncBCAS1-4_1 were purchased from GeneChem Corporation (Shanghai, China). The knockdown lncBCAS1-4_1 was produced by siRNA interference. Scramble control and silncBCAS1-4_1 were purchased from RiboBio Co., Ltd (Guangzhou, China) and transfected using riboFECT™ CP (Guangzhou, China) according to the manufacturer’s instructions. All oligonucleotide sequences are listed in Table 2.
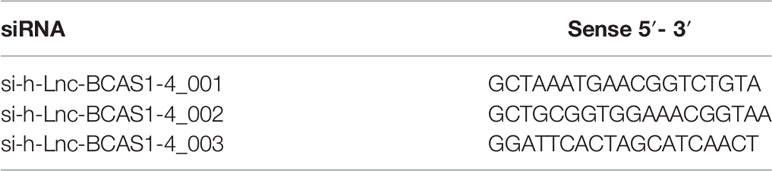
Table 2 Target sequences of siRNA.
Cell Proliferation Assay
Cell colony formation and the CCK-8 counting were used to assay cell proliferation, respectively. Briefly, 3×10⁴ OVCAR8 or 2.5×10⁴ SKOV3 cells were seeded onto 60-mm culture plates and transfected by adenoviruses or siRNAs for 72 h. After the cells were treated with 1α,25(OH)2D3 (100 nmol/L) or ethanol for 48 h, they were fixed with 75% alcohol and stained with 0.3% methyl violet for 20 min at room temperature. Then the colonies were dissolved by glacial acetic acid, and the absorbance value (AU) was detected at 585 nm with a microplate reader (Filter Max F5, Molecular Devices, CA, USA). The cell proliferation ratio was calculated as (AUtreatment group – AUblank group)/(AUcontrol group – AUblank group). All experiments were performed in triplicate.
According to the manufacturer’s instructions, approximately, 3×10³ OVCAR8 or 2.5×10³ SKOV3 cells per well were plated in triplicate into 96-well plates and treated with 1α,25(OH)2D3 for 48 h. The control group was treated with ethanol. At each of the desired time points, 10 μL of the CCK-8 solution was added and incubated for 1 h at 37°C, followed by measurement of absorbance at 450 and 630 nm with a microplate reader for quantifying the relative cell density. Cell viability was calculated as: (AU 450-treatment group – AU630-treatment group)/(AU450-control group – AU630-blank group). All experiments were performed in triplicate.
Cell Migration Assay
The cell migration was assessed using a wound healing assay. Cells were plated into a 6-well plate with FBS-free media for 12 h. Afterwards, cells cultured in the bottom of the well were scratched using a pipette tip to create a wound area. After 24 and 48 h, wounds (three images each well) were imaged under a microscope (40, CKX41F, Olympus, Tokyo, Japan) to detect the width of the gaps. Wound healing assay data are displayed as the migration index (%), which is calculated by the formula [(initial width) - (final width)]/(initial width). Values were normalized by the control group. Data points in the figure represent three independent experiments.
Statistical Analysis
All microarray statistical data were analyzed in the R environment (R version: 3.6.3). Wilcoxon/Mann–Whitney test was used to analyze continuous variables, and Fisher’s exact test or chi-square test was used to analyze the categorical data. Experimental data were performed using GraphPad Prism 8 (GraphPad Software Inc., La Jolla, CA, USA). Quantitative data were presented as the mean ± standard deviation (SD). Statistical data were analyzed using an unpaired Student’s t-test. For all statistical analyses, a p-value less than 0.05 was regarded as statistically significant.
Results
Identification of Differentially Expressed lncRNA and mRNAs in 1α,25(OH)2D3 treated SKOV3 Cells
To identify the differentially expressed (DE) mRNAs and lncRNAs in human ovarian cancer cells, SKOV3 cells were treated with 1α,25(OH)2D3 or vehicle to obtain lncRNA and mRNA expression profiles by microarray analysis (GSE 173633). Compared with control cells, 606 lncRNAs were dysregulated (fold change > 2.0, p < 0.05) in 1α,25(OH)2D3-treated SKOV3 cells, in which 381 lncRNAs were upregulated and 225 lncRNAs were downregulated. lnc-BCAS1-4_1 was the most upregulated lncRNA, with a 257.77-fold change (Figure 1A, B). In addition, among 102 dysregulated mRNAs, there were 81 upregulated mRNAs and 21 downregulated mRNAs. Interestingly, the most upregulated mRNA transcript was CYP24A1, the metabolic enzyme of 1α,25(OH)2D3, and the fold change was 1653.22 (Figures 1C, D).
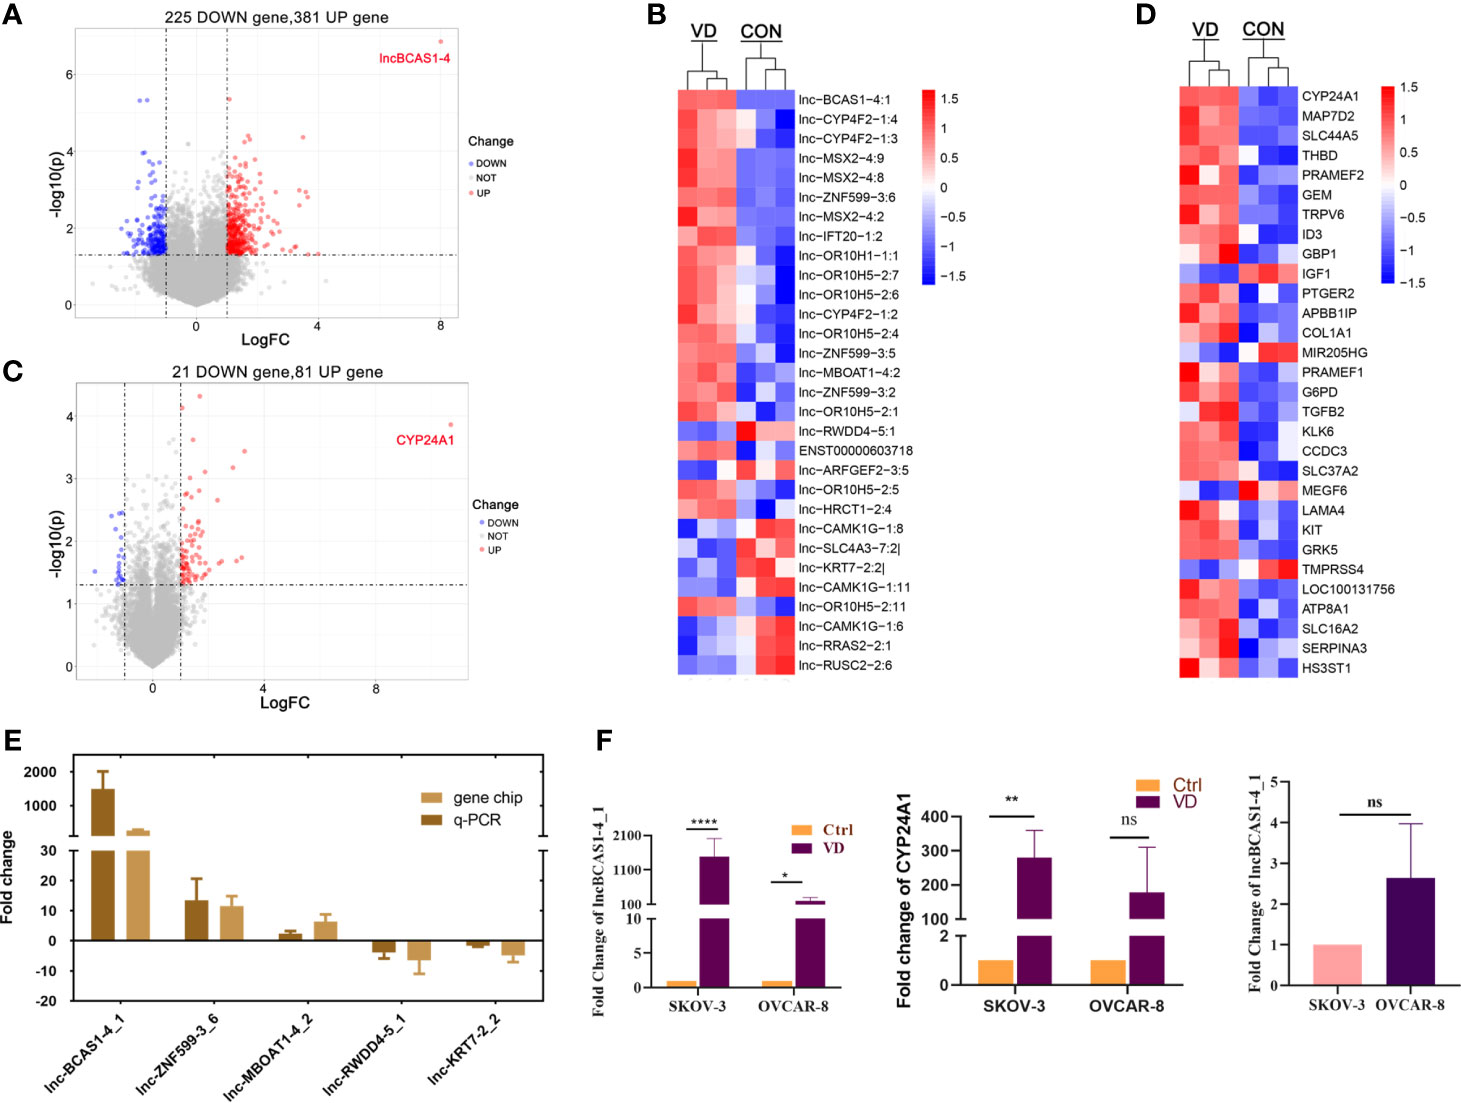
Figure 1 Distributions of differentially expressed genes in ovarian cancer cells treated with 1α,25((OH)2D3. The ascending normalized expression level in the heatmaps is colored from blue to red. Red means gene upregulation, blue indicates downregulation, and white means normal expression. Furthermore, each column represents a sample, and each row represents a differentially expressed gene. (A) The volcanoes of 606 DE lncRNAs; (B) the heatmaps of DE-lncRNAs; (C) the volcanoes of 102 DE-mRNAs; (D) the heatmaps of DE-mRNAs; (E) the validation of DE-lncRNAs by quantitative RT-PCR; and (F) the expressions of most-regulated lncBCAS-1_4-1 and CYP24A1 in SKOV3 and OVCAR8 treated by 1α,25(OH)2D3. *p < 0.05, **p < 0.01, ****p < 0.0001, NS, not significant.
To further validate the findings of the microarray analysis results, five dysregulated lncRNAs were confirmed using quantitative RT-PCR. lnc-BCAS1-4_1 and lnc-RWDD4-5_1 were selected as target lncRNAs with the most upregulated/downregulated expression. Lnc-ZNF599-3_6 was selected for its potential function of trans-regulating, and the other two (lnc-MBOAT1-4_2 and lnc-KRT7-2_2) were randomly selected. Consistently, their expressions from quantitative RT-PCR results were similar with those of the microarray analysis (Figure 1E). Similarly, the transcriptional levels of lncRNABCAS1-4_1 and CYP24A1 were indeed dramatically increased after 1α,25(OH)2D3 treatment (Figure 1F). We searched with BLAST and found that lncBCAS1-4_1 showed 75% same transcripts with CYP24A1 (Supplementary Data Figure S1). Interestingly, the fold change is more remarkable in SKOV3 cells, which might be linked with the lower background of lncBCAS1-4_1 in SKOV3 cells (Figure 1F), indicating that the expression of lncBCAS1-4_1 could have influence on the efficacy of 1α,25(OH)2D3.
Vitamin D-Regulated lncRNA–mRNA Network in Ovarian Cancer Cells
To explore the potential responsible mechanism of cancer cells for 1α,25(OH)2D3, KEGG pathway analysis was performed on the DE genes. The results indicated that DE mRNAs were mainly enriched in TGF-β, regulating pluripotency of stem cells, and Hippo signaling pathways (Figure 2A). The hub genes with a degree connectivity in PPI network were enriched in insulin-like growth factor 1 (IGF1), which is known to induce cell proliferation (28), TGF-β2 (29), insulin-like growth factor-binding protein 3 (IGFBP3) (28), and COL1A1 (30), which are closely associated with the vitamin D endocrine system (Figure 2B). Then, we identified a top 5 lncRNAs–mRNAs networks including 5 lncRNAs and 140 mapped mRNAs (Figure 2C and Supplementary Data Table S1). GO enrichment analysis and subpathway analysis showed that “phagocytosis”, “cytoplastic side of plasma membrane”, and “growth factor activity” were significantly related to this module (Figure 2D). KEGG analysis for 140 mRNA from top 5 lncRNA–mRNAs networks revealed that cancer-related pathways were enriched in this network, e.g., Ras, MAPK, TGF-β, Rap1, and PI3K-Akt signaling pathway (Figure 2E).
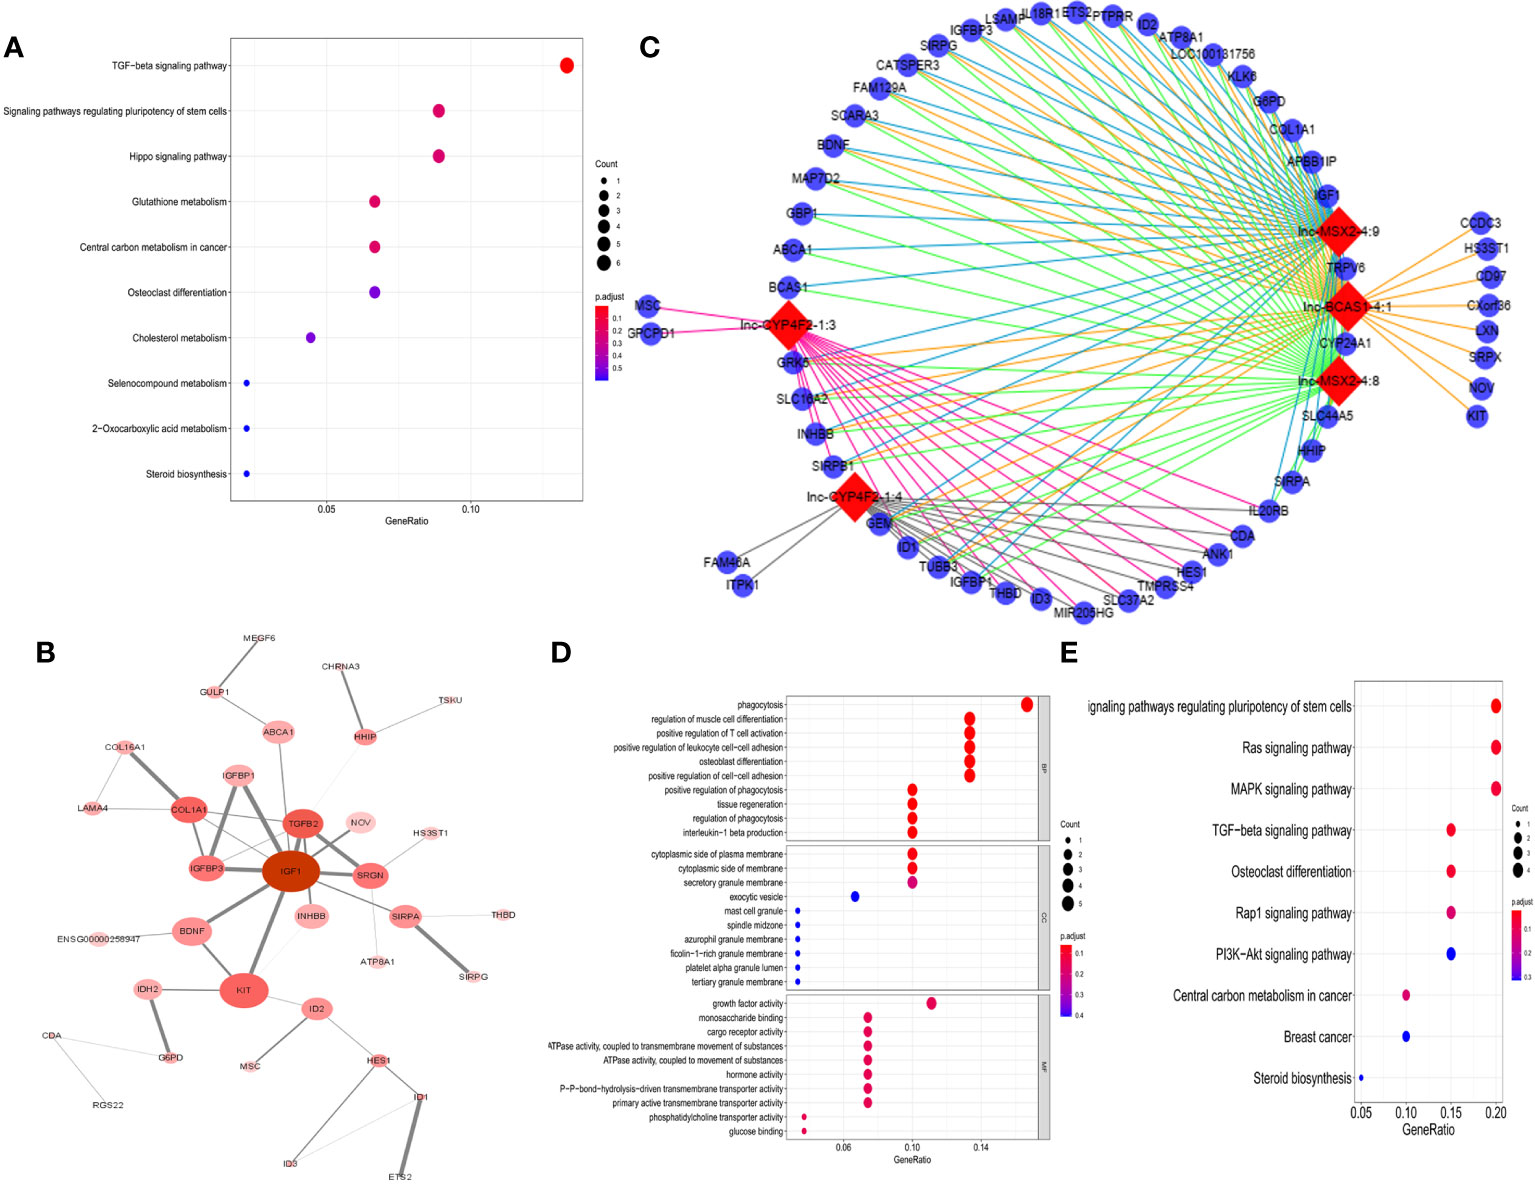
Figure 2 Function analysis of DE-RNAs. (A) The KEGG pathways from total DE-mRNAs, mean enrichment of genes in different pathways. The y-axis represents the pathways, and the x-axis represents enriched gene numbers; the color means adjusted p-value; the most important pathways. (B) The most significant hub genes identified by protein–protein interaction (PPI). (C) Vitamin D-regulated lncRNA–mRNA network including top 5 lncRNAs and 140 mapped mRNAs. The red nodes represent top 5 differentially expression lncRNAs, and the blue nodes represent mapped mRNA. (D) GO analysis contains the biological process (BP), cellular component (CC), and molecular function (MF). The x-axis represents the gene ratio, and the y-axis represents GO terms. The size of the circle indicates the gene count, and the color means adjusted p-value. (E) The KEGG pathways from top 5 lncRNA regulated-DE mRNAs. The y-axis represents the pathways, and the x-axis represents enriched gene numbers; the color means adjust p-value.
Construction of the lncBCAS-1_4-1 as a Core of EMT Signal Pathway in 1α,25(OH)2D3 Treated Ovarian Cancer Cells
Next, we selected the most dysregulated lncRNA, lncBCAS1-4_1, to construct the lncRNA–mRNA network, and 83 mapped mRNAs were involved to explore the function of this module (Figure 3A and Supplementary Data Table S2). GO analysis showed that “epithelial cell proliferation”, “collagen-containing extracellular matrix”, and “growth factor activity” were highly enriched in this network (Figure 3B). KEGG analysis also revealed that these genes mainly enriched in TGF-β, regulating pluripotency stem cells, MAPK, Ras, and Hippo signaling pathways (Figure 3C). Because the TGF-β signaling pathway repeatedly occurred, the EMT-related genes were applied to identify the significant pathway associated with 1α,25(OH)2D3; as shown in Figure 3D. The EMT pathway was significantly activated in this network (Figure 3D).
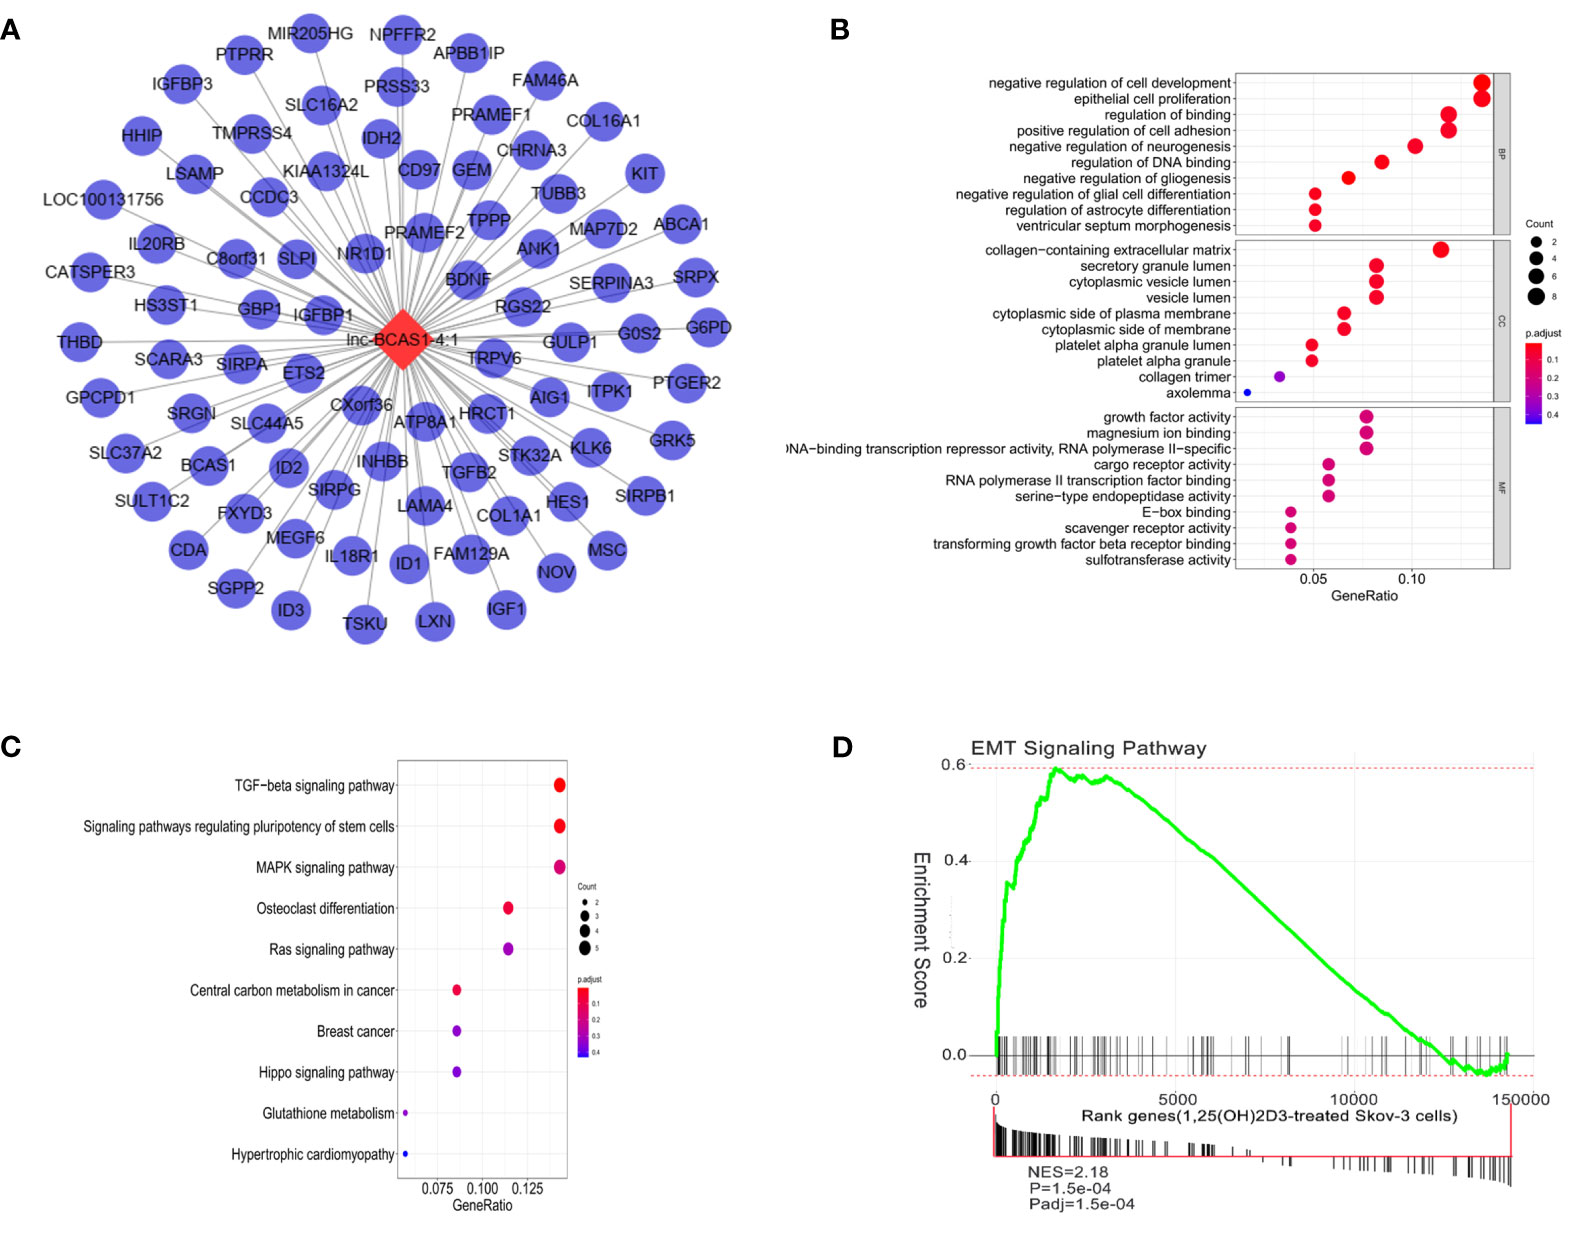
Figure 3 Function analysis of lncBCAS1-4_1. (A) lncBCAS1-4_1-mRNA networks. The red nodes represent top differentiated expression lncBCAS1-4_1, and the blue nodes represent mapped mRNA. (B) GO analysis contains the biological process (BP), cellular component (CC), and molecular function (MF). The x-axis represents the gene ratio, and the y-axis represents GO terms. The size of the circle indicates the gene count, and the color means adjusted p-value. (C) The KEGG pathways from lncBCAS1-4_1 regulated DE-mRNAs. The y-axis represents the pathway, and the x-axis represents enriched gene numbers; the color means adjust p-value. (D) Gene set enrichment analysis for EMT-related lncRNA signature in 1α,25(OH)2D3-treated SKOV3 cells.
The Role lncBCAS-1_4-1 on Proliferation and Migration of Ovarian Cancer Cells
To validate the function of lncBCAS-1_4-1, SKOV3 cells were used to build up lncBCAS1-4_1 gain-of-function cell models (Figure 4A), while OVCAR8 cells were used to build up lncBCAS1-4_1 loss-of-function cell models (Figure 4B). The results of CCK8 (Figure 4C) and platting efficiency (Figure 4D) assay showed that overexpressed lncBCAS1-4_1 promoted proliferation, while knockdown of lncBCAS1-4_1 inhibited proliferation. Similarly, we found that the gain of lncBCAS1-4_1 increased migration, and the loss of lncBCAS1-4_1 decreased cell migration (Figure 4E). We then detected the expression of mRNAs associated with the EMT signaling pathway. The result demonstrated that overexpression of lncBCAS1-4_1 significantly upregulated the EMT mesenchymal marker including N-cadherin and Vimentin, as well as the EMT-related transcriptional factor (ZEB1) (Figure 4F).
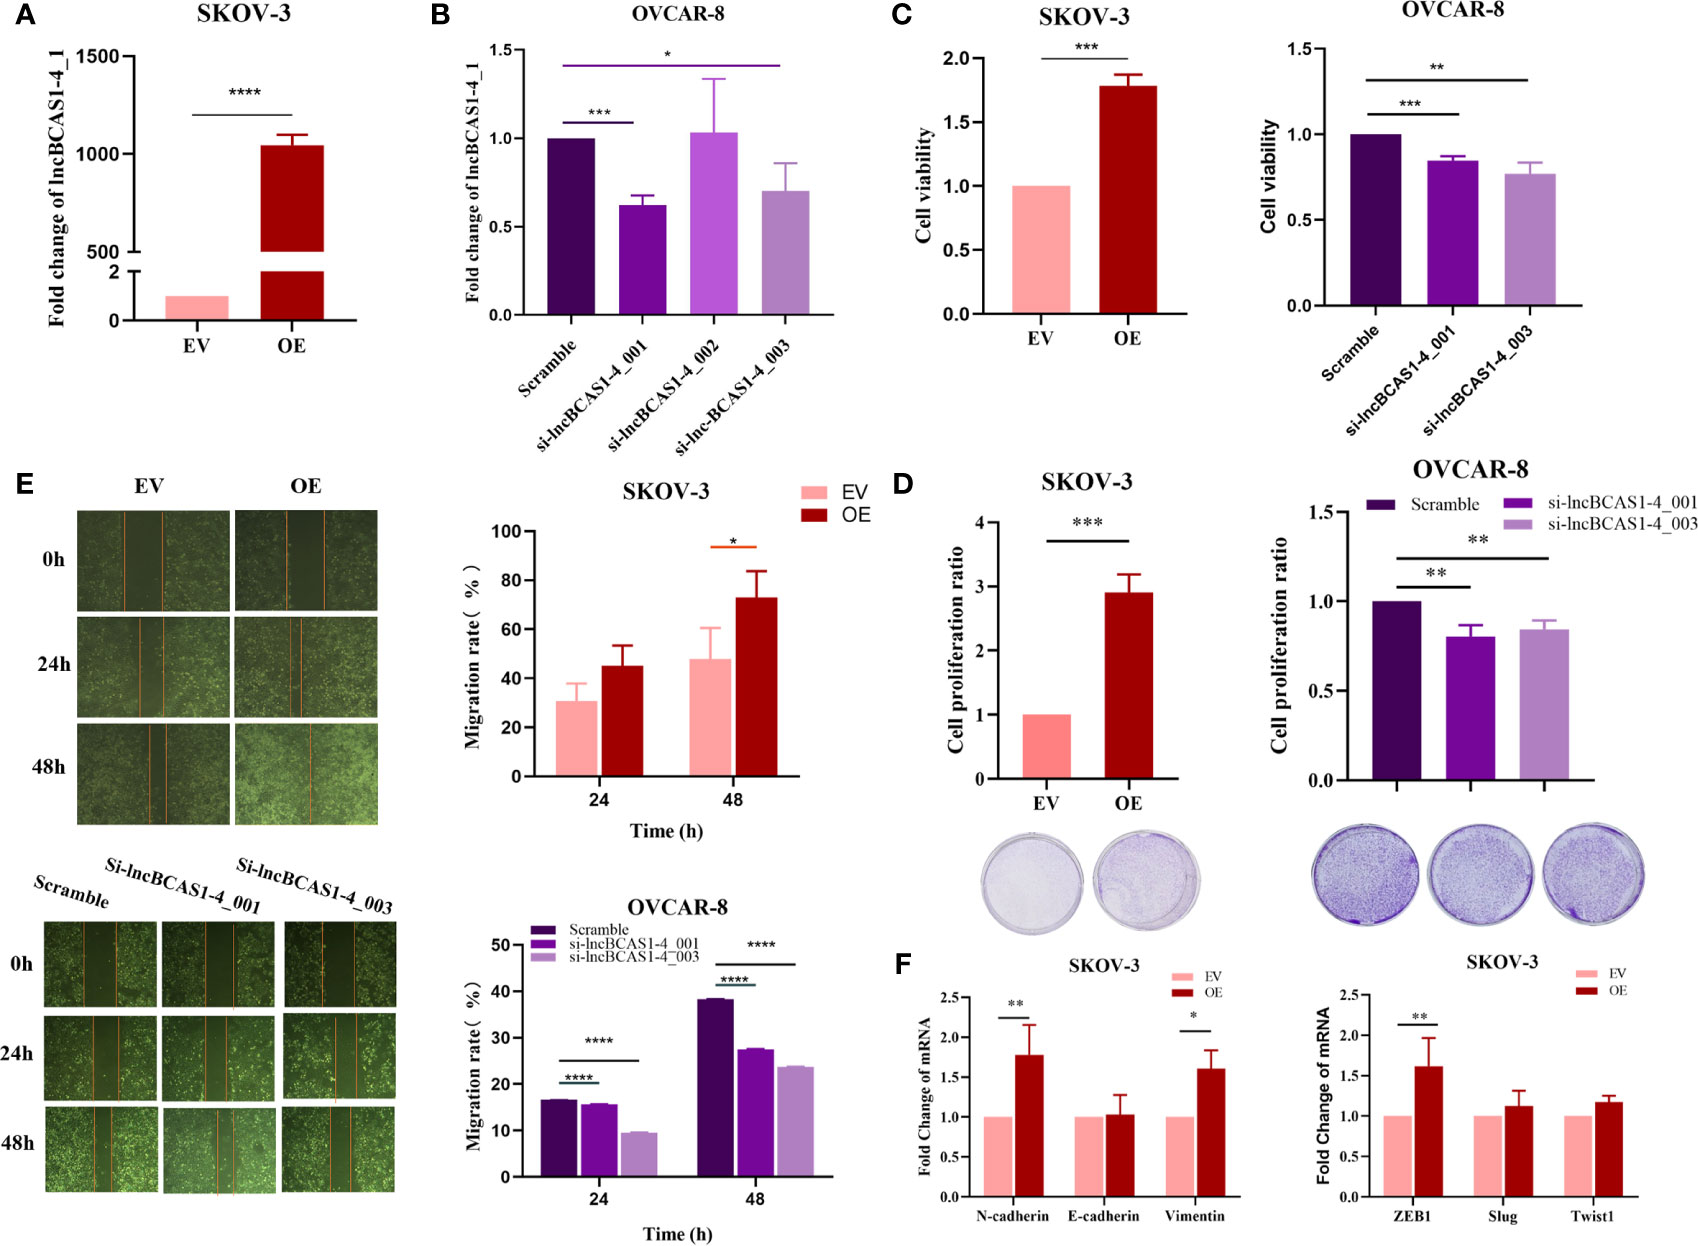
Figure 4 Effect of lncBCAS1-4_1 on proliferation and migration in ovarian cancer cells. (A) Compared with empty vector control cells (EV), the expression of lncBCAS1-4_1 was upregulated in SKOV3 cells transfected by adenovirus (OE) for 72 h. (B) The level of lncBCAS1-4_1 was downregulated in OVCAR8 cells transfected by siRNA (sh-lncBCAS1-4_001 and sh-lncBCAS1-4_003) for 72 h, compared to scramble control. (C) The cell viability was detected by CCK-8 after cells were transfected for 72 h. (D) The proliferation activity was detected by colony formation assay after the cells were transfected for 72 h. (E) The migration capacity was measured by wound healing assay after the cells were transfected for 72 h. (F) The mRNA levels of EMT-related genes were determined using RT-PCR. *p < 0.05, **p < 0.01, ***p < 0.001, ****p < 0.0001.
The Inhibition of 1α,25(OH)2D3 on Proliferation and Migration of Ovarian Cancer Cells Is Disrupted by lncBCAS-1_4-1
To ascertain the impact of lncBCAS1-4_1 on the antitumor action of vitamin D, ovarian cancer cells treated with 1α,25(OH)2D3 were interfered or overexpressed by the siRNA or adenovirus vector of lncBCAS1-4_1, respectively. As expected, the knockdown of lncBCAS1-4_1 significantly enhanced the 1α,25(OH)2D3 mediated antitumor effect, while overexpressed lncBCAS1-4_1 resisted the antitumor effect of 1α,25(OH)2D3 in vitro (Figures 5A–C). The results from Figure 5D showed that the expressions of Vimentin, ZEB1, and Twist1 were significantly reduced by 1α,25(OH)2D3 as compared to mock-vehicle negative control. However, the reduced ZEB1 levels in overexpressed lncBCAS1-4_1 SKOV3 cells were increased after treatment with 1α,25(OH)2D3. Taken together, these data indicated that the overexpression of lncBCAS1-4_1 significantly resisted the antitumor effect of 1α,25(OH)2D3, which was associated with upregulating ZEB1.
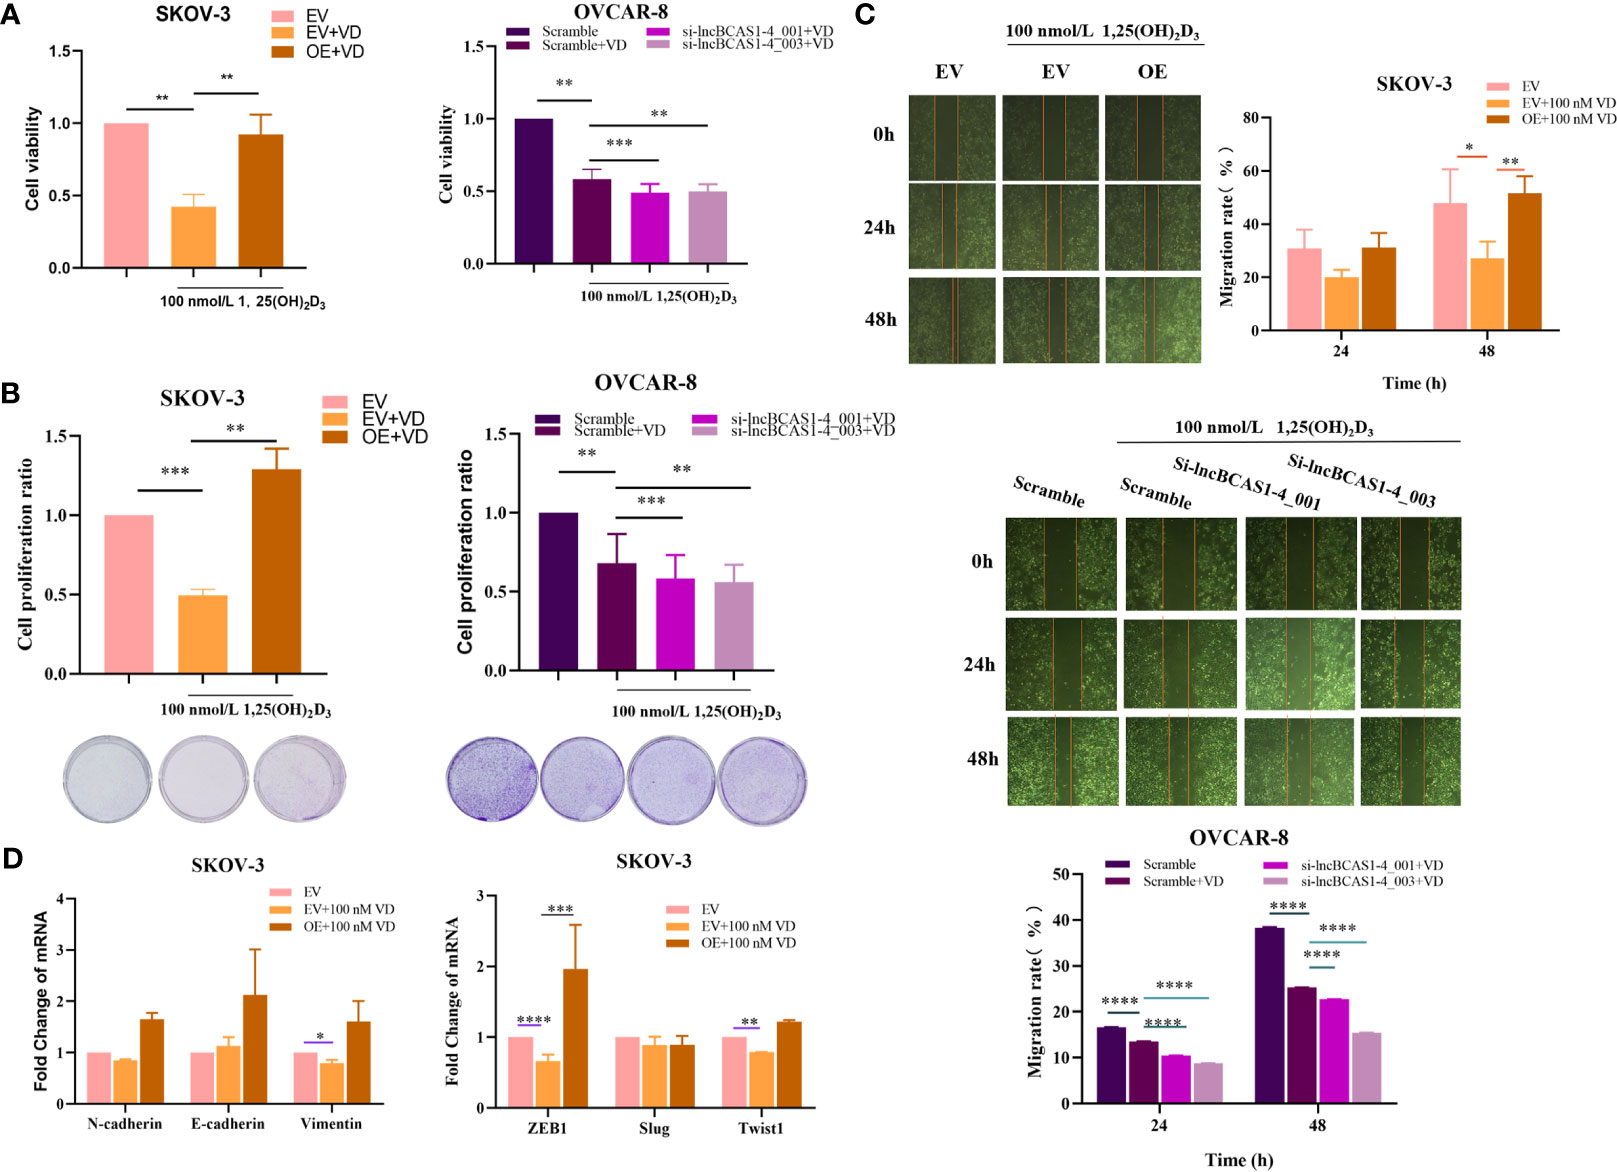
Figure 5 Effect of lncBCAS1-4_1 on proliferation and migration in ovarian cancer cells treated with 1α,25(OH)2D3. (A) The cell viability was detected by CCK-8 after lncBCAs1-4-gain SKOV3 and -loss OVCAR8 cells treated with 1α,25(OH)2D3 for 48 h. (B) The proliferation activity was detected by colony formation assay, after lncBCAs1-4-gain SKOV3 and -loss OVCAR8 cells treated with 1α,25(OH)2D3 for 48 h. (C) The migration capacity was measured by wound healing assay, after lncBCAs1-4-gain SKOV3 and -loss OVCAR8 cells treated with 1α,25(OH)2D3 for 48 h. (D) The mRNA levels of EMT-related genes were measured using RT-PCR. *p < 0.05, **p < 0.01, ***p < 0.001, ****p < 0.0001.
Discussion
Previous reports demonstrated that 1α,25(OH)2D3 could regulate some protein-coding genes (31–33). Three studies showed that VDR regulated lncRNA profiling in skin and breast cancer (24–26). However, to date, there was no study investigating whether 1α,25(OH)2D3 could affect the expression pattern of lncRNAs in ovarian cancer. In the present study, 606 differentially expressed lncRNAs were dysregulated in 1α,25(OH)2D3-treated SKOV3 cells, in which 381 lncRNAs were upregulated and 225 lncRNAs were downregulated.
For DE-lncRNAs, we predicted their functions by clustering correlated mRNA and corresponding signaling pathways. Several DE-lncRNAs are closely associated with tumor development and progression, notably the Ras, MAPK, TGF-β, Rap1, PI3K-Akt, regulating pluripotency stem cells, and Hippo signaling pathways. It has been widely reported that 1α,25(OH)2D3 could inhibit TGF-β-induced EMT (19–26, 31–46) due to the fact that 1α,25(OH)2D3 inhibits β-catenin transcriptional activity by promoting VDR binding to β-catenin and inducing E-cadherin expression. Zerr et al. demonstrated that VDR was a negative regulator of the TGF-β/SMAD signaling pathway (47). 1α,25(OH)2D3 has inhibitory effect on cancer development through regulating MAPK and PI3K−Akt signaling pathways (21–23). In addition, there are also many lncRNAs that are predicted to be associated with the classic function of vitamin D by regulating glutathione metabolism, osteoclast differentiation, and cholesterol metabolism in this study. In a word, 1α,25(OH)2D3 dysregulated lncRNAs are likely to participate in some predicted tumor associated progression or some classical function of vitamin D. These associations are supposed to provide new orientations to explore the role of lncRNAs in tumor therapy and to improve vitamin D deficiency-related diseases.
The co-expression/regulatory networks of lncRNAs-mRNAs indicated that “TGF-β signaling pathway”, “epithelial cell proliferation”, and “Hippo signaling pathway” were significantly involved in 1α,25(OH)2D3 treated cancer cells. Up to date, there are lots of reports about how coding genes or non-coding genes to regulate EMT progress or EMT associated genes and transcription factors (48–51). Moreover, 1α,25(OH)2D3 was reported to have the effect on inhibiting the progression of EMT (31). Our results also showed that EMT signaling pathway was significantly activated in 1α,25(OH)2D3 treated ovarian cancer cells. It is plausible that these lncRNAs could mediate the EMT process by vitamin D signaling pathway, which supports our hypothesis that 1α,25(OH)2D3 has inhibitory effects on ovarian cancer cells by regulating lncRNA expression patterns.
In the present study, the most upregulated lncRNA was lncBCAS1-4_1, which has the closest relationship with the mRNA transcript of CYP24A1, because their 75% transcripts are the same. CYP24A1 is the gene coding the metabolic enzyme of 1α,25(OH)2D3, resulting in the loss of physiological activity by 1α,25(OH)2D3 (34). In vitro and in vivo studies also showed that CYP24A1 has been deemed as a candidate oncogene in many cancers, such as ovarian cancer (35), colorectal cancer (36, 37), prostate cancer (38), lung cancer (39), breast cancer (40), thyroid cancer (41), and so on. Moreover, a recent study showed that the upregulation of CYP24A1 and PFDN4 as well as nearby lncRNAs may be used as the potential diagnostic biomarker in colorectal cancer (52). Interestingly, it has been reported that mice with CYP24A1 knockout exhibited a fourfold reduction in thyroid tumor growth compared with wild-type CYP24A1 mice. They found that this phenotype was associated with the repression of the MAPK, PI3K/Akt, and TGFβ signaling pathways, and a loss of EMT in CYP24A1 knockout cells was also associated with the downregulation of genes involved in EMT, tumor invasion, and metastasis (53). Furthermore, functional analysis revealed that the TGF-β pathway was associated with lncBCAS1-4_1. Based on the 75% similarity with CYP24A1 and the relationship between CYP24A1 and EMT, as well as the key role of TGF-β in the EMT process, we focused on the link of lncBCAS1-4_1 and EMT. For the lncBCAS1-4_1 loss/gain cell model, the oncogenic role of lncBCAS1-4_1 was validated in vitro, and the overexpression of lncBCAS1-4_1 significantly resisted the antitumor effect of 1α,25(OH)2D3, which was associated with upregulated ZEB1. Thus, it was worthy to reveal the molecular mechanism of EMT-related lncRNAs in cancer and to demonstrate that lncBCAS1-4_1 can be a potential therapeutic target for patients.
Additionally, we also found that the most downregulated lncRNA (lnc-RWDD4-5_1) and IGFBP3 mRNAs were negatively correlated. After treatment with 1α,25(OH)2D3, the expression of lnc-RWDD4-5_1 was dramatically decreased, while that of IGFBP3 was increased (2.2-fold change). The most hub gene in the PPI network was IGF1, which can bind to IGFBP3. IGF1 and its binding proteins can promote cellular proliferation and inhibit apoptosis. In vitro studies showed that IGF1 increased ovarian cell growth and invasive potential (42). It is well documented that high IGF1 levels are significantly associated with early-stage cancer, nonserous histology, and optimal cytoreduction in epithelial ovarian cancers (43–45). Considerably, it is noteworthy that the most downregulated lncRNA (lnc-RWDD4-5_1) has a potential relationship with the hub gene (IGF1). However, the potential molecular mechanisms needed to be further verified.
There are also a couple of limitations to this study. Firstly, although the SKOV3 cell line is a useful model of ovarian cancer cells, it could not be used to predict the performance of 1α,25(OH)2D3 in actual tumors. And the action of 1α,25(OH)2D3 refers to different sets of genes in different cell lines (54–56). Secondly, the expressions of lncRNAs and mRNAs were analyzed by ovarian cancer cells, and further testing of these in the tumor tissues of patients is needed. Thirdly, the relationships among noncoding RNAs, mRNAs, and proteins need to be further investigated using bioinformatic prediction to understand their full function. Nevertheless, this is the first study of lncRNA expression patterns regulated by 1α,25(OH)2D3 in an ovarian cancer cell model, providing important basic data to support future work.
Conclusions
In summary, we identified the 606 DE lncRNAs and 102 DE mRNAs in 1α,25(OH)2D3-treated ovarian cancer cells, which were mainly enriched in the cancer-related and vitamin D-related pathway. Moreover, by the lncBCAS1-4_1-mRNA core network, the EMT signal was identified, indicating the linkage of lncBCAS1-4_1 between EMT and vitamin D signaling. Furthermore, we established the lncBCAS1-4_1 loss/gain cell model and found that lncBCAS1-4_1 could abolish the antitumor effect of 1α,25(OH)2D3, which was associated with upregulating ZEB1. These data provide new evidence that lncRNAs can serve as targets for the antitumor effect of 1α,25(OH)2D3.
Data Availability Statement
The datasets presented in this study can be found in online repositories. The names of the repository/repositories and accession number(s) can be found below: GEO Database and accession number GSE17363 https://www.ncbi.nlm.nih.gov/geo/query/acc.cgi?acc=GSE173633.
Author Contributions
Conceptualization, HP and BL. Methodology, YX. Software, PW. Validation, YX, FJ, and JY. Formal analysis, PW and YX. Investigation, YX. Data curation, YX and JY. Writing—original draft preparation, YX, JY, HD, and FJ. Writing—review and editing, ZZ, HP, and BL. supervision, BYL. Project administration, ZZ, HP, and BL. Funding acquisition, FJ and BL. All authors contributed to the article and approved the submitted version.
Funding
This research was supported by the National Natural Science Foundation of China (81872622 and 81703209) and a subproject of the National Key Research and Development Project (2018YFC0115703), and a project funded by the Priority Academic Program Development of Jiangsu Higher Education Institutions (PAPD).
Conflict of Interest
The authors declare that the research was conducted in the absence of any commercial or financial relationships that could be construed as a potential conflict of interest.
Publisher’s Note
All claims expressed in this article are solely those of the authors and do not necessarily represent those of their affiliated organizations, or those of the publisher, the editors and the reviewers. Any product that may be evaluated in this article, or claim that may be made by its manufacturer, is not guaranteed or endorsed by the publisher.
Acknowledgments
The authors wish to thank professional colleague, Dr. Jiafu Li, for manuscript comments.
Supplementary Material
The Supplementary Material for this article can be found online at: https://www.frontiersin.org/articles/10.3389/fonc.2021.691500/full#supplementary-material
References
1. Sung PL, Chang YH, Chao KC, Chuang CM. Global Distribution Pattern of Histological Subtypes of Epithelial Ovarian Cancer: A Database Analysis and Systematic Review. Gynecol Oncol (2014) 133(2):147–54. doi: 10.1016/j.ygyno.2014.02.016
2. Allemani C, Weir HK, Carreira H, Harewood R, Spika D, Wang XS, et al. Global Surveillance of Cancer Survival 1995-2009: Analysis of Individual Data for 25,676,887 Patients From 279 Population-Based Registries in 67 Countries (CONCORD-2). Lancet (9972) 2015:977–1010:385. doi: 10.1016/S0140-6736(14)62038-9
3. Bhan A, Soleimani M, Mandal SS. Long Noncoding RNA and Cancer: A New Paradigm. Cancer Res (2017) 77(15):3965–81. doi: 10.1158/0008-5472.CAN-16-2634
4. Yao RW, Wang Y, Chen LL. Cellular Functions of Long Noncoding RNAs. Nat Cell Biol (2019) 21(5):542–51. doi: 10.1038/s41556-019-0311-8
5. Lin C, Yang L. Long Noncoding RNA in Cancer: Wiring Signaling Circuitry. Trends Cell Biol (2018) 28(4):287–301. doi: 10.1016/j.tcb.2017.11.008
6. Xu J, Wu J, Fu C, Teng F, Liu S, Dai C, et al. Multidrug Resistant lncRNA Profile in Chemotherapeutic Sensitive and Resistant Ovarian Cancer Cells. J Cell Physiol (2018) 233(6):5034–43. doi: 10.1002/jcp.26369
7. Liu X, Dai C, Jia G, Xu S, Fu Z, Xu J, et al. Microarray Analysis Reveals Differentially Expressed lncRNAs in Benign Epithelial Ovarian Cysts and Normal Ovaries. Oncol Rep (2017) 38(2):799–808. doi: 10.3892/or.2017.5741
8. Cui D, Ma J, Liu Y, Lin K, Jiang X, Qu Y, et al. Analysis of Long non-Coding RNA Expression Profiles Using RNA Sequencing in Ovarian Endometriosis. Gene (2018) 673:140–8. doi: 10.1016/j.gene.2018.06.046
9. Lu YM, Wang Y, Liu SQ, Zhou MY, Guo YR. Profile and Validation of Dysregulated Long Noncoding RNAs and mRNAs in Ovarian Cancer. Oncol Rep (2018) 40(5):2964–76. doi: 10.3892/or.2018.6654
10. Wang H, Fu Z, Dai C, Cao J, Liu X, Xu J, et al. LncRNAs Expression Profiling in Normal Ovary, Benign Ovarian Cyst and Malignant Epithelial Ovarian Cancer. Sci Rep (2016) 6:38983. doi: 10.1038/srep38983
11. Hosseini ES, Meryet-Figuiere M, Sabzalipoor H, Kashani HH, Nikzad H, Asemi Z, et al. Dysregulated Expression of Long Noncoding RNAs in Gynecologic Cancers. Mol Cancer (2017) 16(1):107. doi: 10.1186/s12943-017-0671-2
12. Zhou M, Sun Y, Sun Y, Xu W, Zhang Z, Zhao H, et al. Comprehensive Analysis of lncRNA Expression Profiles Reveals a Novel lncRNA Signature to Discriminate Nonequivalent Outcomes in Patients With Ovarian Cancer. Oncotarget (2016) 7(22):32433–48. doi: 10.18632/oncotarget.8653
13. Guo L, Peng Y, Meng Y, Liu Y, Yang S, Jin H, et al. Expression Profiles Analysis Reveals an Integrated miRNA-lncRNA Signature to Predict Survival in Ovarian Cancer Patients With Wild-Type BRCA1/2. Oncotarget (2017) 8(40):68483–92. doi: 10.18632/oncotarget.19590
14. Ding Y, Yang DZ, Zhai YN, Xue K, Xu F, Gu XY, et al. Microarray Expression Profiling of Long non-Coding RNAs in Epithelial Ovarian Cancer. Oncol Lett (2017) 14(2):2523–30. doi: 10.3892/ol.2017.6448
15. Liu R, Zeng Y, Zhou CF, Wang Y, Li X, Liu ZQ, et al. Long Noncoding RNA Expression Signature to Predict Platinum-Based Chemotherapeutic Sensitivity of Ovarian Cancer Patients. Sci Rep (2017) 7(1):18. doi: 10.1038/s41598-017-00050-w
16. Gao C, Zhao D, Zhao Q, Dong D, Mu L, Zhao X, et al. Microarray Profiling and Co-Expression Network Analysis of lncRNAs and mRNAs in Ovarian Cancer. Cell Death Discovery (2019) 5:93. doi: 10.1038/s41420-019-0173-7
17. Shen L, Liu W, Cui J, Li J, Li C. Analysis of Long Non-Coding RNA Expression Profiles in Ovarian Cancer. Oncol Lett (2017) 14(2):1526–30. doi: 10.3892/ol.2017.6283
18. Lou Y, Jiang H, Cui Z, Wang X, Wang L, Han Y, et al. Gene Microarray Analysis of lncRNA and mRNA Expression Profiles in Patients With Highgrade Ovarian Serous Cancer. Int J Mol Med (2018) 42(1):91–104. doi: 10.3892/ijmm.2018.3588
19. Deeb KK, Trump DL, Johnson CS. Vitamin D Signalling Pathways in Cancer: Potential for Anticancer Therapeutics. Nat Rev Cancer (2007) 7(9):684–700. doi: 10.1038/nrc2196
20. Feldman D, Krishnan AV, Swami S, Giovannucci E, Feldman BJ. The Role of Vitamin D in Reducing Cancer Risk and Progression. Nat Rev Cancer (2014) 14(5):342–57. doi: 10.1038/nrc3691
21. Hmama Z, Nandan D, Sly L, Knutson KL, Herrera-Velit P, Reiner NE. 1alpha,25-Dihydroxyvitamin D(3)-Induced Myeloid Cell Differentiation Is Regulated by a Vitamin D Receptor-Phosphatidylinositol 3-Kinase Signaling Complex. J Exp Med (1999) 190(11):1583–94. doi: 10.1084/jem.190.11.1583
22. Meeker S, Seamons A, Paik J, Treuting PM, Brabb T, Grady WM, et al. Increased Dietary Vitamin D Suppresses MAPK Signaling, Colitis, and Colon Cancer. Cancer Res (2014) 74(16):4398–408. doi: 10.1158/0008-5472.CAN-13-2820
23. Zhang X, Zanello LP. Vitamin D Receptor-Dependent 1 Alpha,25(OH)2 Vitamin D3-Induced Anti-Apoptotic PI3K/AKT Signaling in Osteoblasts. J Bone Miner Res (2008) 23(8):1238–48. doi: 10.1359/jbmr.080326
24. Jiang YJ, Bikle DD. LncRNA Profiling Reveals New Mechanism for VDR Protection Against Skin Cancer Formation. J Steroid Biochem Mol Biol (2014) 144 Pt A:87–90. doi: 10.1016/j.jsbmb.2013.11.018
25. Kholghi Oskooei V, Ghafouri-Fard S, Omrani Mir D. A Combined Bioinformatics and Literature Based Approach for Identification of Long Non-Coding RNAs That Modulate Vitamin D Receptor Signaling in Breast Cancer. Klin Onkol (2018) 31(4):264–9. doi: 10.14735/amko2018264
26. Kholghi Oskooei V, Geranpayeh L, Omrani MD, Ghafouri-Fard S. Assessment of Functional Variants and Expression of Long Noncoding RNAs in Vitamin D Receptor Signaling in Breast Cancer. Cancer Manag Res (2018) 10:3451–62. doi: 10.2147/CMAR.S174244
27. Kuleshov MV, Jones MR, Rouillard AD, Fernandez NF, Duan Q, Wang Z, et al. Enrichr: A Comprehensive Gene Set Enrichment Analysis Web Server 2016 Update. Nucleic Acids Res (2016) 44(W1):W90–7. doi: 10.1093/nar/gkw377
28. Ciulei G, Orasan OH, Coste SC, Cozma A, Negrean V, Procopciuc LM. Vitamin D and the Insulin-Like Growth Factor System: Implications for Colorectal Neoplasia. Eur J Clin Invest (2020) 50(9):e13265. doi: 10.1111/eci.13265
29. Shirvani-Farsani Z, Behmanesh M, Mohammadi SM, Naser A. Vitamin D Levels in Multiple Sclerosis Patients: Association With TGF-Beta2, TGF-betaRI, and TGF-betaRII Expression. Life Sci (2015) 134:63–7. doi: 10.1016/j.lfs.2015.05.017
30. Gisbert-Ferrandiz L, Cosin-Roger J, Hernandez C, Macias-Ceja DC, Ortiz-Masia D, Salvador P, et al. The Vitamin D Receptor Taq I Polymorphism Is Associated With Reduced VDR and Increased PDIA3 Protein Levels in Human Intestinal Fibroblasts. J Steroid Biochem Mol Biol (2020) 202:105720. doi: 10.1016/j.jsbmb.2020.105720
31. Hou YF, Gao SH, Wang P, Zhang HM, Liu LZ, Ye MX, et al. 1alpha,25(OH)(2)D(3) Suppresses the Migration of Ovarian Cancer SKOV-3 Cells Through the Inhibition of Epithelial-Mesenchymal Transition. Int J Mol Sci (2016) 17(8). doi: 10.3390/ijms17081285
32. Huang J, Yang G, Huang Y, Zhang S. Inhibitory Effects of 1,25(OH)2D3 on the Proliferation of Hepatocellular Carcinoma Cells Through the Downregulation of HDAC2. Oncol Rep (2017) 38(3):1845–50. doi: 10.3892/or.2017.5848
33. Schwartz Z, Pedrozo HA, Sylvia VL, Gomez R, Dean DD, Boyan BD. 1alpha,25-(OH)2D3 Regulates 25-Hydroxyvitamin D3 24R-Hydroxylase Activity in Growth Zone Costochondral Growth Plate Chondrocytes via Protein Kinase C. Calcif Tissue Int (2001) 69(6):365–72. doi: 10.1007/s00223-001-1009-y
34. Luo W, Johnson CS, Trump DL. Vitamin D Signaling Modulators in Cancer Therapy. Vitam Horm (2016) 100:433–72. doi: 10.1016/bs.vh.2015.11.004
35. Kloss M, Fischer D, Thill M, Friedrich M, Cordes T, Salehin D, et al. Calcidiol and Calcitriol Regulate Vitamin D Metabolizing Enzymes in Cervical and Ovarian Cancer Cells. Anticancer Res (2010) 30(11):4429–34.
36. Hobaus J, Tennakoon S, Heffeter P, Groeschel C, Aggarwal A, Hummel DM, et al. Impact of CYP24A1 Overexpression on Growth of Colorectal Tumour Xenografts in Mice Fed With Vitamin D and Soy. Int J Cancer (2016) 138(2):440–50. doi: 10.1002/ijc.29717
37. Horvath HC, Lakatos P, Kosa JP, Bacsi K, Borka K, Bises G, et al. The Candidate Oncogene CYP24A1: A Potential Biomarker for Colorectal Tumorigenesis. J Histochem Cytochem (2010) 58(3):277–85. doi: 10.1369/jhc.2009.954339
38. Luo W, Yu WD, Ma Y, Chernov M, Trump DL, Johnson CS. Inhibition of Protein Kinase CK2 Reduces Cyp24a1 Expression and Enhances 1,25-Dihydroxyvitamin D(3) Antitumor Activity in Human Prostate Cancer Cells. Cancer Res (2013) 73(7):2289–97. doi: 10.1158/0008-5472.CAN-12-4119
39. Shiratsuchi H, Wang Z, Chen G, Ray P, Lin J, Zhang Z, et al. Oncogenic Potential of CYP24A1 in Lung Adenocarcinoma. J Thorac Oncol (2017) 12(2):269–80. doi: 10.1016/j.jtho.2016.10.010
40. Osanai M, Lee GH. CYP24A1-Induced Vitamin D Insufficiency Promotes Breast Cancer Growth. Oncol Rep (2016) 36(5):2755–62. doi: 10.3892/or.2016.5072
41. Hu N, Zhang H. CYP24A1 Depletion Facilitates the Antitumor Effect of Vitamin D3 on Thyroid Cancer Cells. Exp Ther Med (2018) 16(4):2821–30. doi: 10.3892/etm.2018.6536
42. Khandwala HM, McCutcheon IE, Flyvbjerg A, Friend KE. The Effects of Insulin-Like Growth Factors on Tumorigenesis and Neoplastic Growth. Endocr Rev (2000) 21(3):215–44. doi: 10.1210/edrv.21.3.0399
43. Terry KL, Tworoger SS, Gates MA, Cramer DW, Hankinson SE. Common Genetic Variation in IGF1, IGFBP1 and IGFBP3 and Ovarian Cancer Risk. Carcinogenesis (2009) 30(12):2042–6. doi: 10.1093/carcin/bgp257
44. Peeters PH, Lukanova A, Allen N, Berrino F, Key T, Dossus L, et al. Its Major Binding Protein (IGFBP-3) and Epithelial Ovarian Cancer Risk: The European Prospective Investigation Into Cancer and Nutrition (EPIC). Endocr Relat Cancer (2007) 14(1):81–90. doi: 10.1677/erc.1.01264
45. Huang YF, Cheng WF, Wu YP, Cheng YM, Hsu KF, Chou CY. Circulating IGF System and Treatment Outcome in Epithelial Ovarian Cancer. Endocr Relat Cancer (2014) 21(2):217–29. doi: 10.1530/ERC-13-0274
46. Pendas-Franco N, Aguilera O, Pereira F, Gonzalez-Sancho JM, Munoz A. Vitamin D and Wnt/beta-Catenin Pathway in Colon Cancer: Role and Regulation of DICKKOPF Genes. Anticancer Res (2008) 28(5A):2613–23.
47. Zerr P, Vollath S, Palumbo-Zerr K, Tomcik M, Huang J, Distler A, et al. Vitamin D Receptor Regulates TGF-Beta Signalling in Systemic Sclerosis. Ann Rheum Dis (2015) 74(3):e20. doi: 10.1136/annrheumdis-2013-204378
48. Liu Y, Xue M, Du S, Feng W, Zhang K, Zhang L, et al. Competitive Endogenous RNA is an Intrinsic Component of EMT Regulatory Circuits and Modulates EMT. Nat Commun (2019) 10(1):1637. doi: 10.1038/s41467-019-13370-4
49. Liang Y, Zhang CD, Zhang C, Dai DQ. DLX6-AS1/miR-204-5p/OCT1 Positive Feedback Loop Promotes Tumor Progression and Epithelial-Mesenchymal Transition in Gastric Cancer. Gastric Cancer (2020) 23(2):212–27. doi: 10.1007/s10120-019-01002-1
50. Freihen V, Ronsch K, Mastroianni J, Frey P, Rose K, Boerries M, et al. SNAIL1 Employs Beta-Catenin-LEF1 Complexes to Control Colorectal Cancer Cell Invasion and Proliferation. Int J Cancer (2020) 146(8):2229–42. doi: 10.1002/ijc.32644
51. Dhamija S, Diederichs S. From Junk to Master Regulators of Invasion: lncRNA Functions in Migration, EMT and Metastasis. Int J Cancer (2016) 139(2):269–80. doi: 10.1002/ijc.30039
52. Sadeghi H, Nazemalhosseini-Mojarad E, Sahebi U, Fazeli E, Azizi-Tabesh G, Yassaee VR, et al. Novel Long Noncoding RNAs Upregulation may Have Synergistic Effects on the CYP24A1 and PFDN4 Biomarker Role in Human Colorectal Cancer. J Cell Physiol (2021) 236(3):2051–7. doi: 10.1002/jcp.29992
53. Zou M, Baitei EY, BinEssa HA, Al-Mohanna FA, Parhar RS, St-Arnaud R, et al. Cyp24a1 Attenuation Limits Progression of Braf(V600E) -Induced Papillary Thyroid Cancer Cells and Sensitizes Them to BRAF(V600E) Inhibitor Plx4720. Cancer Res (2017) 77(8):2161–72. doi: 10.1158/0008-5472.CAN-16-2066
54. Lin R, Nagai Y, Sladek R, Bastien Y, Ho J, Petrecca K, et al. Expression Profiling in Squamous Carcinoma Cells Reveals Pleiotropic Effects of Vitamin D3 Analog EB1089 Signaling on Cell Proliferation, Differentiation, and Immune System Regulation. Mol Endocrinol (2002) 16(6):1243–56. doi: 10.1210/mend.16.6.0874
55. Krishnan AV, Shinghal R, Raghavachari N, Brooks JD, Peehl DM, Feldman D. Analysis of Vitamin D-Regulated Gene Expression in LNCaP Human Prostate Cancer Cells Using cDNA Microarrays. Prostate (2004) 59(3):243–51. doi: 10.1002/pros.20006
Keywords: vitamin D, long noncoding RNAs, transcriptome, lncRNA-mRNA network, EMT, lncBCAS1-4_1
Citation: Xue Y, Wang P, Jiang F, Yu J, Ding H, Zhang Z, Pei H and Li B (2021) A Newly Identified lncBCAS1-4_1 Associated With Vitamin D Signaling and EMT in Ovarian Cancer Cells. Front. Oncol. 11:691500. doi: 10.3389/fonc.2021.691500
Received: 06 April 2021; Accepted: 14 July 2021;
Published: 05 August 2021.
Edited by:
Feng He, Shanghai University of Traditional Chinese Medicine, ChinaReviewed by:
Shanshan Li, University of California, San Francisco, United StatesXiaolei Liu, University of Pennsylvania, United States
Lifeng Yuan, Harvard Medical School, United States
Cai Chen, Merck, United States
Copyright © 2021 Xue, Wang, Jiang, Yu, Ding, Zhang, Pei and Li. This is an open-access article distributed under the terms of the Creative Commons Attribution License (CC BY). The use, distribution or reproduction in other forums is permitted, provided the original author(s) and the copyright owner(s) are credited and that the original publication in this journal is cited, in accordance with accepted academic practice. No use, distribution or reproduction is permitted which does not comply with these terms.
*Correspondence: Hailong Pei, aGxwZWlAc3VkYS5lZHUuY24=; Bingyan Li, YmluZ3lhbmxpQHN1ZGEuZWR1LmNu
†These authors have contributed equally to this work