 Junqing Wu1,2,3,4†
 Yue Huang1,2,3,4†Chengxuan Yu5†Xia Li1,2,3,4Limengmeng Wang1,2,3,4Jundong Hong6Daochao Lin7Xiaoping Han1,8,9Guoji Guo1,2,3,4,8,9,10*Tianye Hu7*He Huang1,2,3,4*
- 1Bone Marrow Transplantation Center, The First Affiliated Hospital, Zhejiang University School of Medicine, Hangzhou, China
- 2Institute of Hematology, Zhejiang University, Hangzhou, China
- 3Zhejiang Province Engineering Laboratory for Stem Cell and Immunity Therapy, Hangzhou, China
- 4Liangzhu Laboratory, Zhejiang University Medical Center, Hangzhou, China
- 5Department of Colorectal Surgery and Oncology, Key Laboratory of Cancer Prevention and Intervention, Ministry of Education, The Second Affiliated Hospital, Zhejiang University School of Medicine, Hangzhou, China
- 6Zhejiang University City College, Hangzhou, China
- 7Department of Orthopaedic Surgery, Shulan (Hangzhou) Hospital, Zhejiang Shuren University Shulan International Medical College, Hangzhou, China
- 8School of Basic Medical Sciences, Zhejiang University School of Medicine, Hangzhou, China
- 9Center for Stem Cell and Regenerative Medicine, Zhejiang University School of Medicine, Hangzhou, China
- 10Zhejiang Provincial Key Lab for Tissue Engineering and Regenerative Medicine, Dr. Li Dak Sum & Yip Yio Chin Center for Stem Cell and Regenerative Medicine, Hangzhou, China
Enchondroma (EC) is a common benign bone tumor. It has the risk of malignant transformation to Chondrosarcoma (CS). However, the underlying mechanism is unclear. The gene expression profile of EC and CS was obtained from Gene Expression Omnibus (GEO) database. The differentially expressed genes (DEGs) were identified using GEO2R. We conducted the enrichment analysis and constructed the gene interaction network using the DEGs. We found that the epithelial-mesenchymal transition (EMT) and the VEGFA-VEGF2R signaling pathway were more active in CS. The CD8+ T cell immunity was enhanced in CS I. We believed that four genes (MFAP2, GOLM1, STMN1, and HN1) were poor predictors of prognosis, while two genes (CAB39L and GAB2) indicated a good prognosis. We have revealed the mechanism in the tumor progression and identified the key genes that predicted the prognosis. This study provided new ideas for the diagnosis and treatment of EC and CS.
Introduction
EC is one of the most common benign bone tumors occurring in the medullary space of bone (1). Ollier disease and Maffucci syndrome are subtypes of EC (2). CS is the second most common malignant bone tumor after osteosarcoma, accounting for 20% of the bone sarcomas (3). CS is divided into three grades based on histopathology. The risk of malignant transformation from EC to CS, especially in the Ollier disease and Maffucci syndrome, is as high as 50% (4). Therefore, it is important to understand the underlying mechanism of the malignant transformation.
Though disrupted signaling pathways play roles in both EC and CS, CS has its own unique characteristics (4). However, the key biomarkers involved in the metastasis are still unknown.
High-throughput gene detection technologies are promising tools with a wide range of clinical applications (5). Integrating and analyzing the data in the public database provides an opportunity to reveal the key regulators.
In this study, we used the data GSE30835 from GEO. We identified the DEGs among normal, EC, and CS samples. We performed the gene enrichment analysis to explore the key regulatory pathways. Finally, we proposed some markers that predicted the metastasis. These results may help diagnosis and treatment.
Materials and Methods
Microarray Data
The gene expression profile GSE80835 was obtained from the GEO database. The microarray data was established on the GPL6884 platform (Illumina HumanWG-6 v3.0 expression bead chip). There were 6 normal controls (growth plate and cartilage), 7 EC samples, and 14 CS samples. In addition, two other gene expression profiles, GSE17679 and GSE21122, were obtained. GSE17679 contained 64 Ewing sarcoma samples and 18 normal controls. GSE21122 contained 26 leiomyosarcoma samples and 9 normal controls.
DEGs Identification
GEO2R was used to identify DEGs. When comparing normal control and patient samples, genes with p < 0.01 and ∣logFC∣>1 were considered DEGs. In the comparison between EC and CS samples, genes with p < 0.05 were considered DEGs Graphpad Prism was used to display the volcano plot, and R package “pheatmap” was used to display the heatmap.
Metascape Enrichment Analysis
Enrichment analysis was performed by using the online tool called Metascape (http://metascape.org). The enrichment terms included GO biological processes, Biocarta gene sets, Hallmark gene sets, Reactome gene sets, KEGG pathway, Wikipathways, and Canonical pathways.
Protein-Protein Interaction Network
The Protein-Protein Interaction (PPI) network was constructed using the online tool called STRING (http://string-db.org). We selected the top 50 DEGs in patient samples. Among the 50 upregulated genes, 46 were protein-coding genes, and 36 interacted with each other.
Gene Set Enrichment Analysis
The Gene Set Enrichment Analysis (GSEA) tool was downloaded from the Broad Institute (http://software.broadinstitute.org/gsea). The analysis showed the differences between EC and CS, with statistical significance determined by 1,000 gene set permutations. The enrichment maps with the enrichment scores were generated for visualization of the results.
Weighted Correlation Network Analysis
The Weighted Gene Co-expression Network Analysis (WGCNA) was used to verify the gene modules in EC and CS. The most relevant modules were selected for further analysis. Cytoscape was applied to establish the network using the top-weighted genes. Metascape enrichment analysis was performed using the genes involved in the modules with the threshold of 0.02 in WGCNA.
Survival Analysis
We chose the sarcoma datasets in GEPIA (http://gepia.cancer-pku.cn/index.html), which used TCGA data to explore the prognostic potential of certain genes. The project ID of sarcoma datasets in GEPIA including TCGA-SARC, GENIE-MSK, GENIE-DFCI and CMI-ASC. PrognoScan (http://dna00.bio.kyutech.ac.jp/PrognoScan) was used to verify the relation between the gene expression levels and the distant recurrence-free survival using sarcoma dataset GSE30929. The p <0.05 was considered statistically significant.
Results
DEGs Reveal the Characteristics of EC and CS
To explore the DEGs between patients and healthy controls, GEO2R was performed with the criterion of p < 0.01 and ∣logFC∣>1. We found 89 upregulated genes and 52 downregulated genes (Figure 1A and Supplementary Table 1). We applied Metascape enrichment analysis to identify the altered biological functions. Figure 1B and Supplementary Table 2 show the enriched terms of the upregulated genes. We found that these genes were most related to EMT, collagen formation, and the VEGFA-VEGFR2 signaling pathway. EMT plays a central role in tumor progression, and the VEGFA-VEGFR2 pathway indicates tumor angiogenesis (6, 7). Collagen formation is the basic feature of solid tumors (8). The activation of EMT and angiogenesis were also found in other sarcomas (Supplementary Figure 1 and Supplementary Table 3).
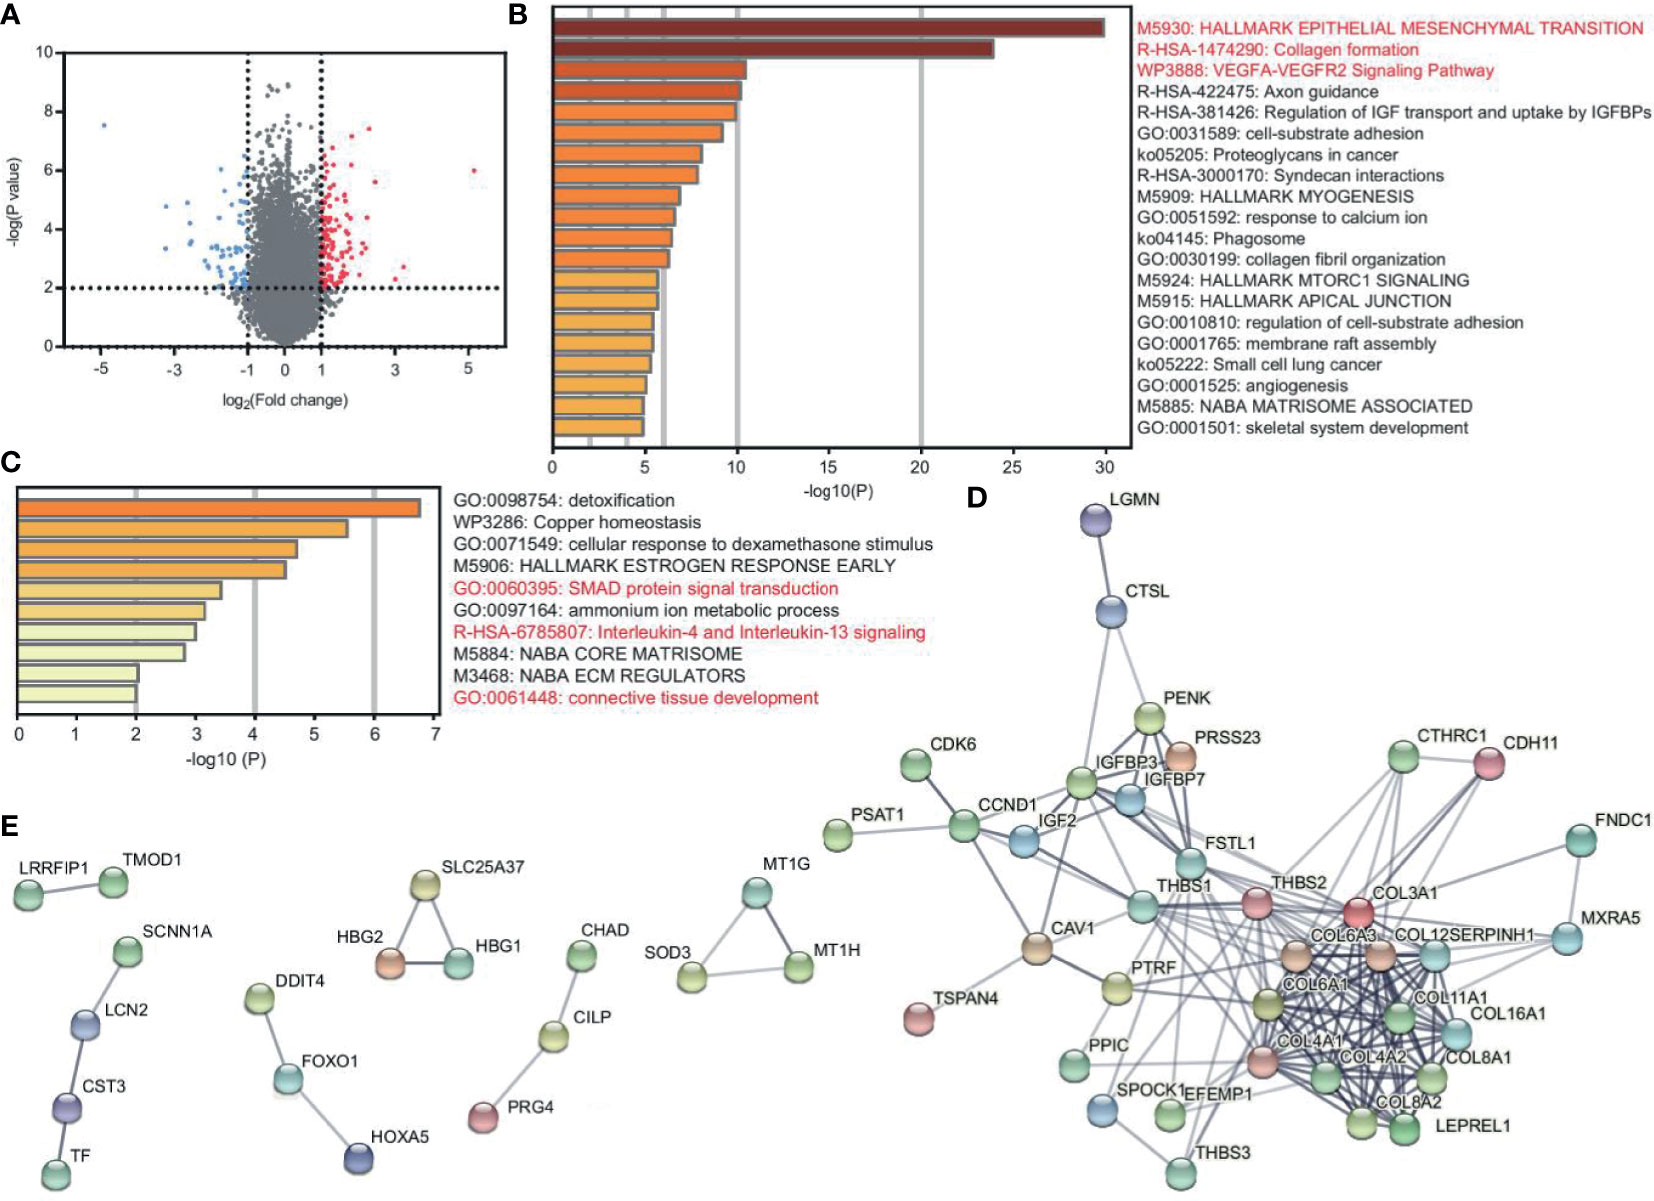
Figure 1 DEGs reveal the characteristics of EC and CS. (A) Volcano plot of DEGs between patients (EC and CS) and normal controls. Red and blue dots represent the highly and lowly expressed genes in patients, respectively. (B, C) Metascape enrichment analysis for viewing the enrichment terms of upregulated (B) and downregulated (C) genes in patients. The color shows the p value. (D, E) PPI network of the upregulated (D) and downregulated (E) protein-coding genes in patients.
We used STRING to construct the PPI network to confirm the relationship between genes. Among the top 50 upregulated genes, there are 46 protein-coding genes, of which 36 are closely related (Figure 1D). In the network, collagen genes, such as COL16A1, COL6A3, and COL8A2 have interacted. They contribute to both EMT and collagen formation. In addition, FNDC1 and FSTL1 are also EMT-related genes. CAV1 is one of the core genes in the VEGFA-VEGFR2 pathway and collagen formation (Supplementary Table 2).
The downregulated genes are enriched in the terms of SMAD protein signal transduction, IL-4 and IL-13 signaling, and connective tissue development (Figure 1C and Supplementary Table 2). Among the top 50 downregulated genes, there are 49 protein-coding genes. However, the connections are not closed in the PPI network. Only 18 genes have certain correlations (Figure 1E).
Together, EMT, tumor angiogenesis, and collagen formation are the key characteristics of EC and CS.
Immune Response Is More Active in CS Compared With EC
Due to the risk of malignant transformation from EC to CS, we next explored the gene expression patterns in CS compared with EC. We used GEO2R to analyze the top 100 upregulated and downregulated genes in CS (Supplementary Table 4). Among the top 15 upregulated genes, TGFBI, IGFBP4, and DDIT4 are the top three upregulated genes in CS (Figure 2A). They promote tumor growth and metastasis (9–11). The upregulated genes are enriched in EMT and the VEGFA-VEGFR2 signaling pathway, which are important terms in Figure 1B (Figure 2B). However, the key genes are different. For example, the EMT-related genes TGFBI and BASP1 are more active in CS (Supplementary Table 5).
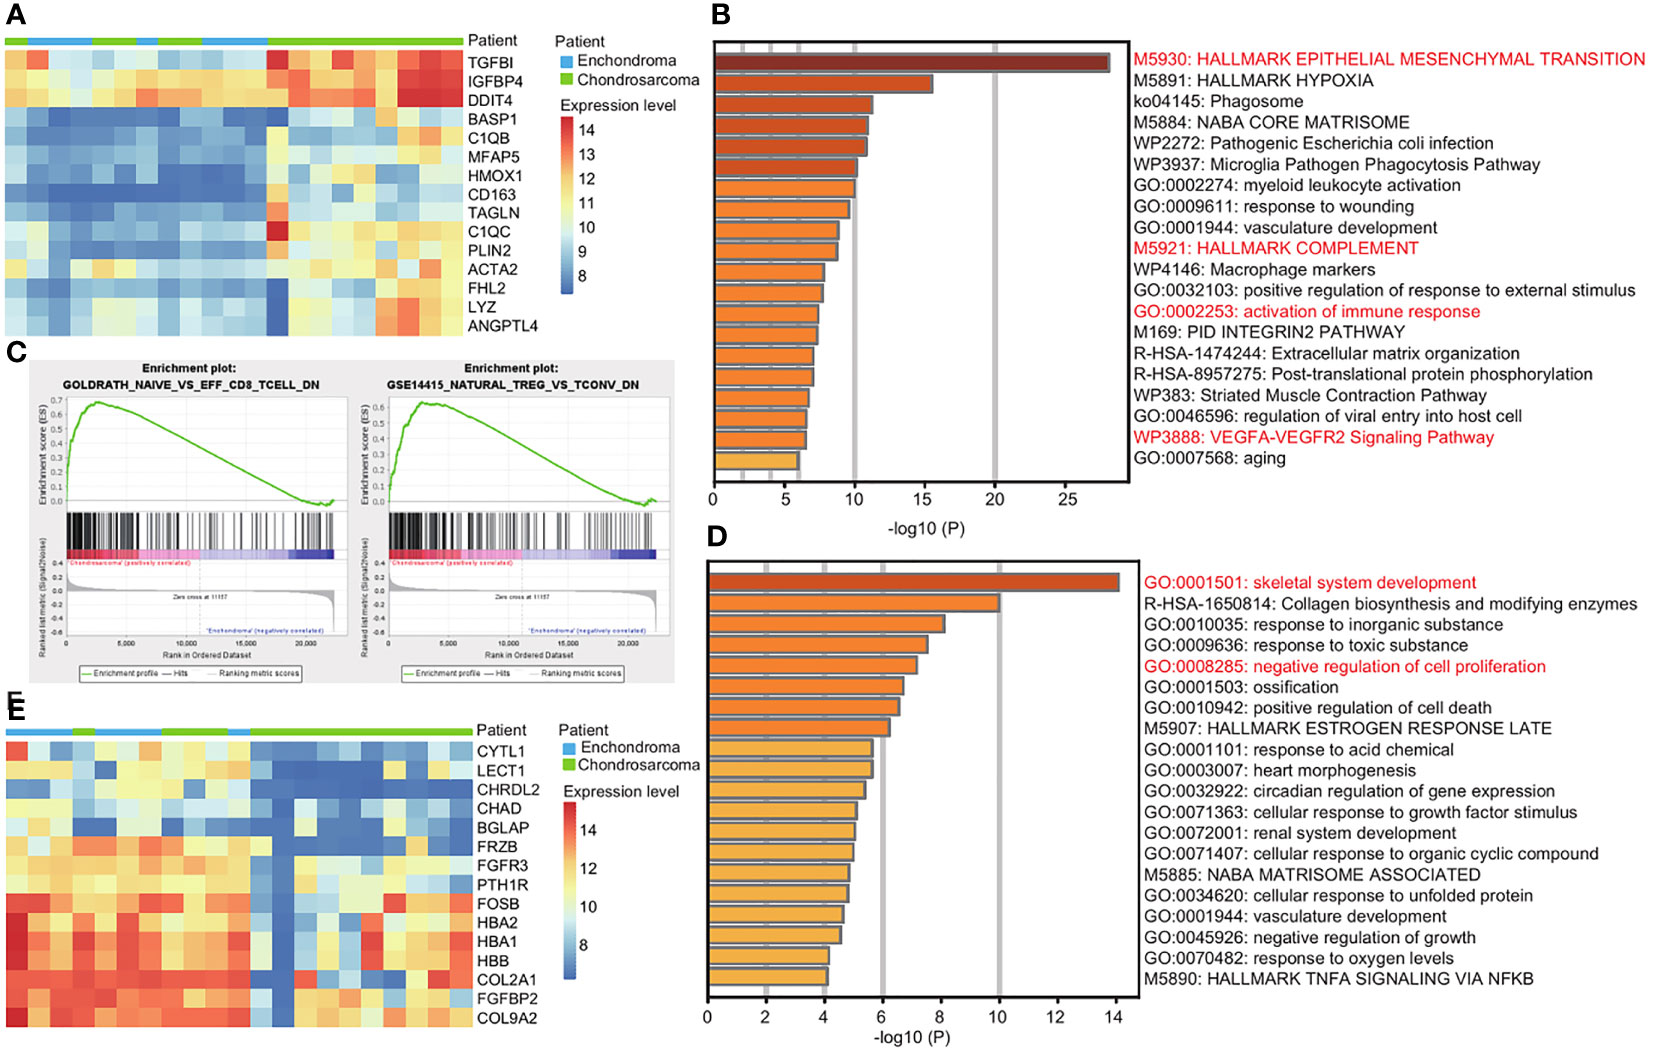
Figure 2 Immune response is more active in CS compared with EC. (A) Heatmap of the top 15 upregulated genes in CS compared with EC. Red and blue represent high and low expression levels, respectively. (B) Metascape enrichment analysis of the top 100 upregulated genes in CS. The color shows the p value. (C) GSEA map of immunologic signature gene sets in EC and CS. (D) Metascape enrichment analysis of the top 100 downregulated genes in CS. The color shows the p value. (E) Heatmap of the top 15 downregulated genes in CS compared with EC. Red and blue represent high and low expression levels, respectively.
We noticed that the activation of the immune response was enriched, and the complement genes, C1QB and C1QC were two of the top 15 upregulated genes in CS (Figures 2A, B). We used GSEA for further investigation. In CS, a decrease in naïve CD8+ T cell and natural Treg cell was observed. In EC, the increase of resting T cell and naïve CD4+ T cell was obvious (Figure 2C and Supplementary Figure 2).
The downregulated genes are enriched in the skeletal development and negative regulation of cell proliferation (Figure 2D). Among the top 15 downregulated genes, CHRDL, CHAD, BGLAP, and PTH1R are related to the skeletal development. CYTL1, FRZB, and FGFR3 are related to both of the terms (Figure 2E and Supplementary Table 5).
Together, we revealed the functional differences between EC and CS. The immune response is more active in CS.
The Unique Gene Expression Modules in CS I, and CS II
CS is divided into three grades based on histopathology (1). The metastasis in Grade II and III is more frequent. In our study, we had Grade I and II patients. We used WGCNA to identify the gene modules in EC, CS I, CS II, and normal samples. We found that there were 25 modules (Figures 3A, B). Some modules are unique. We selected the most relevant modules and constructed the co-expression network using the genes with the top-weighted connectivity.
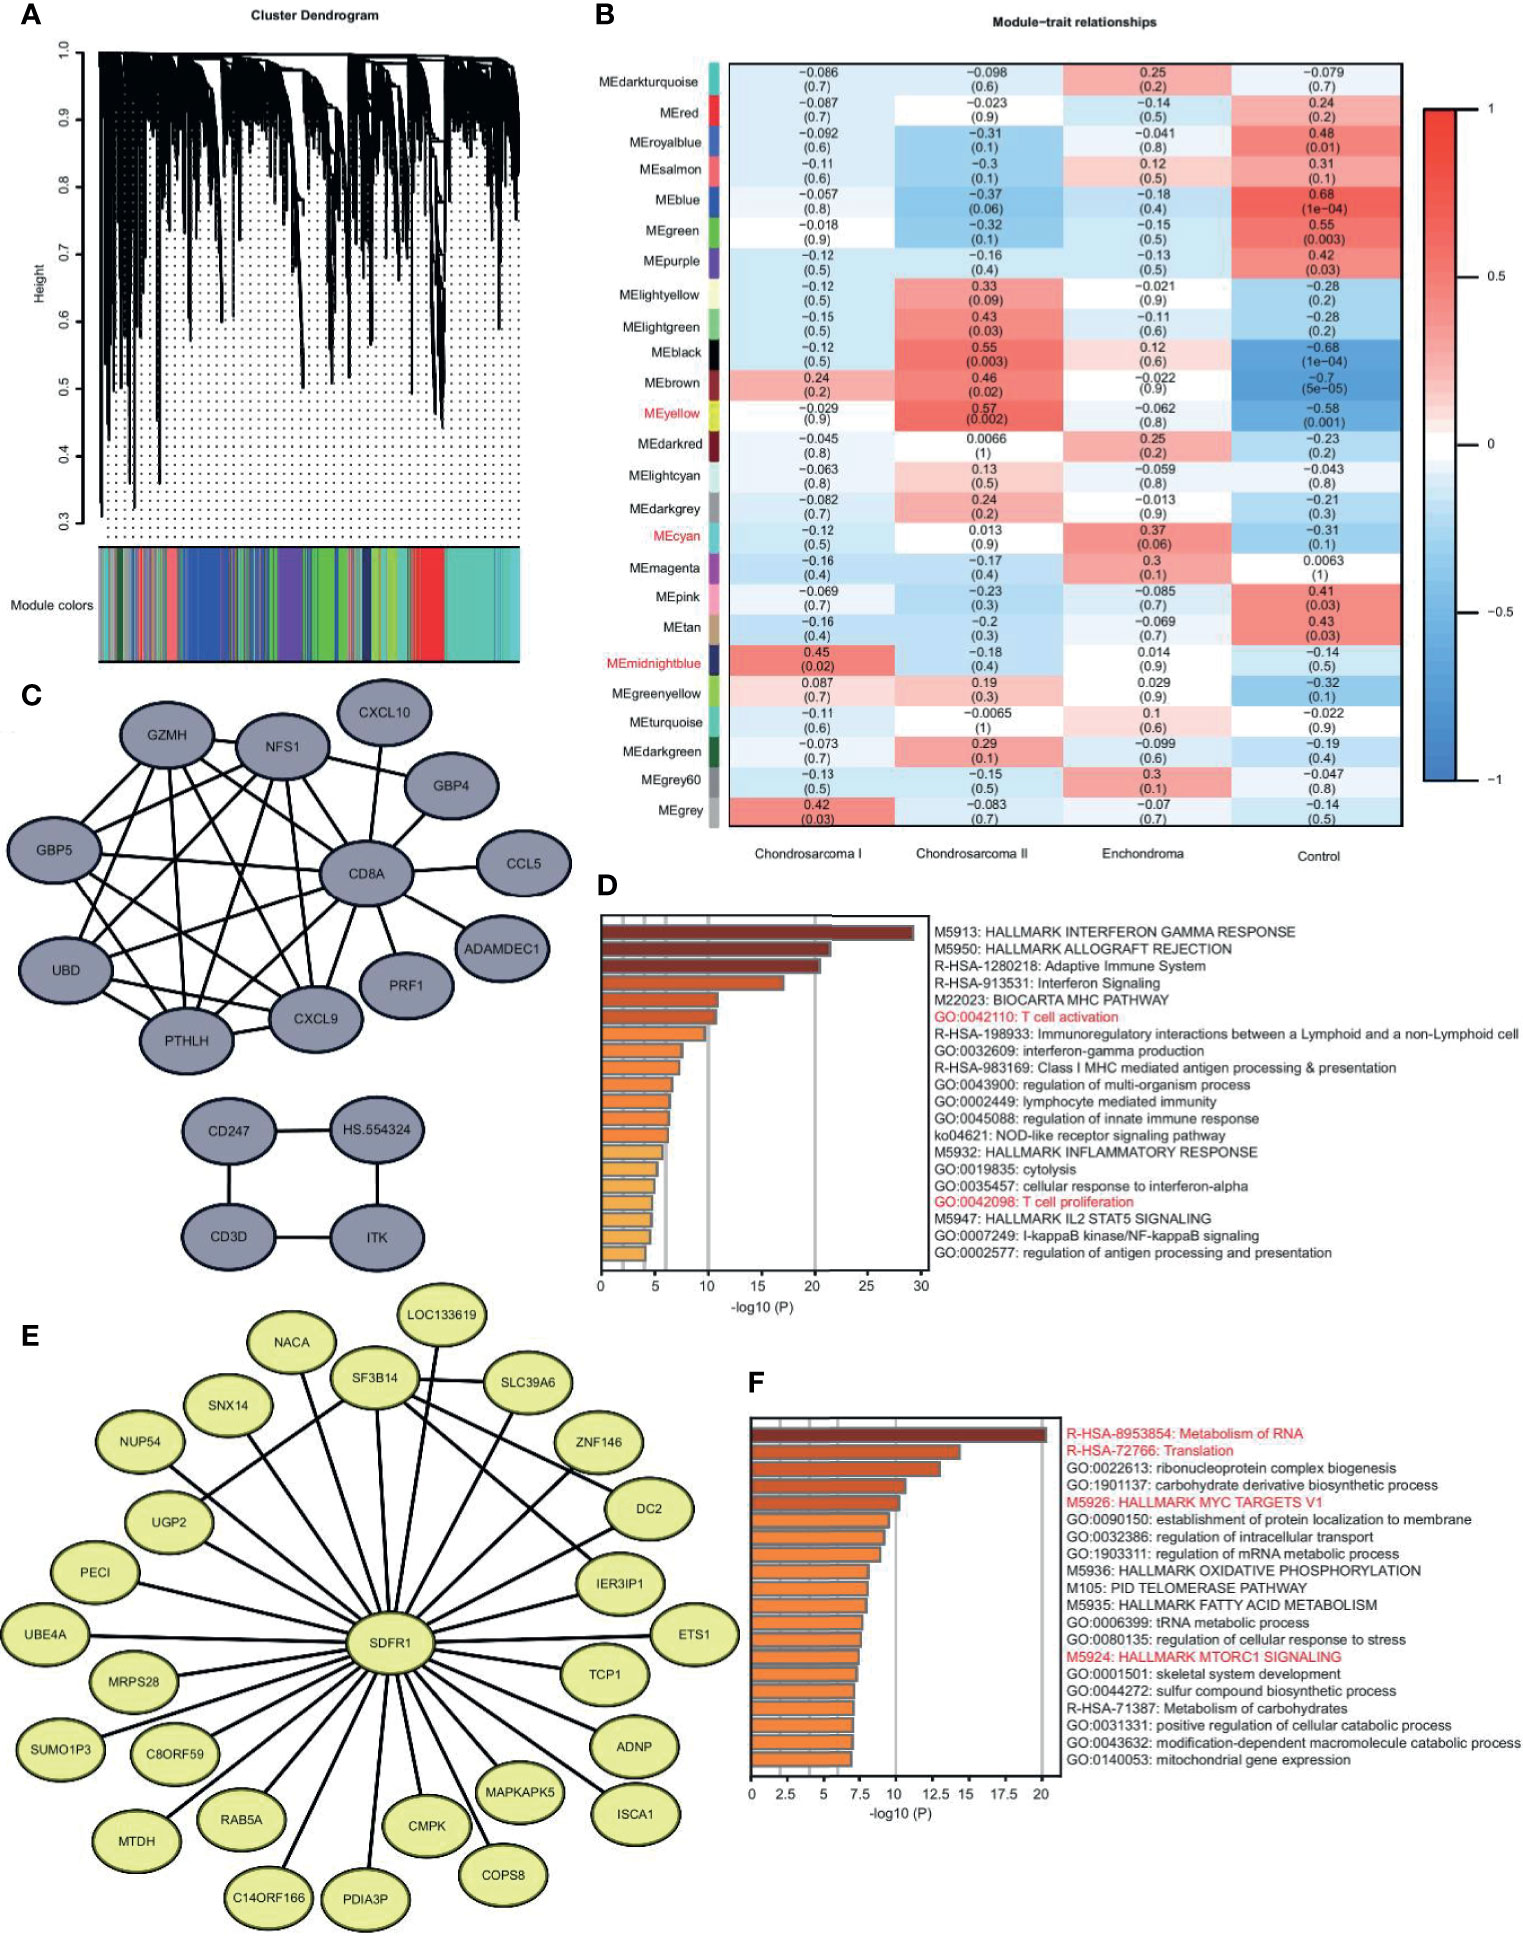
Figure 3 The unique gene expression modules in EC, CS I, and CS II. (A) Gene dendrogram obtained by average linkage hierarchical clustering. The color row underneath the dendrogram shows the module assignment. (B) Correlation heatmap of the modules to disease types. Each row corresponds to a module and the columns are disease types. Red and blue represent high and low correlation, respectively. The values in the cells are presented as Pearson r (p value). (C) Visualization of network with the genes of top-weighted connectivity in the midnight blue module. (D) Metascape enrichment analysis of genes in the midnight blue module. The color shows the p value. (E) Visualization of network with the genes of top-weighted connectivity in the yellow module. (F) Metascape enrichment analysis of genes in the yellow module. The color shows the p value.
We were interested in the differences between CS Iand CS II. The midnight blue module is unique in CS I. The hub gene of this module is CD8A. The top-weighted genes, such as CXCL9 and CD3D, form two networks, both of which are highly correlated with T cell immunity (Figure 3C). The enrichment analysis of genes in this module also reveals the activation of T cells (Figure 3D). We believed that T cell immunity in low-grade malignancy might help avoid metastasis (12).
The yellow module is unique in CS II. The top-weighted genes form a network, and the core gene is SDFR1 (Figure 3E). The genes in this module are related to the translation, MYC, and MTORC1 signaling pathway (Figure 3F). We believed that translation disorder is more serious in high-grade malignancies, and tumor-related signaling pathways are more active (13).
Together, CS I is more likely to trigger the immunity response, and CS II succumbs to tumor regulation.
Survival Analysis Suggesting the Prognostic Factors
We noticed that the expression levels of some genes, such as MFAP2, GOLM1(GOLPH2), STMN1, and HN1, increased continuously from control, EC, to CS, while the expression levels of some genes, such as CAB39L and GAB2 decreased (Figures 4A, B). We next used GEPIA and Prognoscan to explored whether these genes had potential prognostic value. There are significant differences in overall survival and distant recurrence-free survival between the high and low expression groups (Figures 4C–H and Supplementary Figure 3).
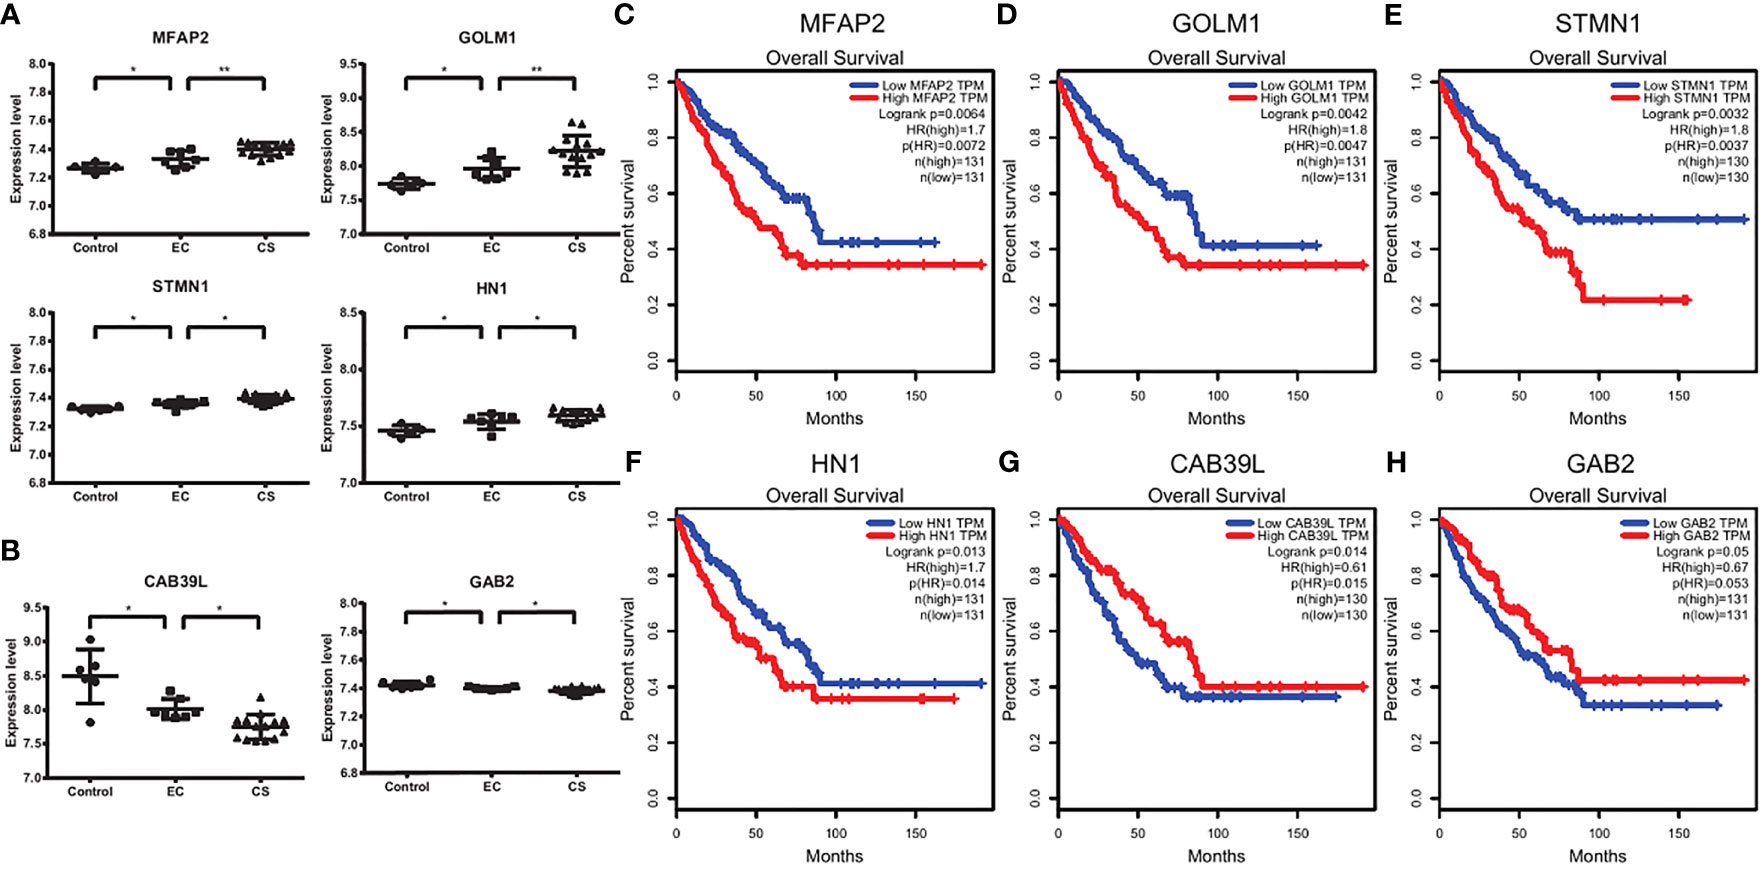
Figure 4 Survival analysis suggesting the prognostic factors. (A, B) The expression levels of MFA2, GOLM1, STMN1, HN1, CAB39L, and GAB2 in control, EC, and CS groups. Each dot represents a sample. *p < 0.05, **p < 0.01. (C–H) The overall survival plots using GEPIA. Red and blue represent high and low expression level groups of MFAP2 (C), GOLM1 (D), STMN1 (E), and HN1 (F), CAB39L (G) and GAB2 (H).
Thus, the high expression levels of MFAP2, GOLM1, STMN1, and HN1 predict a poor prognosis, while CAB39L and GAB2 predict a good prognosis.
Discussion
EC is a benign cartilage-forming tumor with the medullary cavity of the bone (14). EC has the risk of transforming to CS. CS is a type of hyaline cartilage that forms a malignant tumor (15). In our study, we identified the DEGs in normal, EC, and CS samples. We found that EMT and the VEGFA signaling pathway were important in the initial stage. The immune response was crucial for CS, especially CS I. CS II was more active in translation, MYC, and MTOR1 signaling pathway during metastasis. Moreover, we explored some prognostic markers.
EMT may occur during different states of tumor progression (13). It plays a key role in the pathogenesis of sarcoma dedifferentiation and early dissemination (6). The EMT programs are activated by extracellular matrix components (such as collagen genes) and inflammatory stimuli (such as growth factor genes) (16). It has been reported that EMT also promotes drug resistance and may help guide precision medicine (17, 18). In our study, EC and CS had high levels of several collagen genes, and CS was associated with a higher EMT signature.
Angiogenesis is involved in tumor biology, including metastasis, metabolic deregulation, and cancer stem cell maintenance (19). The blood vessel is important for transporting nutrients and oxygen. The VEGF family is a key mediator of angiogenesis (7). Blocking VEGFA is used to treat tumors (20). In one study, patients benefited from Ramncirumab, a monoclonal antibody that binds to VEGFR-2. It blocks the downstream effects of the VEGF pathway in angiogenesis (21). In another research, Bevacizumab, a monoclonal antibody targeting VEGF receptor, has been tested in a phase II clinical trial (22). In our study, the VEGFA-VEGFR2 signaling pathway was active in EC and CS. It gives us a hint that the anti-angiogenesis may be a powerful treatment to prevent recurrence.
Immunomodulatory drugs and immunotherapeutic agents have been used to treat various tumors (23). These approaches target the specific antigens expressed on tumor cells and induce cell death through tumor-infiltrating T cells (24). However, the heterogeneity in CD8+ T cell infiltration governs differential immunity (25). It usually acts as a cytotoxic cell that kills tumor cells but loses its effector function. Other cytokines and chemokines are important in regulating the antitumor response of CD8+ T cells (26). Treg cell reduces the expansion of CD8+ T cell (27). CXCL9 contributes to the recruitment and infiltration of CD8+ T cell (28). In our study, the upregulation of effect CD8+ T cells and the downregulation of Treg cells were observed in CS. Interestingly, CS I, not CS II, had the CD8 module, which was associated with CXCL9 in the network. In addition, it indicated the depletion of T cells in the late state.
In our study, some genes increased or decreased continuously from control, EC to CS. MFAP2, an extracellular matrix glycoprotein, is specifically expressed in osteoblastic-like cells (29). GOLM1 participates in immune regulation and the promotes EMT. It is a promising marker for early diagnosis and prognosis of hepatocellular carcinoma (30). In a study of 4625 patients with solid tumors, overexpression of STMN1 was associated with poor overall survival (31). HN1, interacting with STMN1, reduces α-tubulin acetylation and promotes tumor progression through EMT (32). CAB39L is a tumor metabolism regulator with the functions of tumor suppressor (33). It has been reported that GAB2 promotes tumor cell metastasis, migration, and recurrence (34). However, in our study, the expression level of GAB2 was reduced in CS. With the exception of STMN1, all of the above genes were first discussed as prognostic factors in sarcoma. Although the underlying mechanisms in EC and CS are not yet fully understood, we believe that MFAP2, GOLM1, STMN1, and HN1 are markers for poor prognosis, while CAB39L and GAB2 indicate a good prognosis.
In conclusion, we identified the DEGs in EC, CS and normal controls. We found that EMT and angiogenesis were active in CS. The CD8+ T cell immunity was enhanced in CS I. We suggested some prognostic factors. Our study provided new ideas for the diagnosis and treatment of EC and CS.
Data Availability Statement
The original contributions presented in the study are included in the article/Supplementary Material. Further inquiries can be directed to the corresponding authors.
Author Contributions
HH, GG, and XH designed the study. JW, YH, CY, XL, LW, JH, and DL performed analysis and interpretation. JW and TH wrote the manuscript. All authors contributed to the article and approved the submitted version.
Funding
This work was supported by grants from the Key R&D Project of Zhejiang Science and Technology Department (grant No. 2020C03G2013586), the Natural Science Foundation of China (grant No. 81730008), Key Project of Science and Technology Department of Zhejiang Province (grant No. 2019C03016).
Conflict of Interest
The authors declare that the research was conducted in the absence of any commercial or financial relationships that could be construed as a potential conflict of interest.
Publisher’s Note
All claims expressed in this article are solely those of the authors and do not necessarily represent those of their affiliated organizations, or those of the publisher, the editors and the reviewers. Any product that may be evaluated in this article, or claim that may be made by its manufacturer, is not guaranteed or endorsed by the publisher.
Supplementary Material
The Supplementary Material for this article can be found online at: https://www.frontiersin.org/articles/10.3389/fonc.2021.693034/full#supplementary-material
Supplementary Figure 1 | DEGs in other sarcoma datasets confirm the activation of EMT and angiogenesis. (A, B) Metascape enrichment analysis for viewing the enrichment terms of upregulated genes in Ewing sarcoma (A) and leiomyosarcoma (B) patients. The genes with p < 0.01 and logFC>1 are considered as the upregulated genes. The top 100 upregulated genes were used for the enrichment analysis. The color shows the p value.
Supplementary Figure 2 | GSEA map of EC and CS. GSEA of immunologic signature gene sets in EC and CS.
Supplementary Figure 3 | The distant recurrence-free survival suggesting the prognostic factors. (A-F) The distant recurrence-free survival using Prognoscan. Red and blue represent high and low expression level groups of MFAP2 (A), GOLM1 (B), STMN1 (C), and HN1 (D), CAB39L (E) and GAB2 (F).
References
1. Bovee JV, Hogendoorn PC, Wunder JS, Alman BA. Cartilage Tumours and Bone Development: Molecular Pathology and Possible Therapeutic Targets. Nat Rev Cancer (2010) 10:481–8. doi: 10.1038/nrc2869
2. Pansuriya TC, Oosting J, Verdegaal SH, Flanagan AM, Sciot R, Kindblom LG, et al. Maffucci Syndrome: A Genome-Wide Analysis Using High Resolution Single Nucleotide Polymorphism and Expression Arrays on Four Cases. Genes Chromosomes Cancer (2011) 50:673–9. doi: 10.1002/gcc.20889
3. Sharif B, Lindsay D, Saifuddin A. The Role of Imaging in Differentiating Low-Grade and High-Grade Central Chondral Tumours. Eur J Radiol (2021) 137:109579. doi: 10.1016/j.ejrad.2021.109579
4. Zhang H, Alman BA. Enchondromatosis and Growth Plate Development. Curr Osteoporos Rep (2021) 19:40–9. doi: 10.1007/s11914-020-00639-7
5. Vogelstein B, Papadopoulos N, Velculescu VE, Zhou S, Diaz LA, Kinzler KW. Cancer Genome Landscapes. Science (2013) 339:1546–58. doi: 10.1126/science.1235122
6. Matsuzaki S, Klar M, Matsuzaki S, Roman LD, Sood AK, Matsuo K. Uterine Carcinosarcoma: Contemporary Clinical Summary, Molecular Updates, and Future Research Opportunity. Gynecol Oncol (2021) 160:586–601. doi: 10.1016/j.ygyno.2020.10.043
7. Lieto E, Ferraraccio F, Orditura M, Castellano P, Mura AL, Pinto M, et al. Expression of Vascular Endothelial Growth Factor (VEGF) and Epidermal Growth Factor Receptor (EGFR) Is an Independent Prognostic Indicator of Worse Outcome in Gastric Cancer Patients. Ann Surg Oncol (2007) 15:69–79. doi: 10.1245/s10434-007-9596-0
8. Gupta AA, Kheur S, Palaskar SJ, Narang BR. Deciphering the "Collagen Code" in Tumor Progression. J Cancer Res Ther (2021) 17:29–32. doi: 10.4103/jcrt.JCRT_489_17
9. Fico F, Santamaria-Martinez A. TGFBI Modulates Tumour Hypoxia and Promotes Breast Cancer Metastasis. Mol Oncol (2020) 14:3198–210. doi: 10.1002/1878-0261.12828
10. Xiao Y, Zhu S, Yin W, Liu X, Hu Y. IGFBP-4 Expression Is Adversely Associated With Lung Cancer Prognosis. Oncol Lett (2017) 14:6876–80. doi: 10.3892/ol.2017.7014
11. Bockers M, Paul NW, Efferth T. Organophosphate Ester Tri-O-Cresyl Phosphate Interacts With Estrogen Receptor Alpha in MCF-7 Breast Cancer Cells Promoting Cancer Growth. Toxicol Appl Pharmacol (2020) 395:114977. doi: 10.1016/j.taap.2020.114977
12. Rangel Rivera GO, Knochelmann HM, Dwyer CJ, Smith AS, Wyatt MM, Rivera-Reyes AM, et al. Fundamentals of T Cell Metabolism and Strategies to Enhance Cancer Immunotherapy. Front Immunol (2021) 12:645242. doi: 10.3389/fimmu.2021.645242
13. Lourenco AR, Ban Y, Crowley MJ, Lee SB, Ramchandani D, Du W, et al. Differential Contributions of Pre- and Post-EMT Tumor Cells in Breast Cancer Metastasis. Cancer Res (2020) 80:163–9. doi: 10.1158/0008-5472.CAN-19-1427
14. Pansuriya TC, Kroon HM, Bovée JVMG. Enchondromatosis: Insights on the Different Subtypes. Int J Clin Exp Pathol (2010) 3:557–69.
15. Lai X, Chen S. Identification of Novel Biomarker Candidates for Immunohistochemical Diagnosis to Distinguish Low-Grade Chondrosarcoma From Enchondroma. Proteomics (2015) 15:2358–68. doi: 10.1002/pmic.201400528
16. Nieto MA, Huang RY, Jackson RA, Thiery JP. Emt: 2016. Cell (2016) 166:21–45. doi: 10.1016/j.cell.2016.06.028
17. Papatsirou M, Artemaki PI, Scorilas A, Kontos CK. The Role of Circular RNAs in Therapy Resistance of Patients With Solid Tumors. Per Med (2020) 17:469–90. doi: 10.2217/pme-2020-0103
18. Fischer KR, Durrans A, Lee S, Sheng J, Li F, Wong ST, et al. Epithelial-To-Mesenchymal Transition Is Not Required for Lung Metastasis But Contributes to Chemoresistance. Nature (2015) 527:472–6. doi: 10.1038/nature15748
19. Wang Z, Dabrosin C, Yin X, Fuster MM, Arreola A, Rathmell WK, et al. Broad Targeting of Angiogenesis for Cancer Prevention and Therapy. Semin Cancer Biol (2015) 35 Suppl:S224–43. doi: 10.1016/j.semcancer.2015.01.001
20. Kunnapuu J, Bokharaie H, Jeltsch M. Proteolytic Cleavages in the VEGF Family: Generating Diversity Among Angiogenic VEGFs, Essential for the Activation of Lymphangiogenic VEGFs. Biol (Basel) (2021) 10(2):167. doi: 10.3390/biology10020167
21. Giuppi M, La Salvia A, Evangelista J, Ghidini M. The Role and Expression of Angiogenesis-Related miRNAs in Gastric Cancer. Biol (Basel) (2021) 10(2):146. doi: 10.3390/biology10020146
22. Morales E, Olson M, Iglesias F, Dahiya S, Luetkens T, Atanackovic D. Role of Immunotherapy in Ewing Sarcoma. J Immunother Cancer (2020) 8(2):e000653. doi: 10.1136/jitc-2020-000653
23. Kumar S, Singh SK, Rana B, Rana A. Tumor-Infiltrating CD8(+) T Cell Antitumor Efficacy and Exhaustion: Molecular Insights. Drug Discov Today (2021) 26(4):951–67. doi: 10.1016/j.drudis.2021.01.002
24. Rooney MS, Shukla SA, Wu CJ, Getz G, Hacohen N. Molecular and Genetic Properties of Tumors Associated With Local Immune Cytolytic Activity. Cell (2015) 160:48–61. doi: 10.1016/j.cell.2014.12.033
25. Obeid JM, Hu Y, Erdag G, Leick KM, Slingluff CL Jr. The Heterogeneity of Tumor-Infiltrating CD8+ T Cells in Metastatic Melanoma Distorts Their Quantification: How to Manage Heterogeneity? Melanoma Res (2017) 27:211–7. doi: 10.1097/CMR.0000000000000330
26. Thompson ED, Enriquez HL, Fu YX, Engelhard VH. Tumor Masses Support Naive T Cell Infiltration, Activation, and Differentiation Into Effectors. J Exp Med (2010) 207:1791–804. doi: 10.1084/jem.20092454
27. Jang JE, Hajdu CH, Liot C, Miller G, Dustin ML, Bar-Sagi D. Crosstalk Between Regulatory T Cells and Tumor-Associated Dendritic Cells Negates Anti-Tumor Immunity in Pancreatic Cancer. Cell Rep (2017) 20:558–71. doi: 10.1016/j.celrep.2017.06.062
28. Harlin H, Meng Y, Peterson AC, Zha Y, Tretiakova M, Slingluff C, et al. Chemokine Expression in Melanoma Metastases Associated With CD8+ T-Cell Recruitment. Cancer Res (2009) 69:3077–85. doi: 10.1158/0008-5472.CAN-08-2281
29. Zhu S, Ye L, Bennett S, Xu H, He D, Xu J. Molecular Structure and Function of Microfibrillar-Associated Proteins in Skeletal and Metabolic Disorders and Cancers. J Cell Physiol (2021) 236:41–8. doi: 10.1002/jcp.29893
30. Yan J, Zhou B, Li H, Guo L, Ye Q. Recent Advances of GOLM1 in Hepatocellular Carcinoma. Hepat Oncol (2020) 7(2):HEP22. doi: 10.2217/hep-2020-0006
31. Zhang D, Dai L, Yang Z, Wang X, LanNing Y. Association of STMN1 With Survival in Solid Tumors: A Systematic Review and Meta-Analysis. Int J Biol Markers (2019) 34:108–16. doi: 10.1177/1724600819837210
32. Pan Z, Fang Q, Li L, Zhang Y, Xu T, Liu Y, et al. HN1 Promotes Tumor Growth and Metastasis of Anaplastic Thyroid Carcinoma by Interacting With STMN1. Cancer Lett (2021) 501:31–42. doi: 10.1016/j.canlet.2020.12.026
33. Li W, Wong CC, Zhang X, Kang W, Nakatsu G, Zhao Q, et al. CAB39L Elicited an Anti-Warburg Effect via a LKB1-AMPK-PGC1alpha Axis to Inhibit Gastric Tumorigenesis. Oncogene (2018) 37:6383–98. doi: 10.1038/s41388-018-0402-1
Keywords: enchondroma, chondrosarcoma, epithelial to mesenchymal transformation, VEGFA-VEGF2R signaling pathway, T cell immunity, angiogenesis, prognostic factor
Citation: Wu J, Huang Y, Yu C, Li X, Wang L, Hong J, Lin D, Han X, Guo G, Hu T and Huang H (2021) The Key Gene Expression Patterns and Prognostic Factors in Malignant Transformation from Enchondroma to Chondrosarcoma. Front. Oncol. 11:693034. doi: 10.3389/fonc.2021.693034
Received: 09 April 2021; Accepted: 23 August 2021;
Published: 10 September 2021.
Edited by:
Ye Wang, Qingdao University Medical College, ChinaReviewed by:
Hou-Qun Ying, Second Affiliated Hospital of Nanchang University, ChinaQian Yang, Cedars Sinai Medical Center, United States
Copyright © 2021 Wu, Huang, Yu, Li, Wang, Hong, Lin, Han, Guo, Hu and Huang. This is an open-access article distributed under the terms of the Creative Commons Attribution License (CC BY). The use, distribution or reproduction in other forums is permitted, provided the original author(s) and the copyright owner(s) are credited and that the original publication in this journal is cited, in accordance with accepted academic practice. No use, distribution or reproduction is permitted which does not comply with these terms.
*Correspondence: He Huang, aHVhbmdoZUB6anUuZWR1LmNu; Tianye Hu, ZHJfaHV0aWFueWVAMTYzLmNvbQ==; Guoji Guo, Z2dqQHpqdS5lZHUuY24=
†These authors contributed equally to this work