 Zhicheng Liu
 Shanshan Li
 Shan Huang
 Tao Wang
- 1School of Biomedical Engineering, Capital Medical University, Beijing, China
- 2Beijing Key Laboratory of Fundamental Research on Biomechanics in Clinical Application, Capital Medical University, Beijing, China
Uveal melanoma (UM) is one of the most common malignant intraocular tumors in adults. Few studies have investigated the effect of N6-methyladenosine (m6A) RNA methylation regulators and related long noncoding RNAs (lncRNAs) on the tumor microenvironment (TME) and survival time of patients with UM. Based on the transcriptome and clinical data from The Cancer Genome Atlas, we systematically identified m6A regulators. Then, we constructed an m6A regulators-based signature to predict the prognostic risk using univariate and LASSO Cox analyses. The signature was then validated by performing Kaplan-Meier, and receiver operating characteristic analyses. Through the correlation analysis, m6A regulators-related lncRNAs were identified, and they were divided into different clustering subtypes according to their expression. We further assessed differences in TME scores, the survival time of patients, and immune cell infiltration levels between different clustering subtypes. Finally, we screened out the common immune genes shared by m6A-related lncRNAs and determined their expression in different risk groups and clustering subtypes. For further validation, we used single-cell sequencing data from the GSE139829 dataset to explore the expression distribution of immune genes in the TME of UM. We constructed a prognostic risk signature representing an independent prognostic factor for UM using 3 m6A regulators. Patients in the low-risk group exhibited a more favorable prognosis and lower immune cell infiltration levels than patients in the high-risk group. Two subtypes (cluster 1/2) were identified based on m6A regulators-related lncRNAs. The TME scores, prognosis, and immune cell infiltration have a marked difference between cluster 1 and cluster 2. Additionally, 13 common immune genes shared by 5 lncRNAs were screened out. We found that these immune genes were differentially expressed in different risk groups and clustering subtypes and were widely distributed in 3 cell types of TME. In conclusion, our study demonstrated the important role of m6A regulators and related lncRNAs in TME remodeling. The signature developed using m6A regulators might serve as a promising parameter for the clinical prediction of UM.
Introduction
Uveal melanoma (UM), which is the second most common type of melanoma, originates from melanocytes in the intraocular uvea (1). Currently, surgery and radiotherapy are the most effective methods to treat local tumors (2). However, the overall mortality in patients with UM is more than 50%, because it is highly susceptible to early metastasis (3, 4). Therefore, new treatments such as immunotherapy or targeted therapy (5, 6) are being developed, which requires the identification of several potential prognostic biomarkers and therapeutic targets for UM.
The most prevalent RNA modification is N6-methyladenosine (m6A), which involves methylation of the sixth N atom of adenine (7). m6A methylation is a dynamic process regulated by methyltransferases (writers) and demethylases (erasers), whereas binding proteins (readers) bind to m6A methylation sites (8, 9). Methyltransferases such as METTL3/14/16, WTAP, RBM15, and VIRMA promote m6A methylation (9–11). On the other hand, demethylases, which include FTO and ALKBH5, inhibit m6A methylation (9, 11). Binding proteins, such as YTHDC1/2, YTHDF1-3, IGF2BP1-3, and HNRNPC, bind to the m6A modified site to form a complex that mediates its biological function (12). These m6A methylases are primarily involved in mammalian development, immune response, tumorigenesis, and metastasis, and stem cell differentiation (13–16). However, the prognostic role of m6A methylases in UM development has not been sufficiently investigated. Besides, the involvement of m6A methylases in the tumor microenvironment (TME) remains to be thoroughly explored.
Long noncoding RNAs (lncRNAs) are frequently defined as RNAs that have a transcript length exceeding 200 nucleotides and do not encode proteins (17). They can regulate gene expression at epigenetic, transcriptional, and post-transcriptional levels (18). A recent study has reported that lncRNAs promote tumor development by altering the immune microenvironment (19). Increasing evidence has demonstrated the TME, which mainly consists of stromal and immune cells, plays an important role in tumor progression (20). Stromal cells may contribute to tumor angiogenesis and extracellular matrix reorganization, whereas immune cells may contribute to TME via dysregulation of immune-mediated responses (21). Therefore, immune cell infiltration in the TME may serve as a potential target for immunotherapy. However, the involvement of lncRNAs in immune cell infiltration in UM remains unclear.
This study aimed to systematically explore m6A regulators and related lncRNAs involved in the TME in UM and developed an m6A regulators-based signature for improving the accuracy of prognosis in patients with UM. We also established clustering subtypes based on m6A regulators-related lncRNAs to determine the relationships between the clustering subtypes, TME scores, prognosis, and immune cell infiltration, and further explained the mechanism of action of m6A regulators. Finally, we explored the expression of 13 immune genes shared by 5 lncRNAs in different risk groups and clustering subtypes.
Materials and Methods
Data Collection and Preparation
The RNA-sequencing transcriptome data of 80 patients with UM and corresponding clinical data were downloaded from The Cancer Genome Atlas (TCGA) data portal (https://portal.gdc.cancer.gov/). GTF files were downloaded from Ensembl (https://asia.ensembl.org) to distinguish between lncRNAs and mRNAs for subsequent analyses. The list of immune genes was downloaded from the ImmPort database (https://www.immport.org).
Generation of TME Scores and Tumor-Infiltrating Immune Cells
The ESTIMATE algorithm in the R “estimate” package was used to calculate the TME scores of 80 UM patients. The Kaplan-Meier survival analysis was conducted to compare the difference in survival time using R “survMiner” and “survival” packages. The fraction of 22 immune cell types in each sample was estimated using CIBERSORT. The association between TME scores and tumor-infiltrating immune cells (TICs) was established using correlation analysis.
Construction and Validation of m6A Regulators-Based Signature
The m6A regulators were identified from the published literature (9–12). The m6A regulators contain 8 writers (METTL3, METTL14, METTL16, WTAP, VIRMA, ZC3H13, RBM15, and RBM15B), 13 readers (YTHDC1, YTHDC2, YTHDF1, YTHDF2, YTHDF3, HNRNPC, FMR1, LRPPRC, HNRNPA2B1, IGF2BP1, IGF2BP2, IGF2BP3, and RBMX), and 2 erasers (FTO and ALKBH5). The expression data of m6A regulators were extracted from the mRNA expression data of TCGA. The m6A regulators, which were previously identified using the univariate Cox regression analysis, were further subjected to the LASSO Cox regression analysis using the “glmnet” package. The minimum 10-fold cross-validation was used to select the best penalty parameter λ. Then, the risk score of each patient was calculated using a linear combination of m6A regulators expression weighted by the multivariate Cox regression analysis. According to the median risk score, the samples were divided into high-risk and low-risk groups. Subsequently, the Kaplan-Meier survival analysis was performed to compare the survival difference. Receiver operating characteristic (ROC) analysis was performed to evaluate the prognostic value of the signature using the “timeROC” package.
Generation and Validation of Clustering Subtypes From m6A Regulators-Related LncRNAs
We screened m6A regulators-related lncRNAs by Pearson’s correlation analysis. The process used the criteria of |correlation coefficient| > 0.4 and p < 0.001. The expression data of m6A regulators-related lncRNAs were extracted from the lncRNA expression data of TCGA. To clarify the biological characteristics of m6A regulators-related lncRNAs, the R “ConsensusClusterPlus” package was used to divide the samples into different clustering subtypes according to the expression of lncRNAs. Principal component analysis (PCA), Kaplan-Meier survival analysis, TME scores, and TICs profiles were performed for different clustering subtypes.
Identification and Validation of Immune Genes Shared by 5 LncRNAs
The Pearson’s correlation analysis was performed to screen common immune genes shared by 5 lncRNAs. The Kaplan-Meier survival analysis was used to compare the survival difference between high- and low-expression of immune genes. The differential expression analysis of immune genes was performed using the R “limma” package in different risk groups and clustering subtypes. A p-value < 0.05 indicated statistical significance. At present, single-cell sequencing technology has been widely used to explore the heterogeneity of TME. To characterize immune genes expression distribution in TME of UM, we search for single-cell sequencing data of UM from Tumor Immune Single-cell Hub (TISCH) (22). The GSE139829 dataset including 59,915 cell sequencing data from 11 samples was collected to perform gene expression distribution (23).
Results
The Correlation Between TME Scores With the Survival of UM Patients and Immune Cell Infiltration
To establish the correlation of ImmuneScore and StromalScore with the survival time, we performed the Kaplan-Meier survival analysis. A high score of immune and stromal cells signified large numbers of these cells in the TME. As shown in Figure 1A, the overall survival (OS) in the low ImmuneScore group was longer than that in the high ImmuneScore group. Similarly, StromalScore and ESTIMATEScore showed a negative correlation with the OS (Figures 1B, C). To confirm exact changes in the genetic profiles in the TME about immune and stromal cell components, variance analysis of high and low scores was performed. As shown in Figures 1D, E, 700 common differentially expressed genes (DEGs) were upregulated, and 74 common DEGs were downregulated. To further explore the interaction between TME scores and the 22 immune cell types, we first estimated the 22 types of TICs with abundance distribution in all the tumor samples and then calculated the correlation index between the TME scores and TICs. The results showed that ImmuneScore is correlated with CD8+ T cells, resting memory CD4+ T cells, activated memory CD4+ T cells, helper T cells (follicular), Tregs, resting NK cells, monocytes, M0 macrophages, M1 macrophages, resting mast cells, and eosinophils (Figure 1F).
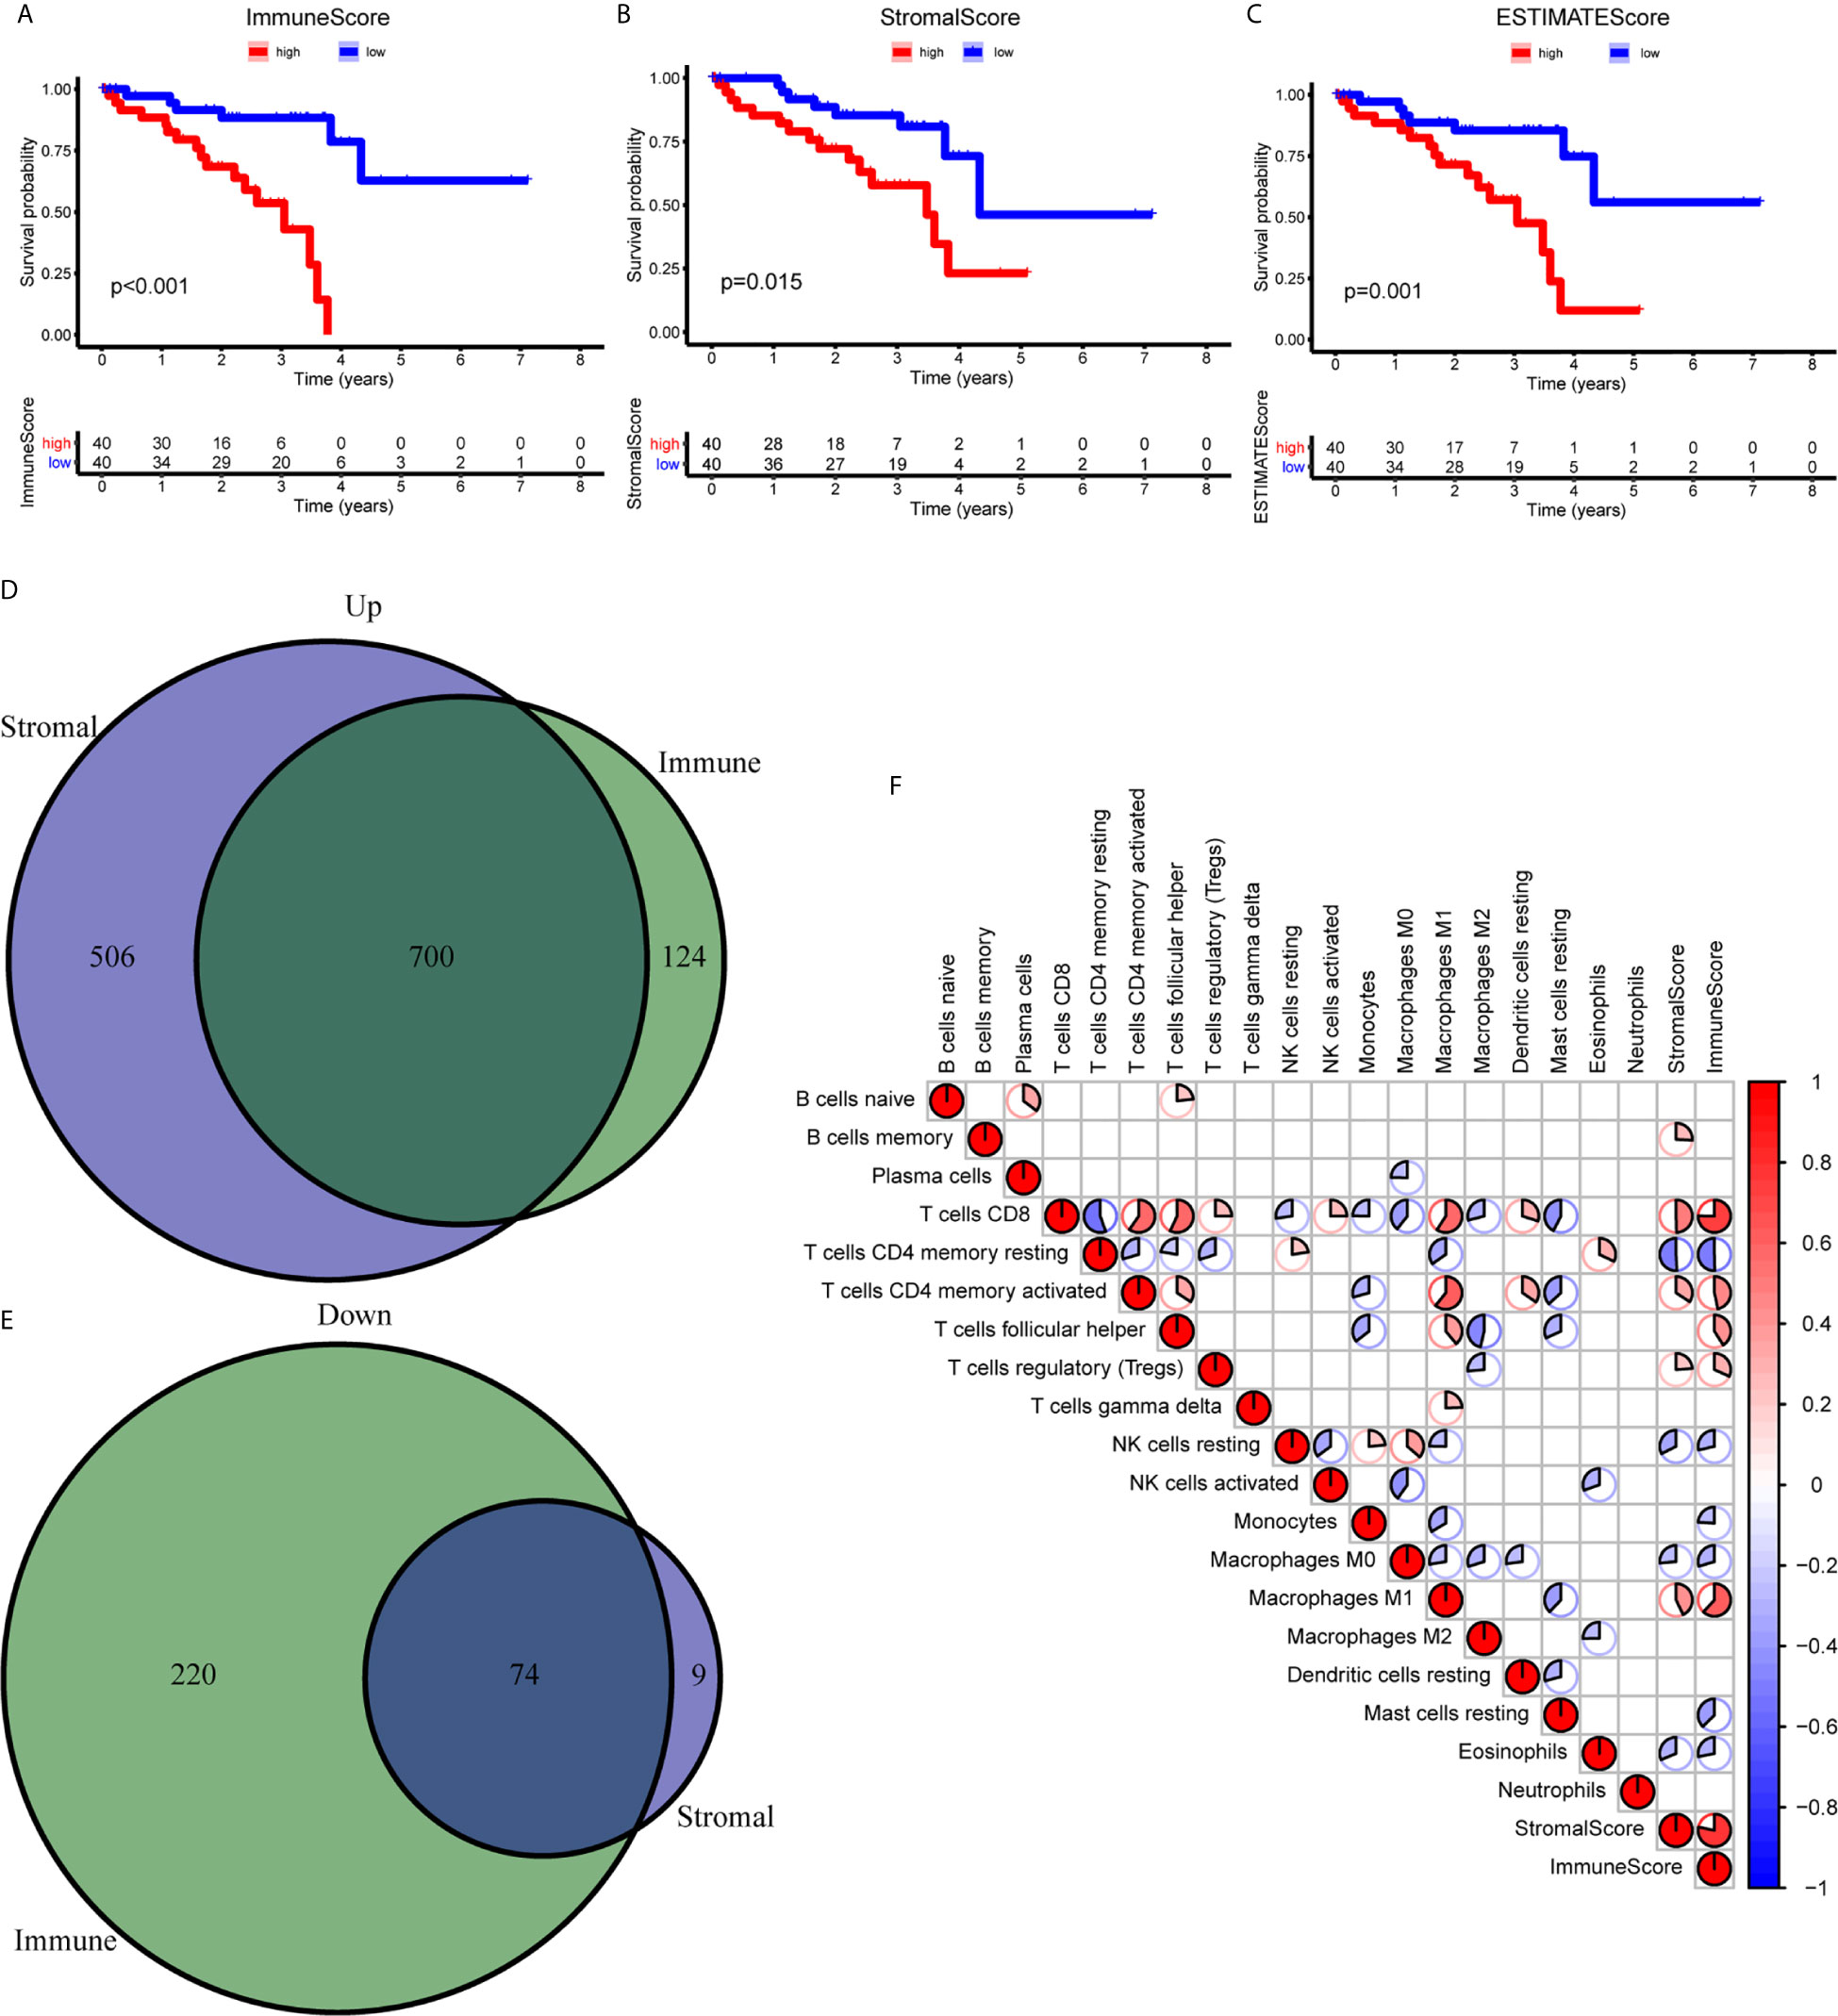
Figure 1 Correlation between the TME scores and survival of UM patients. (A–C) Kaplan-Meier survival analysis between high and low ImmuneScore (A), StromalScore (B), and ESTIMATEScore (C). (D, E) The Venn diagram showed the common upregulated (D) and downregulated (E) DEGs shared by ImmuneScore and StromalScore. (F) The relationship between 19 immune cell types and score of immune and stromal. DEGs, differentially expressed genes.
Construction and Validation of m6A Regulators-Based Signature
To clarify the biological function of m6A regulators in the prognosis of patients with UM, we comprehensively investigated the prognostic value of m6A regulators based on the expression and clinical data (Table S1). Of these m6A regulators, seven exhibited a prognostic value based on OS (Figure 2A), while nine displayed a prognostic value based on progression-free survival (PFS) (Figure 2B). The Venn plot results indicated that 6 m6A regulators (RBM15B, IGF2BP2, YTHDF1, METTL16, VIRMA, and YTHDF3) were identified based on OS and PFS (Figure 2C). To avoid overfitting, we performed the LASSO Cox analysis and selected 3 of the 6 m6A regulators were to establish a risk signature (Figures 2D, E). Thus, we established a predictive model: risk score = (RBM15B * −0.14284) + (YTHDF3 * 0.02121) + (IGF2BP2 * −0.11533). The distribution of risk score (Upper), patients’ survival time (Middle), and heat map analysis (Bottom) of the 3 prognostic m6A regulators were shown based on the OS (Figures 2F) and PFS (Figure 2G). Results of the heat maps (Figures 2F, G) was survival curves (Figures 3A–C) suggested that YTHDF3 was likely to be a high-risk factor because it was upregulated in the high-risk group. However, the highly expressed RBM15B and IGF2BP2 in the low-risk group might be protective factors. As shown in Figures 3D, E, the OS and PFS of patients in the low-risk group were longer than in the high-risk group. To evaluate the prognostic accuracy of the 3 m6A regulators-based signature, we performed the ROC analysis based on OS and PFS. Areas under the ROC curves of 1, 2, and 3 years were 0.774, 0.811, and 0.843, respectively (Figure 4A). The PFS prediction of 3 m6A regulators-based signature was also accurate (Figure 4B). These results suggested that the 3 m6A regulators-based signature might serve as a promising parameter for prognostic prediction of UM.
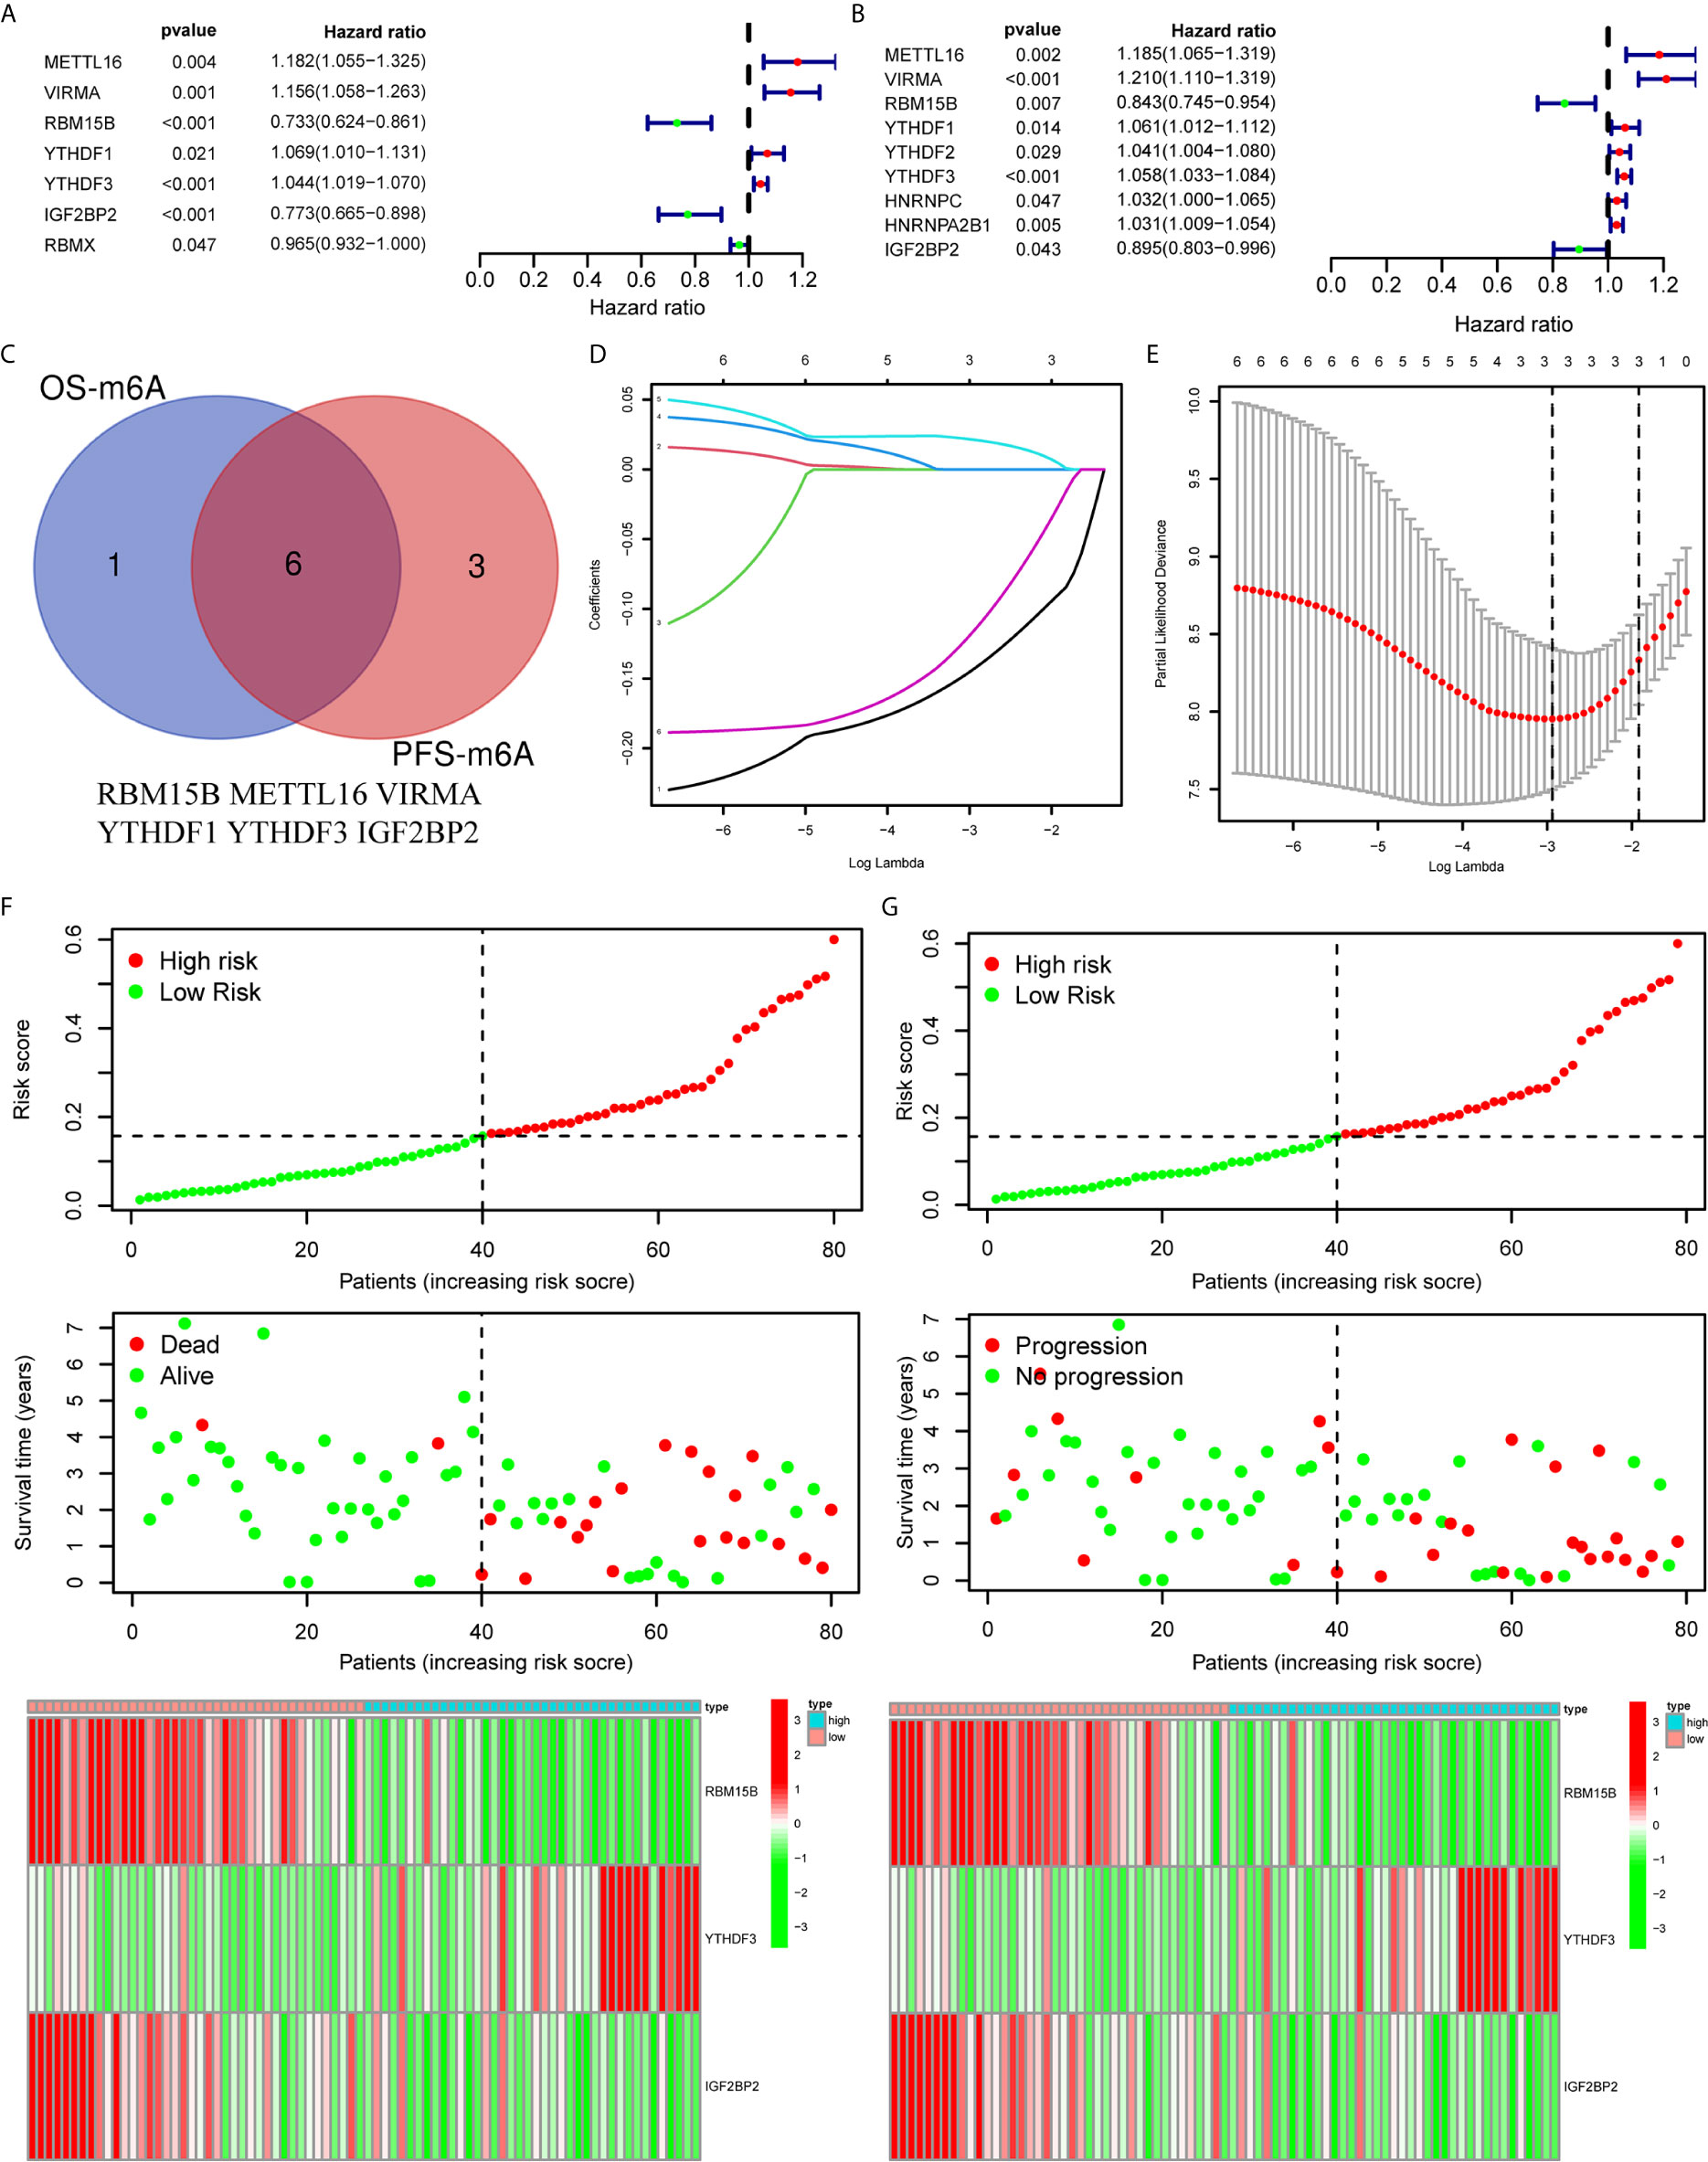
Figure 2 Construction of a prognostic signature based on m6A regulators. (A, B) Forest plots for the univariate Cox analysis of prognosis based on OS (A) and PFS (B). Colored dots represent hazard ratio, and the horizontal lines across the hazard ratio represent 95% confidence interval. (C) The Venn plot showed 6 common m6A regulators based on both OS and PFS. (D) LASSO coefficient profiles of the 6 m6A regulators. (E) The minimum 10-fold cross-validation was used to select the best penalty parameter λ in the LASSO model. (F, G) The distribution of the risk score (Upper), pattern of survival time and survival status (Middle), and the heat map (Bottom) of the 3 prognostic m6A regulators levels based on OS (F) and PFS (G). OS, overall survival; PFS, progression free survival.
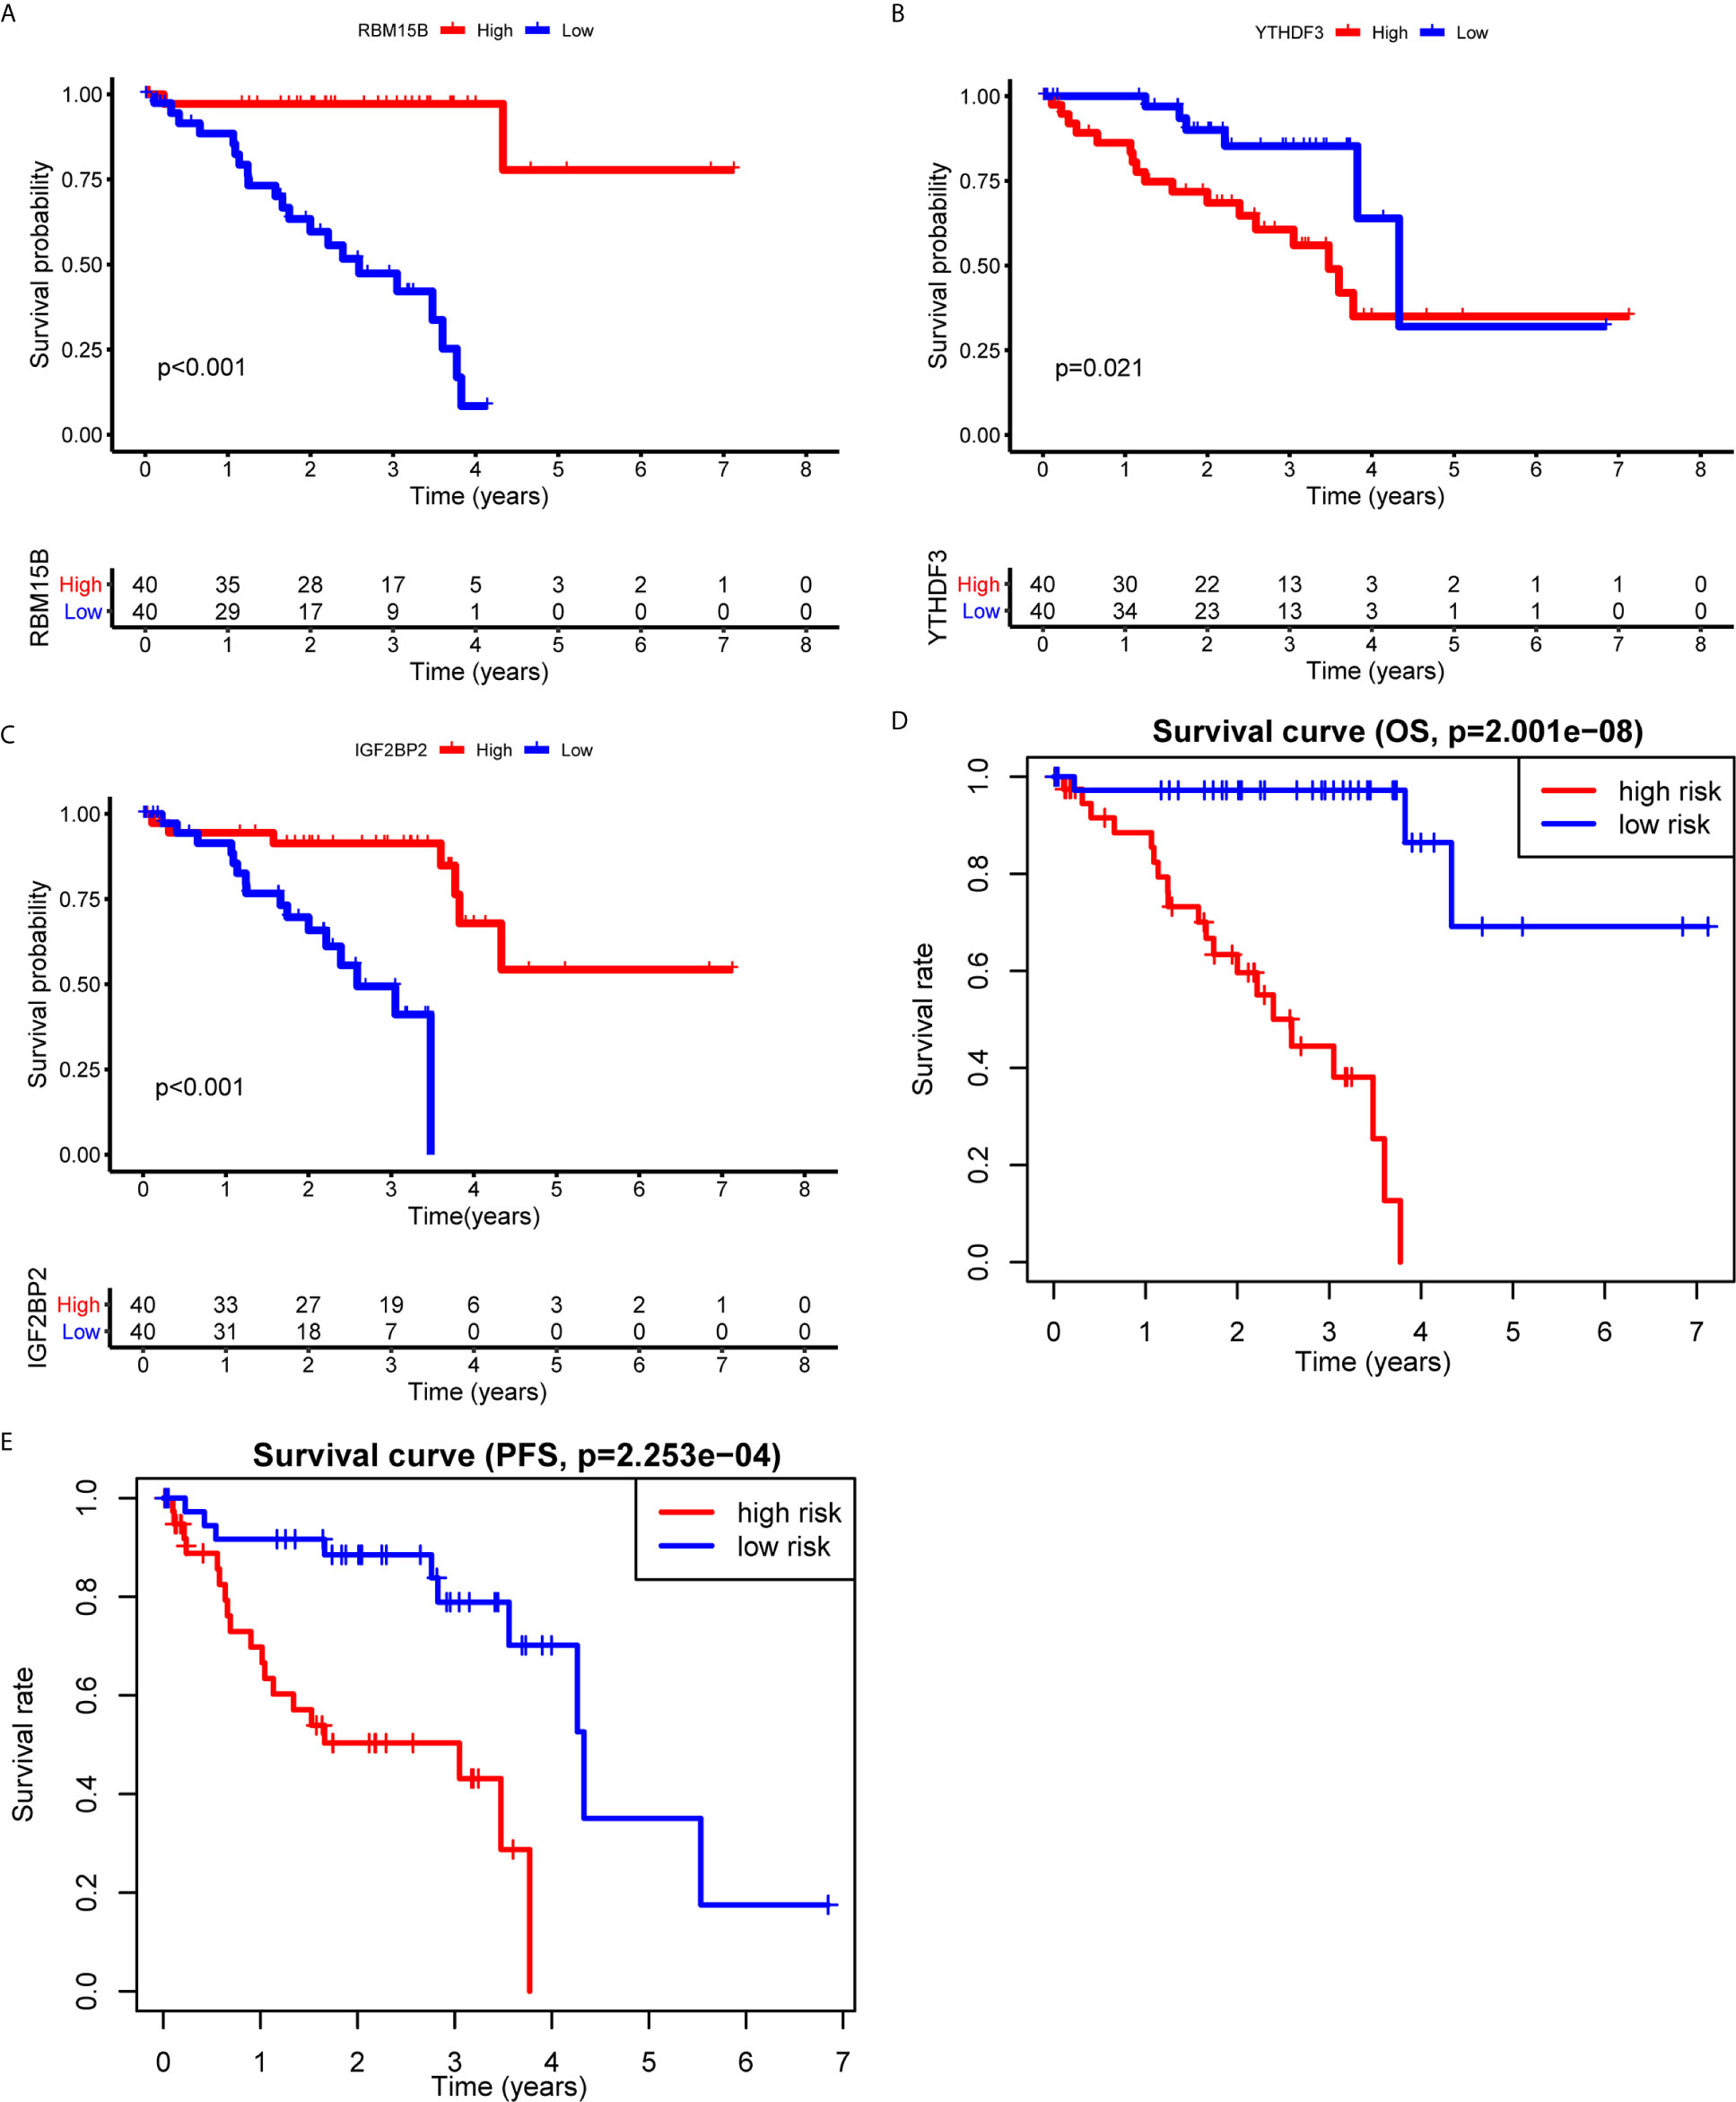
Figure 3 Kaplan-Meier survival analysis of the 3 m6A regulators and the risk signature. (A–C) Survival curves between the high- and low-expression of RBM15B (A), YTHDF3 (B), and IGF2BP2 (C). (D, E) Survival curves of the 3 m6A regulators-based signature based on OS (D) and PFS (E). OS, overall survival; PFS, progression free survival.
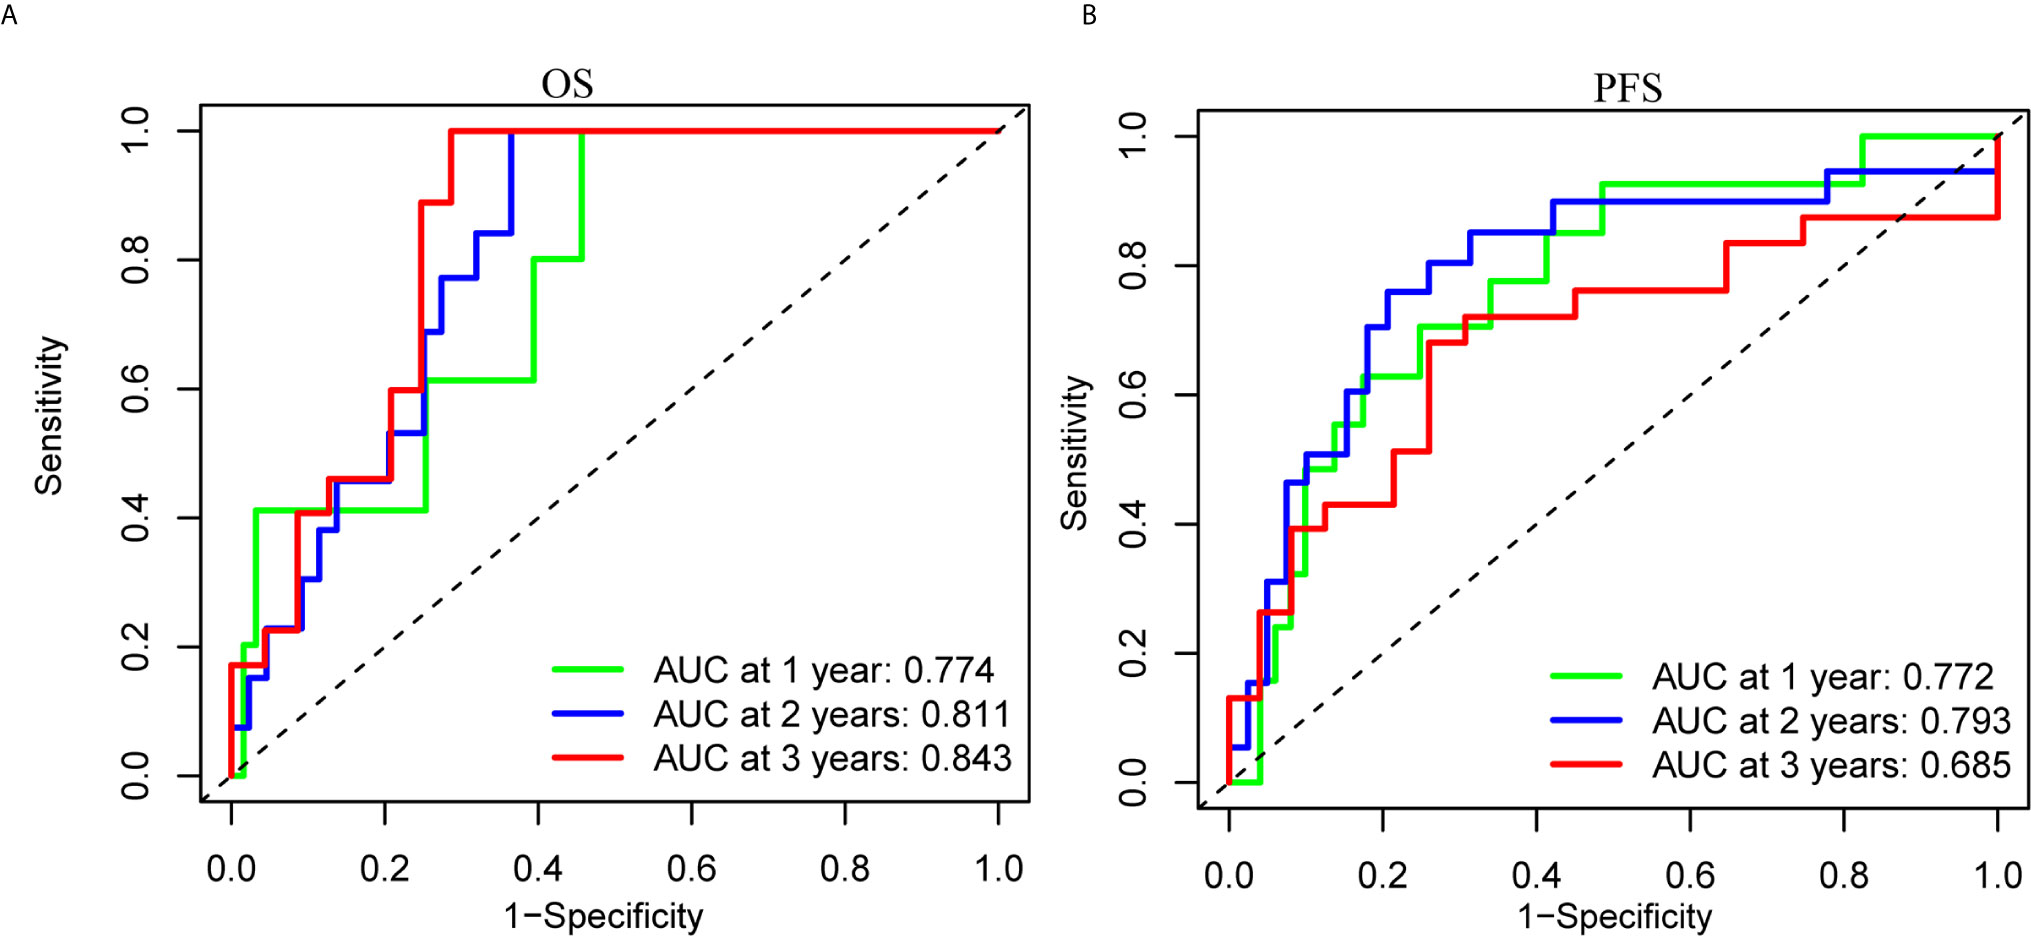
Figure 4 ROC analysis of the 3 m6A regulators-based signature. (A, B) The 1-, 2-, and 3-years ROC analysis of the prognostic prediction based on the 3 m6A regulators according to OS (A) and PFS (B). OS, overall survival; PFS, progression free survival; AUC, area under the ROC curve.
The Association Between Risk Score With Immune Cell Infiltration and TME Scores
The correlation between the risk score and the immune cell infiltration levels was calculated to establish the association between the 3 m6A regulators-based signature with the TME. ImmuneScore, StromalScore, and ESTIMATEScore in the high-risk group were significantly higher than in the low-risk group (Figures 5A–C). The results showed that the risk score was significantly negatively correlated with the infiltration levels of naive B cells (Figure 5D), eosinophils (Figure 5F), monocytes (Figure 5G), and plasma cells (Figure 5H). Only the infiltration level of resting dendritic cells was positively correlated with the risk score (Figure 5E). These results indicated that the 3 m6A regulators were involved in the immune cell infiltration of UM.

Figure 5 Relationships among the risk score, TME scores, and immune cell infiltration of 5 immune cell types. (A–C) The variance analysis of ImmuneScore (A), StromalScore (B), and ESTIMATEScore (C) in the high- and low-risk groups. (D–H) The correlation between risk score and naive B cells (D), resting dendritic cells (E), eosinophils (F), monocytes (G), and plasma cells (H). The blue line in each plot was fitted linear model indicating the proportion tropism of immune cell along with risk score. The shade around the blue line represents the 95% confidence interval.
The Correlation Between Consensus Clustering of m6A Regulators-Related LncRNAs and TME Scores, Survival Time, and Immune Cell Infiltration
Using the correlation analysis, we identified 514 lncRNAs based on RNA-Seq data and constructed a network between m6A regulators and lncRNAs (Figure 6A). A total of 66 of the 514 lncRNAs had a prognostic value based on the OS (Figure S1A), while 70 of the 514 lncRNAs had a prognostic value based on the PFS (Figure S1B). The Venn plot results showed that 38 lncRNAs were common according to OS and PFS (Figure 6B). Based on the similarity identified by consensus clustering using the ‘ConsensusClusterPlus’ package, we found that k = 2 was the optimal clustering stability value (Figures 6C, D). The 80 UM samples were well-differentiated into two subtypes according to the expression of 38 lncRNAs (Figure 6E).
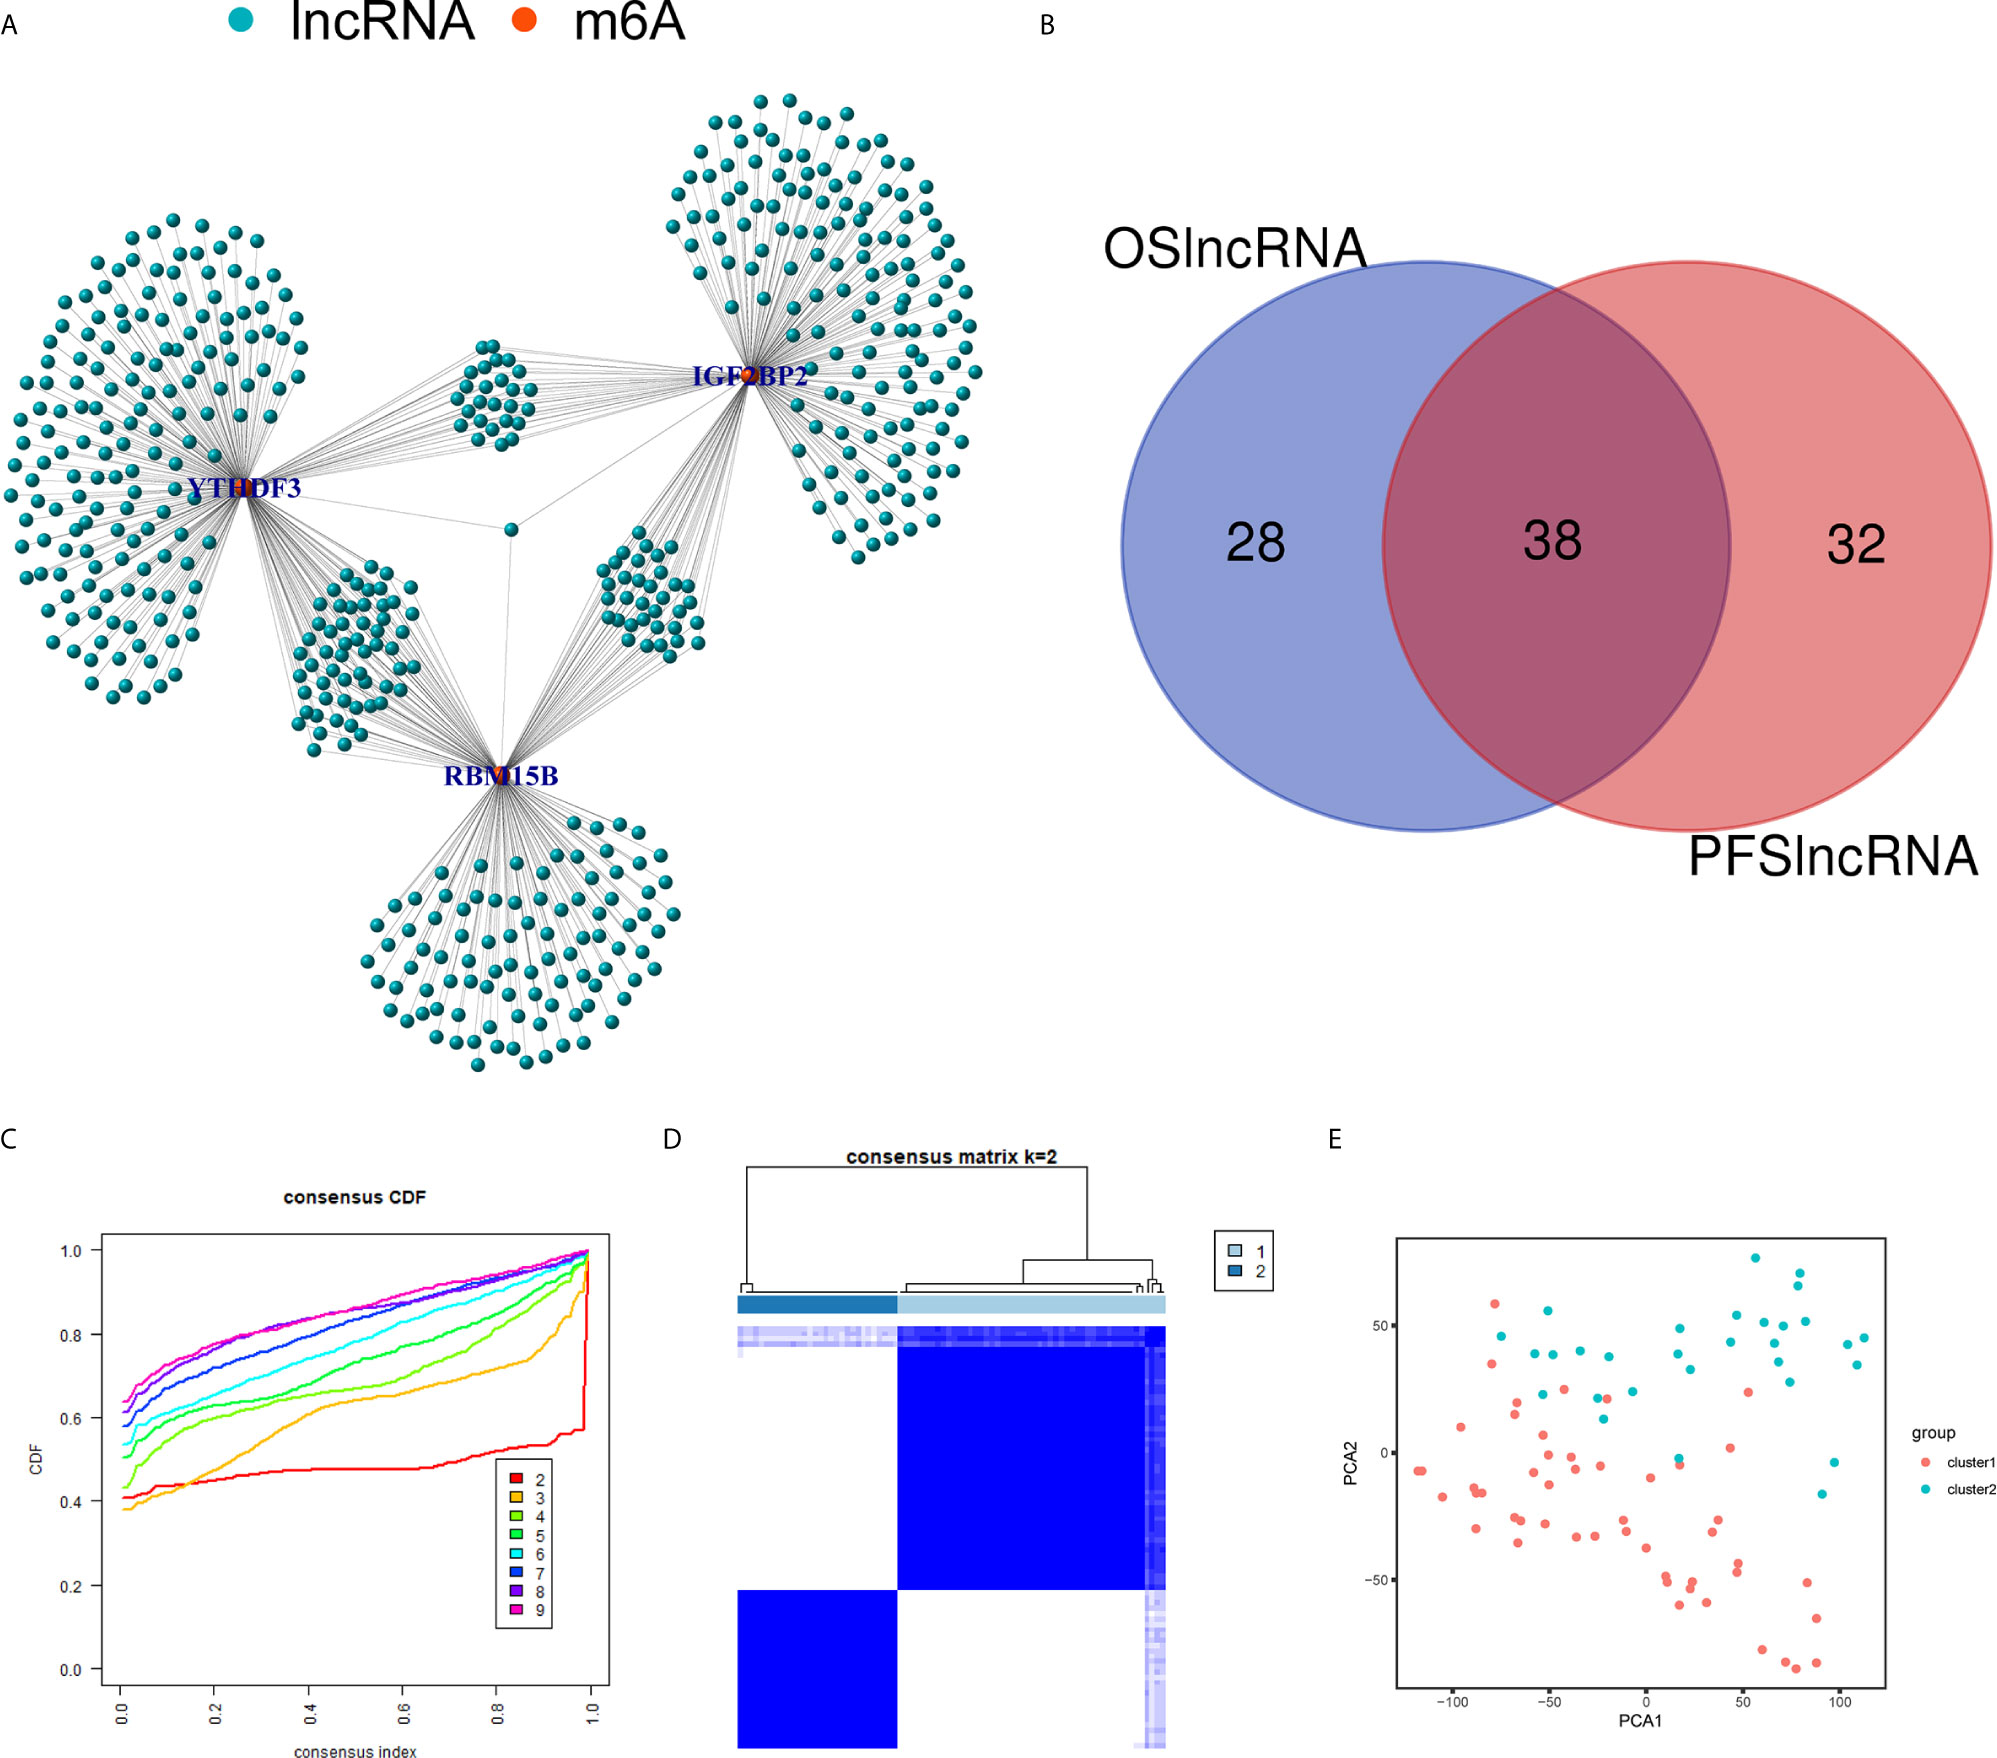
Figure 6 Identification of m6A regulators-related lncRNAs. (A) The network between the 3 m6A regulators (red dots) and lncRNAs (green dots). (B) The Venn plot showed 38 common lncRNAs shared by OS-related lncRNAs and PFS-related lncRNAs. (C) Consensus clustering cumulative distribution function (CDF) for k = 2 to 9. (D) Consensus clustering matrix for k = 2. (E) Principal component analysis (PCA) of 2 subtypes based on 38 lncRNAs for each sample. OS, overall survival; PFS, progression free survival.
The TME scores of cluster 1 were lower than those of cluster 2 (Figures 7A–C), while the OS (Figure 7D) and PFS (Figure 7E) of cluster 1 were notably longer than those of cluster 2. Subsequently, the 22 immune cell levels for the two subtypes were calculated. The results showed that cluster 1 had higher immune infiltration levels of plasma cells, and monocytes while there were higher immune cell infiltration levels of activated memory CD4+ T cells, follicular helper T cells, M1 macrophages, and resting dendritic cells (Figure 7F).
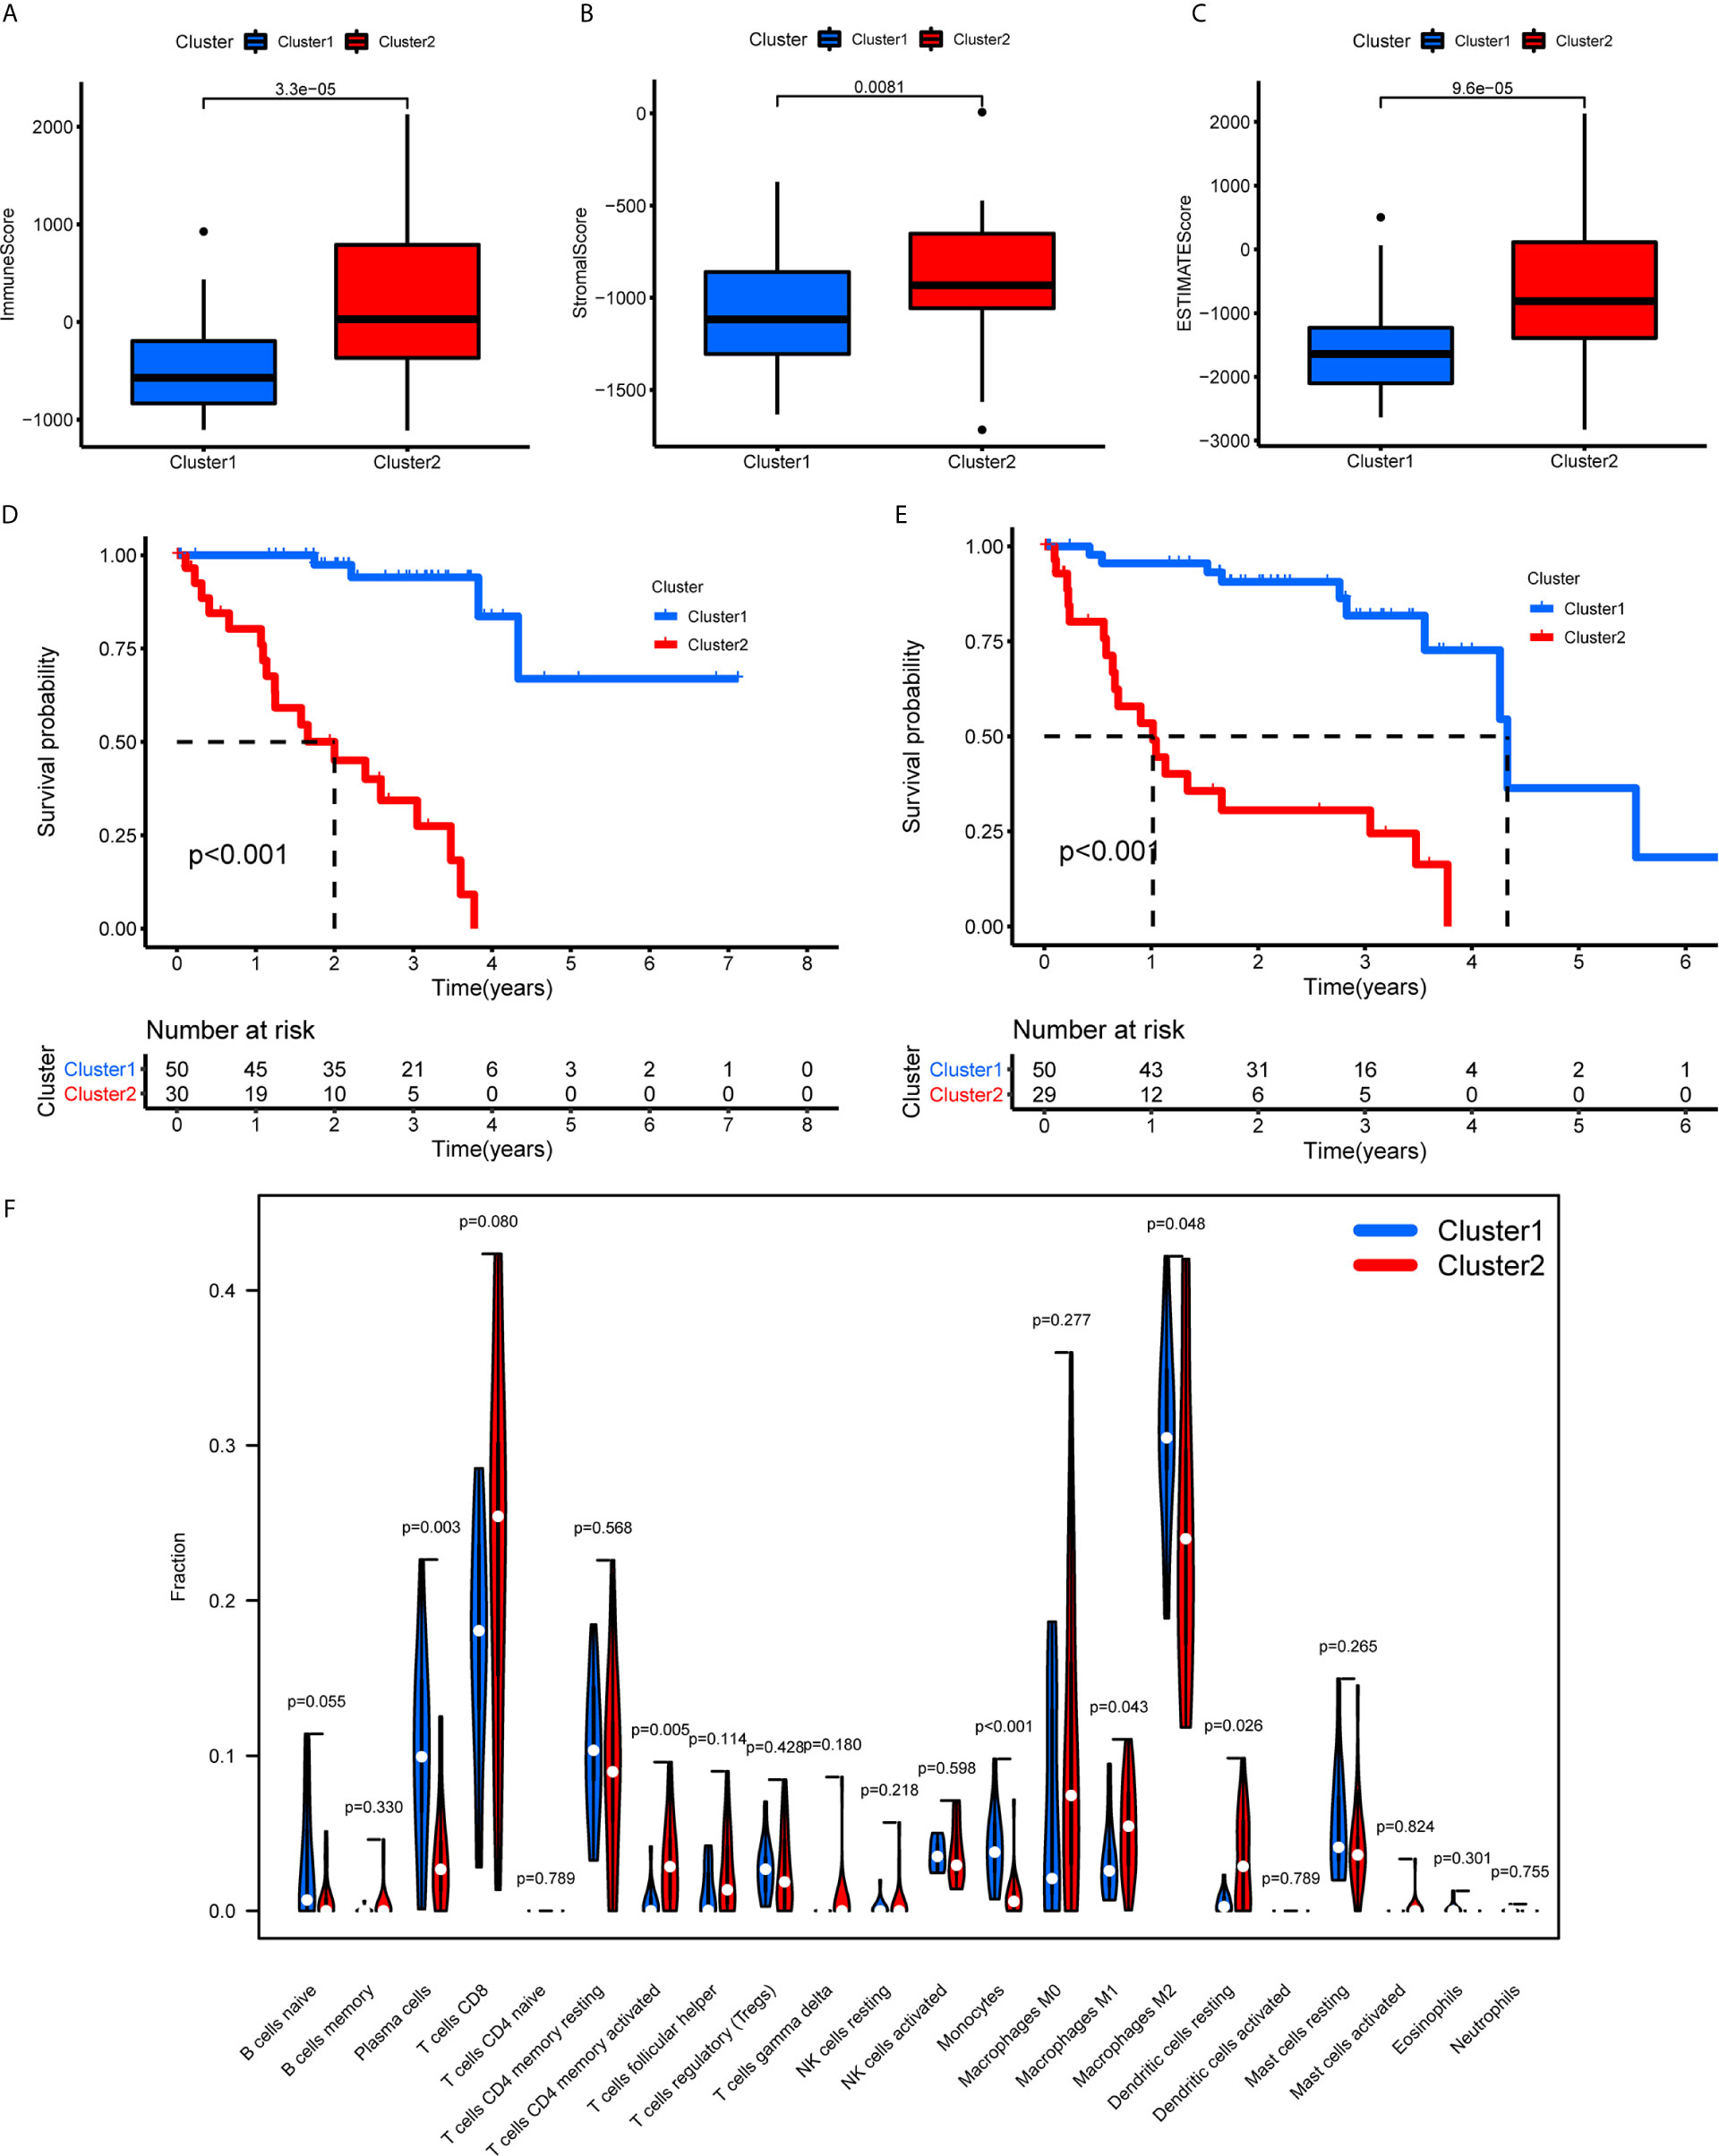
Figure 7 TME scores, survival analysis for UM, and TICs in cluster 1/2 subtypes constructed by 38 m6A regulators-related lncRNAs. (A–C) The variance analysis of ImmuneScore (A), StromalScore (B), and ESTIMATEScore (C) in cluster 1/2 subtypes. (D, E) Kaplan-Meier survival analysis of OS (D) and PFS (E) for patients with UM in cluster 1/2 subtypes. (F) The violin plot showed the fraction differentiation of 22 kinds of immune cells in cluster 1/2 subtypes. TICs, tumor-infiltrating immune cells; OS, overall survival; PFS, progression free survival.
Identification and Validation of Immune Genes Shared by 5 LncRNAs
First, we identified the common lncRNAs from 5 lists that were DEGs in ImmuneScore (Immune-DEGs) and StromalScore (Stromal-DEGs), m6A regulators-related lncRNAs (m6A-lncRNAs), and immune gene-specific lncRNAs based on OS (OS-immune) and PFS (PFS-immune). A total of 5 lncRNAs, namely AC008555.4, AC018529.1, AC104129.1, CYTOR, and MIR4435-2HG, were found to be common across the 5 lists (Figure 8A). High expression of AC018529.1 (Figure 8B), MIR4435-2HG (Figure 8C), AC104129.1 (Figure 8D), and CYTOR (Figure 8F) was related to the poor prognosis of patients, while high expression of AC008555.4 was associated with good prognosis (Figure 8E). Next, 13 immune genes having 5 common lncRNAs were screened using the correlation analysis (Figure 9A). The 13 immune genes were ADGRE5, C2, CD79B, CTSC, GEM, JAG2, LYN, MAFB, MBP, MR1, PREX1, RUNX1, and TCF12. Except for C2, the other 12 immune genes were associated with a poor prognosis (Figures 9B–M). To further verify whether the immune genes were differentially expressed in different groups based on m6A regulators and lncRNAs, we extracted the expression data from RNA-Seq data and performed the differential expression analysis. The expression levels of 13 immune genes in the high-risk group were upregulated than those in the low-risk group (Figure 10). Similarly, the 13 immune genes levels in cluster 2 were upregulated compared with cluster 1 (Figure 11). For further validation, we used TISCH to depict the expression distribution of 13 immune genes in the TME of UM. The overall distribution of the 3 cell types in the GSE139829 dataset was shown in Figure 12A. Through analysis, we found that the expression distribution of ADGRE5 (Figure 12B), CTSC (Figure 12E), LYN (Figure 12H), MAFB (Figure 12I), PREX1 (Figure 12L), and RUNX1 (Figure 12M) were abundant in immune cells. CD79B (Figure 12D), GEM (Figure 12F), and JAG2 (Figure 12G) expression distribution were concentrated in malignant cells. The gene expression of C2 (Figure 12C), MBP (Figure 12J), MR1 (Figure 12K), and TCF12 (Figure 12N) were evenly distributed in immune cells and malignant cells. These results suggested that these immune genes may be the downstream regulators of m6A regulators and related lncRNAs participated in TME remodeling.
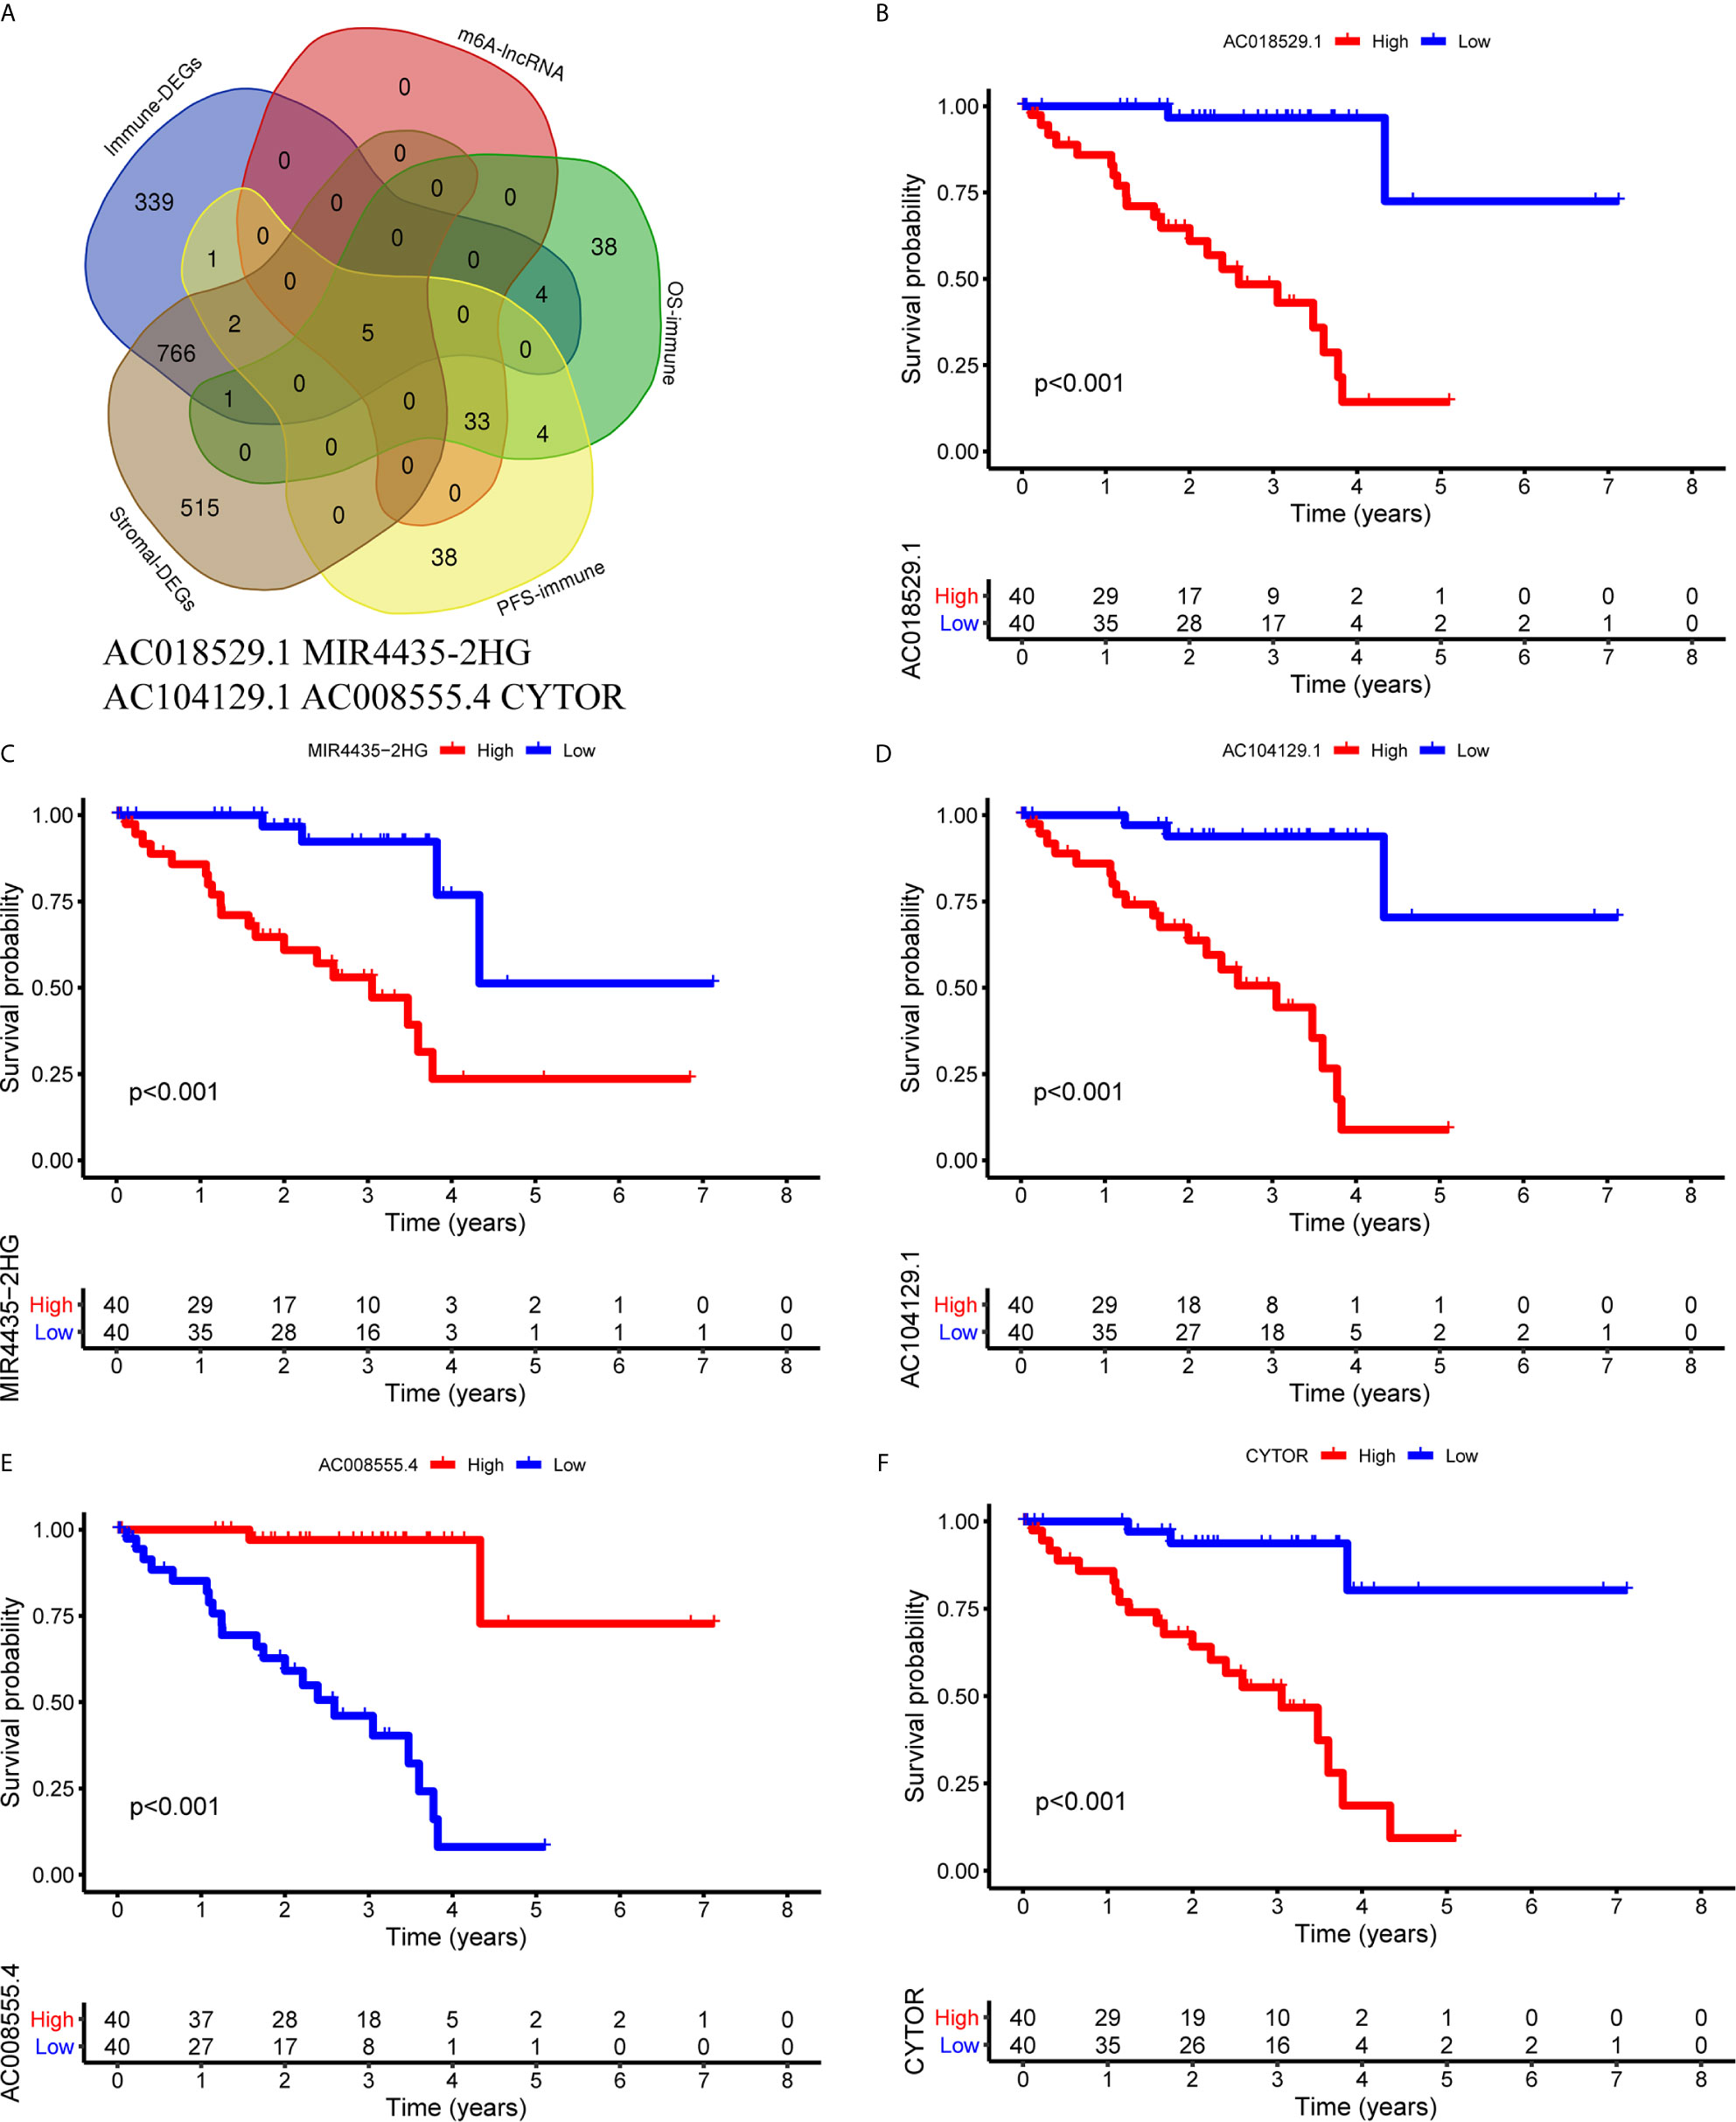
Figure 8 Identification of common lncRNAs from 5 lists. (A) The Venn plot showed 5 common lncRNAs in 5 lists. They were ImmuneScore (Immune-DEGs) and StromalScore (Stromal-DEGs), m6A regulators-related lncRNAs (m6A-lncRNAs), and immune gene-specific lncRNAs based on OS (OS-immune) and PFS (PFS-immune). (B–F) Survival curves based on the high or low expression of AC018529.1 (B), MIR4435-2HG (C), AC104129.1 (D), AC008555.4 (E), and CYTOR (F). DEGs, differentially expressed genes.
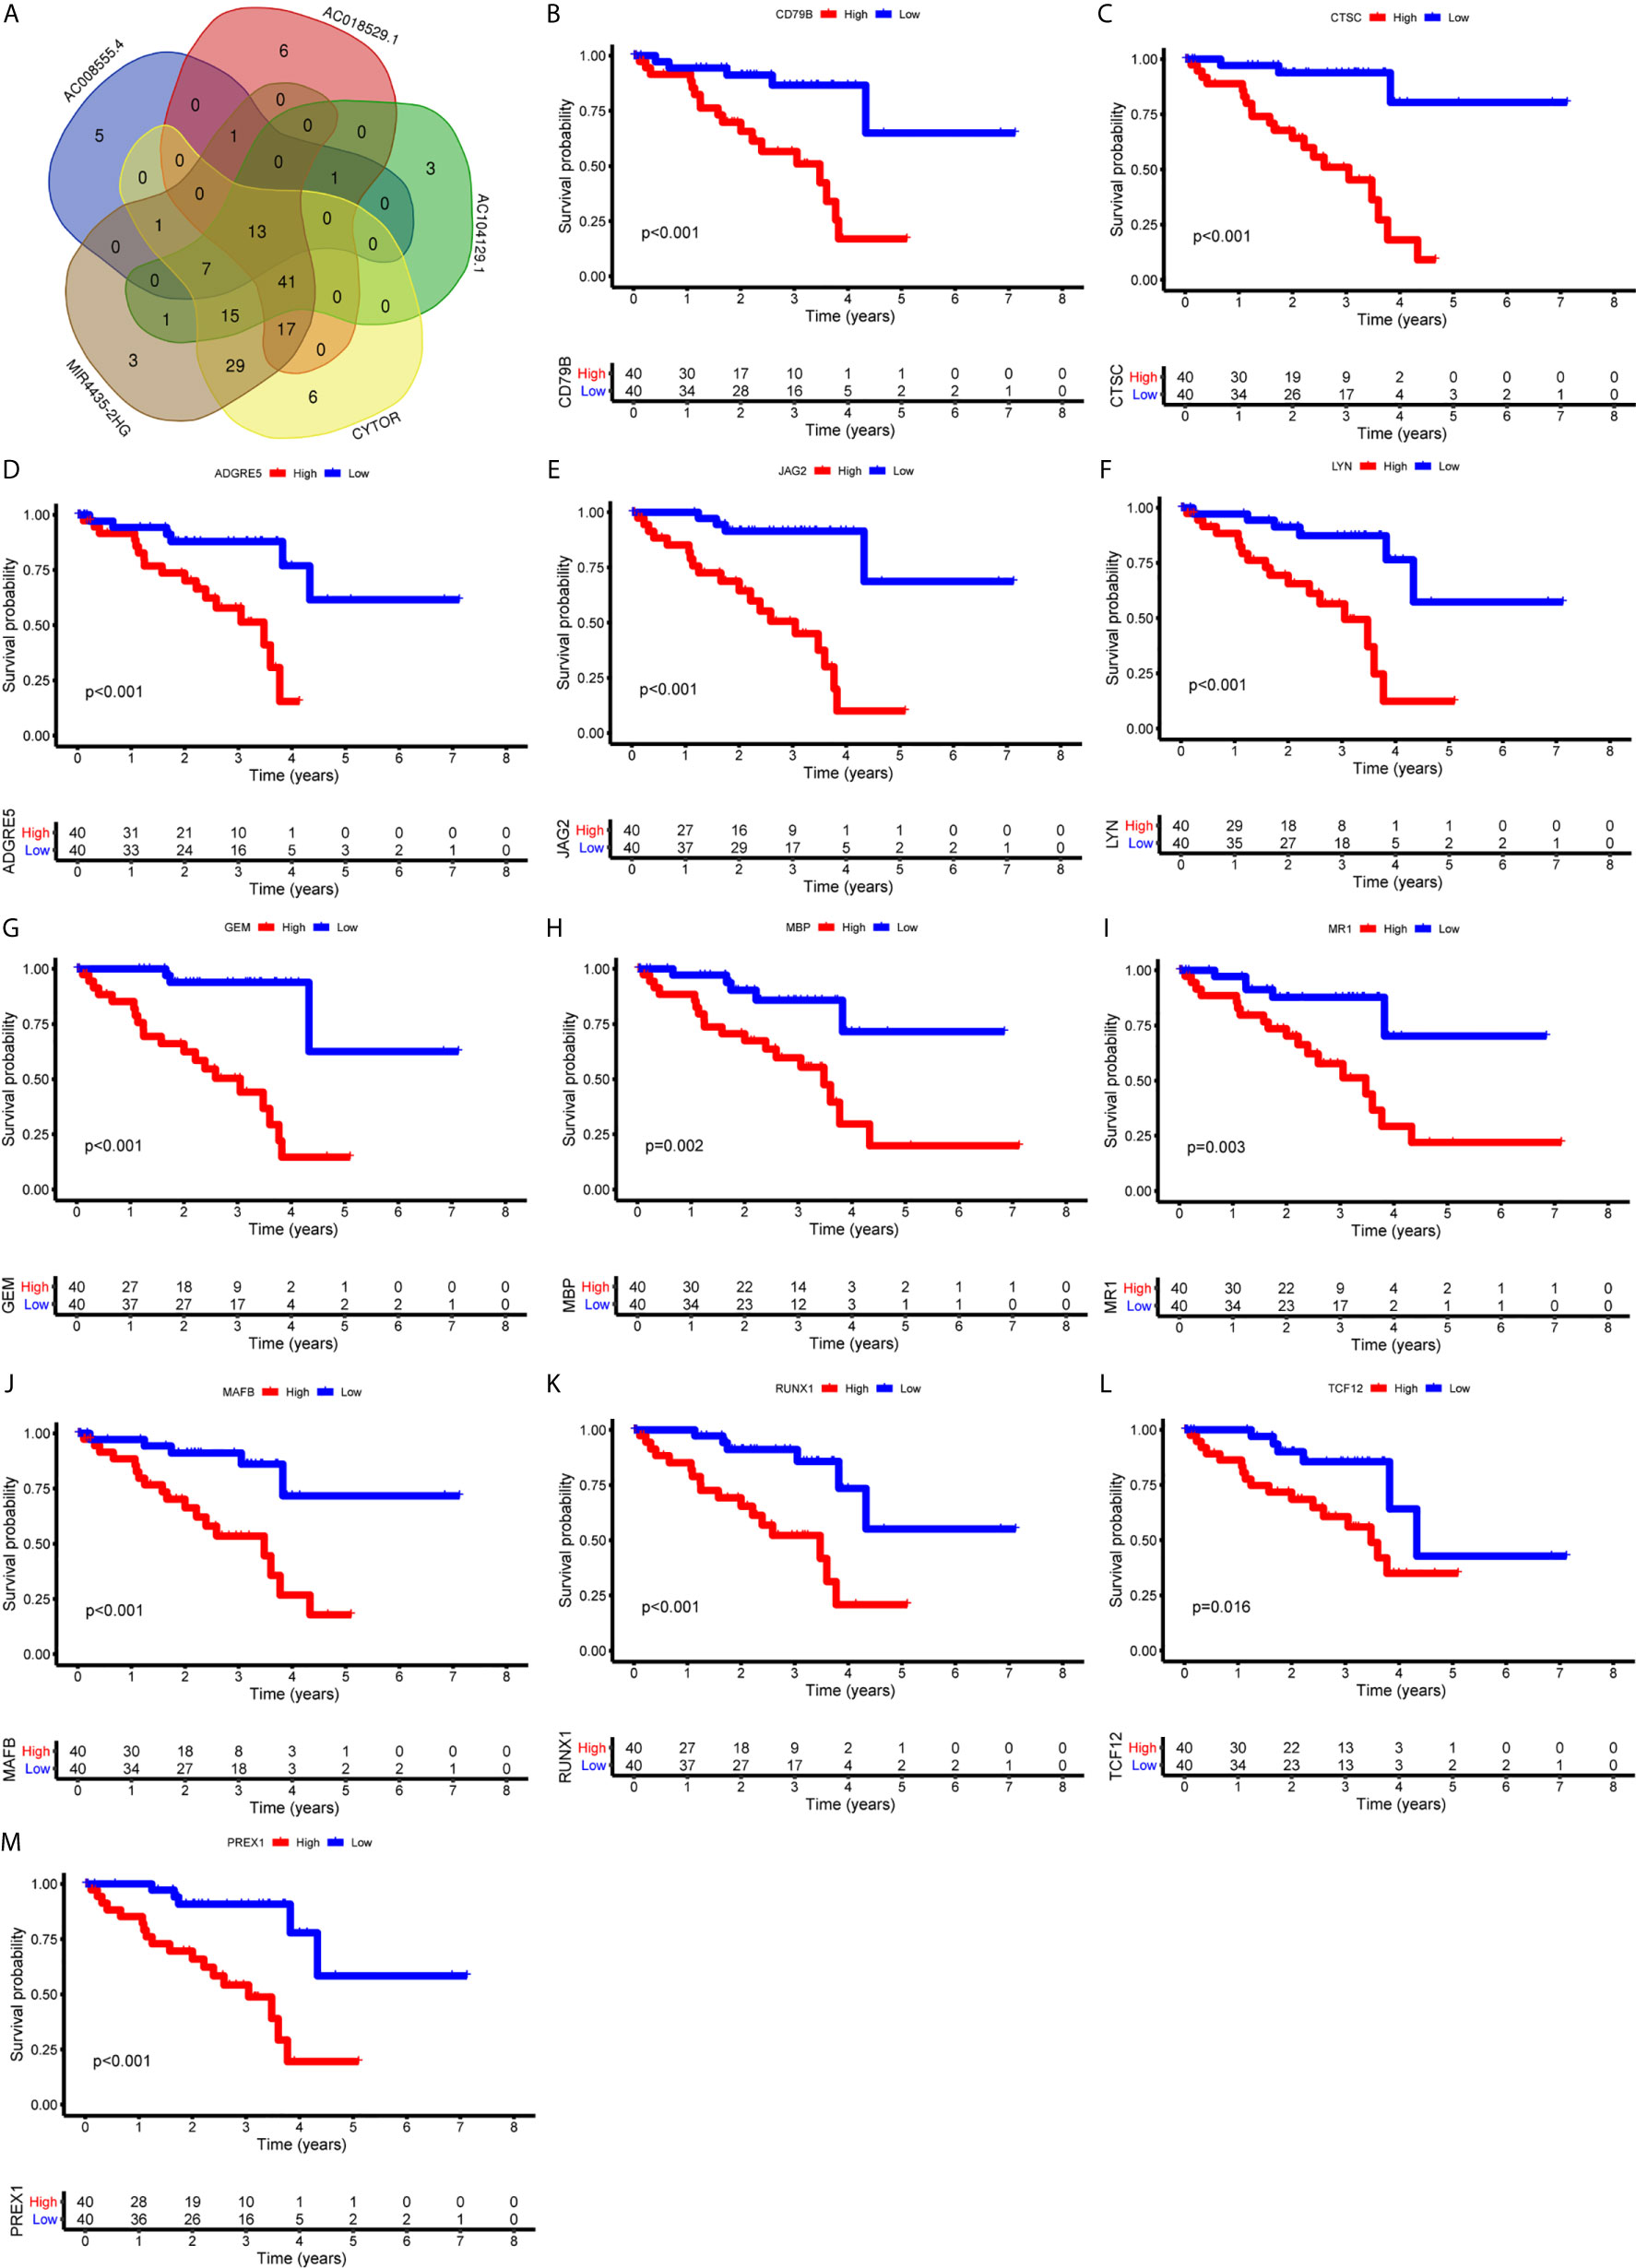
Figure 9 Identification of immune genes targeted by lncRNAs. (A) 13 immune genes shared by 5 lncRNAs were identified. (B-M) Survival curves based on the high or low expression of CD79B (B), CTSC (C), ADGRE5 (D), JAG2 (E), LYN (F), GEM (G), MBP (H), MR1 (I), MAFB (J), RUNX1 (K), TCF12 (L), and PREX1 (M). High expression of these immune genes was associated with a poor prognosis.
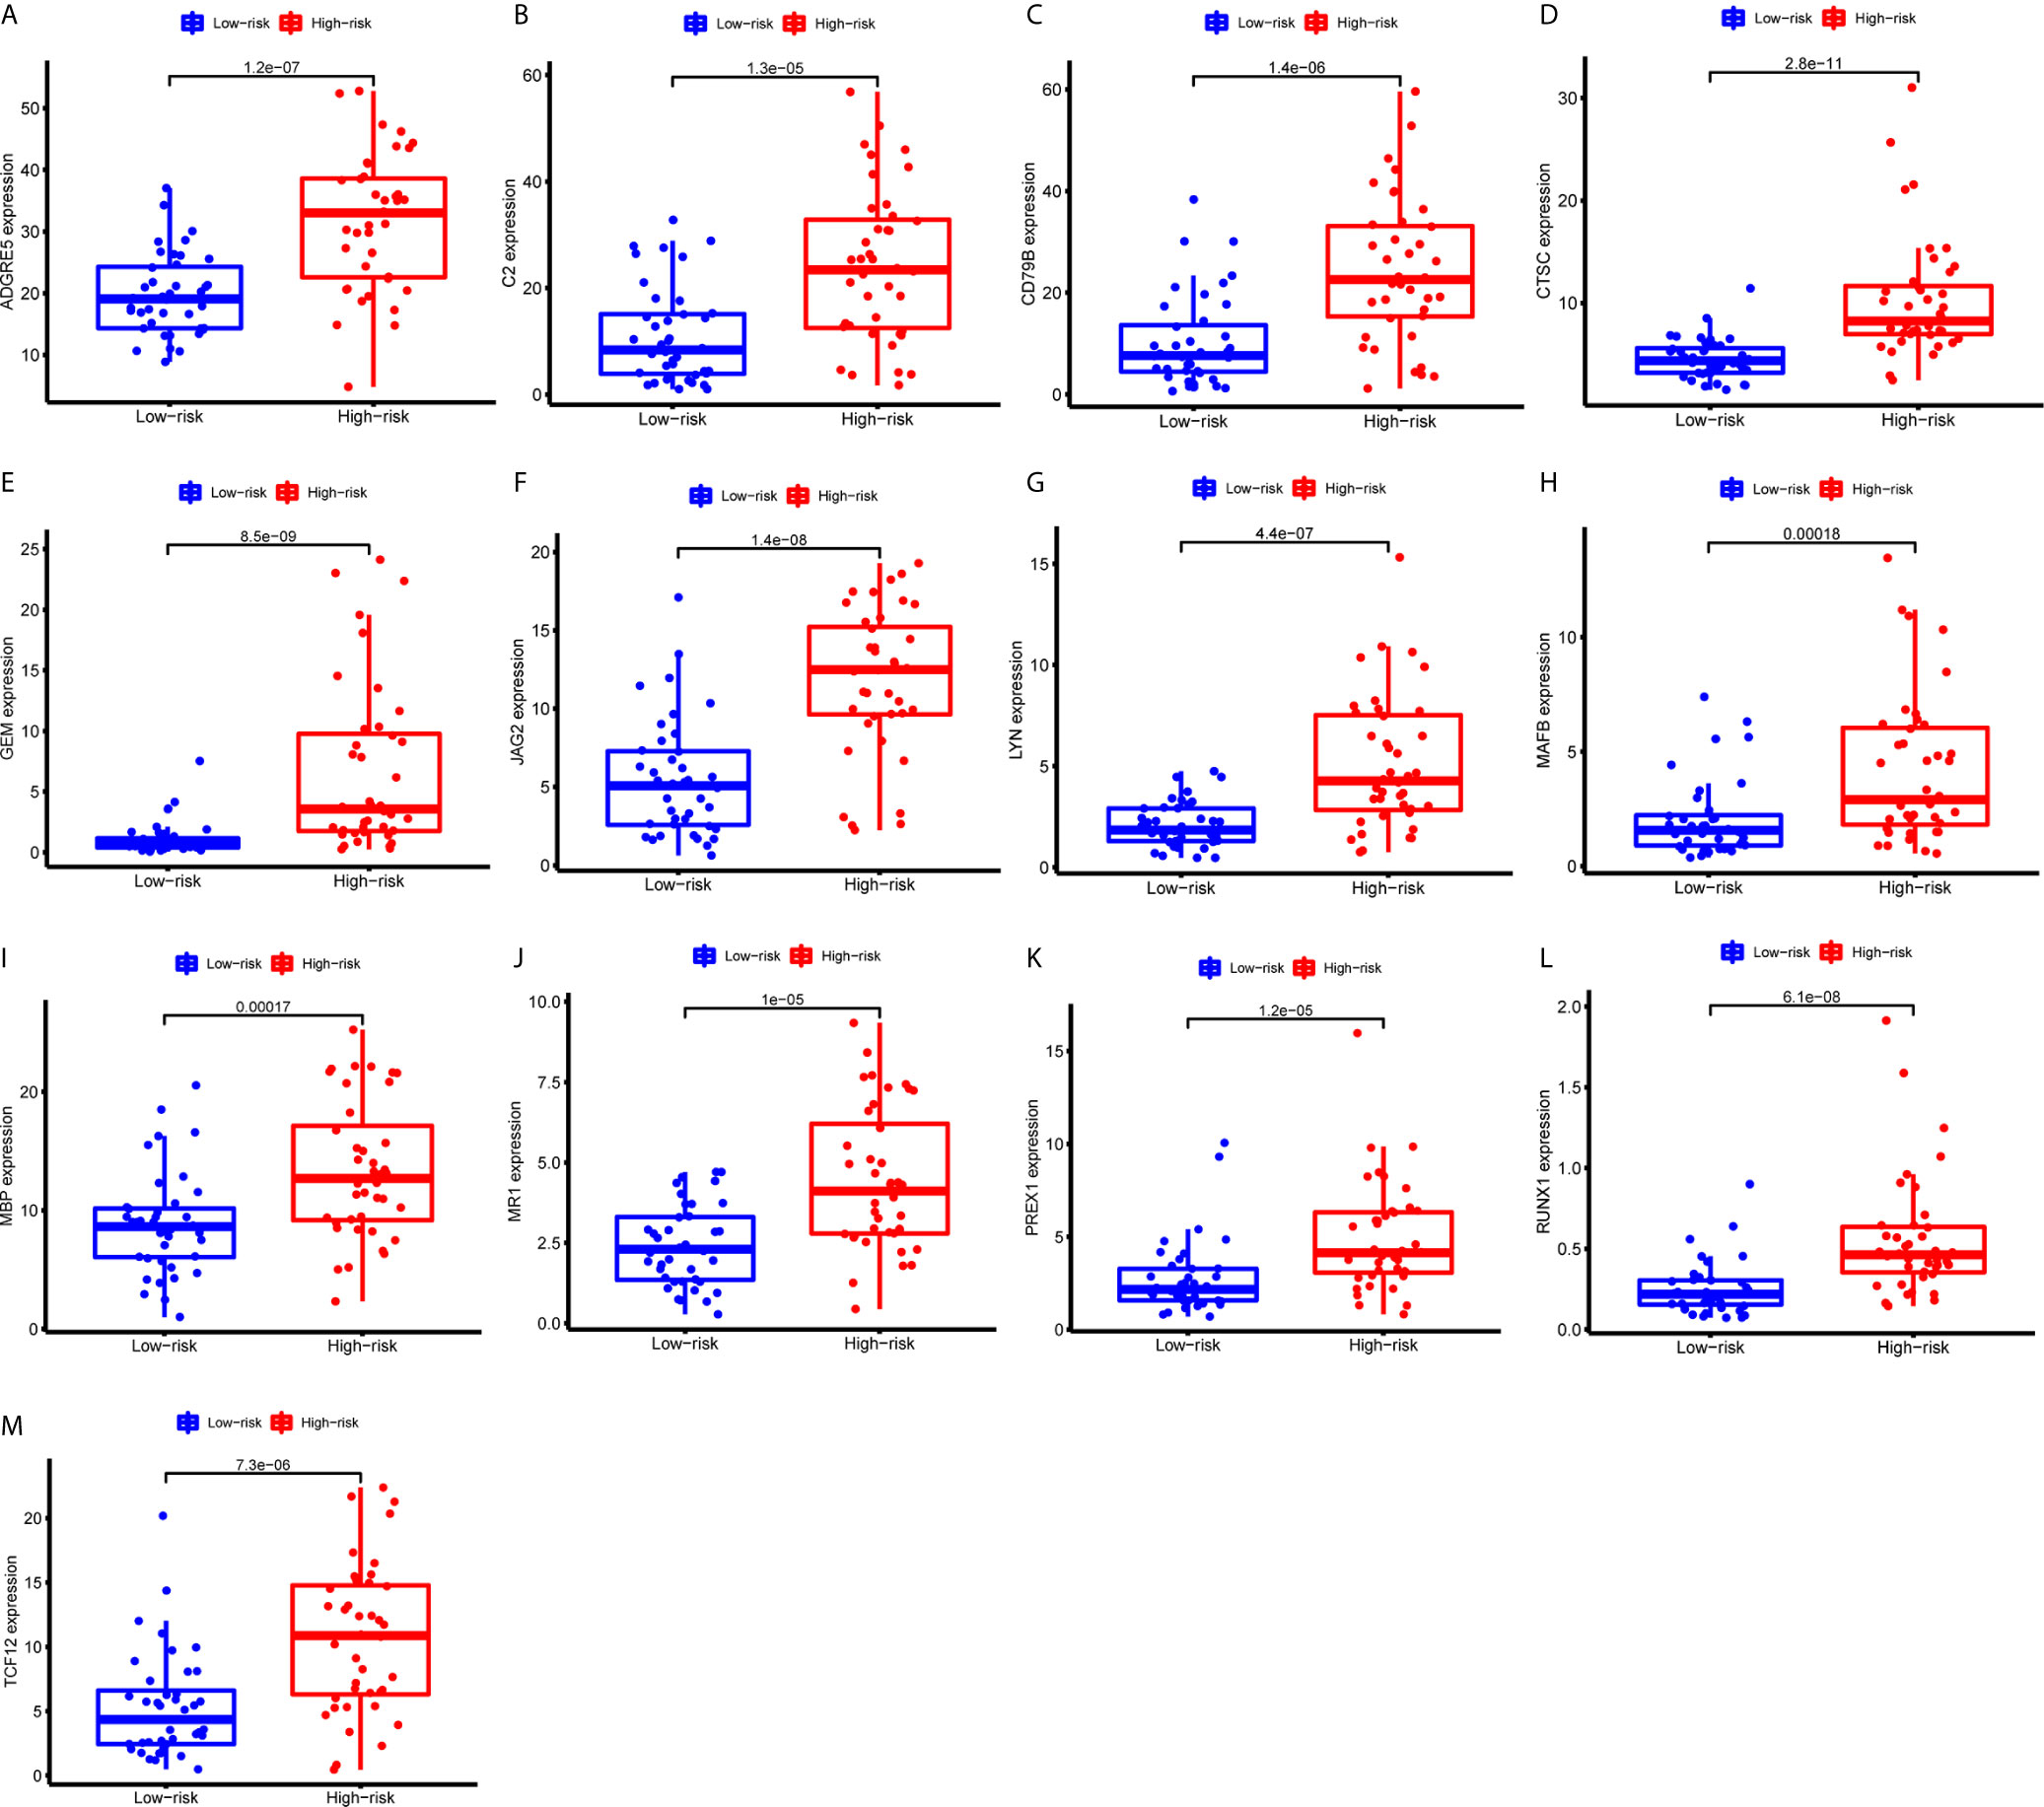
Figure 10 Expression of the 13 immune genes in the high- or low-risk groups based on 3 m6A regulators. (A-M) The differential expression analysis of ADGRE5 (A), C2 (B), CD79B (C), CTSC (D), GEM (E), JAG2 (F), LYN (G), MAFB (H), MBP (I), MR1 (J), PREX1 (K), RUNX1 (L), and TCF12 (M) between the high- and low-risk groups. The expression levels of 13 immune genes were all upregulated in the high-risk group than those in the low-risk group.
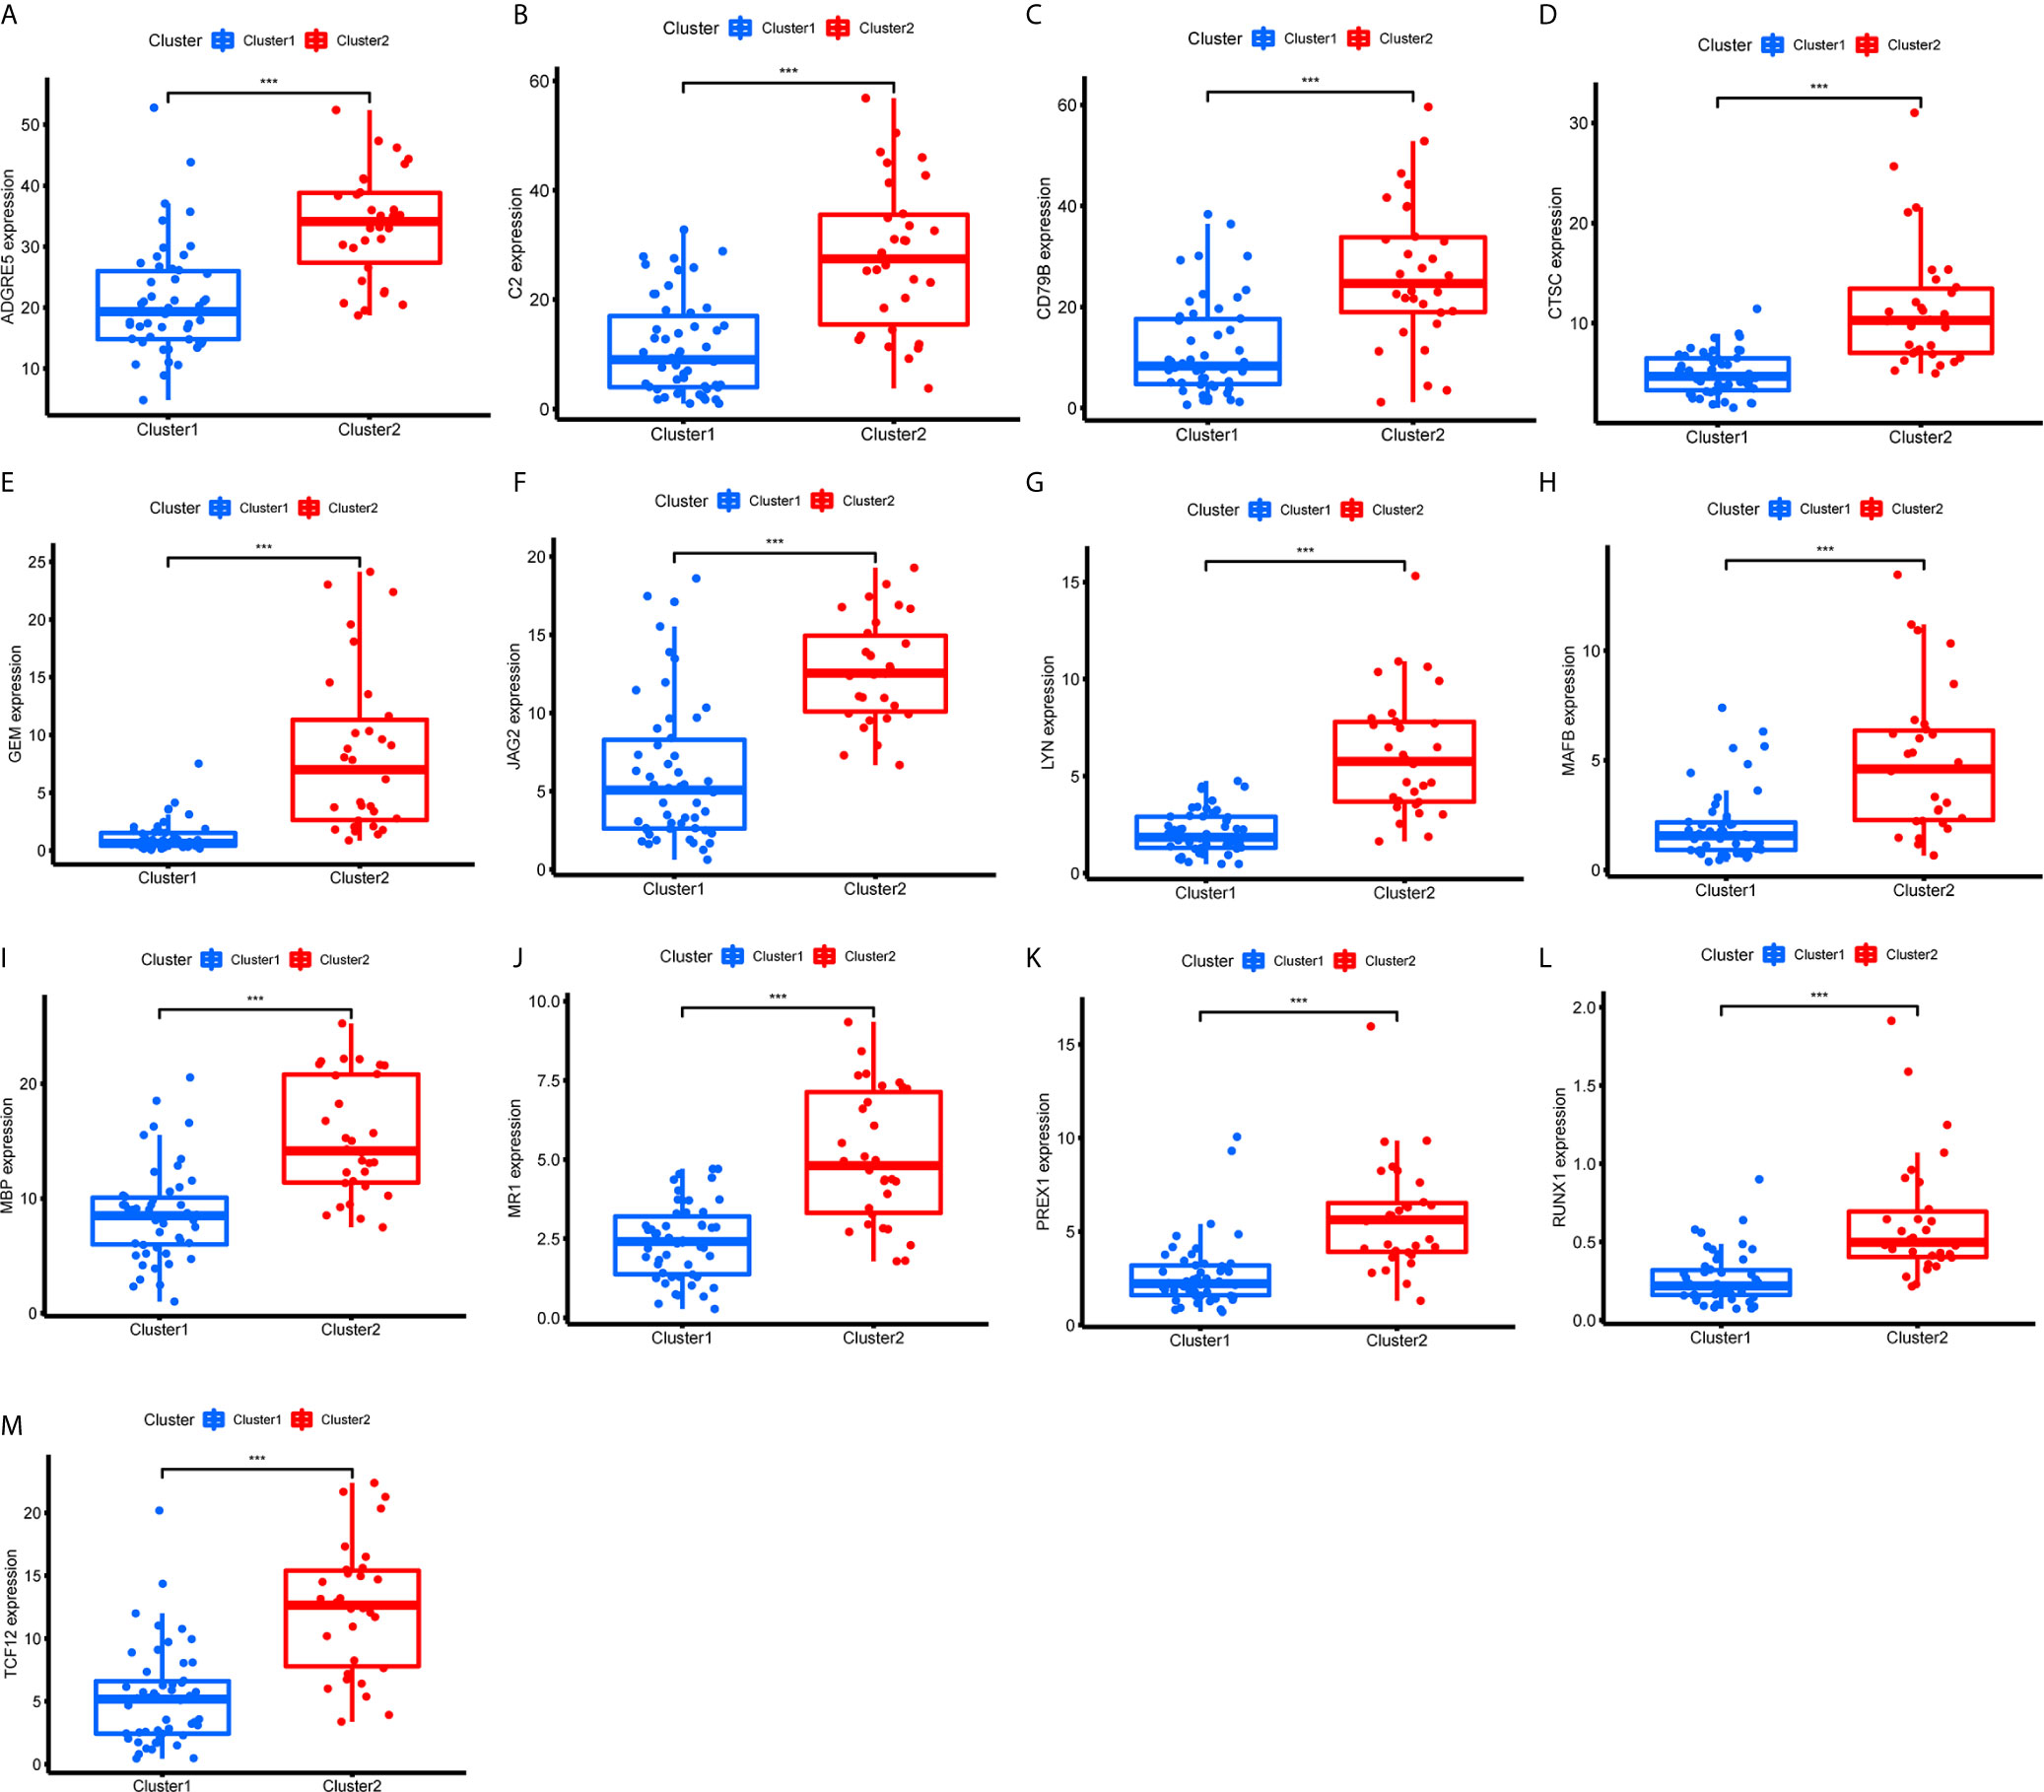
Figure 11 Expression of the 13 immune genes in cluster 1/2 based on m6A-related lncRNAs. (A–M) The differential expression analysis of ADGRE5 (A), C2 (B), CD79B (C), CTSC (D), GEM (E), JAG2 (F), LYN (G), MAFB (H), MBP (I), MR1 (J), PREX1 (K), RUNX1 (L), and TCF12 (M) between cluster 1 and cluster 2. The expression levels of 13 immune genes in cluster 2 were significantly increased compared with those in cluster 1. ***P < 0.001.
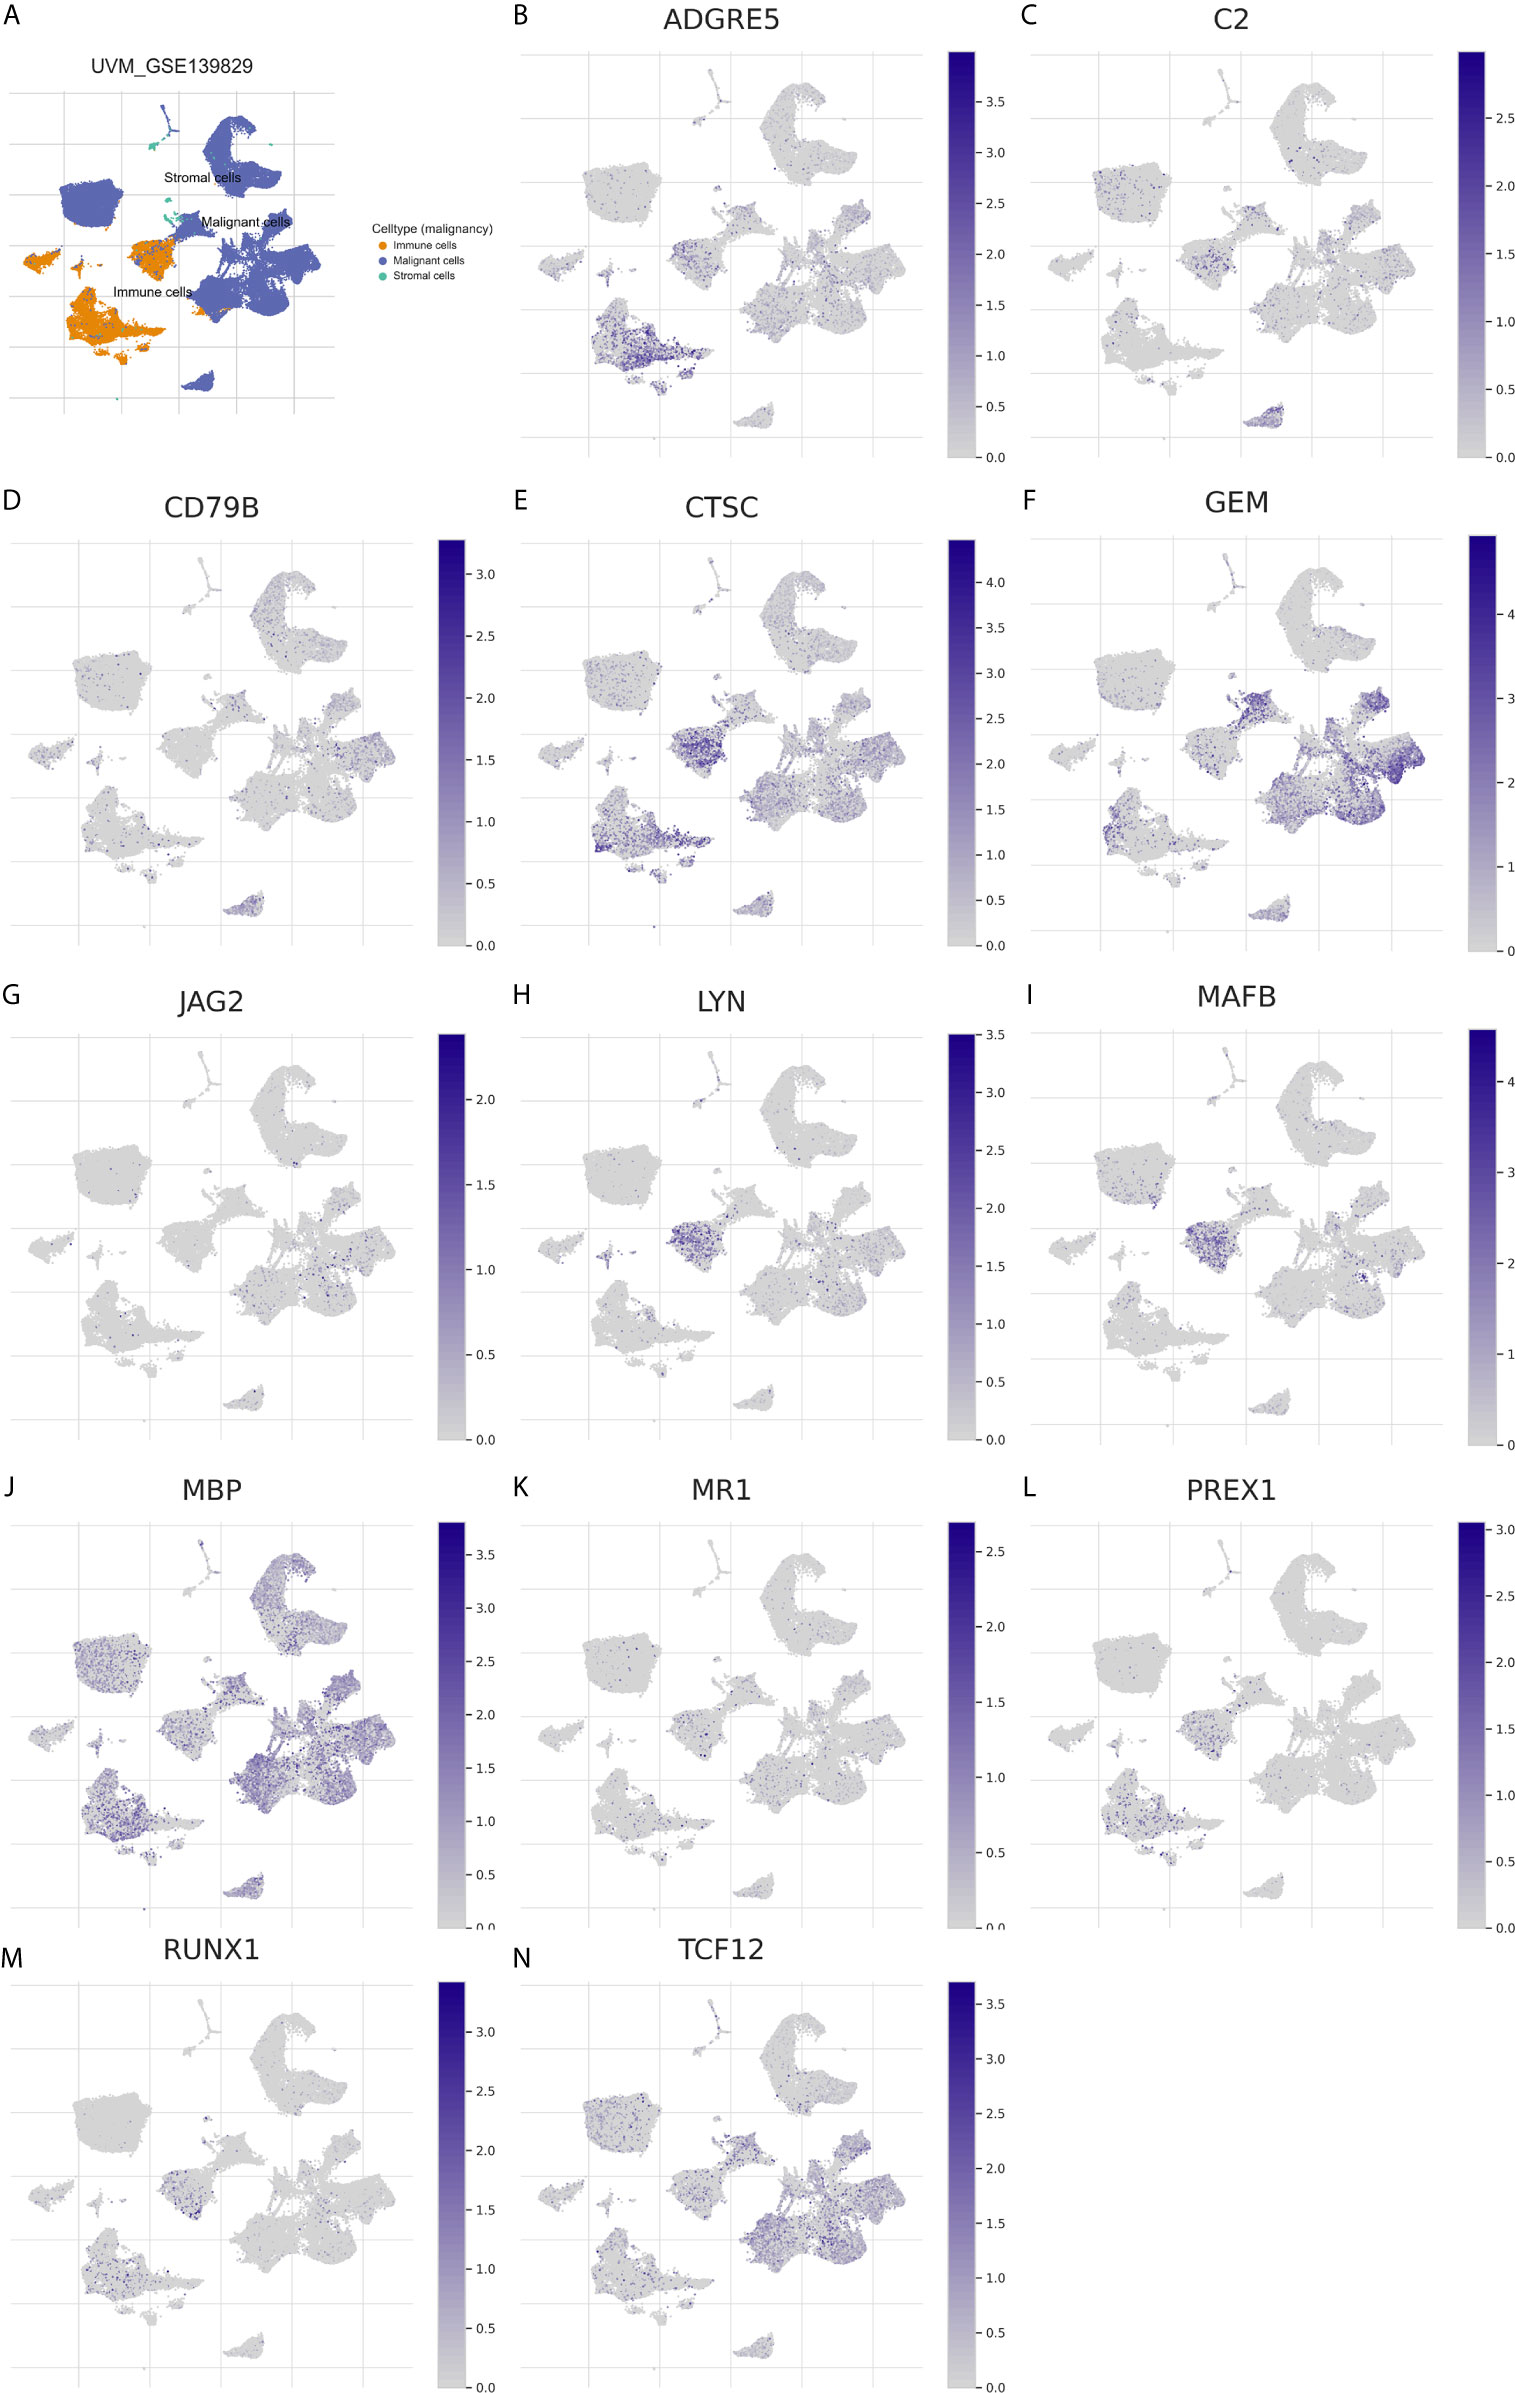
Figure 12 Expression distribution of the 13 immune genes in TME of UM. (A) The overview tab of 3 cell types from the GSE139829 dataset. The colored shapes (left) showed the cell distribution and the cell type annotations were displayed on the right side. orange dot: immune cells; blue dot: malignant cells; green dot: stromal cells. (B–N) The expression distribution of ADGRE5 (B), C2 (C), CD79B (D), CTSC (E), GEM (F), JAG2 (G), LYN (H), MAFB (I), MBP (J), MR1 (K), PREX1 (L), RUNX1 (M), and TCF12 (N) in 3 cell types. The colored dots indicate the distribution of immune genes in the corresponding cell type.
Discussion
The TME plays a key role in different stages of tumorigenesis. Eyes are an immune-privileged site but inflammation can develop in an ocular tumor TME (24). UM is homogeneous without much stromal tissue, and therefore, it may be affected by immune cells (25). Compared with other malignancies, the presence of infiltrating macrophages and T cells in UM is associated with a poorer rather than a better prognosis (25), which was consistent with our findings. Moreover, previous studies have suggested that tumor-infiltrating macrophages and T cells are independent predictors for the prognosis of patients with UM (26, 27). In this study, results of the transcriptome analysis of UM data indicated that UM patients with high ImmuneScore had a poor prognosis. Besides, ImmuneScore was found to be significantly associated with many TICs such as T cells and macrophages. These results suggested that the TME played an important role in UM. Clarifying the mechanisms of the TME will provide novel insight into the development of highly effective immunotherapeutic strategies.
Post-transcriptional regulation is important for regulating the gene expression processes, which determine cellular function. Decades of research have identified more than 100 types of ribonucleosides that are post-transcriptionally modified (28). m6A methylation is one of the most prevalent post-transcriptional modifications found in eukaryotic mRNAs and lncRNAs (28, 29). More studies have reported that m6A regulators extensively participate in diverse biological processes and prognoses in different cancers (13, 14, 30, 31). A recent study has suggested that METTL3-mediated m6A methylation modulates UM cell proliferation, migration, and invasion by targeting c-Met (32). As far as we know, the role of m6A methylation in UM has less been studied, and the effect of m6A methylation on the TME of UM has not been fully understood.
In this study, we found that m6A regulators were related to the prognosis and TME of patients with UM. We established a prognostic risk signature using 3 m6A regulators based on OS. The signature helped differentiate UM patients into high- and low-risk groups and could serve as an independent risk factor for UM prognosis. The high-risk group was positively correlated with immune cell infiltration levels. Among the 3 m6A regulators, IGF2BP2 acts as m6A readers to enhance mRNA stability and translation and plays an important role in tumors (33). YTHDF3 functions as oncogenes in breast cancer (34). A recent study has investigated that ocular melanoma samples show decreased m6A levels, indicating a poor prognosis (35). In our study, patients with high RBM15B expression had a good prognosis. RBM15B acts as a methyltransferase and thus promotes the level of m6A RNA methylation. Therefore, it is reasonable to speculate that high levels of m6A methylation are beneficial to patients’ survival, which is consistent with the current study. These findings indicated that m6A regulators played an important role in the development and progression of cancer. However, the underlying mechanisms of m6A in tumor development still need to be further clarified.
Currently, some studies have clarified the role of lncRNAs in UM. Among these lncRNAs, lncRNA PVT1 and R2RX7-V3 function as novel oncogenes and promote tumorigenesis (36, 37), whereas lncRNAs CANT1 and PAUPAR suppress tumorigenesis in malignant UM (38, 39). However, no study has analyzed the effect of m6A regulators-related lncRNAs on the TME and prognosis in UM. Here we identified m6A regulators-related lncRNAs by performing the correlation analysis and further screened lncRNAs based on OS and PFS. The cluster 1/2 subtypes identified through consensus clustering based on the expression of m6A regulators-related lncRNAs were also related to ImmuneScore, the prognosis of patients, and immune cell infiltration levels. Finally, 5 m6A regulators-related lncRNAs were found to be associated with the OS of UM patients. Among the 5 lncRNAs, lncRNA MIR4435-2HG targets desmoplakin and promotes growth and metastasis of gastric cancer by activating Wnt/β-catenin signaling (40). LncRNA-CYTOR and Wnt/β-Catenin signaling form a positive feed-forward loop to promote the metastasis of colon cancer (41). Through the correlation analysis, we screened 13 downstream immune genes targeted by 5 lncRNAs. They were all found to be upregulated in the high-risk group and cluster 2. At present, RUNX1, MR1, and PREX1 have been reported to be associated with T cells (42–44). CD79B is an important driver of immune-privileged site-associated diffuse large B cell lymphoma (45). JAG2 has been found to be overexpressed in malignant plasma cells from multiple myeloma patients and cell lines (46). These results suggested that lncRNAs may affect the immune cell infiltration through 13 common immune genes. Finally, we constructed a Sankey diagram that depicted the relationship between m6A methylation regulators, lncRNAs, and immune genes (Figure 13). These findings require further validation and may provide invaluable insights into the future treatment of patients with UM.
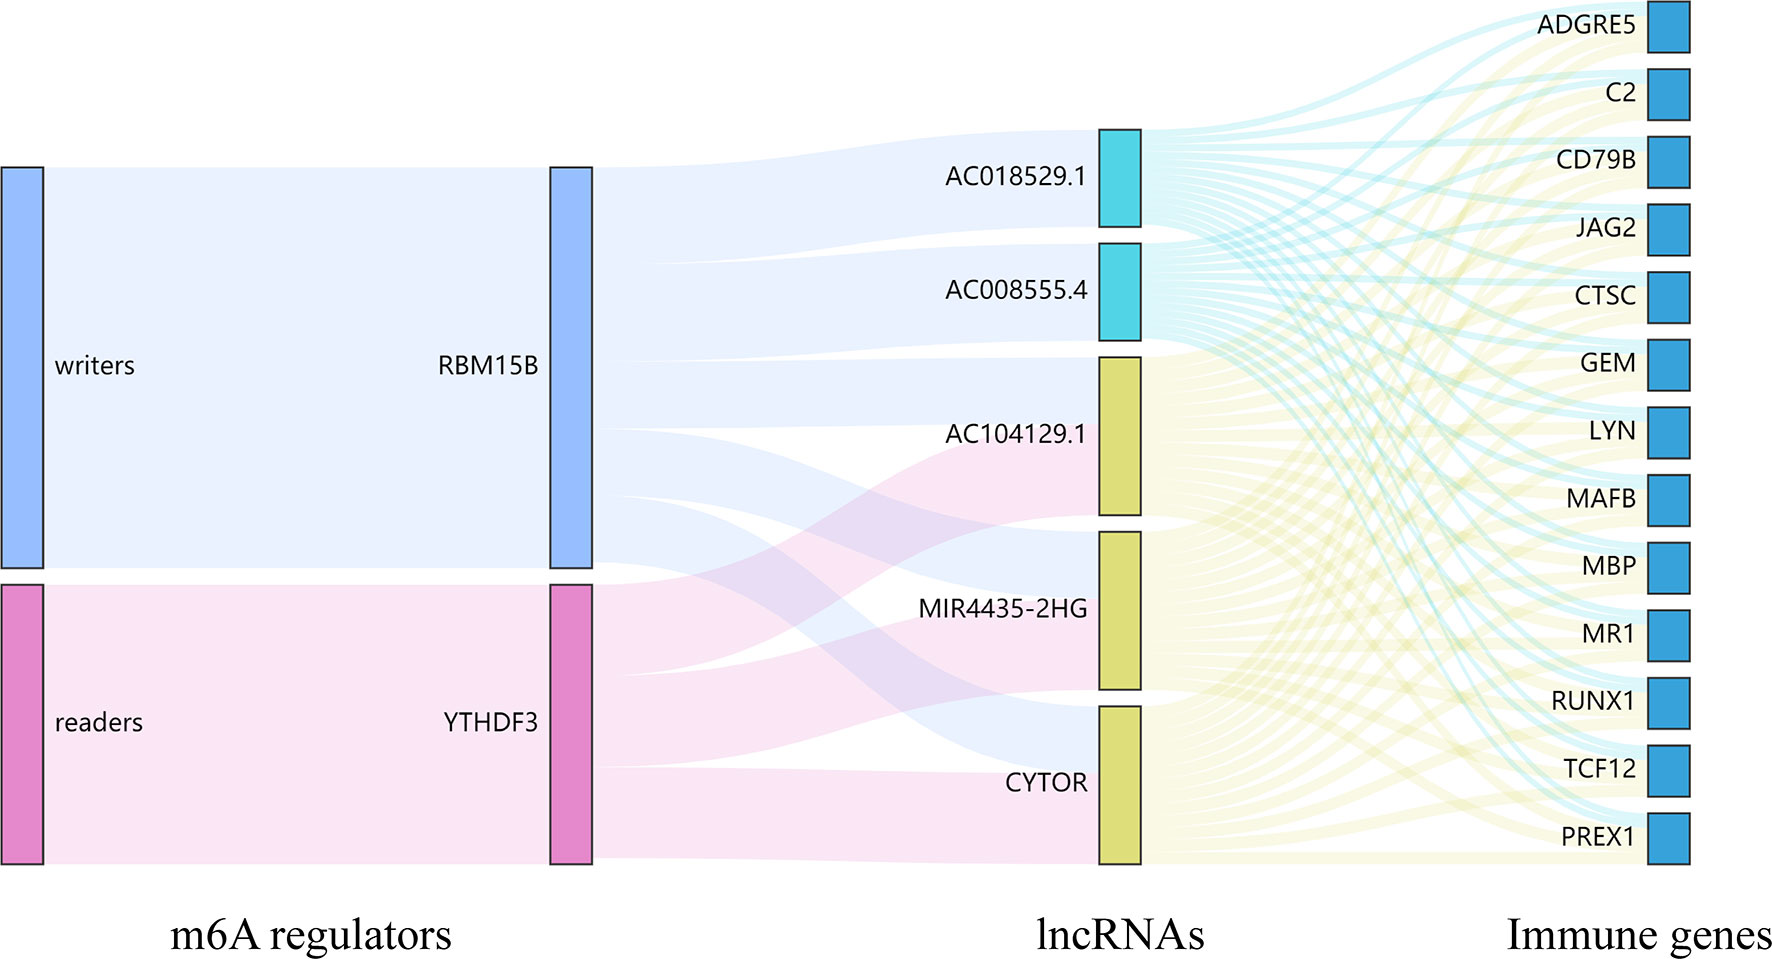
Figure 13 The Sankey diagram depicted the relationship between 2 m6A regulators, 5 lncRNAs, and 13 immune genes. m6A readers: YTHDF3; m6A writers: RBM15B; lncRNAs: AC008555.4, AC018529.1, AC104129.1, CYTOR, and MIR4435-2HG; immune genes: ADGRE5, C2, CD79B, CTSC, GEM, JAG2, LYN, MAFB, MBP, MR1, PREX1, RUNX1, and TCF12.
m6A methylation is a prevalent form of RNA modification that may provide a novel approach for tumor treatment. However, many key aspects, such as the regulatory mechanisms of m6A regulators and the unidentified relationship between m6A regulators and TME, remain to be explored. Therefore, in this study, we systematically explored the relationship between m6A regulators with the prognosis and TME in UM, further identified the potential lncRNAs and immune genes. However, further validation based on more clinical samples is required, and thus clinical samples will be collected to determine the level of m6A methylation and the association between the expression of m6A regulators and patients’ survival in the future. Furthermore, the downstream regulatory mechanisms of m6A regulators will be investigated to screen possible targets by methylated RNA immunoprecipitation sequencing (MeRIP-seq) and RNA-binding protein immunoprecipitation-quantitative polymerase chain reaction (RIP-qPCR). Tumorigenesis in animals and phenotypes of cell lines are necessary to explore the function of m6A regulators in this process.
In conclusion, our study provided an m6A regulators-based signature for prognostic prediction of UM and confirmed that m6A regulators and related lncRNAs played an important role in TME remodeling. These findings might provide promising targets for improving the survival of UM patients.
Data Availability Statement
The datasets analysed for this study can be found in The Cancer Genome Atlas (https://portal.gdc.cancer.gov/).
Author Contributions
ZL (1st author) and ZL (5th author) conceived the project. ZL (1st author) performed the computational analyses and wrote the manuscript. SL designed and produced the figures. SH and TW contributed to the literature search for the manuscript. SL and ZL (5th author) revised the manuscript. All authors contributed to the article and approved the submitted version.
Conflict of Interest
The authors declare that the research was conducted in the absence of any commercial or financial relationships that could be construed as a potential conflict of interest.
Publisher’s Note
All claims expressed in this article are solely those of the authors and do not necessarily represent those of their affiliated organizations, or those of the publisher, the editors and the reviewers. Any product that may be evaluated in this article, or claim that may be made by its manufacturer, is not guaranteed or endorsed by the publisher.
Supplementary Material
The Supplementary Material for this article can be found online at: https://www.frontiersin.org/articles/10.3389/fonc.2021.704543/full#supplementary-material
Supplementary Figure 1 | Identification of m6A regulators-related lncRNAs related to OS and PFS. (A, B) Forest plots for the univariate Cox analysis of prognosis based on OS (A) and PFS (B). Colored dots represent hazard ratio, and the horizontal lines across the hazard ratio represent 95% confidence interval. OS, overall survival; PFS, progression free survival.
References
1. McLaughlin CC, Wu XC, Jemal A, Martin HJ, Roche LM, Chen VW. Incidence of Noncutaneous Melanomas in the U.S. Cancer (2005) 103(5):1000–7. doi: 10.1002/cncr.20866
2. Kaliki S, Shields CL. Uveal Melanoma: Relatively Rare But Deadly Cancer. Eye (Lond) (2017) 31(2):241–57. doi: 10.1038/eye.2016.275
3. Kujala E, Makitie T, Kivela T. Very Long-Term Prognosis of Patients With Malignant Uveal Melanoma. Invest Ophthalmol Vis Sci (2003) 44(11):4651–9. doi: 10.1167/iovs.03-0538
4. Singh AD, Turell ME, Topham AK. Uveal Melanoma: Trends in Incidence, Treatment, and Survival. Ophthalmology (2011) 118(9):1881–5. doi: 10.1016/j.ophtha.2011.01.040
5. Weber JS, D’Angelo SP, Minor D, Hodi FS, Gutzmer R, Neyns B, et al. Nivolumab Versus Chemotherapy in Patients With Advanced Melanoma Who Progressed After Anti-CTLA-4 Treatment (CheckMate 037): A Randomised, Controlled, Open-Label, Phase 3 Trial. Lancet Oncol (2015) 16(4):375–84. doi: 10.1016/s1470-2045(15)70076-8
6. Verdegaal EM. Adoptive Cell Therapy: A Highly Successful Individualized Therapy for Melanoma With Great Potential for Other Malignancies. Curr Opin Immunol (2016) 39:90–5. doi: 10.1016/j.coi.2016.01.004
7. Wang S, Sun C, Li J, Zhang E, Ma Z, Xu W, et al. Roles of RNA Methylation by Means of N6-methyladenosine (m6A) in Human Cancers. Cancer Lett (2017) 408:112–20. doi: 10.1016/j.canlet.2017.08.030
8. Niu Y, Zhao X, Wu Y, Li M, Wang X, Yang Y. N6-Methyl-Adenosine (m6A) in RNA: An Old Modification With a Novel Epigenetic Function. Genomics Proteomics Bioinf (2013) 11(1):8–17. doi: 10.1016/j.gpb.2012.12.002
9. Sun T, Wu R, Ming L. The Role of m6A RNA Methylation in Cancer. BioMed Pharmacother (2019) 112:108613. doi: 10.1016/j.biopha.2019.108613
10. Ping X, Sun B, Wang L, Xiao W, Yang X, Wang W, et al. Mammalian WTAP is a Regulatory Subunit of the RNA N6-Methyladenosine Methyltransferase. Cell Res (2014) 24(2):177–89. doi: 10.1038/cr.2014.3
11. Yang Y, Hsu PJ, Chen Y, Yang Y. Dynamic Transcriptomic m6A Decoration: Writers, Erasers, Readers and Functions in RNA Metabolism. Cell Res (2018) 28(6):616–24. doi: 10.1038/s41422-018-0040-8
12. Meyer KD, Jaffrey SR. Rethinking m6A Readers, Writers, and Erasers. Annu Rev Cell Dev Biol (2017) 33:319–42. doi: 10.1146/annurev-cellbio-100616-060758
13. Li H, Tong J, Zhu S, Batista PJ, Duffy EE, Zhao J, et al. m6A mRNA Methylation Controls T Cell Homeostasis by Targeting the IL-7/STAT5/SOCS Pathways. Nature (2017) 548(7667):338–42. doi: 10.1038/nature23450
14. Chen R, Chen X, Xia L, Zhang J, Pan Z, Ma X, et al. N6-Methyladenosine Modification of circNSUN2 Facilitates Cytoplasmic Export and Stabilizes HMGA2 to Promote Colorectal Liver Metastasis. Nat Commun (2019) 10(1):4695. doi: 10.1038/s41467-019-12651-2
15. Chokkalla AK, Mehta SL, Vemuganti R. Epitranscriptomic Regulation by m6A RNA Methylation in Brain Development and Diseases. J Cereb Blood Flow Metab (2020) 40(12):2331–49. doi: 10.1177/0271678X20960033
16. Lasman L, Hanna JH, Novershtern N. Role of m6A in Embryonic Stem Cell Differentiation and in Gametogenesis. Epigenomes (2020) 4(1):5. doi: 10.3390/epigenomes4010005
17. Ponting CP, Oliver PL, Reik W. Evolution and Functions of Long Noncoding RNAs. Cell (2009) 136(4):629–41. doi: 10.1016/j.cell.2009.02.006
18. Yang G, Lu X, Yuan L. LncRNA: A Link Between LncRNA and Cancer. Biochim Biophys Acta (2014) 1839(11):1097–109. doi: 10.1016/j.bbagrm.2014.08.012
19. Sang L, Ju H, Liu G, Tian T, Ma G, Lu Y, et al. LncRNA CamK-A Regulates Ca2+-Signaling-Mediated Tumor Microenvironment Remodeling. Mol Cell (2018) 72(1):71–83.e7. doi: 10.1016/j.molcel.2018.08.014
20. Nicholas NS, Apollonio B, Ramsay AG. Tumor Microenvironment (TME)-Driven Immune Suppression in B Cell Malignancy. Biochim Biophys Acta (2016) 1863(3):471–82. doi: 10.1016/j.bbamcr.2015.11.003
21. Bussard KM, Mutkus L, Stumpf K, Gomez-Manzano C, Marini FC. Tumor-Associated Stromal Cells as Key Contributors to the Tumor Microenvironment. Breast Cancer Res (2016) 18(1):84. doi: 10.1186/s13058-016-0740-2
22. Sun D, Wang J, Han Y, Dong X, Ge J, Zheng R, et al. TISCH: A Comprehensive Web Resource Enabling Interactive Single-Cell Transcriptome Visualization of Tumor Microenvironment. Nucleic Acids Res (2021) 49(D1):D1420–30. doi: 10.1093/nar/gkaa1020
23. Durante MA, Rodriguez DA, Kurtenbach S, Kuznetsov JN, Sanchez MI, Decatur CL, et al. Single-Cell Analysis Reveals New Evolutionary Complexity in Uveal Melanoma. Nat Commun (2020) 11:496. doi: 10.1038/s41467-019-14256-1
24. McKenna KC, Chen PW. Influence of Immune Privilege on Ocular Tumor Development. Ocul Immunol Inflammation (2010) 18(2):80–90. doi: 10.3109/09273941003669950
25. Bronkhorst IH, Jager MJ. Uveal Melanoma: The Inflammatory Microenvironment. J Innate Immun (2012) 4(5-6):454–62. doi: 10.1159/000334576
26. DelaCruz JR, Ian W, Mclean. Lymphocytic Infiltration in Weal Malignant Melanoma. Cancer (1990) 65:112–5. doi: 10.1002/1097-0142(19900101)65:1<112::aid-cncr2820650123>3.0.co;2-x. Panfilo 0.
27. Teemu Ma kitie PS, Tarkkanen A, Kivel T. Tumor-Infiltrating Macrophages (CD68+ Cells) and Prognosis in Malignant Uveal Melanoma. Invest Ophthalmol Visual Sci (2001) 42(7):1414–21. doi: 10.1097/00004397-200107000-00014
28. Yi C, Pan T. Cellular Dynamics of RNA Modification. Acc Chem Res (2011) 44(12):1380–8. doi: 10.1021/ar200057m
29. Zheng G, Dahl JA, Niu Y, Fu Y, Klungland A, Yang YG, et al. Sprouts of RNA Epigenetics: The Discovery of Mammalian RNA Demethylases. RNA Biol (2013) 10(6):915–8. doi: 10.4161/rna.24711
30. Chen X, Zhang J, Zhu J. The Role of m6A RNA Methylation in Human Cancer. Mol Cancer (2019) 18(1):103. doi: 10.1186/s12943-019-1033-z
31. Yue B, Song C, Yang L, Cui R, Cheng X, Zhang Z, et al. METTL3-Mediated N6-methyladenosine Modification Is Critical for Epithelial-Mesenchymal Transition and Metastasis of Gastric Cancer. Mol Cancer (2019) 18(1):142. doi: 10.1186/s12943-019-1065-4
32. Luo G, Xu W, Zhao Y, Jin S, Wang S, Liu Q, et al. RNA m6A Methylation Regulates Uveal Melanoma Cell Proliferation, Migration, and Invasion by Targeting c-Met. J Cell Physiol (2020) 235(10):7107–19. doi: 10.1002/jcp.29608
33. Huang H, Wang H, Sun W, Qin X, Shi H, Wu H, et al. Recognition of RNA N6-Methyladenosine by IGF2BP Proteins Enhances mRNA Stability and Translation. Nat Cell Biol (2018) 20:285–95. doi: 10.1038/s41556-018-0045-z
34. Chang G, Shi L, Ye Y, Shi H, Zeng L, Tiwary S, et al. YTHDF3 Induces the Translation of m6A-Enriched Gene Transcripts to Promote Breast Cancer Brain Metastasis. Cancer Cell (2020) 38(6):857–71.e7. doi: 10.1016/j.ccell.2020.10.004
35. Jia R, Chai P, Wang S, Sun B, Xu Y, Yang Y, et al. m6A Modification Suppresses Ocular Melanoma Through Modulating HINT2 mRNA Translation. Mol Cancer (2019) 18:161. doi: 10.1186/s12943-019-1088-x
36. Pan H, Ni H, Zhang L, Xing Y, Fan J, Li P, et al. P2RX7-V3 Is a Novel Oncogene That Promotes Tumorigenesis in Uveal Melanoma. Tumour Biol (2016) 37(10):13533–43. doi: 10.1007/s13277-016-5141-8
37. Wu S, Chen H, Han N, Zhang C, Yan H. Long Noncoding RNA PVT1 Silencing Prevents the Development of Uveal Melanoma by Impairing MicroRNA-17-3p-Dependent MDM2 Upregulation. Invest Ophthalmol Vis Sci (2019) 60(14):4904–14. doi: 10.1167/iovs.19-27704
38. Ding X, Wang X, Lin M, Xing Y, Ge S, Jia R, et al. PAUPAR lncRNA Suppresses Tumourigenesis by H3K4 Demethylation in Uveal Melanoma. FEBS Lett (2016) 590(12):1729–38. doi: 10.1002/1873-3468.12220
39. Xing Y, Wen X, Ding X, Fan J, Chai P, Jia R, et al. CANT1 lncRNA Triggers Efficient Therapeutic Efficacy by Correcting Aberrant Lncing Cascade in Malignant Uveal Melanoma. Mol Ther (2017) 25(5):1209–21. doi: 10.1016/j.ymthe.2017.02.016
40. Wang H, Wu M, Lu Y, He K, Cai X, Yu X, et al. LncRNA MIR4435-2HG Targets Desmoplakin and Promotes Growth and Metastasis of Gastric Cancer by Activating Wnt/β-Catenin Signaling. Aging-US (2019) 11(17):6657–73. doi: 10.18632/aging.102164
41. Yue B, Liu C, Sun H, Liu M, Song C, Cui R, et al. A Positive Feed-Forward Loop Between LncRNA-CYTOR and Wnt/beta-Catenin Signaling Promotes Metastasis of Colon Cancer. Mol Ther (2018) 26(5):1287–98. doi: 10.1016/j.ymthe.2018.02.024
42. Wong WF, Kohu K, Nakamura A, Ebina M, Kikuchi T, Tazawa R, et al. Runx1 Deficiency in CD4+ T Cells Causes Fatal Autoimmune Inflammatory Lung Disease Due to Spontaneous Hyperactivation of Cells. J Immunol (2012) 188:5408–20. doi: 10.4049/jimmunol.1102991
43. Gold MC, Napier RJ, Lewinsohn DM. MR1-Restricted Mucosal Associated Invariant T (MAIT) Cells in the Immune Response to Mycobacterium Tuberculosis. Immunol Rev (2015) 264:154–66. doi: 10.1111/imr.12271
44. Dinkel BA, Kremer KN, Rollins MR, Medlyn MJ, Hedin KE. GRK2 Mediates TCR-induced Transactivation of CXCR4 and TCR-CXCR4 Complex Formation That Drives PI3Kgamma/PREX1 Signaling and T Cell Cytokine Secretion. J Biol Chem (2018) 293:14022–39. doi: 10.1074/jbc.RA118.003097
45. Kraan W, Horlings HM, van Keimpema M, Schilder-Tol EJ, Oud ME, Scheepstra C, et al. High Prevalence of Oncogenic MYD88 and CD79B Mutations in Diffuse Large B-cell Lymphomas Presenting at Immune-Privileged Sites. Blood Cancer J (2013) 3:e139. doi: 10.1038/bcj.2013.28
Keywords: m6A RNA methylation regulators, long noncoding RNAs, tumor microenvironment, immune cell infiltration, uveal melanoma
Citation: Liu Z, Li S, Huang S, Wang T and Liu Z (2021) N6-Methyladenosine Regulators and Related LncRNAs Are Potential to be Prognostic Markers for Uveal Melanoma and Indicators of Tumor Microenvironment Remodeling. Front. Oncol. 11:704543. doi: 10.3389/fonc.2021.704543
Received: 03 May 2021; Accepted: 14 July 2021;
Published: 30 July 2021.
Edited by:
Vijayasaradhi Setaluri, University of Wisconsin-Madison, United StatesReviewed by:
Chandra K. Singh, University of Wisconsin-Madison, United StatesSandhya Annamaneni, Osmania University, India
Copyright © 2021 Liu, Li, Huang, Wang and Liu. This is an open-access article distributed under the terms of the Creative Commons Attribution License (CC BY). The use, distribution or reproduction in other forums is permitted, provided the original author(s) and the copyright owner(s) are credited and that the original publication in this journal is cited, in accordance with accepted academic practice. No use, distribution or reproduction is permitted which does not comply with these terms.
*Correspondence: Zhicheng Liu, emNsaXVAY2NtdS5lZHUuY24=