 Ping Yin1†
 Xin Zhi
 Chao Sun
 Sicong Wang
 Nan Hong
- 1Department of Radiology, Peking University People’s Hospital, Beijing, China
- 2Department of Pharmaceuticals Diagnosis, GE Healthcare, Shanghai, China
Purpose: To assess the performance of random forest (RF)-based radiomics approaches based on 3D computed tomography (CT) and clinical features to predict the types of pelvic and sacral tumors.
Materials and Methods: A total of 795 patients with pathologically confirmed pelvic and sacral tumors were analyzed, including metastatic tumors (n = 181), chordomas (n = 85), giant cell tumors (n =120), chondrosarcoma (n = 127), osteosarcoma (n = 106), neurogenic tumors (n = 95), and Ewing’s sarcoma (n = 81). After semi-automatic segmentation, 1316 hand-crafted radiomics features of each patient were extracted. Four radiomics models (RMs) and four clinical-RMs were built to identify these seven types of tumors. The area under the receiver operating characteristic curve (AUC) and accuracy (ACC) were used to evaluate different models.
Results: In total, 795 patients (432 males, 363 females; mean age of 42.1 ± 17.8 years) were consisted of 215 benign tumors and 580 malignant tumors. The sex, age, history of malignancy and tumor location had significant differences between benign and malignant tumors (P < 0.05). For the two-class models, clinical-RM2 (AUC = 0.928, ACC = 0.877) performed better than clinical-RM1 (AUC = 0.899, ACC = 0.854). For the three-class models, the proposed clinical-RM3 achieved AUCs between 0.923 (for chordoma) and 0.964 (for sarcoma), while the AUCs of the clinical-RM4 ranged from 0.799 (for osteosarcoma) to 0.869 (for chondrosarcoma) in the validation set.
Conclusions: The RF-based clinical-radiomics models provided high discriminatory performance in predicting pelvic and sacral tumor types, which could be used for clinical decision-making.
Introduction
Pelvic and sacral tumors have various types, with metastatic tumors being the most common because of their prominent hematopoietic function until late in life (1, 2). Primary sacral tumors are rare and mainly include chordoma, giant cell tumor (GCT), neurogenic tumor, etc. (3, 4). In addition, a small number of GCTs and neurogenic tumors can also occur in the pelvis. Sarcomas, such as chondrosarcoma, osteosarcoma, and Ewing’s sarcoma, are also the common primary malignant bone tumors of the pelvis and sacrum (5, 6). Because pelvic and sacral tumors are usually large and surrounded by complex structures, treatment for these tumors is often a challenging procedure that can be accompanied by serious complications, such as massive bleeding (7–10). In clinical practice, these tumors are treated differently. For example, preoperative chemotherapy is important for osteosarcoma, but it is not effective for chondrosarcoma. Therefore, accurate preoperative identification of these tumors is essential for the development of individualized treatment (11, 12).
Pelvic and sacral tumors share many similar clinical and imaging features, they often present heterogeneous masses with different components. This makes it difficult to identify these tumors in clinical practice, especially when they occur in unusual or multiple locations. In addition, the classic semantic assessments of traditional computed tomography (CT) and magnetic resonance (MR) images suffer from strong inter- and intra-reader variations, they do not provide sufficient diagnostic power to identify these tumors (13). Clinically, a simple and accurate method is needed to identify pelvic and sacral tumors.
Sophisticated machine learning methods show promise in complementing human diagnostics (14, 15). In recent years, radiomics has been successfully applied in the classification of tumor types. A few previous studies have identified sacral tumors using radiomics methods, but most of these studies identified only two types of tumors, and their sample sizes were relatively small (3, 11, 12). Yin et al. (3) built a random forest (RF)-based triple-classification radiomics model for the differentiation of primary chordomas, GCTs, and metastatic tumors of sacrum based on MR features. They concluded that their model is feasible to differentiate these tumors and can improve the precision of preoperative diagnosis in clinical practice. RF algorithms have a comparably low tendency to overfit and are well suited for multi-classification discrimination (13). Although machine learning has been applied to the segmentation, lesion detection, evaluation of chemotherapy response and prediction of local recurrence of bone tumors in recent years (16–20), the ability to identify multiple types of pelvic and sacral tumors remains unknown.
The aim of our study was to determine the performance of RF-based radiomics approaches based on CT features and clinical characteristics to predict the multiple types of pelvic and sacral tumors.
Materials and Methods
Patients and Data Acquisition
After the approval of our local ethics committee, we conducted this single-center retrospective study and waived written informed consent. A total of 1000 patients with pathologically confirmed pelvic and sacral tumors in our institution from April 2006 to December 2019 were retrospectively analyzed. All patients had a single pelvic and sacral tumor that was detected on CT within 1 month before the initial surgery. Patients that had pelvic and sacral tumor types with a sample size less than 30 (n = 111), without preoperative CT images (n = 84), or with obvious artifacts (n = 10) were excluded. Finally, a total of 795 patients with pelvic and sacral tumor types of metastatic tumors (n = 181), chordomas (n = 85), GCTs (n =120), chondrosarcomas (n = 127), osteosarcomas (n = 106), neurogenic tumors (n = 95), or Ewing’s sarcomas (n = 81) were included in the study. Sex, age, maximal tumor size, history of malignancy and tumor location (Zone I–IV) (21) of patients were also analyzed. Zone I includes the iliac crest, Zone II includes the acetabulum and its surroundings, Zone III includes the pubis and ischium regions, and Zone IV refers to the sacrum region. A “multi-zone” is a tumor that involves more than one area simultaneously.
All CT images were acquired on each patient using multi-detector row CT systems (Philips iCT 256, Philips Medical System; GE Lightspeed VCT 64, GE Medical System). The acquisition parameters were as follows: 120 kV, 100-370 mAs, slice thickness = 5 mm, matrix = 512 × 512 mm, field of view = 350 × 350 mm. The CT images were reconstructed with soft-tissue and bone kernel.
Tumor Segmentation
MITK software version 2018.04.2 (www.mitk.org) was used for the semi-automatic segmentation of all tumors (22). First, the two authors (PY and XL) manually delineated the edge of the lesion at the axial, sagittal, and coronal sites, respectively. Then, a three-dimensional lesion was automatically formed and manually corrected by a musculoskeletal radiologist with 5 years of experience and a senior musculoskeletal radiologist with 20 years of experience who were blinded to the assessment.
Feature Extraction and Selection
A total of 1316 radiomics features of each patient were extracted from the CT images using the Artificial Intelligence Kit software version 3.3.0 (GE Healthcare, China), including 18 first-order histogram features, 14 shape features, 24 gray-level co-occurrence matrix features, 14 gray-level dependence matrix features, 16 gray-level run-length matrix features, 16 gray-level size-zone matrix features, 5 neighboring gray-tone difference matrix features, 744 wavelet features, 186 Laplacian of Gaussian (LoGsigma=2.0/3.0) features, and 279 local binary pattern features.
We preprocessed the data and normalized the extracted features. When the data value exceeded the range of mean value and standard deviation, the median of specific variance vector was used to replace the outliers. In addition, we standardized the data in a specific interval. The standardized formula is as follows: (fi−u)/std, where fi represents a single characteristic data, u is the average value of the data column, and std pertains to the standard deviation of the data column.
To reduce overfitting or selection bias in our radiomics model, we used two methods to select the features: Spearman correlation as representative of filter models and gradient boosting decision tree (GBDT) as representative of embedded models (23, 24). The features with Spearman correlation > 0.7 were excluded to avoid overfitting. After the number of features was determined, the most predictive radiomics features were chosen to construct the final model.
Model Building and Validation
First, we divided the patients into the benign tumors group (n=215) and malignant tumors group (n=580), and built the first radiomics model (RM1) by using RF. After differentiating benign and malignant tumors, the specific types of benign and malignant tumors were then divided respectively. RM2, a two-class RF-based radiomics model, was built to identify GCTs and neurogenic tumors. After that, we constructed two triple-classification models, namely, RM3 and RM4. RM3 was used to identify metastatic tumors, chordomas, and sarcomas. RM4 was used to identify osteosarcomas, chondrosarcomas, and Ewing’s sarcomas.
Clinical features were also compared and variables with P value < 0.05 were included in the clinical model. When combined RM with clinical data, we also constructed four clinical-RMs. In addition, we also constructed a seven-classification model, namely, clinica-RM5, to identify these seven types of tumors. In each model, all patients were randomly divided the patients into the training and validation sets by a ratio of 7:3. Models were trained with the training set by using the repeated 5-fold cross-validation method, and estimation performance was evaluated with the validation set.
The performance of different models was assessed using the area under the receiver operating characteristic curve (AUC) and accuracy (ACC). Figure 1 shows the workflow of this study.
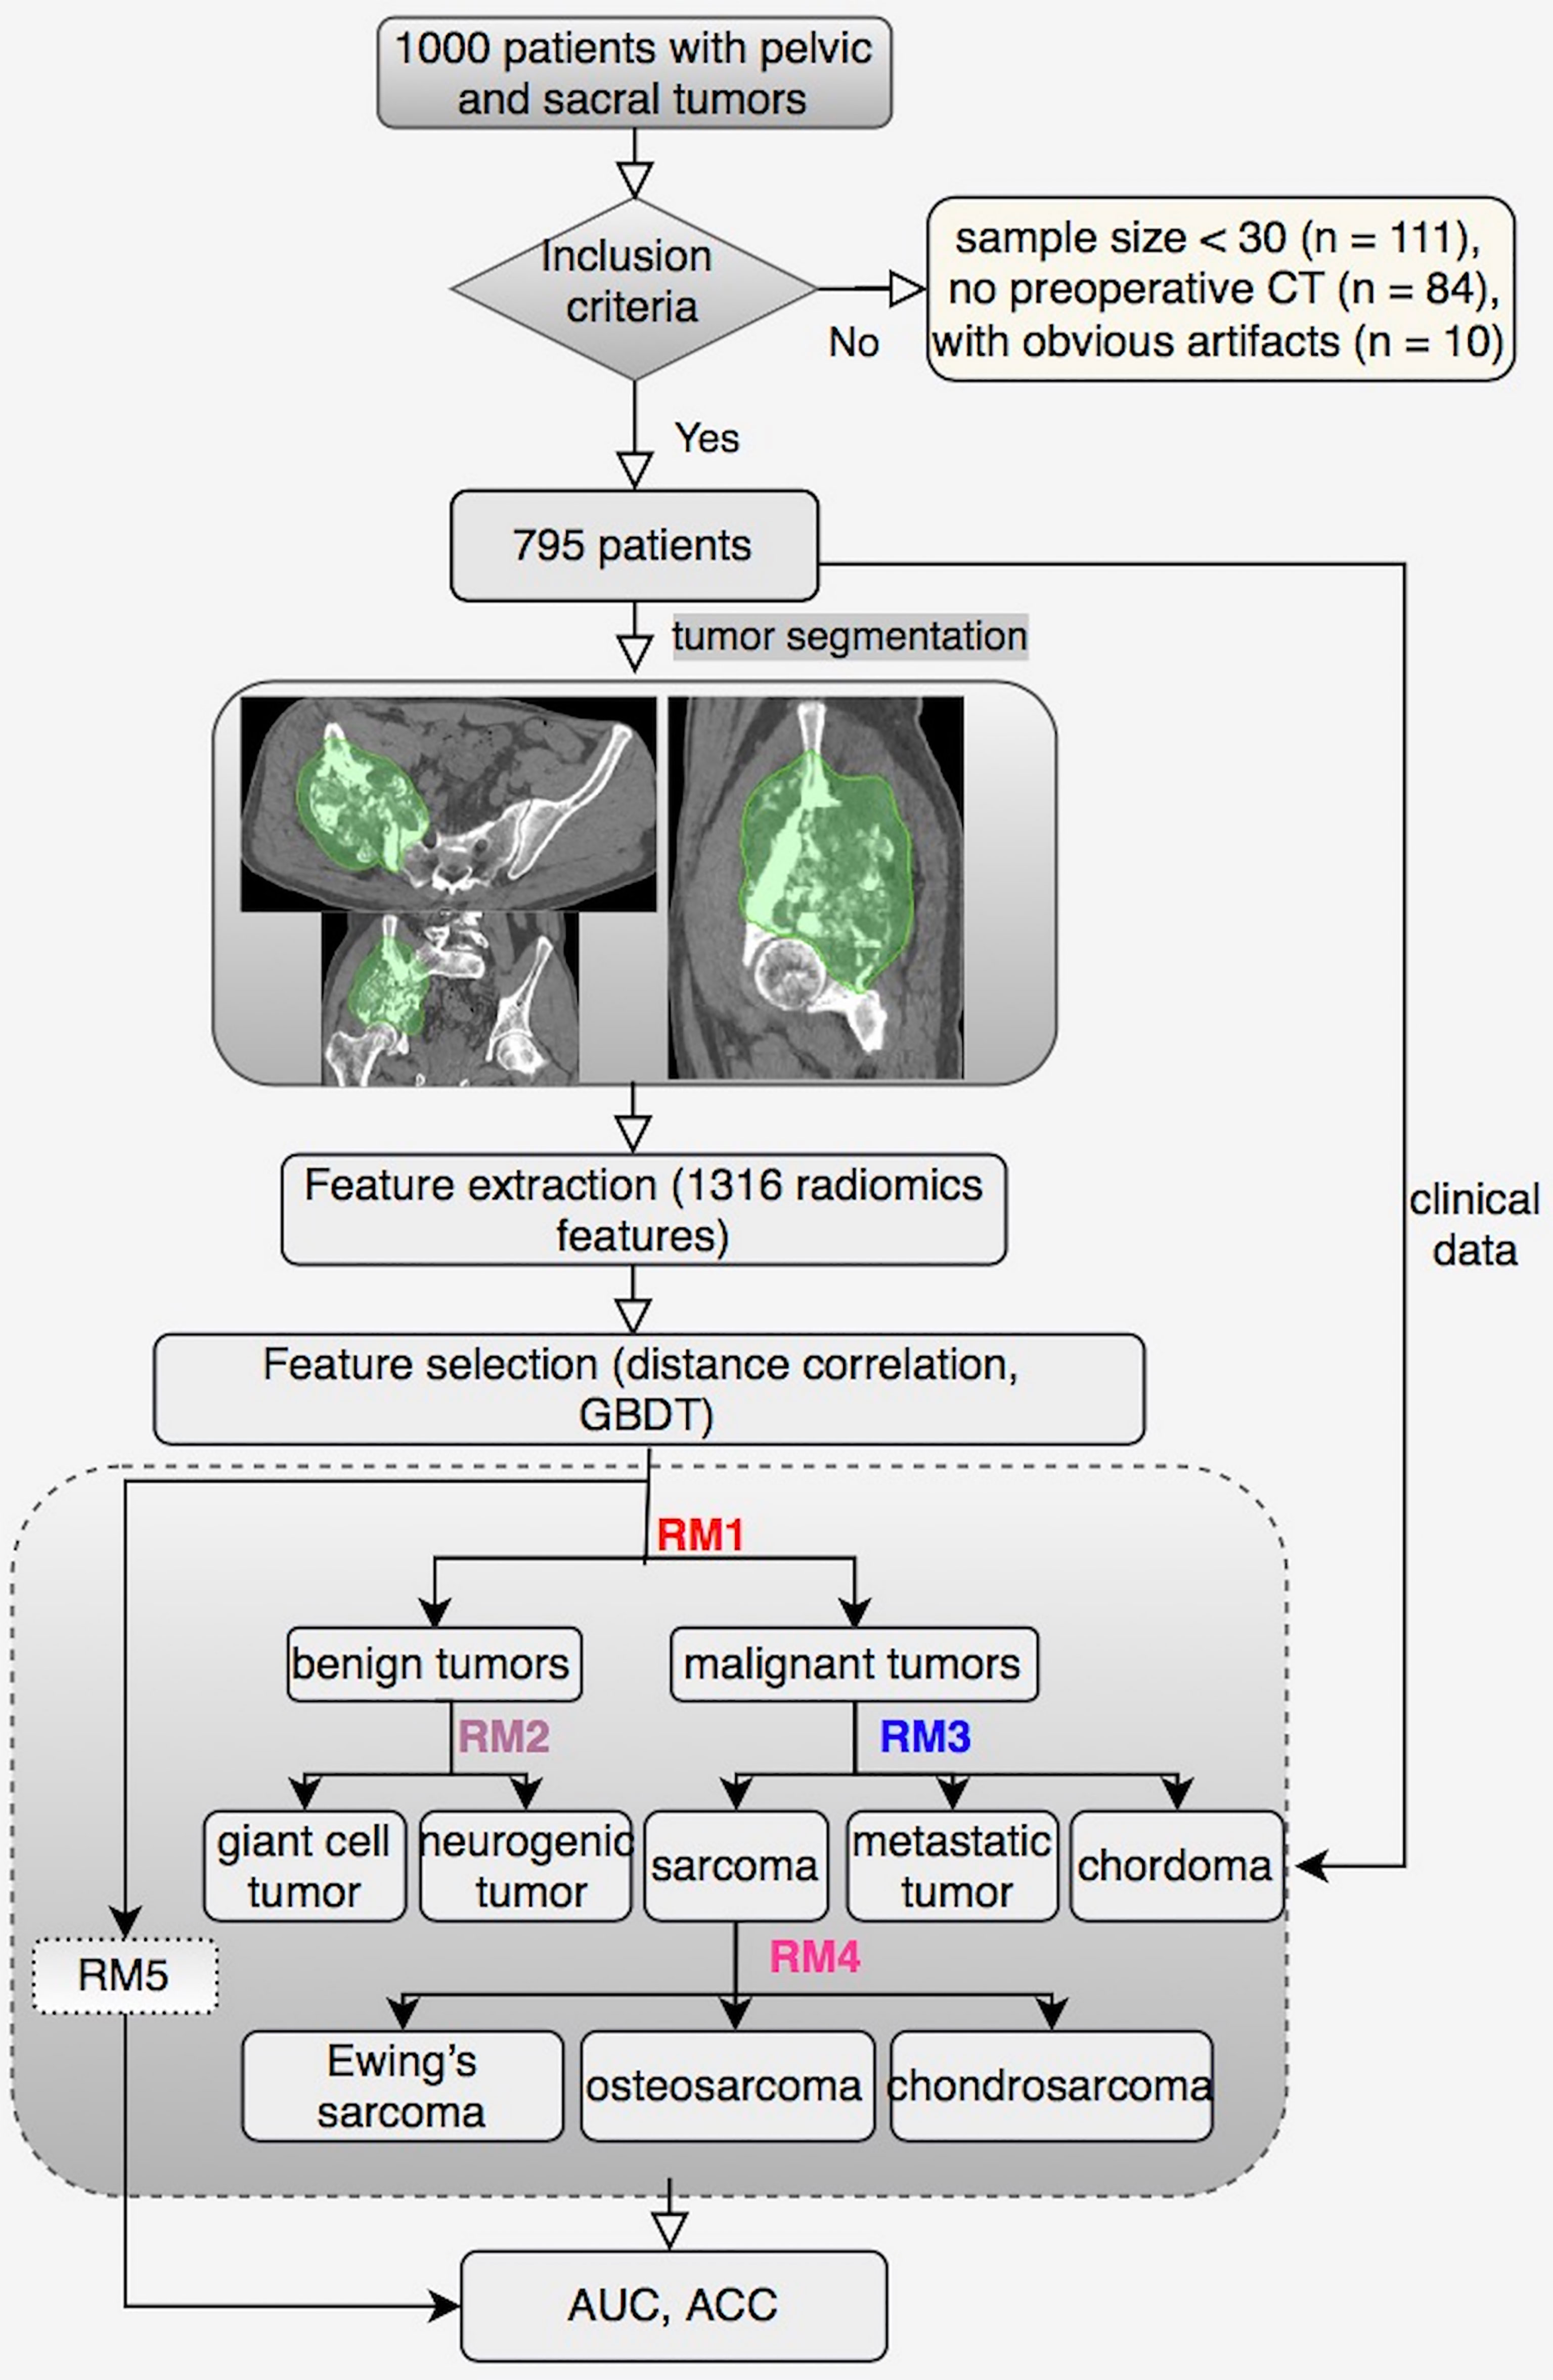
Figure 1 The workflow of this study.
Statistical Analysis
All statistical analyses were performed with R (version 3.5.1) and Python (version 3.5.6). Mann-Whitney U test or Kruskal-Wallis H test was performed to compare continuous variables, while chi-squared test or Fisher’s exact was used for categorical variables between groups. All statistical tests were two-sided, and Bonferroni-corrected P value were used to identify the feature significance of multiple comparisons.
Results
Patient Characteristics
A total of 795 patients (432 males, 363 females; mean age of 42.1 ± 17.8 years, range 4–82 years; mean tumor size of 9.6 ± 4.0 cm) were included in this study (Table 1). In the clinical-RM1, sex, age, history of malignancy and tumor location had significant differences between groups (χ2 = 9.111, Z = -3.962, χ2 = 62.277, χ2 = 149.379, P < 0.01). No significant difference was found in terms of tumor size between groups (Z = 0.534, P > 0.05). For the clinical-RM3, age, tumor size, history of malignancy and tumor location had significant differences between groups (Z = 248.6, Z = 55.167, χ2 = 272.494, χ2 = 181.17, P < 0.001). However, for the clinical-RM2 and clinical-RM4, significant differences were found in terms of age, tumor size and tumor location (P < 0.01), no significant difference was found in terms of sex and history of malignancy between groups (P > 0.05). There was no significant statistical difference between the training and validation sets in terms of age, sex, tumor location, tumor size, history of malignancy and histology (P > 0.05). The 95 neurogenic tumors were composed of 45 neurofibromas and 50 schwannomas. In the case of metastatic tumor, 43 metastases from lung, 27 from breast, 26 from liver, 25 from kidney, 15 from gastrointestinal, 13 from thyroid, 12 from prostate, 9 from uterus, 4 from bladder, 2 from melanoma, 2 from osteosarcoma, 2 from brain, and 1 from nasopharynx, respectively.
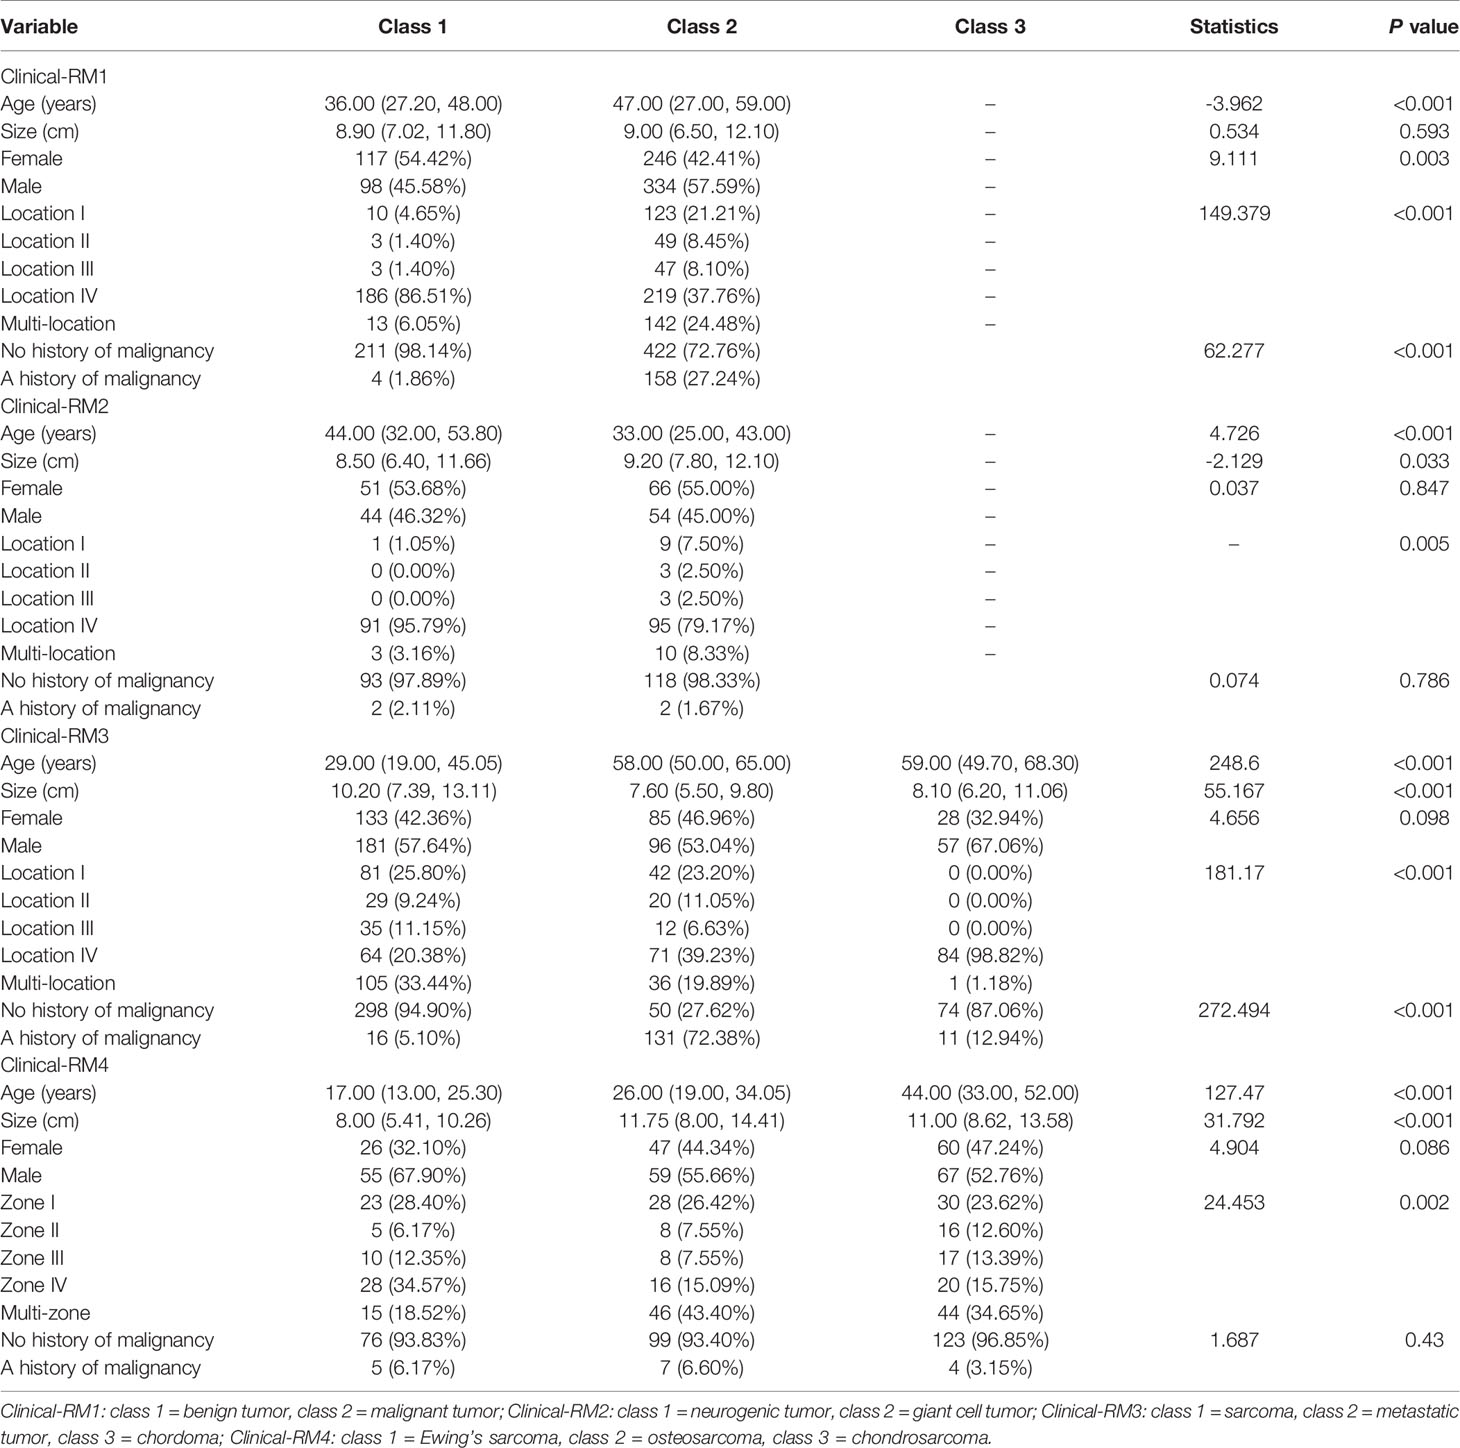
Table 1 Clinical characteristic of patients.
Performance of Different Models
For the two-class models, RM1 achieved an AUC of 0.949 and an ACC of 0.894, while RM2 reached an AUC of 0.974 and an ACC of 0.913 in the training set (Figure 2 and Table 2). In the validating set, we found: RM2 (AUC = 0.863, ACC = 0.800) had a slightly higher performance than RM1 (AUC = 0.834, ACC = 0.782).
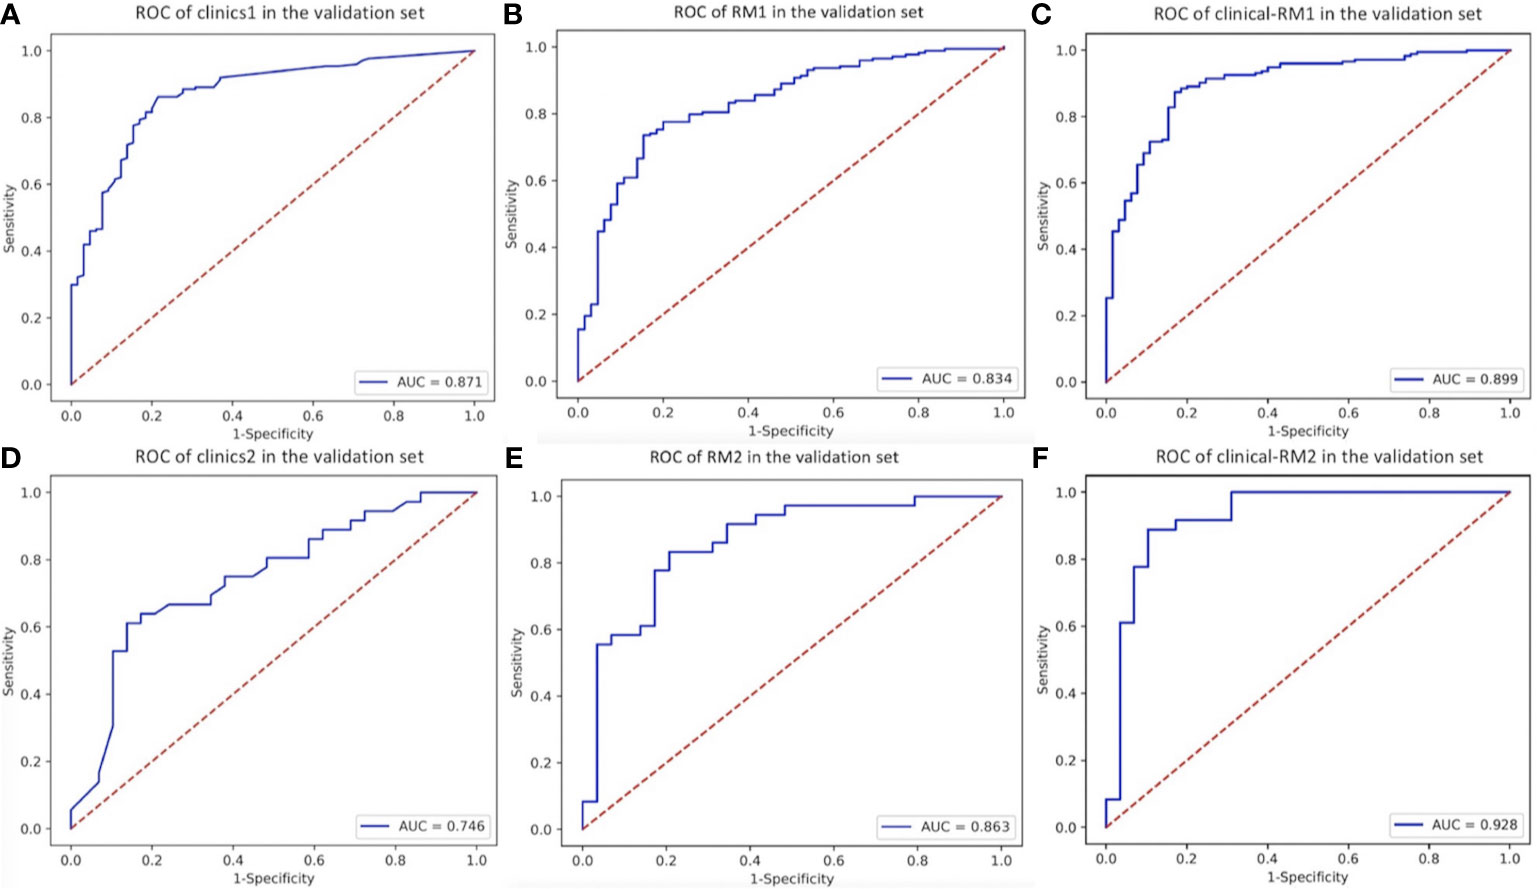
Figure 2 The ROC curve of two-class models in the validation set. (A), clinics1. (B), RM1. (C), clinical-RM1. (D), clinics2. (E), RM2. (F), clinical-RM2.
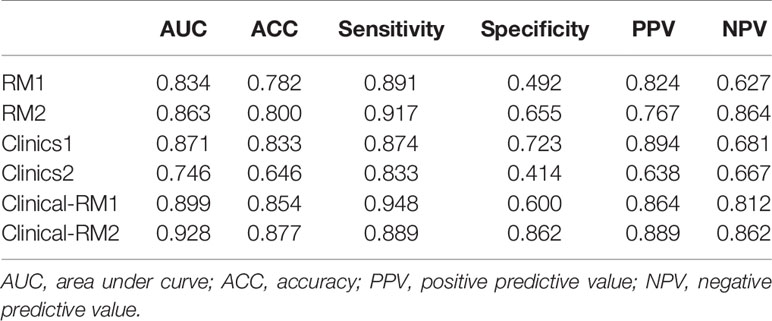
Table 2 Performance of two-class models in the validation set.
For the three-class models, the proposed radiomics classifiers achieved AUCs between 0.742 (for osteosarcoma, RM4) and 0.849 (for chordoma and sarcoma, RM3) in the validation set (Figure 3 and Table 3). The ACCs of RM3 and RM4 were 0.665 and 0.667 in the validation set, respectively.
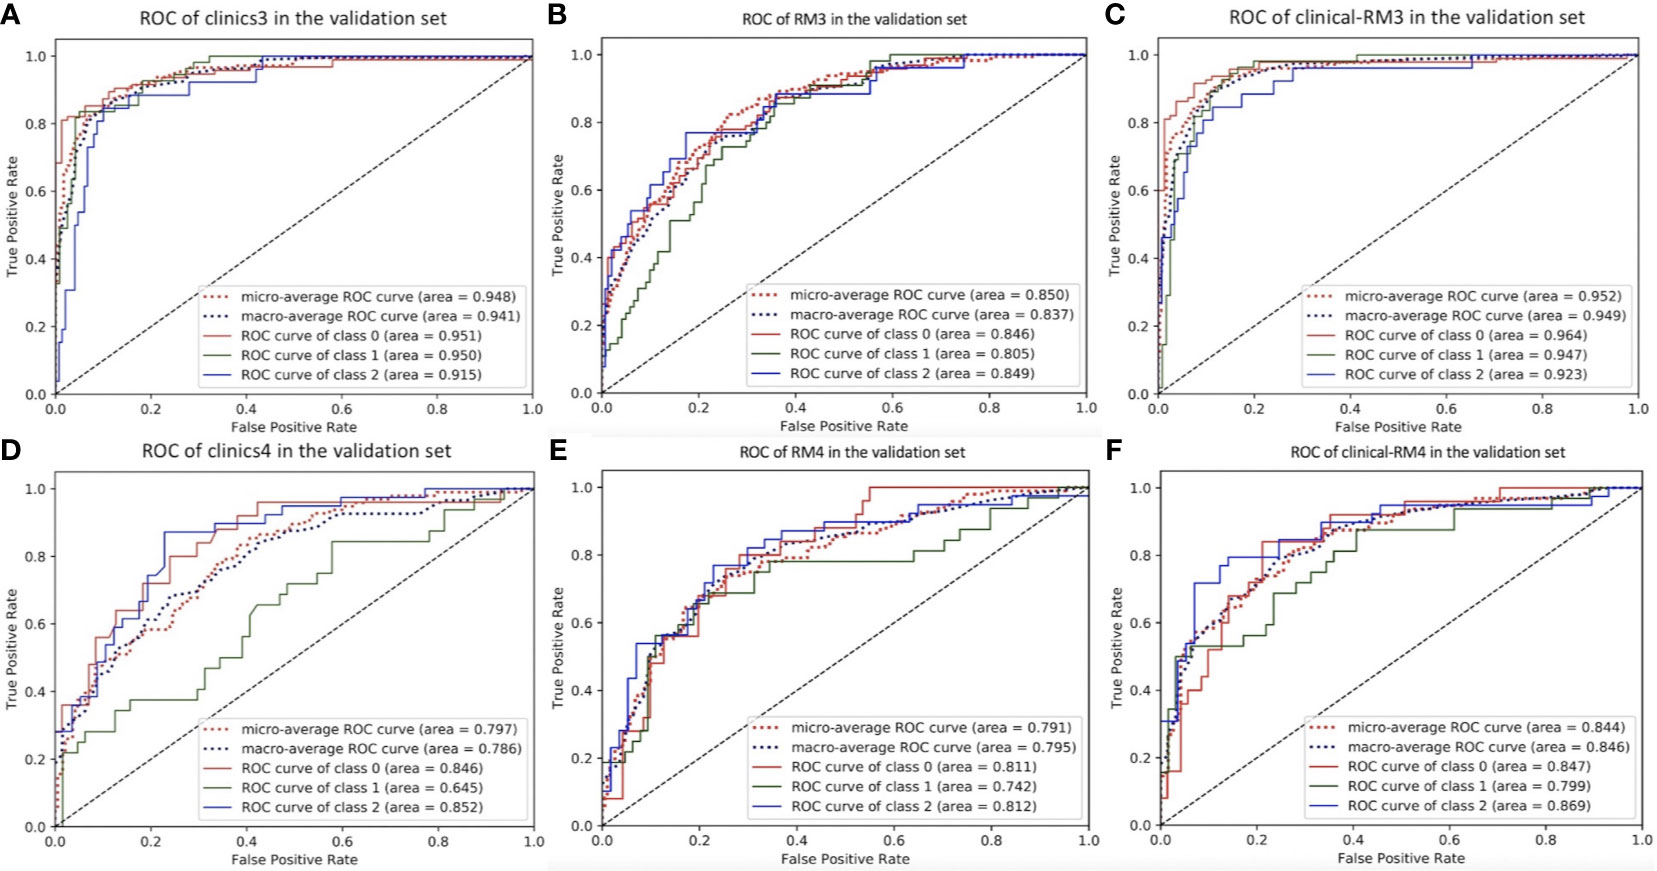
Figure 3 The ROC curve of three-class models in the validation set. (A), clinics3. (B), RM3. (C), clinical-RM3. (D), clinics4. (E), RM4. (F), clinical-RM4. For clinics3, RM3 and clinical-RM3: class 0 = sarcoma, class 1 = metastatic tumor, class 2 = chordoma. For clinics4, RM4 and clinical-RM4: class 0 = Ewing’s sarcoma, class 1 = osteosarcoma, class 2 = chondrosarcoma.
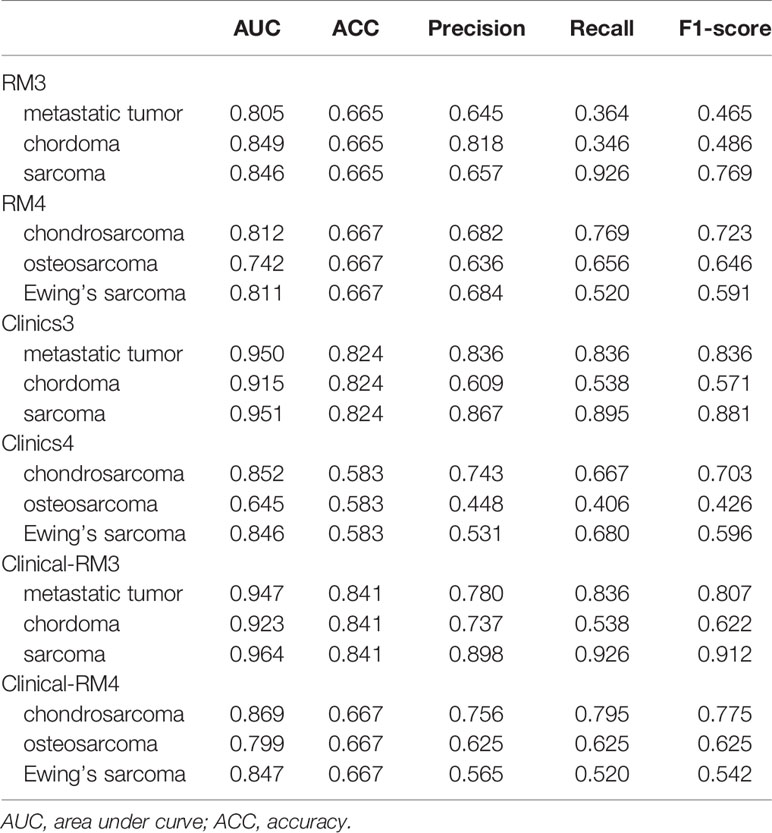
Table 3 Performance of three-class models in the validation set.
The AUC of the clinical models ranged from 0.645 to 0.951, and the ACC ranged from 0.583 to 0.833 in the validation set. When combined with clinical features, clinical-RMs performed better than individual RMs and clinical models. The clinical-RM1 exhibited an AUC of 0.899 and an ACC of 0.854 in the validation set. Similarly, the clinical-RM2 (AUC = 0.928, ACC = 0.877) performed better than individual RM2 in the validation set. The clinical-RM3 achieved AUCs between 0.923 (for chordoma) and 0.964 (for sarcoma), and ACC of 0.841 in the validation set. The AUCs of the clinical-RM4 ranged from 0.799 (for osteosarcoma) to 0.869 (for chondrosarcoma) in the validation set.
In addition, the AUC and ACC of clinical-RM5 in the training set were 0.771 and 0.580, and those in the validation set were 0.722 and 0.533, respectively. The Bar chart reflecting the predictive values of RM5 was shown in Supplemental Figure 1.
Discussion
In this study, we found significant differences in terms of age, sex, history of malignancy and tumor location for differentiating benign and malignant pelvic and sacral tumors. Both two-class and three-class RMs had good performance in predicting pelvic and sacral tumor types. When combined with clinical data, the clinical-RMs performed better than individual RMs.
Pelvic and sacral tumors have a tendency to be silent till reaching extreme volumes and involving the adjacent nerve roots, blood vessels and organs (7). They often present as large heterogeneous masses, which are often difficult to identify on conventional imaging. Although metastatic tumors occur frequently in the pelvis and sacrum, a diagnostic dilemma can present when there is a single tumor with no history or evidence of malignancy elsewhere in the body (1). In our study, age, sex, history of malignancy and tumor location were considered to be important clinical features to differentiate benign and malignant pelvic and sacral tumors. The proportion of males in patients with malignant tumors was higher than that in patients with benign tumors, which is consistent with previous study (12). For the clinical-RM3, age, tumor size, history of malignancy and tumor location had significant differences between groups. For the clinical-RM2 and clinical-RM4, however, significant differences were found in terms of age, tumor size and tumor location. Chordomas of the pelvis and sacrum occur almost exclusively in the sacrum, but can also involve the pelvis when the tumor is large, increasing the difficulty of identification. Neurogenic tumors and GCTs of bone also occur more frequently in the sacrum than in the pelvis. In this study, 4 neurogenic tumors and 25 GCTs occurred in the pelvis. Nevertheless, more sarcomas occur in the pelvis than in the sacrum. Chondrosarcoma is the most common primary malignant bone tumor in the pelvis, followed by osteosarcoma and Ewing’s sarcoma (5, 6). Osteosarcomas and Ewing’s sarcomas tend to occur between the ages of 10 and 30, while chondrosarcoma mostly affects people in their 40s to 70s (6). In our study, we found that the mean age of Ewing’s sarcoma was the lowest among these tumors, which is consistent with previous study (25). Park et al. (2) reported that osteosarcoma of the pelvic bones was more frequent in older patients, which may be due to their limited sample size. GCTs of bone typically affect younger patients between 20 and 30 years, and neurogenic tumors tend to occur between 20 and 50 years old without significant age predominance (4). In line with previous studies (1, 26, 27), we found that metastatic tumors and chordomas were more common in older populations. Furthermore, the size of the GCTs was significantly larger than that of the neurogenic tumor. The size of the sarcoma was significantly larger than that of the metastatic tumor and chordoma. For sarcomas, the size of the Ewing’s sarcoma was significantly smaller than that of the osteosarcoma and chondrosarcoma. As expected, the proportion of patients with metastatic tumors who had a history of malignancy was significantly higher than that of other tumor types.
Until now, there are few studies on the differentiation of pelvic and sacral tumors using machine learning methods (3, 11, 12). Yin et al. (12) compared the performance of radiomics model based on CT and MR features to identify sacral tumors. They found that clinical-radiomics nomogram performed better than radiomics nomogram. Most of previous studies investigated two-class problems, which intrinsically achieve higher AUCs compared with multiclass problems (13). In this study, we built four radiomics classifiers to identify seven types of pelvic and sacral tumors using RF. RF was widely used in multi-class machine learning due to its high accuracy and low overfitting (28, 29). It is a relatively efficient model-free method both in variable selection and classification (3). Kniep et al. (13) built a RF-based five-class radiomics model to predict the metastatic tumor type of brain and found it is superior to the radiologist’s readings. In our study, we first proposed a four-step models framework to improve the identification efficiency of models. Using this multi-model framework, we identified seven types of pelvic and sacral tumors, beginning with benign and malignant tumors and their subgroups. We found that both two-class and three-class RF-based RMs had good performance in predicting pelvic and sacral tumor types. Although the RMs performed worse than the clinical models alone, except for the RM2. This may be related to the fact that the clinical features included in this study are important features for differentiating these tumors and that they differ significantly. When combined with clinical data, the clinical-RMs performed better than individual RMs, which is consistent with previous studies (6, 12). Furthermore, the AUC of the seven-classification model was lower than that of other models, which may be related to the performance of RF decreases as the number of categories increases.
Our study has certain limitations. First, all images were collected from one center over the past decade or so, and from two different machines. Although we included large sample data for the study, a multicenter prospective study is beneficial to future research. Second, only plain CT image data were available in this study. Multimodal data may be required, such as enhanced CT and MR, which may provide more useful information for the differentiation of lesions. Third, we did not compare the performance of our model with that of the radiologists, and we will conduct further research in the following study. Last, we cannot include all types of pelvic and sacral tumors because some types are extremely rare. Our models include seven types of the most common pelvic and sacral tumors, and we continue to believe that our models can be of great clinical benefit.
In conclusion, the RF-based clinical-RMs provided high discriminatory performance in predicting pelvic and sacral tumor types. Our models can provide a simple, non-invasive and accurate auxiliary diagnostic tool for the differentiation of pelvic and sacral tumors, improving the diagnostic efficiency of clinicians.
Data Availability Statement
The original contributions presented in the study are included in the article/Supplementary Material. Further inquiries can be directed to the corresponding author.
Ethics Statement
The studies involving human participants were reviewed and approved by Peking University People’s Hospital Ethics Committee. Written informed consent was waived.
Author Contributions
Guarantor of integrity of the entire study: NH. Study concepts: PY and NH. Study design: PY and NH. Definition of intellectual content: PY and XZ. Literature research: PY and XZ. Clinical studies: PY and XZ. Experimental studies: PY and XL. Data acquisition: PY and CS. Data analysis: PY and SW. Statistical analysis: SW and PY. Manuscript preparation: PY and LC. Manuscript editing: PY and XZ. Manuscript review: NH. All authors contributed to the article and approved the submitted version.
Funding
Roles of funding sources: Project (RDY2020-08) supported by Peking University People’s Hospital Scientific Research Development Funds.
Conflict of Interest
The authors declare that the research was conducted in the absence of any commercial or financial relationships that could be construed as a potential conflict of interest.
Publisher’s Note
All claims expressed in this article are solely those of the authors and do not necessarily represent those of their affiliated organizations, or those of the publisher, the editors and the reviewers. Any product that may be evaluated in this article, or claim that may be made by its manufacturer, is not guaranteed or endorsed by the publisher.
Supplementary Material
The Supplementary Material for this article can be found online at: https://www.frontiersin.org/articles/10.3389/fonc.2021.709659/full#supplementary-material
Supplementary Figure 1 | Bar chart shows the predictive values of RM5. Label 1 = metastatic tumor, Label 2 = chordoma, Label 3 = Ewing’s sarcoma, Label 4 = osteosarcoma, Label 5 = chondrosarcoma, Label 6 = neurogenic tumors, Label 7 = GCTs.
Abbreviations
GCT, giant cell tumor; CT, computed tomography; RF, random forest; ICC, intra- and interclass correlation coefficients; RM, radiomics model; AUC, area under the receiver operating characteristic curve; ACC, accuracy.
References
1. Thornton E, Krajewski KM, O’Regan KN, Giardino AA, Jagannathan JP, Ramaiya N. Imaging Features of Primary and Secondary Malignant Tumours of the Sacrum. Br J Radiol (2012) 85(1011):279–86. doi: 10.1259/bjr/25247602
2. Park SK, Lee IS, Cho KH, Lee YH, Yi JH, Choi KU. Osteosarcoma of Pelvic Bones: Imaging Features. Clin Imaging (2017) 41:59–64. doi: 10.1016/j.clinimag.2016.10.013
3. Yin P, Mao N, Zhao C, Wu J, Chen L, Hong N. A Triple-Classification Radiomics Model for the Differentiation of Primary Chordoma, Giant Cell Tumor, and Metastatic Tumor of Sacrum Based on T2-Weighted and Contrast-Enhanced T1-Weighted MRI. J Magn Reson Imaging (2019) 49(3):752–9. doi: 10.1002/jmri.26238
4. Si MJ, Wang CS, Ding XY, Yuan F, Du LJ, Lu Y, et al. Differentiation of Primary Chordoma, Giant Cell Tumor and Schwannoma of the Sacrum by CT and MRI. Eur J Radiol (2013) 82(12):2309–15. doi: 10.1016/j.ejrad.2013.08.034
5. Tang X, Guo W, Yang R, Tang S, Ji T. Evaluation of Blood Loss During Limb Salvage Surgery for Pelvic Tumours. Int Orthop (2009) 33(3):751–6. doi: 10.1007/s00264-008-0695-8
6. Yin P, Mao N, Liu X, Sun C, Wang S, Chen L, et al. Can Clinical Radiomics Nomogram Based on 3D Multiparametric MRI Features and Clinical Characteristics Estimate Early Recurrence of Pelvic Chondrosarcoma? J Magn Reson Imaging (2020) 51(2):435–45. doi: 10.1002/jmri.26834
7. Luo Y, Duan H, Liu W, Min L, Shi R, Zhang W, et al. Clinical Evaluation for Lower Abdominal Aorta Balloon Occluding in the Pelvic and Sacral Tumor Resection. J Surg Oncol (2013) 108(3):148–51. doi: 10.1002/jso.23376
8. Freeman AK, Thorne CJ, Gaston CL, Shellard R, Neal T, Parry MC, et al. Hypotensive Epidural Anesthesia Reduces Blood Loss in Pelvic and Sacral Bone Tumor Resections. Clin Orthop Relat Res (2017) 475(3):634–40. doi: 10.1007/s11999-016-4858-4
9. Tang X, Guo W, Yang R, Tang S, Ji T. Risk Factors for Blood Loss During Sacral Tumor Resection. Clin Orthop Relat Res (2009) 467(6):1599–604. doi: 10.1007/s11999-008-0483-1
10. Ji T, Yang Y, Wang Y, Sun K, Guo W. Combining of Serial Embolization and Denosumab for Large Sacropelvic Giant Cell Tumor: Case Report of 3 Cases. Med (Baltimore) (2017) 96(33):e7799. doi: 10.1097/MD.0000000000007799
11. Yin P, Mao N, Zhao C, Wu J, Sun C, Chen L, et al. Comparison of Radiomics Machine-Learning Classifiers and Feature Selection for Differentiation of Sacral Chordoma and Sacral Giant Cell Tumour Based on 3D Computed Tomography Features. Eur Radiol (2019) 29(4):1841–7. doi: 10.1007/s00330-018-5730-6
12. Yin P, Mao N, Wang S, Sun C, Hong N. Clinical-Radiomics Nomograms for Pre-Operative Differentiation of Sacral Chordoma and Sacral Giant Cell Tumor Based on 3D Computed Tomography and Multiparametric Magnetic Resonance Imaging. Br J Radiol (2019) 92(1101):20190155. doi: 10.1259/bjr.20190155
13. Kniep HC, Madesta F, Schneider T, Hanning U, Schönfeld MH, Schön G, et al. Radiomics of Brain MRI: Utility in Prediction of Metastatic Tumor Type. Radiology (2019) 290(2):479–87. doi: 10.1148/radiol.2018180946
14. Truhn D, Schrading S, Haarburger C, Schneider H, Merhof D, Kuhl C. Radiomic Versus Convolutional Neural Networks Analysis for Classification of Contrast-Enhancing Lesions at Multiparametric Breast MRI. Radiology (2019) 290(2):290–7. doi: 10.1148/radiol.2018181352
15. Cuocolo R, Caruso M, Perillo T, Ugga L, Petretta M. Machine Learning in Oncology: A Clinical Appraisal. Cancer Lett (2020) 481:55–62. doi: 10.1016/j.canlet.2020.03.032
16. Shimizu H, Nakayama KI. Artificial Intelligence in Oncology. Cancer Sci (2020) 111(5):1452–60. doi: 10.1111/cas.14377
17. Bini SA. Artificial Intelligence, Machine Learning, Deep Learning, and Cognitive Computing: What Do These Terms Mean and How Will They Impact Health Care? J Arthroplasty (2018) 33(8):2358–61. doi: 10.1016/j.arth.2018.02.067
18. Dufau J, Bouhamama A, Leporq B, Malaureille L, Beuf O, Gouin F, et al. Prediction of Chemotherapy Response in Primary Osteosarcoma Using the Machine Learning Technique on Radiomic Data. Bull Cancer (2019) 106(11):983–99. doi: 10.1016/j.bulcan.2019.07.005
19. Lindgren Belal S, Sadik M, Kaboteh R, Enqvist O, Ulén J, Poulsen MH, et al. Deep Learning for Segmentation of 49 Selected Bones in CT Scans: First Step in Automated PET/CT-Based 3D Quantification of Skeletal Metastases. Eur J Radiol (2019) 113:89–95. doi: 10.1016/j.ejrad.2019.01.028
20. He Y, Guo J, Ding X, van Ooijen PMA, Zhang Y, Chen A, et al. Convolutional Neural Network to Predict the Local Recurrence of Giant Cell Tumor of Bone After Curettage Based on Pre-Surgery Magnetic Resonance Images. Eur Radiol (2019) 29(10):5441–51. doi: 10.1007/s00330-019-06082-2
21. Enneking WF, Dunham WK. Resection and Reconstruction for Primary Neoplasms Involving the Innominate Bone. J Bone Joint Surg Am (1978) 60(6):731–46. doi: 10.2106/00004623-197860060-00002
22. Wolf I, Vetter M, Wegner I, Böttger T, Nolden M, Schöbinger M, et al. The Medical Imaging Interaction Toolkit. Med Image Anal (2005) 9(6):594–604. doi: 10.1016/j.media.2005.04.005
23. Zhang Y, Chen C, Cheng Y, Teng Y, Guo W, Xu H, et al. Ability of Radiomics in Differentiation of Anaplastic Oligodendroglioma From Atypical Low-Grade Oligodendroglioma Using Machine-Learning Approach. Front Oncol (2019) 9:1371. doi: 10.3389/fonc.2019.01371
24. Fan Y, Chen C, Zhao F, Tian Z, Wang J, Ma X, et al. Radiomics-Based Machine Learning Technology Enables Better Differentiation Between Glioblastoma and Anaplastic Oligodendroglioma. Front Oncol (2019) 9:1164. doi: 10.3389/fonc.2019.01164
25. Zhu C, Olson KA, Roth M, Geller DS, Gorlick RG, Gill J, et al. Provider Views on the Management of Ewing Sarcoma of the Spine and Pelvis. J Surg Oncol (2018) 117(3):417–24. doi: 10.1002/jso.24860
26. Gerber S, Ollivier L, Leclère J, Vanel D, Missenard G, Brisse H, et al. Imaging of Sacral Tumours. Skeletal Radiol (2008) 37:277–89. doi: 10.1007/s00256-007-0413-4
27. Diel J, Ortiz O, Losada RA, Price DB, Hayt MW, Katz DS. The Sacrum: Pathologic Spectrum, Multimodality Imaging, and Subspecialty Approach. Radiographics (2001) 21:83–104. doi: 10.1148/radiographics.21.1.g01ja0883
28. Ho TK. Random Decision Forests. Proceedings of the 3rd International Conference on Document Analysis and Recognition, Montreal, Qc. (1995), 278–82.
Keywords: radiomics, machine learning, neoplasms, classification, diagnostic imaging
Citation: Yin P, Zhi X, Sun C, Wang S, Liu X, Chen L and Hong N (2021) Radiomics Models for the Preoperative Prediction of Pelvic and Sacral Tumor Types: A Single-Center Retrospective Study of 795 Cases. Front. Oncol. 11:709659. doi: 10.3389/fonc.2021.709659
Received: 14 May 2021; Accepted: 02 August 2021;
Published: 09 September 2021.
Edited by:
Xujiong Ye, University of Lincoln, United KingdomReviewed by:
Swapnil Ulhas Rane, Advanced Centre for Treatment, Research and Education in Cancer, IndiaXiaohu Li, First Affiliated Hospital of Anhui Medical University, China
Copyright © 2021 Yin, Zhi, Sun, Wang, Liu, Chen and Hong. This is an open-access article distributed under the terms of the Creative Commons Attribution License (CC BY). The use, distribution or reproduction in other forums is permitted, provided the original author(s) and the copyright owner(s) are credited and that the original publication in this journal is cited, in accordance with accepted academic practice. No use, distribution or reproduction is permitted which does not comply with these terms.
*Correspondence: Nan Hong, aG9uZ25hbjE5NjhAMTYzLmNvbQ==
†These authors have contributed equally to this work