 Xiaoteng Cui1
 Qixue Wang
 Yunfei Wang
 Hongjun Wang
 Chunsheng Kang
- 1Lab of Neuro-oncology, Tianjin Neurological Institute, Key Laboratory of Post-Neuroinjury Neuro-repair and Regeneration in Central Nervous System, Department of Neurosurgery, Tianjin Medical University General Hospital, Tianjin, China
- 2Department of Neurosurgery, Affiliated Hospital of Hebei University, Baoding, China
- 3Department of Neurosurgery, The Second Affiliated Hospital of Harbin Medical University, Harbin, China
Background: The main immune cells in GBM are tumor-associated macrophages (TAMs). Thus far, the studies investigating the activation status of TAM in GBM are mainly limited to bulk RNA analyses of individual tumor biopsies. The activation states and transcriptional signatures of TAMs in GBM remain poorly characterized.
Methods: We comprehensively analyzed single-cell RNA-sequencing data, covering a total of 16,201 cells, to clarify the relative proportions of the immune cells infiltrating GBMs. The origin and TAM states in GBM were characterized using the expression profiles of differential marker genes. The vital transcription factors were examined by SCENIC analysis. By comparing the variable gene expression patterns in different clusters and cell types, we identified components and characteristics of TAMs unique to each GBM subtype. Meanwhile, we interrogated the correlation between SPI1 expression and macrophage infiltration in the TCGA-GBM dataset.
Results: The expression patterns of TMEM119 and MHC-II can be utilized to distinguish the origin and activation states of TAMs. In TCGA-Mixed tumors, almost all TAMs were bone marrow-derived macrophages. The TAMs in TCGA-proneural tumors were characterized by primed microglia. A different composition was observed in TCGA-classical tumors, which were infiltrated by repressed microglia. Our results further identified SPI1 as a crucial regulon and potential immunotherapeutic target important for TAM maturation and polarization in GBM.
Conclusions: We describe the immune landscape of human GBM at a single-cell level and define a novel categorization scheme for TAMs in GBM. The immunotherapy against SPI1 would reprogram the immune environment of GBM and enhance the treatment effect of conventional chemotherapy drugs.
Introduction
Glioblastoma (GBM), which comprises grade IV gliomas, is a notoriously malignant brain tumor with high inter- and intratumoral heterogeneity (1, 2). Based on integrated genomic analysis from both bulk RNA sequencing and single-cell RNA sequencing (scRNA-seq) of GBM tumors, four distinct molecular subtypes have been described. These subtypes (referred to as classical, neural, proneural, and mesenchymal) were defined based on unique characteristics regarding DNA copy number variations, somatic mutations, and transcriptional profiles (3–6). The subtypes have also been identified in different regions of the same tumor, suggesting that the original tumor included a combination of various cells with distinct transcriptomic features (7, 8). Genetic mutations, epigenetic alterations, and differing tumor microenvironments alter the cellular character of GBM and drive its heterogeneity, and are among the primary reasons for the dismal prognosis and inevitable therapeutic resistance of this cancer (9, 10). The standard treatment for GBM is extensive surgery resection, followed by adjuvant radiotherapy and chemotherapy with temozolomide. However, the clinical efficacy of this regimen is still limited, and the median survival of GBM patients is less than 1½ years (1, 11, 12). Recently, various immunotherapies directed towards different targets, especially the programmed cell death protein 1 (PD-1)/PD-1 ligand (PD-L1) pathway, have been revealed as favorable strategies to treat several tumor types, such as melanoma and non-small-cell lung cancer (13, 14). However, contrary to expectations, the treatment of GBM with a PD-1 inhibitor did not yield a satisfactory response (15, 16). As the nature of the immune cells involved in GBM correspond with treatment efficacy, it is critical to illustrate the GBM immune environment by clarifying the orientation and state of tumor-infiltrated immune cells and characterizing their transcriptomic features.
The tumor microenvironment contains complex cellular components, including non-neoplastic cells such as myeloid cells and lymphocytes (17, 18). In GBM, the majority of immune cells are tumor-associated macrophages (TAMs), which comprise 30–40% of the cell mass, whereas T cells account for less than 0.23% of the total cell count (19, 20). TAMs in GBM consist of two different cell populations: resident microglia, which arise during brain development (21), and bone marrow–derived macrophages that infiltrate the tumor via blood vessels (22). However, the activation states and transcriptional features of immune cells in GBM remain unclear.
scRNA-seq has been widely used to comprehensively characterize gene expression at the level of individual cells, and it has been employed to analyze intratumoral heterogeneity in glioma (23). In the present study, we analyzed data from scRNA-seq that was performed using tissue from nine glioblastomas, covering 16,201 cells in total. These data were integrated to depict the immune landscape of glioblastoma at the single-cell level. Primed and repressed TAM states were defined based on the expression profiles of key genes. By comparing variable gene expression and regulons in different clusters and cell types, we not only identified components and characteristics unique to each GBM subtype but also discovered a potential immunotherapeutic target for GBM, Spleen Focus Forming Virus Proviral Integration Oncogene (SPI1), which is expressed in TAM and essential for macrophage maturation and polarization, and correlated with tumor grades and poor prognosis.
Materials and Methods
Acquisition of scRNA-Seq Datasets
Normalized expression matrices processed as Transcripts Per Kilobase of exon model per Million mapped reads (TPM) from scRNA-seq performed using a 10 × genomics platform were downloaded from the Gene Expression Omnibus (GEO) (https://www.ncbi.nlm.nih.gov/geo/) database. The sequencing analyses were conducted on samples from nine fresh GBM tumors from adult patients in Massachusetts General Hospital (MGH) (GSE131928) (4). A total of 16,201 cells were acquired. A seurat file was created by importing the expression matrix data into the version 3.6.2 R studio program and saving the data in RDS format.
Dimensionality Reduction and Unsupervised Clustering
The data were normalized using the global-scaling method “LogNormalize” and preprocessing the data by linear conversion. To detect the most variable genes used for dimensionality reduction, we employed the “FindVariableFeatures” function in R studio. Next, we utilized PCA to reduce the dimensional linearity based on the variable genes. JackStraw plots and Elbow plots were used to decide the number of dimensionalities. Finally, graph-based unsupervised clustering was conducted and visualized using a non linear t-SNE plot, with a resolution of 0.4, defined by the functions of “FindNeighbors” and “FindClusters”. All the operations were processed by using the seurat R package in R studio.
Identification of Cell Types and Marker Genes in Different Clusters
To identify the cell types, we first analyzed the Spearman correlation coefficient between the transcriptomes of each cell across all nine tumors in our dataset and each cell type-specific gene expression profile in the HPCA reference set using SingleR package. Then, the expression levels of distinct cell type-specific marker genes based on the CellMarker databases (24) were utilized to further confirm the cell types. Markers for macrophage were C1QA, C1QB, C1QC, TYROBP, and CD68. For T lymphocyte, the markers were CD3G, GZMH, IL2RB, PRF1, and ICOS. TMEM119 was employed to distinguish the microglia from TAM clusters. The relatively positive expressions of MHC-II molecules in TAMs were considered as distinct features of primed state. The cell type information was visualized by t-SNE plot in R studio.
The marker genes of distinct clusters were identified using the “FindAllMarkers” function of the seurat package and visualized as a heat map, violin plots, and feature plots using the ggplot2 package in R studio. The positive percentage of the cells where the gene is defined as the marker is at least 25%.
Identification of Gene Regulatory Network and Specific Transcription Factors
The gene regulatory network and specific transcription factors were identified by employing the Single Cell Regulatory Network Inference and Clustering (SCENIC) tool (25) using default parameters. The SCENIC analysis was run as described on the cells that passed the filtering using the 20,000 motifs database for RcisTarget and GRNboost R packages. The regulated genes and AUCell score of each transcription factor were calculated to estimate the specificity to each cell type. The AUCell scores were visualized by t-SNE plot and heat map. The top three regulons in each cell type were acquired by calculating the RSS. The relationships among transcription factors were shown in heat map by connection specificity index (CSI).
KEGG Pathway Analysis
DAVID (https://david.ncifcrf.gov/) is an open website providing a comprehensive set of functional annotation tools to extrapolate biological meaning from an extensive list of genes. Using DAVID, we identified the main cellular physiological activities reflected by the top 500 differentially expressed genes of each cluster. The KEGG pathways were displayed as a bubble plot by the ggplot2 package in R studio.
Gene Expression Analysis
The expression data of SPI1 and the clinical information of glioma samples were obtained from TCGA, CGGA (26), and Rembrandt databases. The data were sorted into three subgroups according to the WHO grade and used to calculate the mean and 95% confidence interval (CI) of SPI1 expression. The results were visualized as scatter plots.
Correlation Analysis
We utilized TIMER2.0 (Tumor Immune Estimation Resource version 2.0) online web (http://timer.cistrome.org/) (27) to analyze the correlation between the expression of SPI1 and other genes. We input “SPI1” in the “Interested Gene” search box of the “Cene_Corr” module in TIMER2.0 and “C1QA”, “C1QB”, “C1QC”, “SRGN”, “TYROBP”, “GAP43”, “GPM6B”, “SEC61G”, “PTN”, “CX3CR1”, “CSF1R”, and “IRF8” in the “Gene Expression” box, and obtained the correlation in all tumor types. We picked up the GBM results and saved the scatter plots with rho and p value.
Tumor Purity and Survival Prognosis Analysis
The tumor purity, macrophage infiltration, and survival prognosis analysis were performed as previously described (28).
Results
scRNA Sequencing Reveals the Unique Immune Landscape of Human GBM at a Single-Cell Level
To examine the immune microenvironment of GBM, we obtained 10 × Genomics scRNA sequencing datasets derived from fresh GBM tissues that spanned nine patients, accessed from the Gene Expression Omnibus (GEO) database (accession number GSE131928) (4). A total of nine datasets were integrated and comprehensively analyzed to assess GBM heterogeneity and determine the nature of various associated immune microenvironments. We used t-distributed stochastic neighbor embedding (t-SNE), the unsupervised non linear dimensionality reduction algorithm, to differentiate cell types based on their relative gene expression values. Overall, single-cell transcriptomes for a total of 16,201 cells were retained after initial quality controls and were differentiated into 22 different clusters (cluster 0~-21), visualized as bidimensional t-SNE maps (Figure S1A). The distribution of each dataset is displayed in Figure S1B. The clusters were sorted into four main cell types by comparing their gene expression characteristics for tumor (light gray), macrophages (green), microglia (blue), and T lymphocyte (purple) (Figure 1A). Surprisingly, the number of malignant cells (tumor) accounted for 62.31% (10,095 cells) of the cell population, suggesting that numerous tumor-associated non-malignant cells are a prominent feature of the GBM microenvironment. We observed that TAMs (macrophage and microglia) comprised 36.39% of the tumor tissue cells (the numbers of macrophage and microglia were 3,288 and 2,608 cells, respectively), and the percentage of T cells was only 1.30% (210 cells) of the total cell count (Figure 1B). The percentages of cell types in each sample are shown in Figure S2.
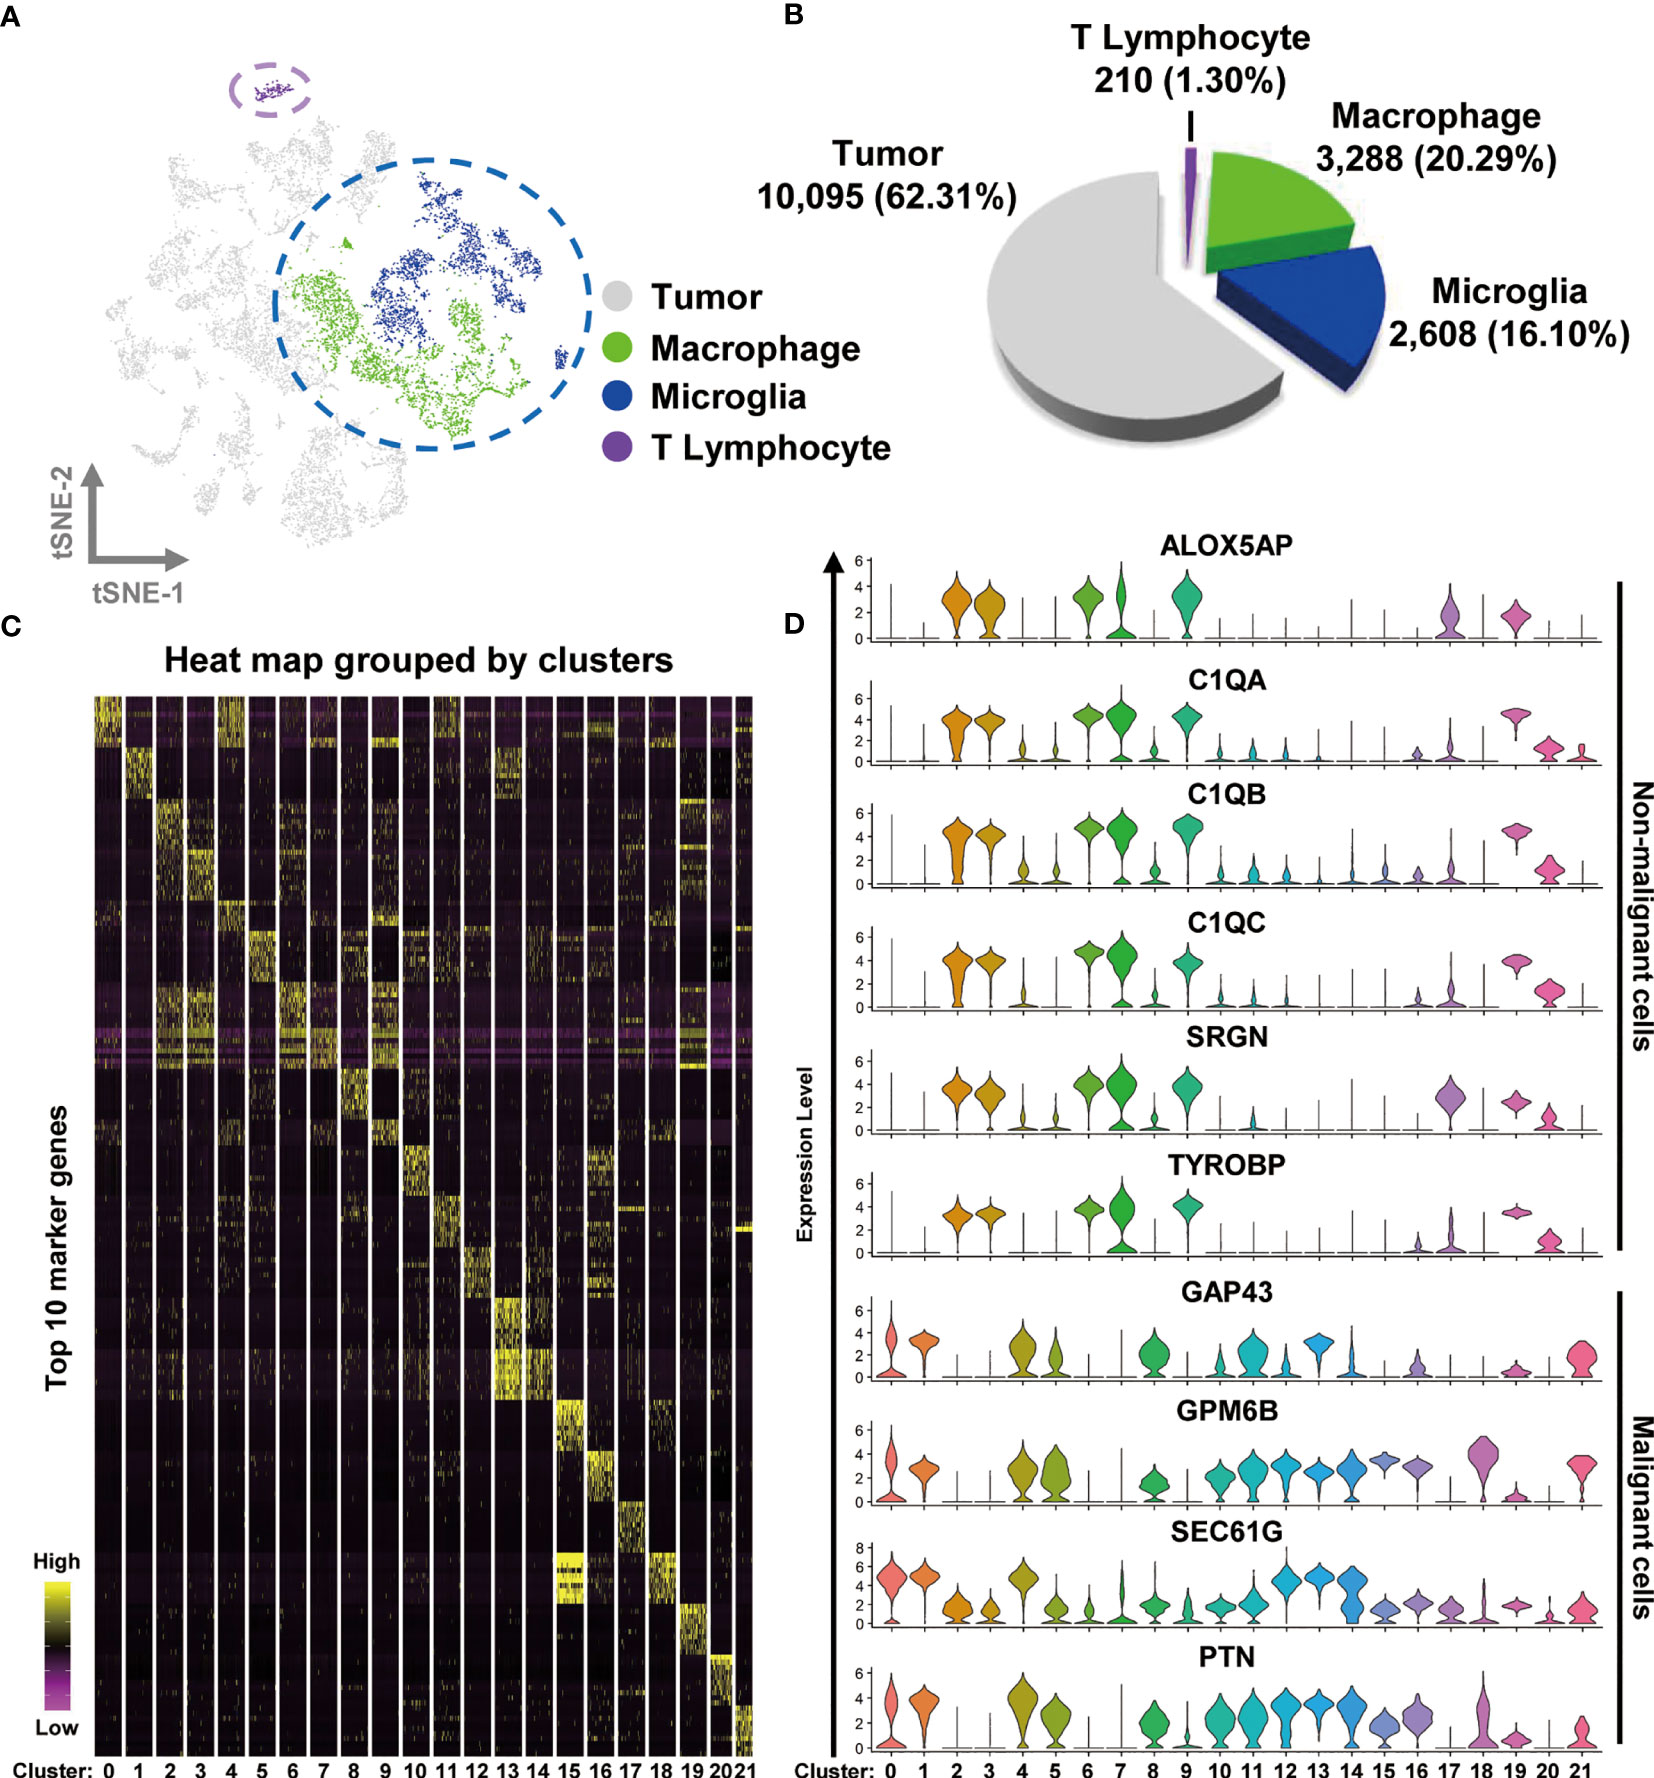
Figure 1 Integrated scRNA-seq analysis from human GBM biopsies. (A) A total of 16,201 cells from nine datasets of fresh GBM tissues are visualized by the t-SNE plot. Distinct cell types are represented as follows: light gray indicates tumor cells, green indicates macrophages, cyan indicates microglia, and purple indicates T lymphocytes. (B) A pie chart illustrates the proportions of each cell type. (C) The expression profiles of the top 10 marker genes of each cluster are displayed as a heat map. (D) Distributions of malignant and non malignant cell marker genes are shown as violin plots.
Heat mapping was performed to examine the expression levels of the top 10 genes in the different clusters. As shown in Figure 1C and Table S1, each cluster displayed distinct gene expression features. The clusters in the TAM group (particularly clusters 2, 3, 6, 7, 9, and 19) shared a number of similar marker genes, such as complement c1q C chain (C1QC), complement c1q B chain (C1QB), Metallothionein 1G (MT1G), serglycin (SRGN), c-c motif chemokine ligand 3 like 3 (CCL3L3), major histocompatibility complex class II DR beta 5 (HLA-DRB5), and s100 calcium binding protein A8 (S100A8). By analyzing the expression of different genes, we observed that TAMs could be identified by the expression of Arachidonate 5-Lipoxygenase Activating Protein (ALOX5AP), complement c1q A chain (C1QA), C1QB, C1QC, SRGN, and TYRO protein tyrosine kinase binding protein (TYROBP), whereas malignant cells expressed the marker genes growth-associated protein 43 (GAP43), glycoprotein M6B (GPM6B), SEC61 translocon subunit gamma (SEC61G), and pleiotrophin (PTN) (Figure 1D). The non malignant cells were differentiated into T cells and TAMs by the expression of the genes CD3 gamma chain (CD3G), granzyme H (GZMH), interleukin 2 receptor subunit beta (IL2RB), perforin 1 (PRF1), and inducible T cell costimulator (ICOS) (Figure S1C). The non malignant and malignant cells were also easily separated in bidimensional PC maps, which rely on linear principal component analysis (PCA) to reduce dimensionality (Figure S1D).
Altogether, our data suggest that TAMs are the most common immune cell type in GBM, comprising over half of the tumor cell population.
Primed and Repressed States of Macrophages/Microglia Characterize the Immune Microenvironment in GBM
To comprehensively characterize the signatures of TAMs in GBM, we subclustered and re analyzed the cells in the macrophage and microglia group. In total, 5,896 cells were sorted and hierarchically sorted into 14 clusters (Figure S3A). CD68 has been widely recognized as a pan-macrophage marker, and we therefore used feature and violin plots to visualize the expression and distribution of CD68 in these clusters. As shown in Figures S3B, C, CD68 was highly expressed in almost every cluster, except for cluster 12, which may be tumor cells misdefined as TAMs according to the gene signature above. Then, we further analyzed the CD68-positive clusters, which we considered to be TAMs. The macrophage compartment in GBM contains both brain-resident microglia and bone marrow–derived macrophages. TMEM119 is a reliable microglia marker that discriminates inherent and extrinsic macrophages in the brain (29). Using the violin plot of TMEM119 expression, we separated the macrophage clusters into two groups. The TMEM119-positve clusters (clusters 4, 5, 6, 7, 10, and 11) were identified as resident microglia, and the TMEM119-negative clusters (clusters 0, 1, 2, 3, 8, 9, and 13) were defined as bone marrow–derived macrophages (Figure S3D). By examining the marker genes defining the TMEM119-positive clusters, we selected cytoplasmic fmr1 interacting protein 1 (CYFIP1), ectonucleoside triphosphate diphosphohydrolase 1 (ENTPD1), and vav guanine nucleotide exchange factor 1 (VAV1) as possible microglia marker genes (Figure S3D). MHCII is a glycoprotein present on specialized antigen-presenting cells, including macrophages. The elevated expression of MHCII indicates that macrophages have transitioned to a primed state, in which they have acquired the ability to present tumor-specific antigens (30). Macrophages otherwise maintain a repressed state. We therefore examined the expression of MHCII by assessing the levels of the human genes, which were HLA-DQ alpha 2 (HLA-DQA2) and HLA-DQ beta 2 (HLA-DQB2). As shown in Figure S2E, HLA-positive expression was confined to clusters 1, 2, 4 5, 6, 8, and 9. Together with their expression of TMEM119, the cells were subdivided into four distinct groups as follows: TMEM119+-HLA+ cells (clusters 4, 5, and 6), TMEM119+-HLA− cells (clusters 7, 10, and 11), TMEM119−-HLA+ cells (clusters 1, 2, 8, and 9), and TMEM119—HLA− cells (clusters 0, 3, and 13) (Figure S3F).
Next, we wished to determine the precise nature and activation status of TAMs in GBM. In our analysis of the distinctive gene expression profiles of microglia, we found that the cell population of cluster 11 charactered by matrix metallopeptidase 9 (MMP9), MMP25, and periostin (POSTN), which are associated with cell migration, should be more likely microglia with naïve status as an immunological defender in the brain, which has migration and chemotaxis ability. We defined cells with this expressions profile as “microglia: unactivated”. Similarly, the expression of cytokine-like 1 (CYTL1) and early growth response 3 (EGR3) were used to define primed microglia. Interferon-induced protein with tetratricopeptide repeats 3 (IFIT3) and interferon alpha inducible protein 27 (IFI27) distinguished microglia in the repressed state. The gene profile analysis of macrophages suggested that cluster 8 represented priming macrophages, owing to the expression of cell cycle-associated genes [aurora kinase B (AURKB), cell division cycle associated 3 (CDCA3), and assembly factor for spindle microtubules (ASPM)]. HLA-positive macrophages could be classified as primed, and HLA-negative macrophages (with the exception of cluster 8) were categorized as repressed, due to the expression of MT1G and ankyrin repeat domain 28 (ANKRD28) (Figures S4A, B).
With all of the above characteristics in mind, we redefined the original 14 clusters as seven distinct subsets by comparing the expression of TMEM119 and MHCII with the expression profiles of different clusters (Figures 2A and S4C). TAMs in GBM consist primarily of bone marrow–derived macrophages, accounting for 60.28% of the cell population, of which 4.55% are undergoing priming, 27.51% are in the primed state, and 28.22% are repressed. Of the remaining cell population, 37.57% consists of resident microglia in unactivated (2.17%), primed (23.74%), and repressed states (11.65%) (Figure 2B).
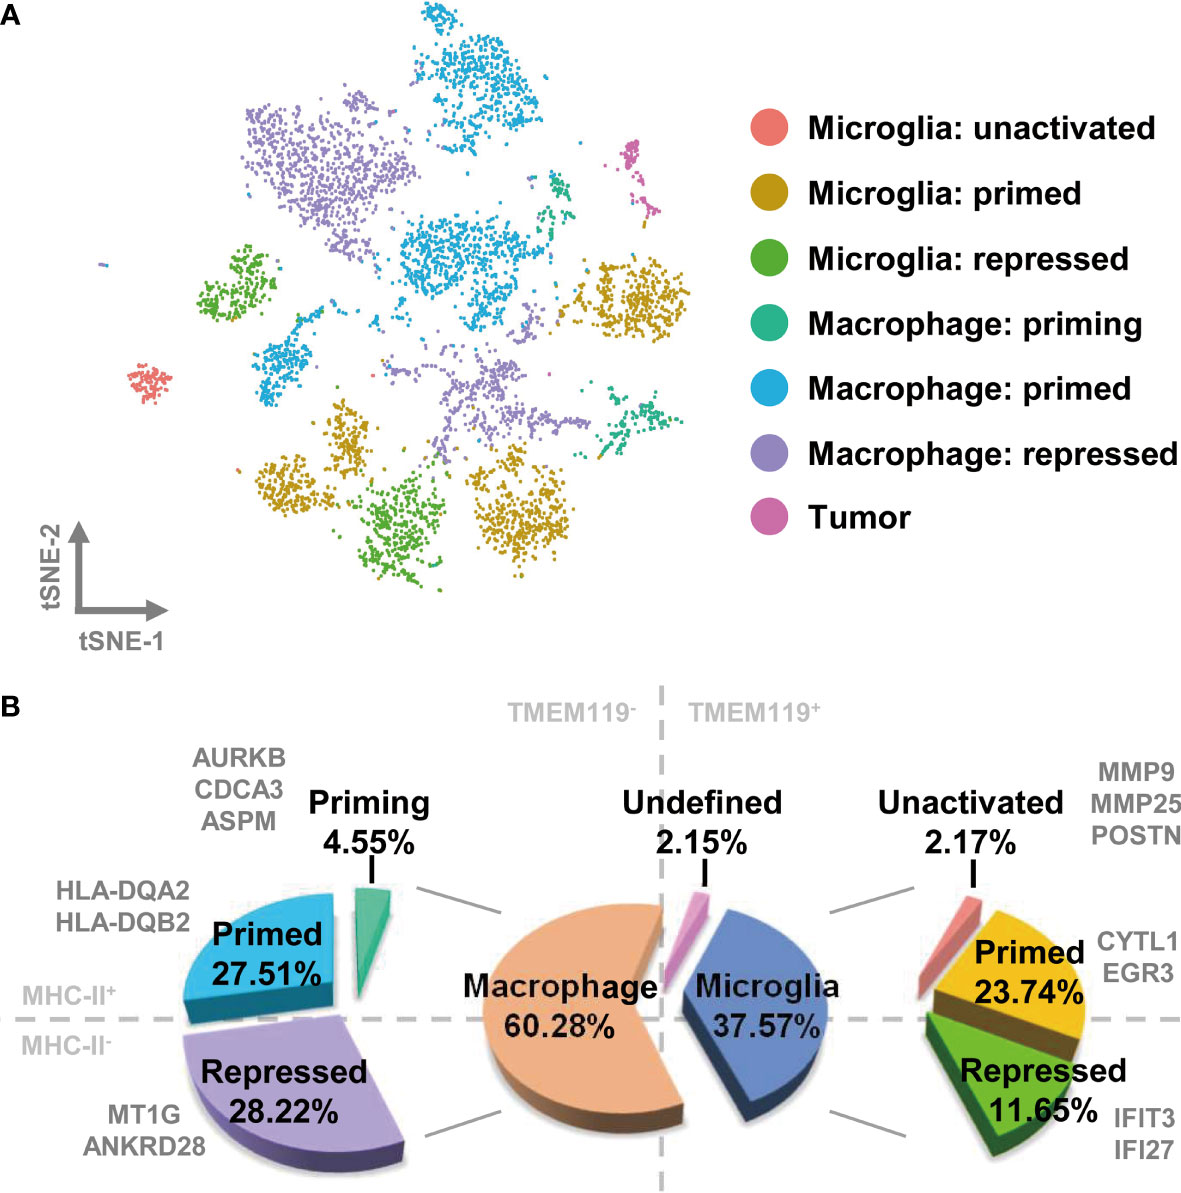
Figure 2 TAMs in GBM comprise different activation states of bone marrow–derived macrophages and brain-resident microglia. (A) Each cell type is visualized as a t-SNE plot. (B) The relative proportions of macrophages and microglia are 60.28% and 37.57%, respectively. The ratio of detailed TAM states is shown in the pie chart.
The Orientation and Status of TAM in Different Subtypes of GBM Are Distinctive
To investigate the relationship between the infiltrated TAMs and different GBM subtypes, we assessed the distribution of the cells covered by the nine tumor datasets and selected the MGH105 (40.28%), MGH124 (18.00%), and MGH115 (9.94%) datasets for analysis, as together they covered over half of the total cell number and seven different clusters (Figures 3A and S5). Fittingly, we found that these datasets represented diverse tumor subtypes previously defined by TCGA (MGH105 was classified as “mixed”, MGH115 as “classical”, and MGH124 as “proneural”) (4), and we therefore examined the characteristics of these distinct GBM subtypes using these three datasets. In the TCGA-mixed tumor, almost all TAMs in the GBM were bone marrow–derived macrophages, with primed state cells occupying 54.95% of the total number (clusters 1 and 2) and repressed state cells accounting for 41.56% (cluster 0) (Figure 3B). The TAMs in the TCGA-proneural tumor were characterized by primed microglia (cluster 4; 45.24%), repressed macrophages (cluster 3; 41.19%), and priming macrophages (cluster 8; 10.65%) (Figure 3C). A different composition was observed in the TCGA-classical tumor, with repressed microglia (cluster 7) comprising 73.21% of the total cell number and other TAM subtypes, such as repressed macrophages (cluster 3; 15.01%) and priming macrophages (cluster 8; 7.00%), making up the rest of the cell proportion (Figure 3D).
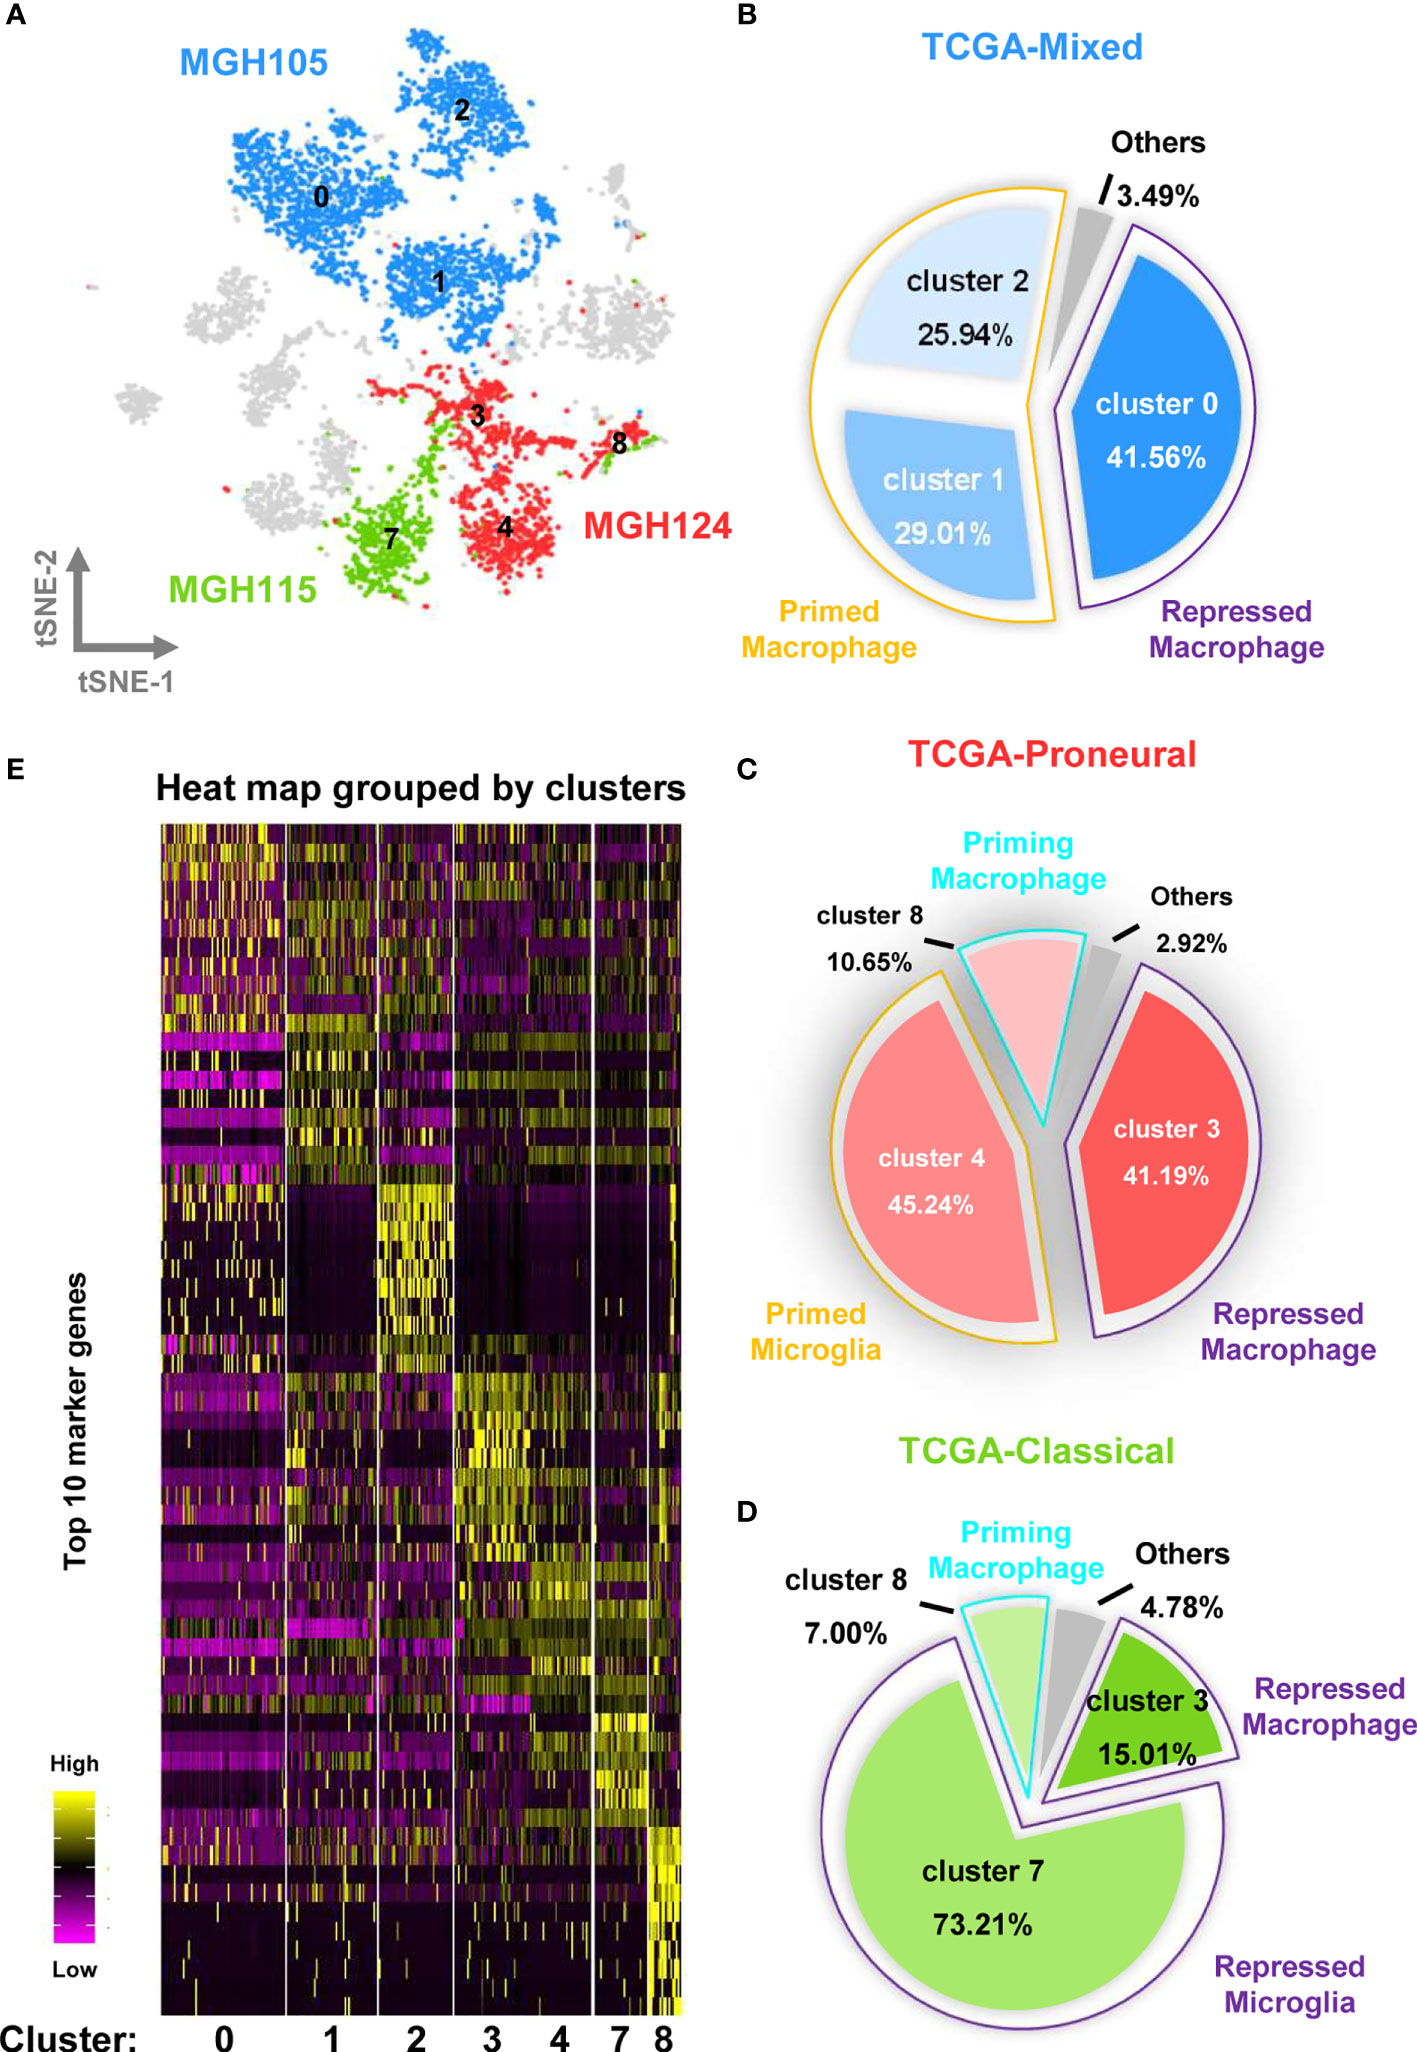
Figure 3 Different molecular subtypes of GBM have distinct TAM composition and characteristics. (A) The cell distribution of MGH105, MGH115, and MGH124 are shown by the t-SNE plot. (B) TAMs in the TCGA-mixed tumor comprise repressed macrophages, primed macrophages, and others. (C) TAMs in the TCGA-proneural tumor comprise repressed macrophage, primed microglia, priming macrophages, and others. (D) TAMs in the TCGA-classical tumor contain repressed macrophages, repressed microglia, priming macrophages, and others. (E) The expression profiles of the top 10 marker genes of each cluster are displayed as a heat map.
Heat map analysis showed that macrophages/microglia in the same activation state possessed distinct gene expression profiles in the different subtypes of GBM (Figure 3E and Table S2). Each of the clusters included cells present in at least three of the nine datasets (Figure 4A). To further clarify the main cellular physiological activities of TAMs, the top 500 differentially expressed genes in each cluster were identified and evaluated by KEGG pathway analysis. As shown in Figures 4B, E, “oxidative phosphorylation” was one of the most repressed macrophages from the TCGA-mixed tumor (cluster 0), but “protein processing in ER” was the most enriched set of pathways in the same macrophages from the TCGA-proneural and classical tumors (cluster 3). Primed state macrophages in the TCGA-mixed tumor (clusters 1 and 2) were enriched in the “ribosome” pathway (Figures 4C, D). Cluster 4, which represents primed microglia that make up the highest percentage of the cells in the TCGA-proneural tumor, was characterized by the KEGG enrichment term “phagosome” (Figure 4F). The pathways associated with “leishmaniasis” were enriched prominently in repressed microglia from the TCGA-classical tumor (cluster 7) (Figure 4G). The only TAM cluster present in all three subtypes of GBM was priming macrophages (cluster 8), which were enriched for pathways involved in “DNA replication” and the “cell cycle” (Figure 4H).
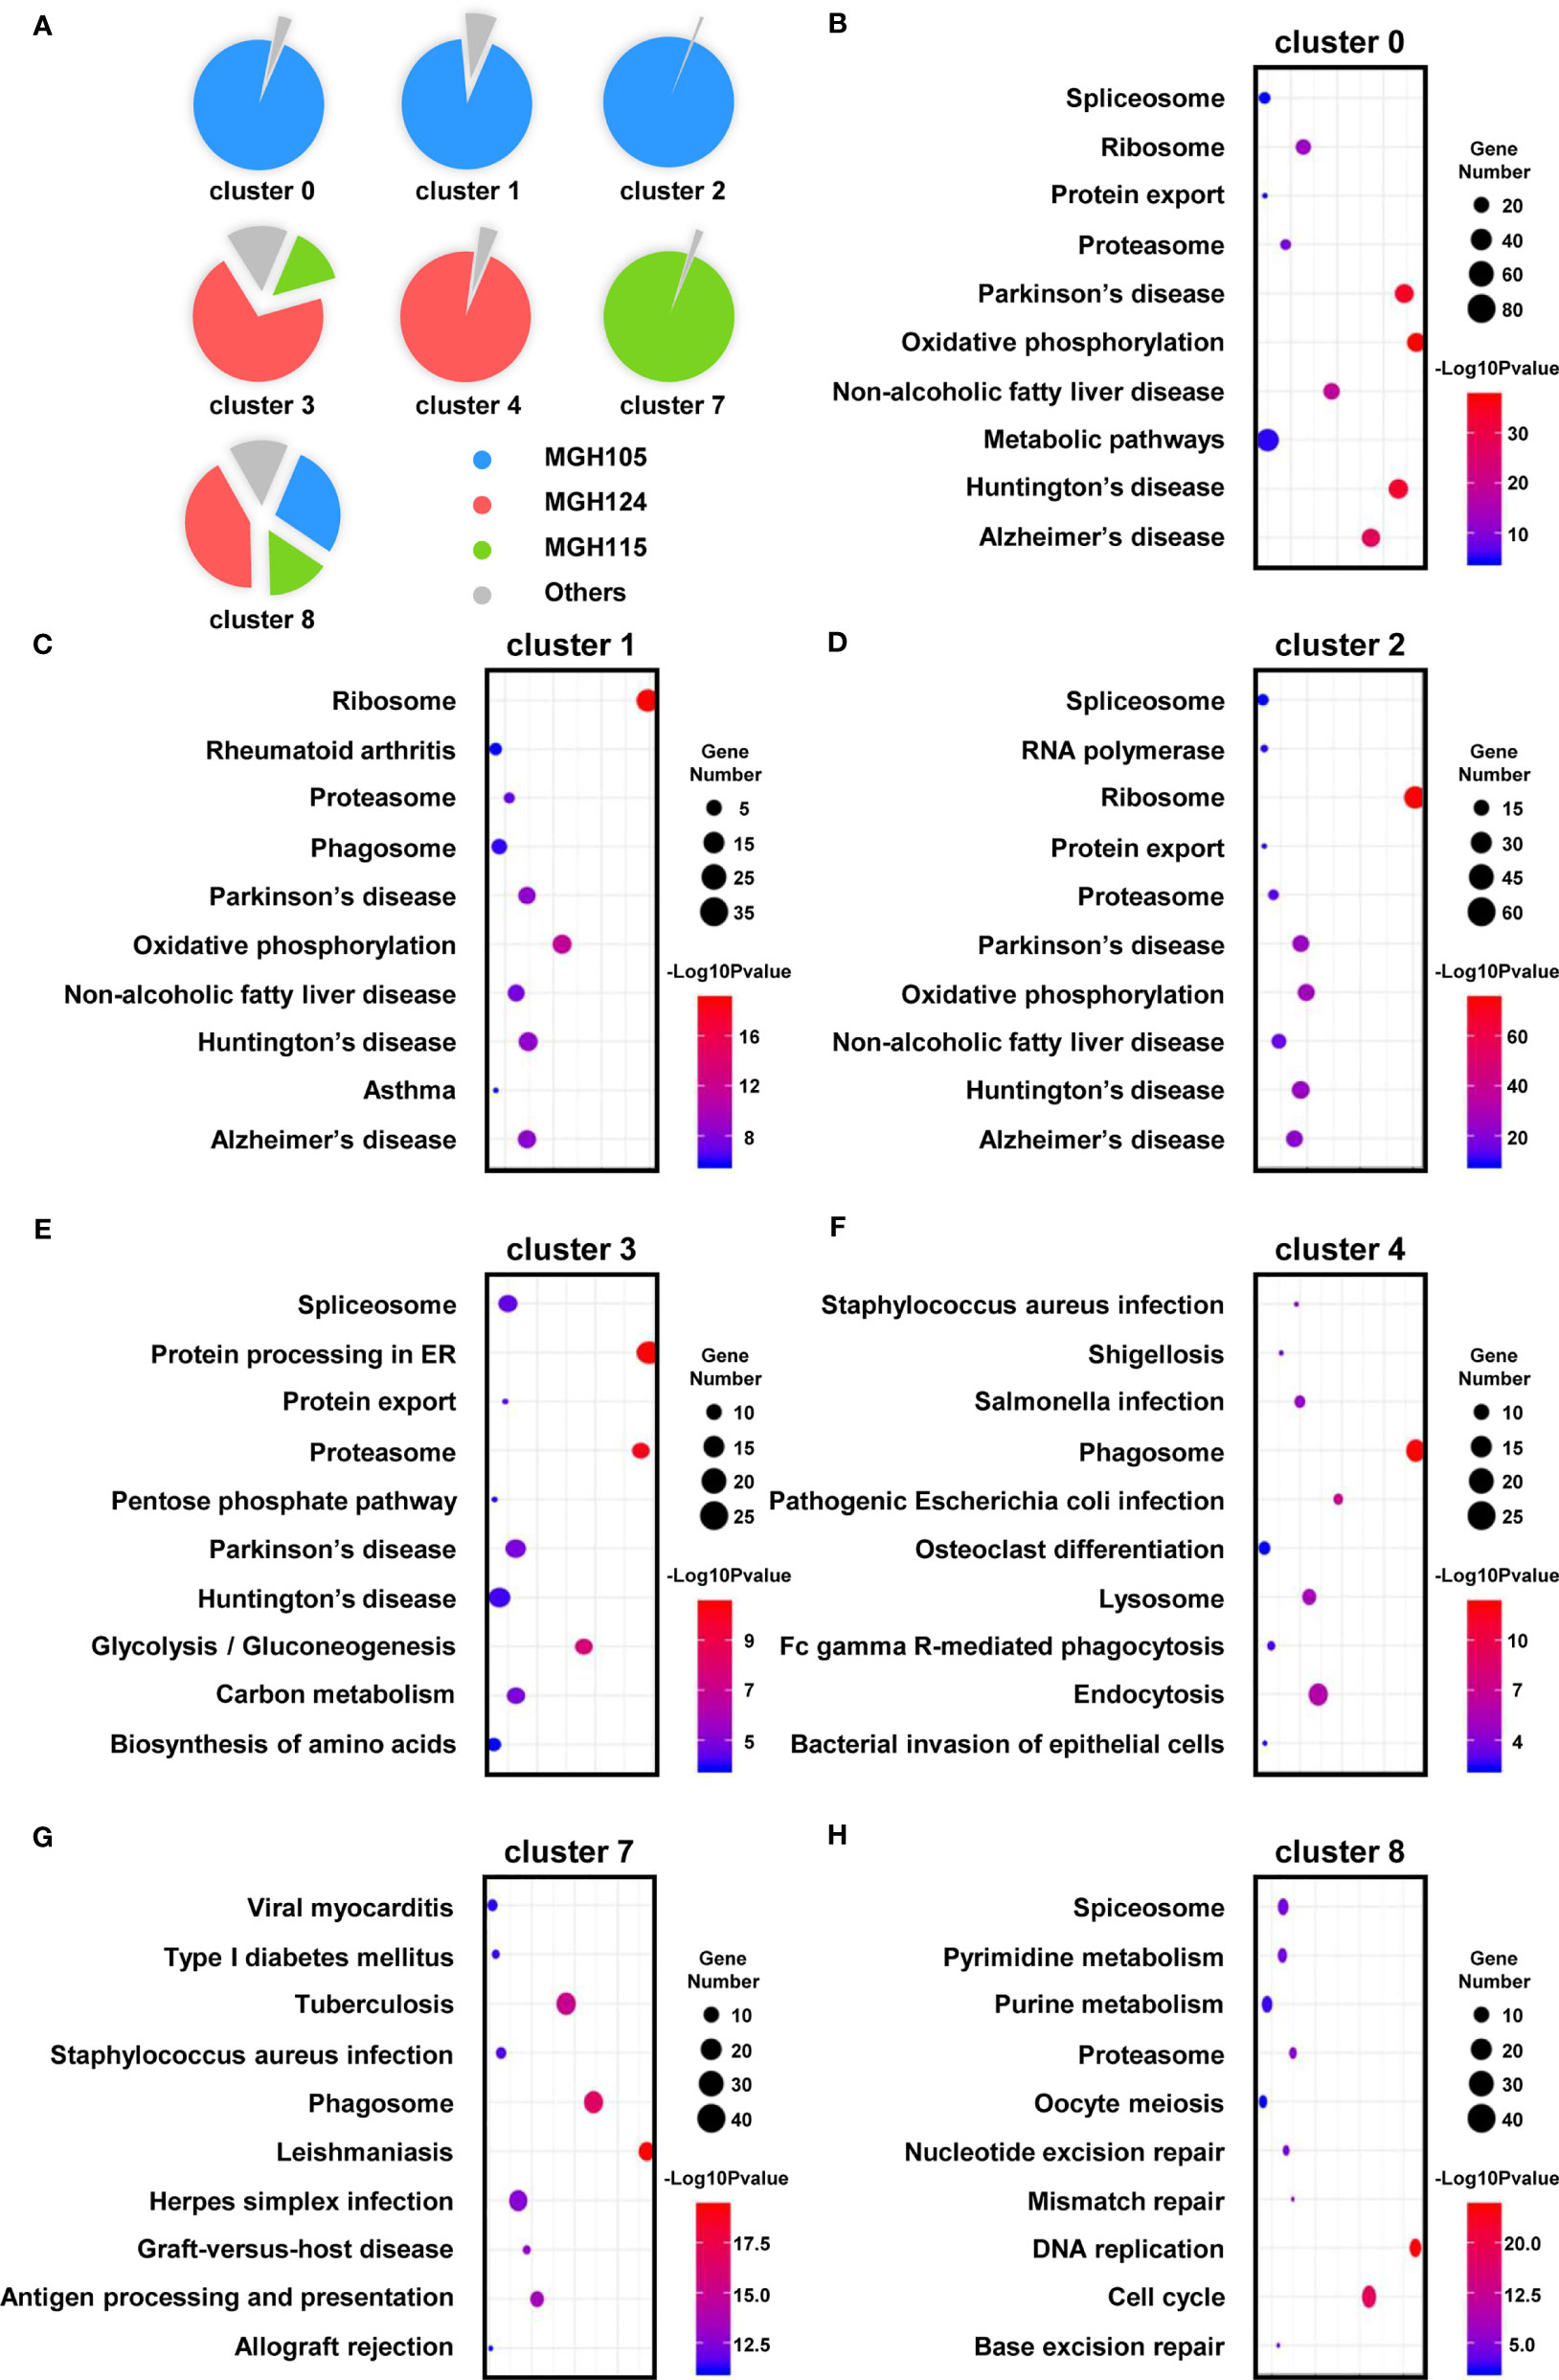
Figure 4 The enriched cellular physiological activities of TAMs differ from each other. (A) Each cluster contains at least three of the nine tissues. (B–H) The enriched KEGG pathways of each cluster are shown in bubble charts.
SPI1 Is a Crucial Regulon for TAM Maturation and Polarization and Correlated With Poor Prognosis in GBM
To identify the distinct key transcription factors of different states of macrophages/microglia and compare the regulon differences, Single-Cell rEgulatory Network Inference and Clustering (SCENIC) was employed to draw the gene regulatory network. Based on the calculated regulon activity score (RAS) of transcription factors, we could identify the differences in the activities of regulons among the cell types (Figure 5A). The relevance among the regulons was evaluated by connection specificity index (CSI) and visualized in Figure S6. Some regulons, such as E2F transcription factor 7 (E2F7) and Cone-Rod Homeobox (CRX), had elevated activities in primed macrophage but decreased activities in repressed macrophage. Meanwhile, some others including SMAD Family Member 1 (SMAD1) and JunD proto-oncogene (JUND) showed low activities in primed but a high activities in repressed state of macrophages. Similarly, high activities of cAMP-responsive element modulator (CREM) and interferon regulatory factor 3 (IRF3) were calculated in primed microglia, but Transcription Factor 7 (TCF7) and interferon regulatory factor 9 (IRF9) in repressed microglia. By calculating the regulon specificity score (RSS), we examined the crucial regulons of each cell type and visualized the top three regulons in sequence diagrams and t-SNE plots (Figures 5B, C and S7A–I). Surprisingly, we found that SPI1 is picked out in top three of priming macrophages and all states of microglia, and also important for primed and repressed macrophages (Table S3). SPI1 is known as a crucial transcription factor for the development of macrophage (31, 32). Our results suggested that the transcription activity of SPI1 is essential for macrophages and microglia maturation and polarization, leading to a tumor-harmful microenvironment formation.
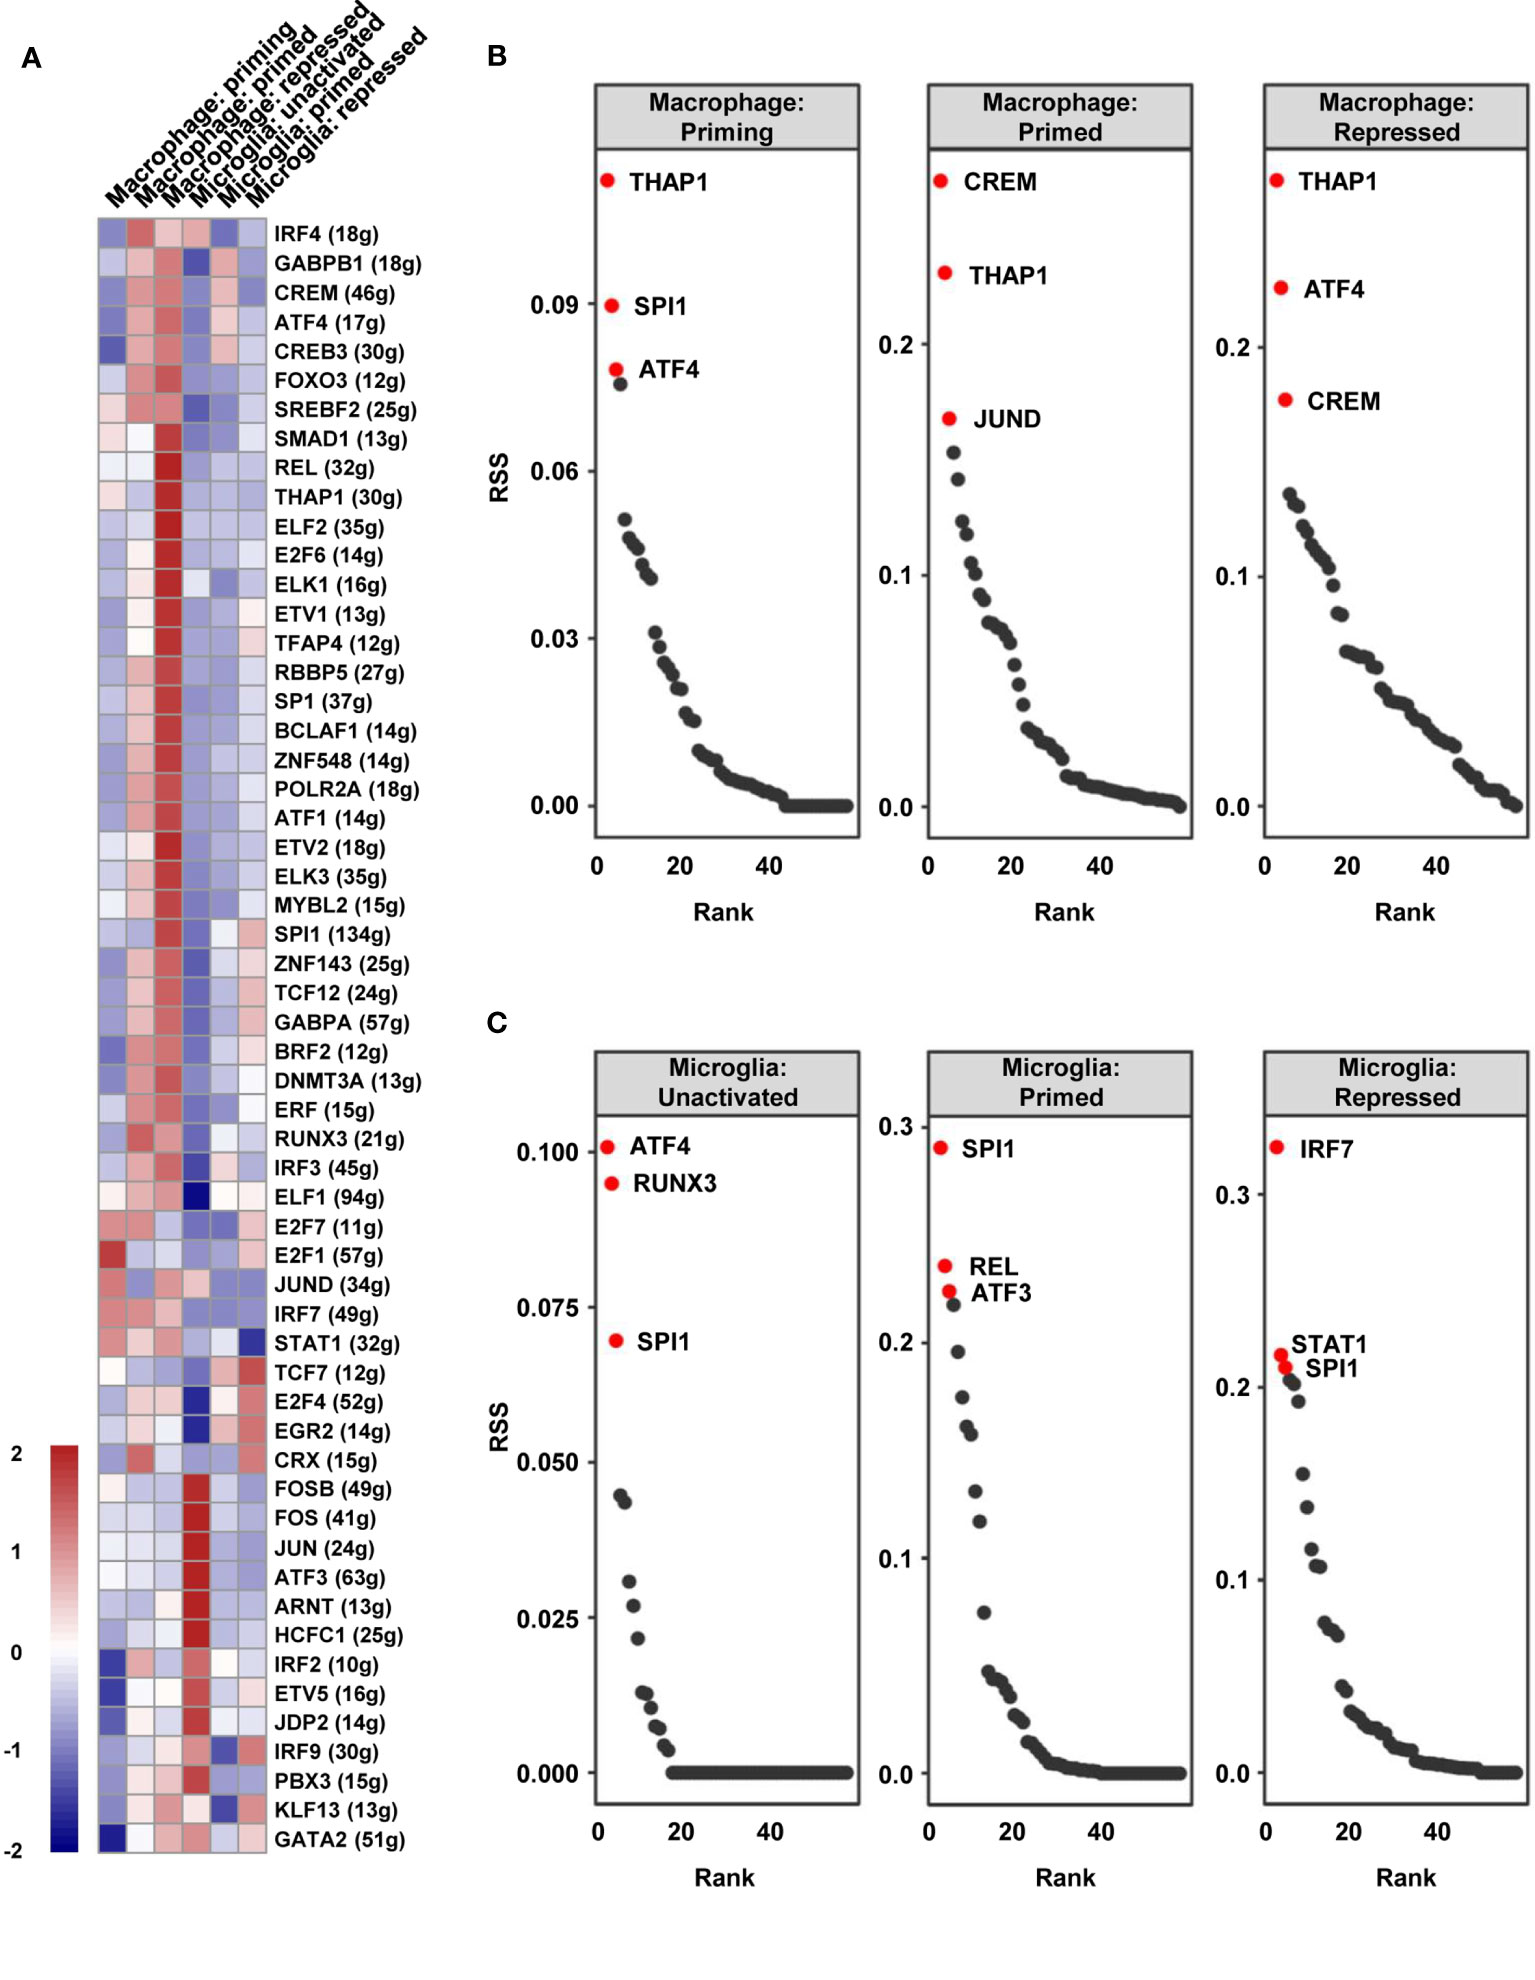
Figure 5 The vital regulons in each cell type of TAMs. (A) The RAS of every regulon in different cell types was visualized as a heat map. (B, C) The ordered regulons based on the RSS were shown as sequence diagrams.
In order to further clarify the vital role of SPI1 in GBM, the expression levels in different grades were measured by analyzing the transcriptome data in TCGA, CGGA, and Rembrandt databases. As shown in Figure 6A, grade IV (GBM) samples had the highest level of SPI1. As previously mentioned that marker genes of the TAM group included SPI1, C1QA, C1QB, C1QC, SRGN, and TYROBP (Figure 1D), we utilized Spearman’s rho value to interrogate the coexpression relationship between the expression level of SPI1 and these genes in GBM. After being analyzed in the TCGA-GBM dataset, the statistical positive correlations were observed between the SPI1 level and the genes expressed in the TAM group (C1QA: r = 0.823; C1QB: r = 0.873; C1QC: r = 0.905; SRGN: r = 0.687; TYROBP: r = 0.774) (Figure 6B), but not in the Tumor group (GAP43: r = 0.043; GPM6B: r = −0.135; SEC61G: r = −0.117; PTN: r = −0.298) (Figure S8). Meanwhile, we employed the TIMER algorithm to explore if there were potential relationships between the macrophage infiltration and the expression of these genes. We found that the elevated expression level of SPI1 had lower tumor purity and a higher infiltrating level of macrophage (Tumor purity: r = −0.528; macrophage infiltration: r = 0.687) (Figure 6C), so did TAM genes (Figure S9A). The tumor genes had no statistical correlation with tumor purity and macrophage infiltration (Figure S9B). Moreover, survival analysis using the Kaplan-Meier plotter tool displayed that the upregulated expression of SPI1 in tumor mass was linked to short overall survival (OS) and disease-free survival (DFS) time in patients with GBM (Figure 6D). Moreover, we inspected the likely downstream target genes of SPI1 in TAMs. By analyzing the glioma data in the TCGA database, the expression level of SPI1 displayed a significant positive correlation with target genes (CX3CR1: r = 0.53; CSF1R: r = 0.876; IRF8: r = 0.678) (Figure S10A). The co-expression signature was also observed in violin plots in single-cell data (Figure S10B).
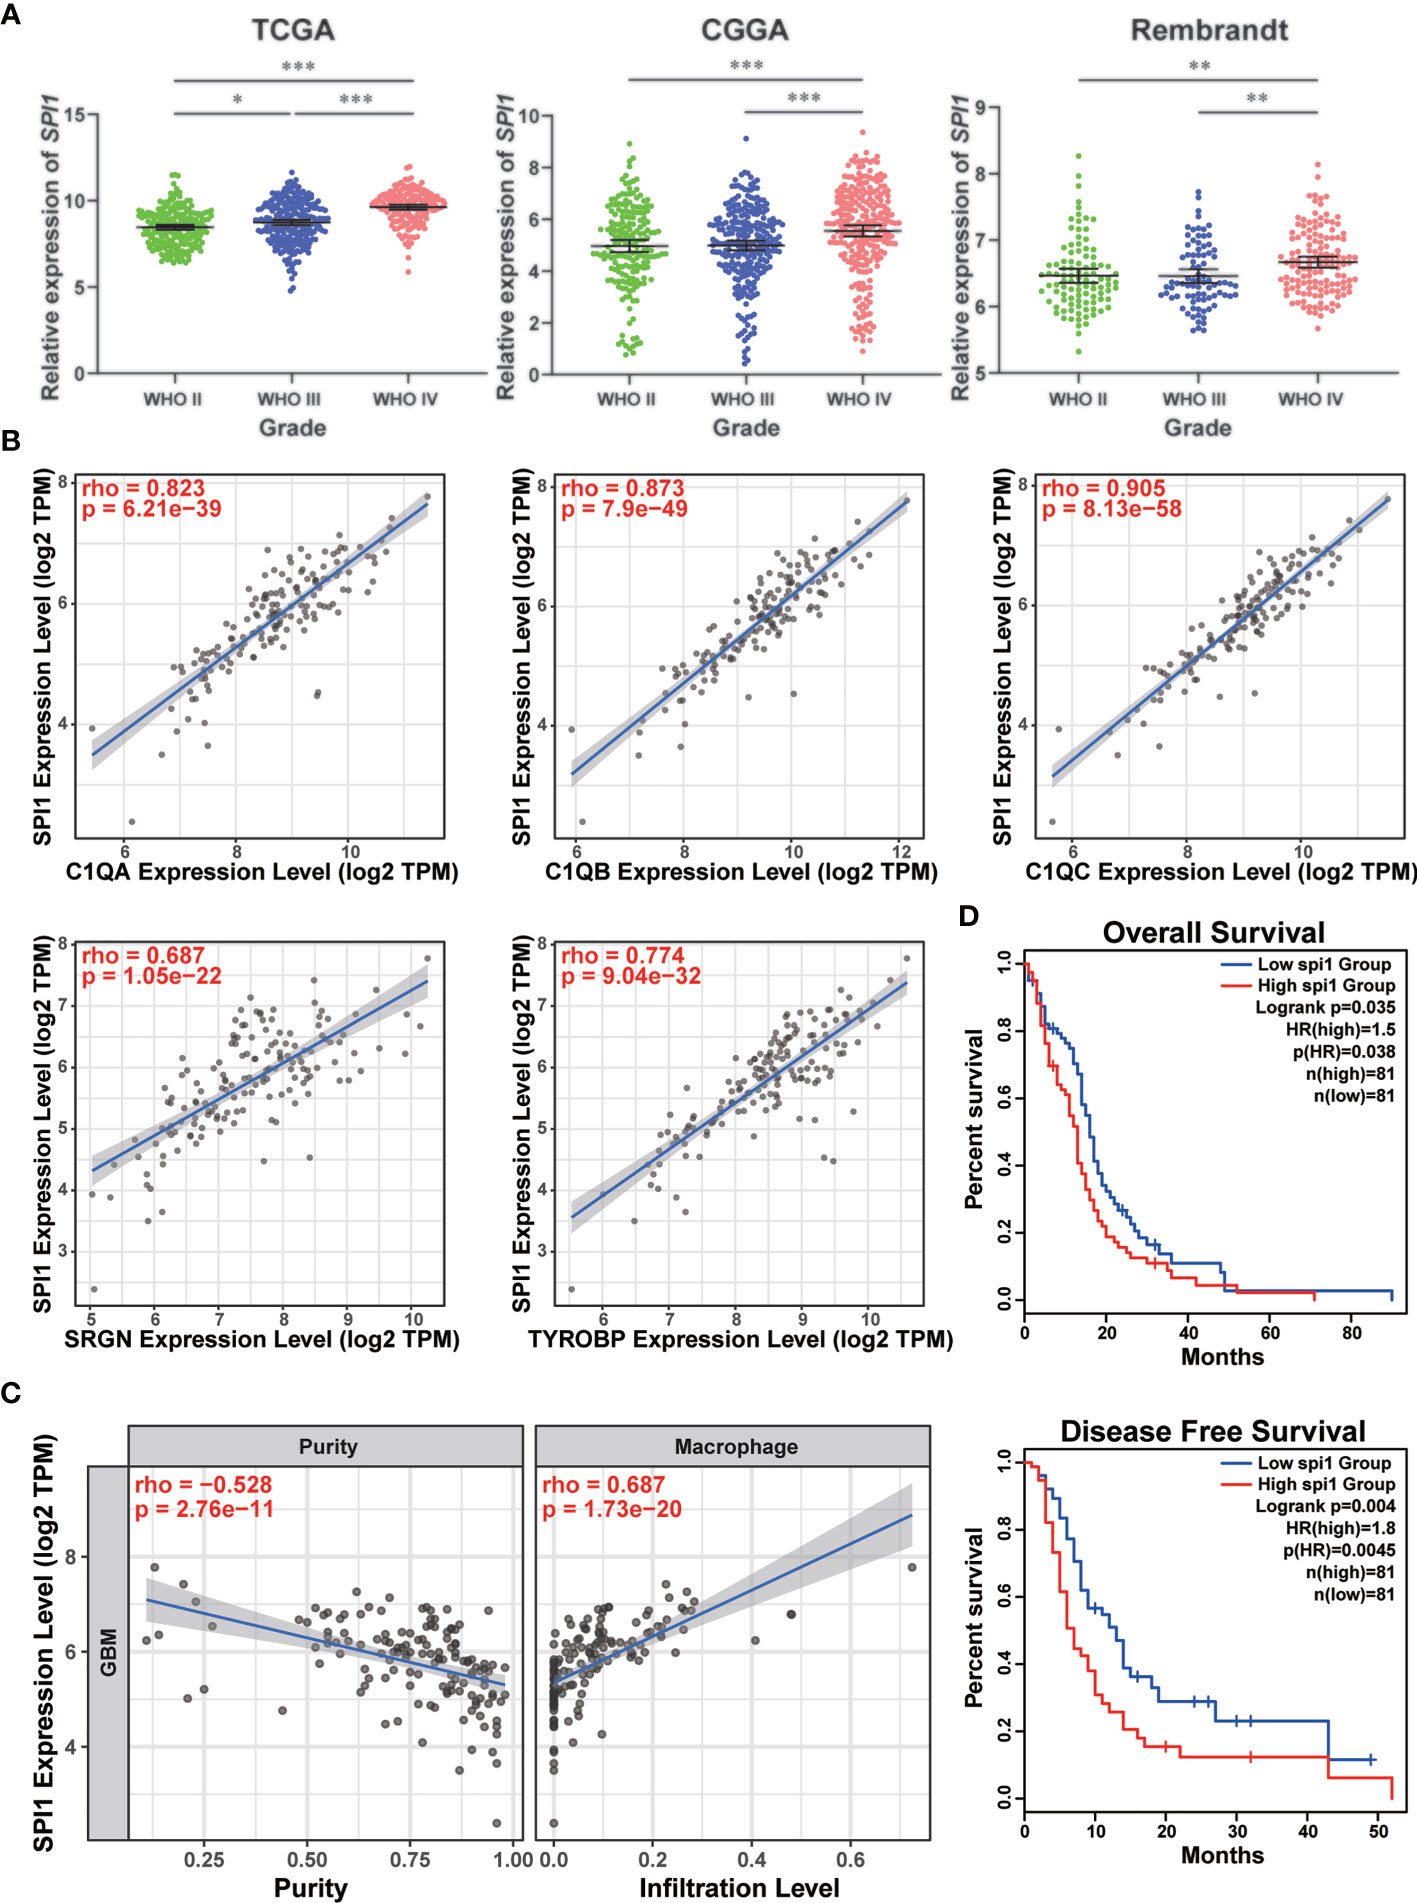
Figure 6 High expression of SPI1 correlated with upper macrophage infiltration and poor prognosis in GBM. (A) The expression levels of SPI1 in different WHO groups were calculated and visualized as scatter plots. *p < 0.05, **p < 0.01, ***p < 0.001. (B) The expression of SPI1 was positively correlated with marker genes in the TAM group. (C) The SPI1 expression was negatively correlated with tumor purity and positively correlated with macrophage infiltration. (D) The correlation between SPI1 expression and survival prognosis of GBM in TCGA. The OS and DFS maps were displayed.
The above results implied that tumor treatment targeting SPI1 could probably remodel the immune microenvironment of tumor and prolong the life span of GBM patients.
Discussion
The tumor microenvironment (TME) is composed of an extracellular matrix interspersed with various cellular components, which regulates tumor progression via crosstalk and interplay with the tumor cells (33, 34). The TME is also associated with tumor metastasis and therapeutic resistance (35–38). Therefore, clarifying the specific characteristics of the TME in various cancers is particularly important in comprehensively understanding and theoretically targeting various tumors. GBM is a malignant neoplasm of the brain with a high heterogeneity and a poor prognosis. The exclusive nature of the brain tissue involved in GBM tumorigenesis determines the unique features of the microenvironment in this cancer (39). In recent years, the immune composition of GBM has emerged as a significant factor in multiple studies, suggesting that TAM populations account for a large number of cells within the tumor mass (19). By utilizing gene expression data from TCGA and GEO databases, Engler et al. discovered an enrichment in immune response–related gene signatures (particularly of TAM genes) in the mesenchymal subtype of GBM, suggesting that TAMs have a subtype-specific role in GBM (40). Another investigation leveraged a mouse model to demonstrate that the majority of GBM-associated macrophages are bone marrow–derived myeloid cells, which infiltrate the tumor during the early stages of oncogenesis and localize to the perivascular niche (41). The use of scRNA-seq to elucidate the gene signatures of CD11b-positive cells from GBM biopsies revealed that individual cells frequently coexpressed of both pro-inflammatory M1 and immune suppressive M2 macrophage genes (42), suggesting that the distinct partitioning of the M1/M2 macrophage subtypes is inadequate to completely represent the TAM expression profiles in GBM (43). However, to our knowledge, this is the first investigation to comprehensively describe the cell composition and transcriptomic characteristics of immune cells in GBM at the single-cell level.
In the present study, we focused on the distinct origin and activation states of TAMs in different subtypes of GBM. In the TCGA-mixed tumor, TAMs were largely composed of primed (clusters 1 and 2) and repressed (cluster 0) macrophages (Figure 3B). In the classical subtype, repressed microglia occupied the main proportion of the total (Figure 3C). However, in the proneural GBM subtype, the proportions of repressed macrophages and primed microglia were similar, each comprising slightly more than 40% of the total cell population (Figure 3D). The classical and proneural subtypes shared TAM cells in the form of repressed macrophages (cluster 3) and priming macrophages (cluster 8). However, each GBM subtype also possessed unique TAMs: the primed microglia (cluster 4) were a prominent feature of the proneural subtype, whereas almost all repressed microglia (cluster 7) originated from the classical subtype. The KEGG pathway analysis also revealed differences in the main cellular biological processes of otherwise similar TAMs, such as the enrichment of “oxidative phosphorylation” pathways in cluster 0 of repressed macrophages but “protein processing in ER” in cluster 3. Unfortunately, the nine datasets analyzed for this study did not include a mesenchymal GBM subtype. However, it is worth emphasizing that GBM is notorious for its high heterogeneity and complex cell components, and different regions of the same tumor have been shown to exhibit features of the different subtypes, with distinct immune cell infiltration. The integrated analysis of the nine samples as a single large tumor mass may thus be a closer reflection of the natural status of GBM in situ. This integrated analysis has allowed us to depict the immune landscape of GBM at a single-cell level (Figure 7). It should be noted that the batch effect among these datasets still existed because the downloadable matrix is under mathematical manipulation and hard to restore. But in keeping with previous findings (19, 20), our results confirm that TAMs may occupy over one-third of the GBM tumor, with the ratio of the bone marrow–derived macrophages and the brain-resident microglia being 2:1, but infiltrating T lymphocytes comprising less than 2% of the tumor mass. Successful immunotherapy requires substantial infiltration of functional T cells within the tumors (44, 45). The limited number of T lymphocytes in GBM, which is isolated by the blood–brain barrier, means that immunotherapies targeting T cells such as monoclonal antibodies against programmed cell death 1 (PD-1) or cytotoxic T-lymphocyte-associated protein 4 (CTLA-4) are not suitable for treating GBM (46).
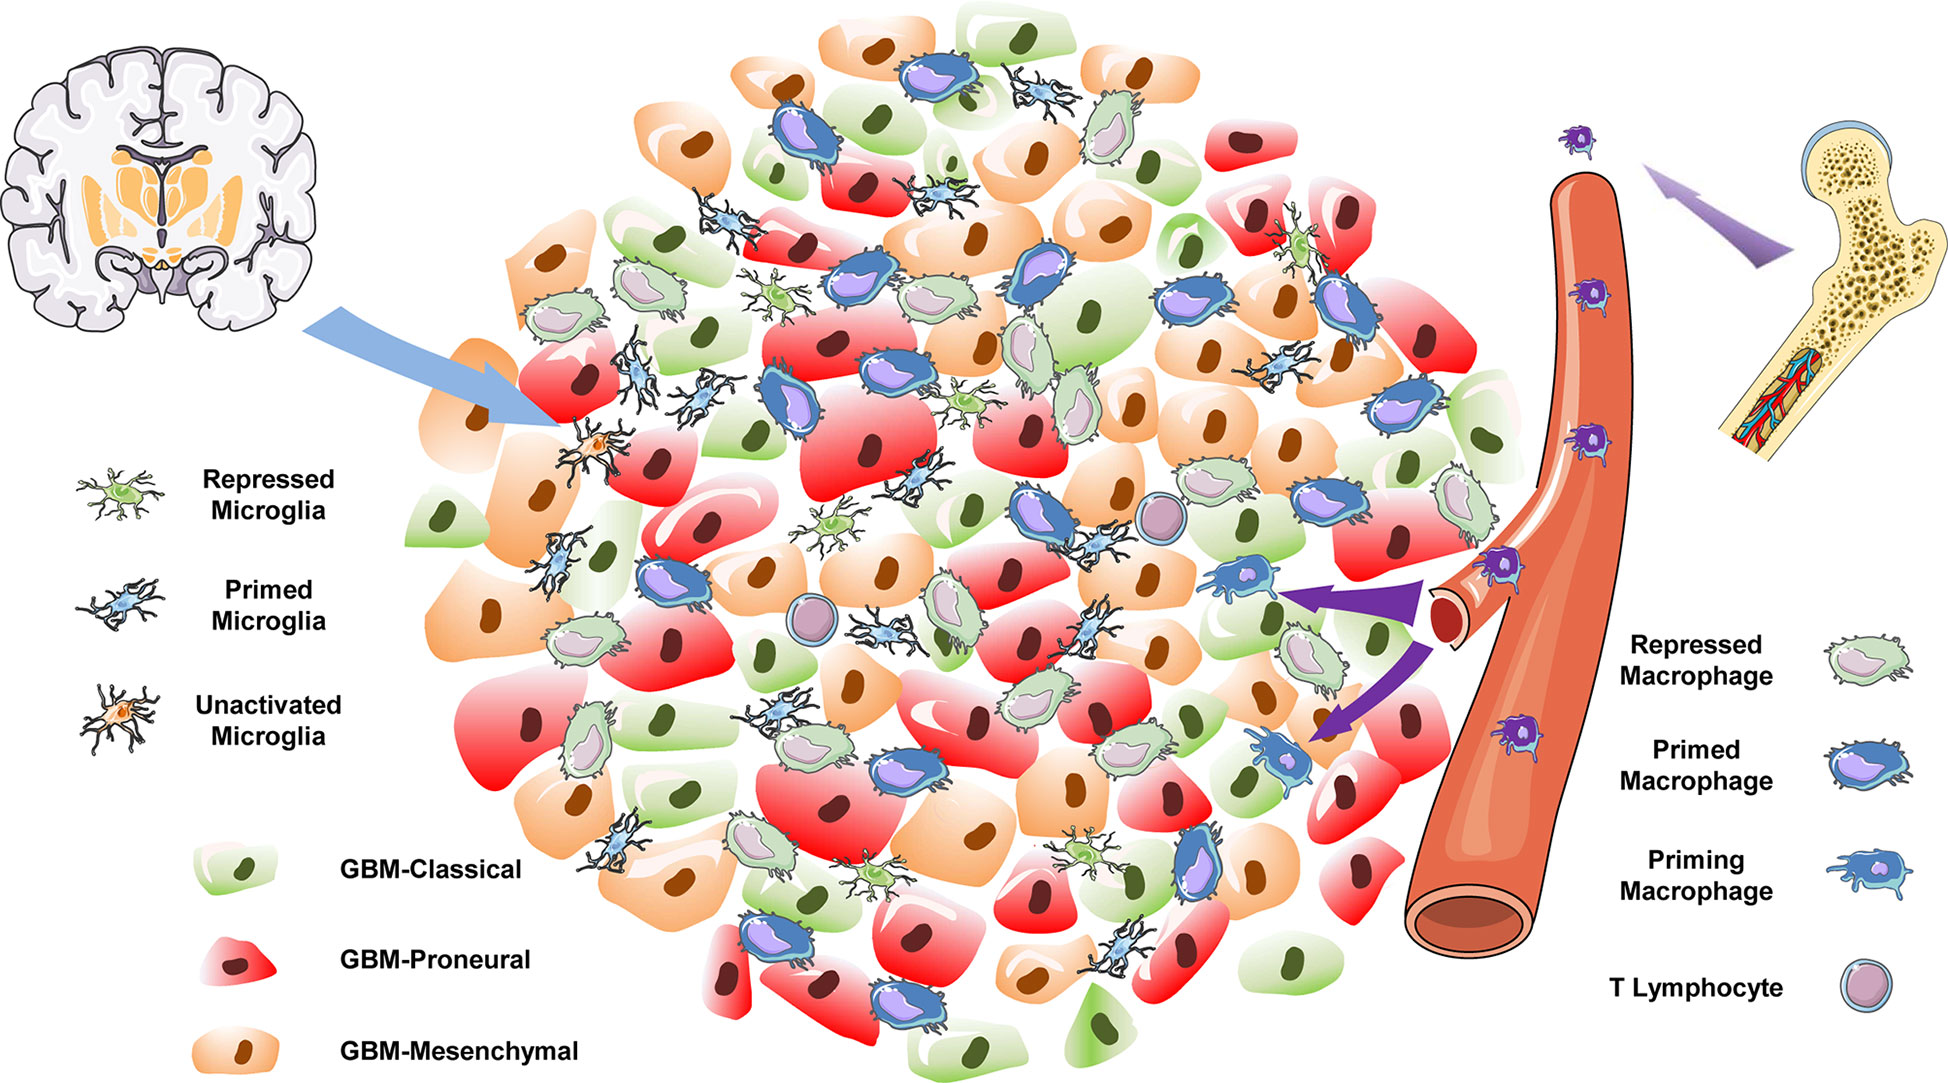
Figure 7 The immune landscape of GBM.
Given the large proportion of TAM-infiltrating GBM, the ability to convert immune-suppressed TAMs to a more proinflammatory state has become a promising immuno- therapeutic target. The colony-stimulating factor 1 receptor (CSF1R) plays essential roles in the development and function of macrophages and microglia (47). An inhibitor of the CSF1R was able to increase survival and decrease the tumor volume in a proneural GBM mouse model (48–50). In our study, we observed that SPI1 was a vital regulon in all states of TAMs (Figure 5 and Table S3). SPI1, also called PU.1, is a member of Ets family transcription factors and specifically expressed in lymphoid and myeloid cell lineages. The continuous high expression of SPI1 in hematopoietic cells results in macrophage differentiation (32). DB1976 is a furan-bisbenzimidazole-diamidine that strongly inhibits the transcription activity of SPI1 (51). We hypothesize that inhibition of SPI1 by utilizing DB1976 could reduce the TAM maturation and polarization, thus eliciting an antitumor effect.
Conclusions
In summary, our comprehensive characterization of immune cells from a total of nine GBM tissues revealed a unique immune landscape in GBM at the single-cell level and identified SPI1 as a potential immunotherapeutic target against TAMs in GBM.
Data Availability Statement
Publicly available datasets were analyzed in this study. This data can be found here: GSE131928.
Author Contributions
Study conception and design: CK and XC. Acquisition of the nine scRNA-seq datasets: XC and FT. Dimensionality reduction and unsupervised clustering: XC, QW, and YW. Deep analysis (cell types and marker genes identification, gene regulatory network, KEGG pathway, etc.): XC, QW, JZ, and CX. Interpretation of data and manuscript writing: XC and CK. Study supervision: CK and HW. Funding acquisition: CK and XC. All authors have read and agreed the published version of the manuscript.
Funding
This research was supported by Beijing Tianjin Hebei Basic Research Cooperation Project (Nos. 18JCZDJC45500 and H2018201306), Tianjin Key R&D Plan of Tianjin Science and Technology Plan Project (No. 20YFZCSY00360), National Nature Science Foundation of China (No. 82002657), China Postdoctoral Science Foundation (No. 2020M670673), and Zhao Yi-Cheng Medical Science Foundation (No. ZYYFY2019002).
Conflict of Interest
The authors declare that the research was conducted in the absence of any commercial or financial relationships that could be construed as a potential conflict of interest.
Publisher’s Note
All claims expressed in this article are solely those of the authors and do not necessarily represent those of their affiliated organizations, or those of the publisher, the editors and the reviewers. Any product that may be evaluated in this article, or claim that may be made by its manufacturer, is not guaranteed or endorsed by the publisher.
Acknowledgments
The authors thank Shanghai OE Biotech Co., Ltd for technical support in scRNA-seq data analysis process.
Supplementary Material
The Supplementary Material for this article can be found online at: https://www.frontiersin.org/articles/10.3389/fonc.2021.710695/full#supplementary-material
Supplementary Table 1 | All differential expression genes for clusters.
Supplementary Table 2 | All differential expression genes for macrophage clusters.
Supplementary Table 3 | RSS of regulons in each cell type.
Supplementary Figure 1 | Related to Figure 1. (A) The 22 clusters are identified and visualized as a t-SNE map. (B) The distribution of nine samples was displayed as a t-SNE map. (C) The expressions of CD3G, GZMH, IL2RB, PRF1, and ICOS distinguish T lymphocytes from the rest of the cell mass. (D) Two distinct aggregations are evident in the PCA plot.
Supplementary Figure 2 | Related to Figure 1. (A–I) The cell types in each sample were identified and visualized as t-SNE plots. (J) The relative ratios of each cell type are displayed.
Supplementary Figure 3 | Related to Figure 2. (A) A t-SNE plot showing the cell clusters. (B–C) The distribution of CD68 is visualized by a t-SNE plot and a violin plot. (D) Several genes (CYFIP1, ENTPD1, and VAV1) have similar expression signatures in comparison to TMEM119, indicating that these genes might be the marker genes of brain resident microglia. (E) The expression of MHC-II, in the form of HLA-DQA2 and HLA-DQB2, is restricted to cluster 1, 2, 4, 5, 6, 8, and 9. (F) The expression levels of TMEM119 and MHC-II divide these clusters into 4 main subtypes: TMEM119+-MHC-II+ cells, TMEM119+-MHC-II- cells, TMEM119--MHC-II+ cells, and TMEM119--MHC-II- cells.
Supplementary Figure 4 | Related to Figure 2. (A–B) Different marker genes in microglia and macrophages. (C) The category schemes defining the cell types of TAM in GBM by the expression signatures of TMEM119 and MHC-II.
Supplementary Figure 5 | Related to Figure 3. (A–F) The cell distributions of MGH102, MGH114, MGH118, MGH 125, MGH126 and MGH143 are displayed in t-SNE plots.
Supplementary Figure 6 | Related to Figure 5. (A) Heat map display the relevancies among the regulons.
Supplementary Figure 7 | Related to Figure 5. (A–I) t-SNE map showed the AUCell scores of crucial regulons (THAP1, ATF4, CREM, SPI1, JUND, REL, RUNX3, IRF7, STAT1).
Supplementary Figure 8 | Related to Figure 6. The correlation between SPI1 expression and genes in tumor group.
Supplementary Figure 9 | Related to Figure 6. (A) The expressions of TAM genes were negatively correlated with tumor purity and positively correlated with macrophage infiltration. (B) The expressions of tumor genes had no correlation with tumor purity and macrophage infiltration.
Supplementary Figure 10 | Related to Figure 6. (A) The correlation between SPI1 expression and downstream target genes. (B) The distribution of SPI1 and downstream target genes are visualized by violin plots.
References
1. Alexander BM, Cloughesy TF. Adult Glioblastoma. J Clin Oncol (2017) 35:2402–9. doi: 10.1200/JCO.2017.73.0119
2. Wesseling P, Capper D. Who 2016 Classification of Gliomas. Neuropathol Appl Neurobiol (2018) 44:139–50. doi: 10.1111/nan.12432
3. Verhaak RG, Hoadley KA, Purdom E, Wang V, Qi Y, Wilkerson MD, et al. Integrated Genomic Analysis Identifies Clinically Relevant Subtypes of Glioblastoma Characterized by Abnormalities in Pdgfra, Idh1, EGFR, and Nf1. Cancer Cell (2010) 17:98–110. doi: 10.1016/j.ccr.2009.12.020
4. Neftel C, Laffy J, Filbin MG, Hara T, Shore ME, Rahme GJ, et al. An Integrative Model of Cellular States, Plasticity, and Genetics for Glioblastoma. Cell (2019) 178:835–49.e21. doi: 10.1016/j.cell.2019.06.024
5. Yuan J, Levitin HM, Frattini V, Bush EC, Boyett DM, Samanamud J, et al. Single-Cell Transcriptome Analysis of Lineage Diversity in High-Grade Glioma. Genome Med (2018) 10:57. doi: 10.1186/s13073-018-0567-9
6. Brennan CW, Verhaak RG, McKenna A, Campos B, Noushmehr H, Salama SR, et al. The Somatic Genomic Landscape of Glioblastoma. Cell (2013) 155:462–77. doi: 10.1016/j.cell.2013.09.034
7. Sottoriva A, Spiteri I, Piccirillo SG, Touloumis A, Collins VP, Marioni JC, et al. Intratumor Heterogeneity in Human Glioblastoma Reflects Cancer Evolutionary Dynamics. Proc Natl Acad Sci USA (2013) 110:4009–14. doi: 10.1073/pnas.1219747110
8. Patel AP, Tirosh I, Trombetta JJ, Shalek AK, Gillespie SM, Wakimoto H, et al. Single-Cell RNA-Seq Highlights Intratumoral Heterogeneity in Primary Glioblastoma. Science (2014) 344:1396–401. doi: 10.1126/science.1254257
9. Qazi MA, Vora P, Venugopal C, Sidhu SS, Moffat J, Swanton C, et al. Intratumoral Heterogeneity: Pathways to Treatment Resistance and Relapse in Human Glioblastoma. Ann Oncol (2017) 28:1448–56. doi: 10.1093/annonc/mdx169
10. Chen S, Le T, Harley BAC, Imoukhuede PI. Characterizing Glioblastoma Heterogeneity Via Single-Cell Receptor Quantification. Front Bioeng Biotechnol (2018) 6:92. doi: 10.3389/fbioe.2018.00092
11. Ostrom QT, Gittleman H, Xu J, Kromer C, Wolinsky Y, Kruchko C, et al. Cbtrus Statistical Report: Primary Brain and Other Central Nervous System Tumors Diagnosed in the United States in 2009-2013. Neuro Oncol (2016) 18:v1–v75. doi: 10.1093/neuonc/now207
12. Aldape K, Zadeh G, Mansouri S, Reifenberger G, von Deimling A. Glioblastoma: Pathology, Molecular Mechanisms and Markers. Acta Neuropathol (2015) 129:829–48. doi: 10.1007/s00401-015-1432-1
13. Okazaki T, Chikuma S, Iwai Y, Fagarasan S, Honjo T. A Rheostat for Immune Responses: The Unique Properties of Pd-1 and Their Advantages for Clinical Application. Nat Immunol (2013) 14:1212–8. doi: 10.1038/ni.2762
14. Alsaab HO, Sau S, Alzhrani R, Tatiparti K, Bhise K, Kashaw SK, et al. Pd-1 and Pd-L1 Checkpoint Signaling Inhibition for Cancer Immunotherapy: Mechanism, Combinations, and Clinical Outcome. Front Pharmacol (2017) 8:561. doi: 10.3389/fphar.2017.00561
15. Litak J, Mazurek M, Grochowski C, Kamieniak P, Rolinski J. Pd-L1/Pd-1 Axis in Glioblastoma Multiforme. Int J Mol Sci (2019) 20(21):5347. doi: 10.3390/ijms20215347
16. Adhikaree J, Moreno-Vicente J, Kaur AP, Jackson AM, Patel PM. Resistance Mechanisms and Barriers to Successful Immunotherapy for Treating Glioblastoma. Cells (2020) 9(2):263. doi: 10.3390/cells9020263
17. Wu T, Dai Y. Tumor Microenvironment and Therapeutic Response. Cancer Lett (2017) 387:61–8. doi: 10.1016/j.canlet.2016.01.043
18. Nakamura K, Smyth MJ. Myeloid Immunosuppression and Immune Checkpoints in the Tumor Microenvironment. Cell Mol Immunol (2020) 17:1–12. doi: 10.1038/s41423-019-0306-1
19. Charles NA, Holland EC, Gilbertson R, Glass R, Kettenmann H. The Brain Tumor Microenvironment. Glia (2012) 60:502–14. doi: 10.1002/glia.21264
20. Han S, Ma E, Wang X, Yu C, Dong T, Zhan W, et al. Rescuing Defective Tumor-Infiltrating T-Cell Proliferation in Glioblastoma Patients. Oncol Lett (2016) 12:2924–9. doi: 10.3892/ol.2016.4944
21. Ginhoux F, Prinz M. Origin of Microglia: Current Concepts and Past Controversies. Cold Spring Harb Perspect Biol (2015) 7:a020537. doi: 10.1101/cshperspect.a020537
22. Hambardzumyan D, Gutmann DH, Kettenmann H. The Role of Microglia and Macrophages in Glioma Maintenance and Progression. Nat Neurosci (2016) 19:20–7. doi: 10.1038/nn.4185
23. Tirosh I, Suva ML. Dissecting Human Gliomas by Single-Cell RNA Sequencing. Neuro Oncol (2018) 20:37–43. doi: 10.1093/neuonc/nox126
24. Zhang X, Lan Y, Xu J, Quan F, Zhao E, Deng C, et al. CellMarker: A Manually Curated Resource of Cell Markers in Human and Mouse. Nucleic Acids Res (2019) 47:D721–8. doi: 10.1093/nar/gky900
25. Aibar S, Gonzalez-Blas CB, Moerman T, Huynh-Thu VA, Imrichova H, Hulselmans G, et al. Scenic: Single-Cell Regulatory Network Inference and Clustering. Nat Methods (2017) 14:1083–6. doi: 10.1038/nmeth.4463
26. Zhao Z, Zhang KN, Wang Q, Li G, Zeng F, Zhang Y, et al. Chinese Glioma Genome Atlas (CGGA): A Comprehensive Resource With Functional Genomic Data From Chinese Gliomas. Genomics Proteomics Bioinf (2021) S1672-0229(21):00045–0. doi: 10.1016/j.gpb.2020.10.005
27. Li T, Fu J, Zeng Z, Cohen D, Li J, Chen Q, et al. Timer2.0 for Analysis of Tumor-Infiltrating Immune Cells. Nucleic Acids Res (2020) 48:W509–14. doi: 10.1093/nar/gkaa407
28. Cui X, Zhang X, Liu M, Zhao C, Zhang N, Ren Y, et al. A Pan-Cancer Analysis of the Oncogenic Role of Staphylococcal Nuclease Domain-Containing Protein 1 (snd1) in Human Tumors. Genomics (2020) 112:3958–67. doi: 10.1016/j.ygeno.2020.06.044
29. Satoh J, Kino Y, Asahina N, Takitani M, Miyoshi J, Ishida T, et al. Tmem119 Marks a Subset of Microglia in the Human Brain. Neuropathology (2016) 36:39–49. doi: 10.1111/neup.12235
30. Witcher KG, Eiferman DS, Godbout JP. Priming the Inflammatory Pump of the Cns After Traumatic Brain Injury. Trends Neurosci (2015) 38:609–20. doi: 10.1016/j.tins.2015.08.002
31. Zhang P, Zhang X, Iwama A, Yu C, Smith KA, Mueller BU, et al. Pu.1 Inhibits Gata-1 Function and Erythroid Differentiation by Blocking Gata-1 DNA Binding. Blood (2000) 96:2641–8. doi: 10.1182/blood.V96.8.2641.h8002641_2641_2648
32. McIvor Z, Hein S, Fiegler H, Schroeder T, Stocking C, Just U, et al. Transient Expression of Pu.1 Commits Multipotent Progenitors to a Myeloid Fate Whereas Continued Expression Favors Macrophage Over Granulocyte Differentiation. Exp Hematol (2003) 31:39–47. doi: 10.1016/S0301-472X(02)01017-2
33. Hanahan D, Coussens LM. Accessories to the Crime: Functions of Cells Recruited to the Tumor Microenvironment. Cancer Cell (2012) 21:309–22. doi: 10.1016/j.ccr.2012.02.022
34. Qian BZ, Pollard JW. Macrophage Diversity Enhances Tumor Progression and Metastasis. Cell (2010) 141:39–51. doi: 10.1016/j.cell.2010.03.014
35. Gao D, Joshi N, Choi H, Ryu S, Hahn M, Catena R, et al. Myeloid Progenitor Cells in the Premetastatic Lung Promote Metastases by Inducing Mesenchymal to Epithelial Transition. Cancer Res (2012) 72:1384–94. doi: 10.1158/0008-5472.CAN-11-2905
36. Bonde AK, Tischler V, Kumar S, Soltermann A, Schwendener RA. Intratumoral Macrophages Contribute to Epithelial-Mesenchymal Transition in Solid Tumors. BMC Cancer (2012) 12:35. doi: 10.1186/1471-2407-12-35
37. Barcellos-Hoff MH, Lyden D, Wang TC. The Evolution of the Cancer Niche During Multistage Carcinogenesis. Nat Rev Cancer (2013) 13:511–8. doi: 10.1038/nrc3536
38. Meads MB, Gatenby RA, Dalton WS. Environment-Mediated Drug Resistance: A Major Contributor to Minimal Residual Disease. Nat Rev Cancer (2009) 9:665–74. doi: 10.1038/nrc2714
39. Belousov A, Titov S, Shved N, Garbuz M, Malykin G, Gulaia V, et al. The Extracellular Matrix and Biocompatible Materials in Glioblastoma Treatment. Front Bioeng Biotechnol (2019) 7:341. doi: 10.3389/fbioe.2019.00341
40. Engler JR, Robinson AE, Smirnov I, Hodgson JG, Berger MS, Gupta N, et al. Increased Microglia/Macrophage Gene Expression in a Subset of Adult and Pediatric Astrocytomas. PloS One (2012) 7:e43339. doi: 10.1371/journal.pone.0043339
41. Chen Z, Feng X, Herting CJ, Garcia VA, Nie K, Pong WW, et al. Cellular and Molecular Identity of Tumor-Associated Macrophages in Glioblastoma. Cancer Res (2017) 77:2266–78. doi: 10.1158/0008-5472.CAN-16-2310
42. Muller S, Kohanbash G, Liu SJ, Alvarado B, Carrera D, Bhaduri A, et al. Single-Cell Profiling of Human Gliomas Reveals Macrophage Ontogeny as a Basis for Regional Differences in Macrophage Activation in the Tumor Microenvironment. Genome Biol (2017) 18:234. doi: 10.1186/s13059-017-1362-4
43. Ransohoff RM. A Polarizing Question: Do M1 and M2 Microglia Exist? Nat Neurosci (2016) 19:987–91. doi: 10.1038/nn.4338
44. Iwai Y, Hamanishi J, Chamoto K, Honjo T. Cancer Immunotherapies Targeting the PD-1 Signaling Pathway. J BioMed Sci (2017) 24:26. doi: 10.1186/s12929-017-0329-9
45. Fritz JM, Lenardo MJ. Development of Immune Checkpoint Therapy for Cancer. J Exp Med (2019) 216:1244–54. doi: 10.1084/jem.20182395
46. Tomaszewski W, Sanchez-Perez L, Gajewski TF, Sampson JH. Brain Tumor Microenvironment and Host State: Implications for Immunotherapy. Clin Cancer Res (2019) 25:4202–10. doi: 10.1158/1078-0432.CCR-18-1627
47. Stanley ER, Chitu V. Csf-1 Receptor Signaling in Myeloid Cells. Cold Spring Harb Perspect Biol (2014) 6(6):a021857. doi: 10.1101/cshperspect.a021857
48. Coniglio SJ, Eugenin E, Dobrenis K, Stanley ER, West BL, Symons MH, et al. Microglial Stimulation of Glioblastoma Invasion Involves Epidermal Growth Factor Receptor (EGFR) and Colony Stimulating Factor 1 Receptor (csf-1r) Signaling. Mol Med (2012) 18:519–27. doi: 10.2119/molmed.2011.00217
49. Elmore MR, Najafi AR, Koike MA, Dagher NN, Spangenberg EE, Rice RA, et al. Colony-Stimulating Factor 1 Receptor Signaling Is Necessary for Microglia Viability, Unmasking a Microglia Progenitor Cell in the Adult Brain. Neuron (2014) 82:380–97. doi: 10.1016/j.neuron.2014.02.040
50. Pyonteck SM, Akkari L, Schuhmacher AJ, Bowman RL, Sevenich L, Quail DF, et al. Csf-1r Inhibition Alters Macrophage Polarization and Blocks Glioma Progression. Nat Med (2013) 19:1264–72. doi: 10.1038/nm.3337
Keywords: immune landscape, glioblastoma, single-cell RNA sequencing, macrophage polarization, SPI1
Citation: Cui X, Wang Q, Zhou J, Wang Y, Xu C, Tong F, Wang H and Kang C (2021) Single-Cell Transcriptomics of Glioblastoma Reveals a Unique Tumor Microenvironment and Potential Immunotherapeutic Target Against Tumor-Associated Macrophage. Front. Oncol. 11:710695. doi: 10.3389/fonc.2021.710695
Received: 17 May 2021; Accepted: 09 July 2021;
Published: 09 August 2021.
Edited by:
Aleksi Sedo, Charles University, CzechiaReviewed by:
Zuzana Saidak, University Hospital Center (CHU) of Amiens, FranceJason M. Miska, Northwestern University, United States
Copyright © 2021 Cui, Wang, Zhou, Wang, Xu, Tong, Wang and Kang. This is an open-access article distributed under the terms of the Creative Commons Attribution License (CC BY). The use, distribution or reproduction in other forums is permitted, provided the original author(s) and the copyright owner(s) are credited and that the original publication in this journal is cited, in accordance with accepted academic practice. No use, distribution or reproduction is permitted which does not comply with these terms.
*Correspondence: Chunsheng Kang, a2FuZzk3MDYxQHRtdS5lZHUuY24=; Hongjun Wang, d2FuZ2hvbmdqdW44MDAwQHNpbmEuY29t